Relative abundance, size and age structure, and stock status of blue cod in Foveaux Strait in 2018 - New Zealand Fisheries Assessment Report 2019/13
←
→
Page content transcription
If your browser does not render page correctly, please read the page content below
Relative abundance, size and age
structure, and stock status of blue
cod in Foveaux Strait in 2018
New Zealand Fisheries Assessment Report 2019/13

M.P. Beentjes
A. Miller
D. Kater

ISSN 1179-5352 (online)
ISBN 978-1-98-859447-7 (online)

April 2019
Requests for further copies should be directed to:

Publications Logistics Officer
Ministry for Primary Industries
PO Box 2526
WELLINGTON 6140

Email: brand@mpi.govt.nz
Telephone: 0800 00 83 33
Facsimile: 04-894 0300

This publication is also available on the Ministry for Primary Industries websites at:
http://www.mpi.govt.nz/news-and-resources/publications

http://fs.fish.govt.nz go to Document library/Research reports

© Crown Copyright – Fisheries New Zealand
Contents
1.     INTRODUCTION ........................................................................................................................... 3
     1.1      Foveaux Strait blue cod fishery ............................................................................................... 3
     1.2      Foveaux Strait bathymetry and substrate ................................................................................ 3
     1.3      South Island blue cod potting surveys ..................................................................................... 4
     1.4      Potting survey design .............................................................................................................. 4
     1.5      Objectives ................................................................................................................................ 4
2.     METHODS...................................................................................................................................... 5
     2.1      2018 survey timing and area.................................................................................................... 5
     2.2      2018 survey design .................................................................................................................. 5
       2.2.1         Allocation of sites ............................................................................................................ 5
       2.2.2         Vessels and gear .............................................................................................................. 6
       2.2.3         Sampling methods ........................................................................................................... 6
       2.2.4         Data storage ..................................................................................................................... 7
       2.2.5         Age estimates .................................................................................................................. 7
       2.2.6         Data analyses ................................................................................................................... 7
     2.3      Analyses of 2010 and 2014 Foveaux Strait surveys .............................................................. 10
3.     RESULTS...................................................................................................................................... 11
     3.1      2018 random-site survey ....................................................................................................... 11
       3.1.1         Catch and catch rates ..................................................................................................... 11
       3.1.2         Biological and length frequency data ............................................................................ 11
       3.1.3         Age and growth ............................................................................................................. 11
       3.1.4         Spawning activity .......................................................................................................... 12
       3.1.5         Population length and age composition ......................................................................... 12
       3.1.6         Total mortality estimates (Z) and spawner-per-recruit (SPR) ....................................... 12
     3.2      Foveaux Strait random-site survey time series (2010, 2014, 2018) ...................................... 13
4.     DISCUSSION ............................................................................................................................... 13
     4.1      General .................................................................................................................................. 13
     4.2      Blue cod habitat and abundance ............................................................................................ 14
     4.3      Survey precision .................................................................................................................... 14
     4.4      Cohort progression and genetic mixing ................................................................................. 14
     4.5      Sex change and sex ratio ....................................................................................................... 15
     4.6      Reproductive condition ......................................................................................................... 16
     4.7      Stock status and management implications ........................................................................... 16
5.     ACKNOWLEDGEMENTS .......................................................................................................... 17
6.     REFERENCES .............................................................................................................................. 17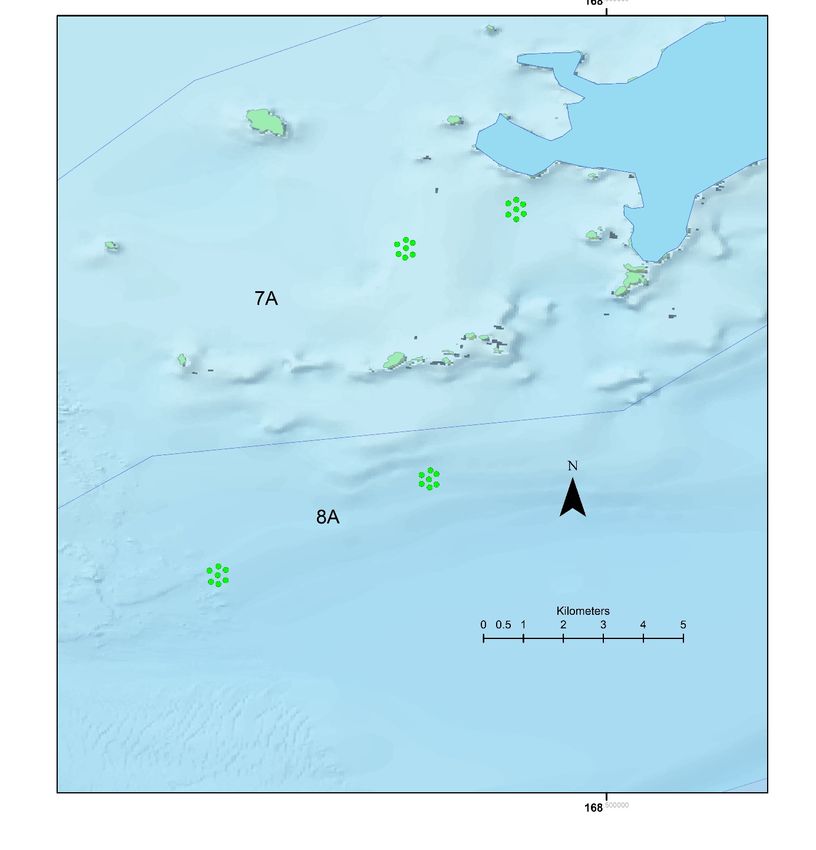
7.   TABLES AND FIGURES............................................................................................................. 21
8.   APPENDICES ............................................................................................................................... 50
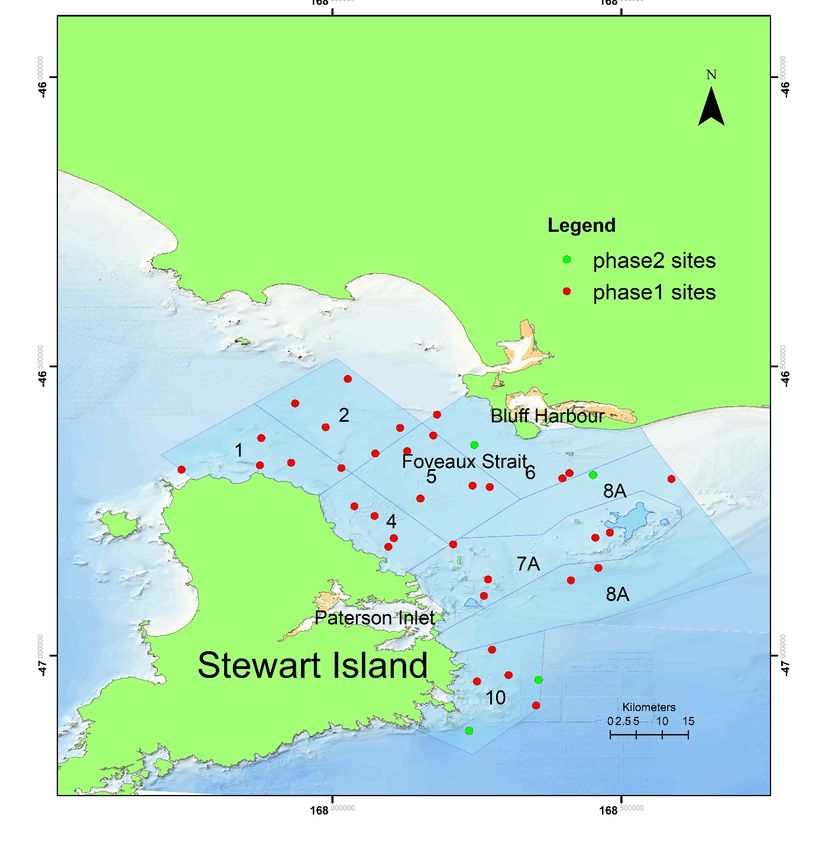
EXECUTIVE SUMMARY Beentjes, M.P.; Miller, A.; Kater, D. (2019). Relative abundance, size and age structure, and stock status of blue cod in Foveaux Strait in 2018. New Zealand Fisheries Assessment Report 2019/13 52 p. 2018 random site survey This report describes the results of the random-site blue cod (Parapercis colias) potting survey carried out in Foveaux Strait in February 2018. Estimates are provided for population abundance, size and age structure, sex ratio, total mortality (Z), and spawner biomass-per-recruit ratio. This is the third survey in the Foveaux Strait random-site survey time series, following those in 2010 and 2014. Thirty-eight random sites (6 pots per site, producing 228 pot lifts) at depths of 14–95 m from eight strata in Foveaux Strait were surveyed in February 2018. Mean catch rates of blue cod (all sizes) by stratum were 4.01–8.41 kg.pot-1 with the lowest catch in stratum 5 (middle of strait) and highest in stratum 10 (most southern stratum contiguous with Stewart Island). The survey blue cod mean catch rate was 5.66 kg.pot-1 with a CV of 20%. Catch rates for recruited blue cod (33 cm and over) followed a similar pattern among strata as for all blue cod and overall was 2.45 kg.pot-1 (CV 18%). Of the 228 random-site pots, 63 (28%) had zero catch of blue cod. The sex ratios were 34–63% male across the eight strata and the overall weighted sex ratio was 51% male. The overall weighted mean length for males was 30.6 cm (range 12–51 cm) and 28.4 cm for females (range 10–42 cm). The scaled length frequency distributions were unimodal and broadly similar among the eight strata for both males and females. Otolith thin section ages from 199 males and 159 females were used to estimate the population age structure in 2018. The initial counts from each of the two otolith readers achieved 88% agreement, there was minimal bias between readers, and CV and average percent error were 1.1% and 0.8%, respectively. Von Bertalanffy growth parameters (L, K, t0) in 2018 were 60.8 cm, 0.11 yr-1, -1.14 yr for males; and 40.2 cm, 0.17 yr-1, and -0.94 yr for females. Sexed based age-length-keys (one each for males and females) were used to estimate the population age composition. Age in 2018 ranged from 1–14 years for males and 1–17 years for females, but most blue cod were 4–8 years old. The estimated population age distributions indicate almost knife-edge selectivity to the potting method at three years with no indications of strong or weak modes for either males or females. Mean age was 5.7 years for males and 6.8 years for females. Von Bertalanffy growth parameters (L, K, t0) used in the spawner-per-recruit analyses were based on the combined length and age data from the 2010, 2014 and 2018 surveys and were 55.7 cm, 0.14 yr-1, - 0.82 yr for males (n = 495); and 39.9 cm, 0.20 yr-1, and -0.52 yr for females (n = 429). The traditional catch curve appeared to follow the ideal straight-line descending limb, suggesting that the assumption of constant recruitment has not been violated, and gives confidence in the CR Z estimates which tend to be less sensitive to age classes with few fish. The steepness of the descending curve, and high Z value, is a direct result of the lack of recruited older age classes. Total mortality (Z) for age-at-full recruitment of eight years was estimated at 0.70 (95% confidence interval 0.47–0.98). Based on the default M of 0.14, estimated fishing mortality (F) was 0.56 and the associated spawner biomass-per-recruit ratio was 22% (95% confidence interval 18–29%). There were few indications of spawning activity during the survey period with no fish in the running ripe condition and a small percentage in the mature condition, suggesting that the survey took place either before or after the spawning peak. Survey time series The pattern of catch rates among the eight strata were most similar in 2010 and 2014 when the highest catch rates were from strata 1 and 2 and the lowest by far were from stratum 8A. The 2018 catch rates were relatively similar across all strata, and the large confidence intervals indicate that these are not significantly different. There was no trend in abundance across the three surveys. Fisheries New Zealand Foveaux Strait blue cod survey 2018 1
The scaled length frequency distributions and mean length of all blue cod and recruited blue cod were remarkably similar for all three surveys with no trends. The sex ratio for all surveys was 47–51% male for all blue cod, and 68–76% male for recruited blue cod, with no clear trends among surveys. The male age structure is similar among the three surveys except for a weak 5-year-old age class in 2014. Female age structure is also generally similar, except for weak 5-year-old and 8-year-old age classes in 2010. The weak 5-year-old age class appears to have progressed through to 2014 as a weak 9- year-old age class. The Chapman Robson total mortality estimates (Z) increased from 0.52 in both 2010 and 2014, to 0.70 in 2018 with a corresponding decrease in the spawner-per-recruit (SPR) estimates from about 27% to 22%. The slopes of the right-hand limbs of the catch curves can vary considerably depending on the number of recruited age classes which numbered just five for males in 2014 and four in 2018. With so few age classes, the slope can be strongly affected by one older age class and a cautious approach should be taken when interpreting Z and SPR estimates. The proportion of pots with zero catch for the three random-site surveys ranged from 25–32% with no clear trends. 2 Foveaux Strait blue cod survey 2018 Fisheries New Zealand
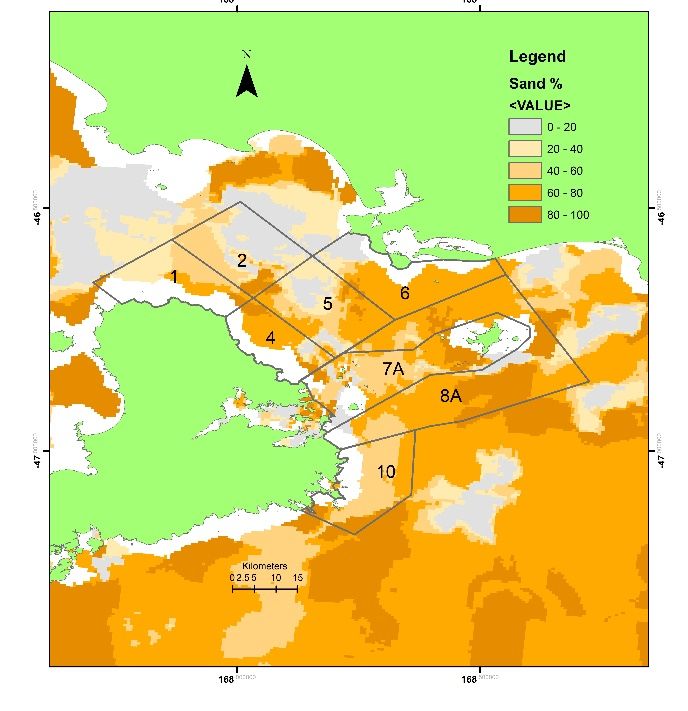
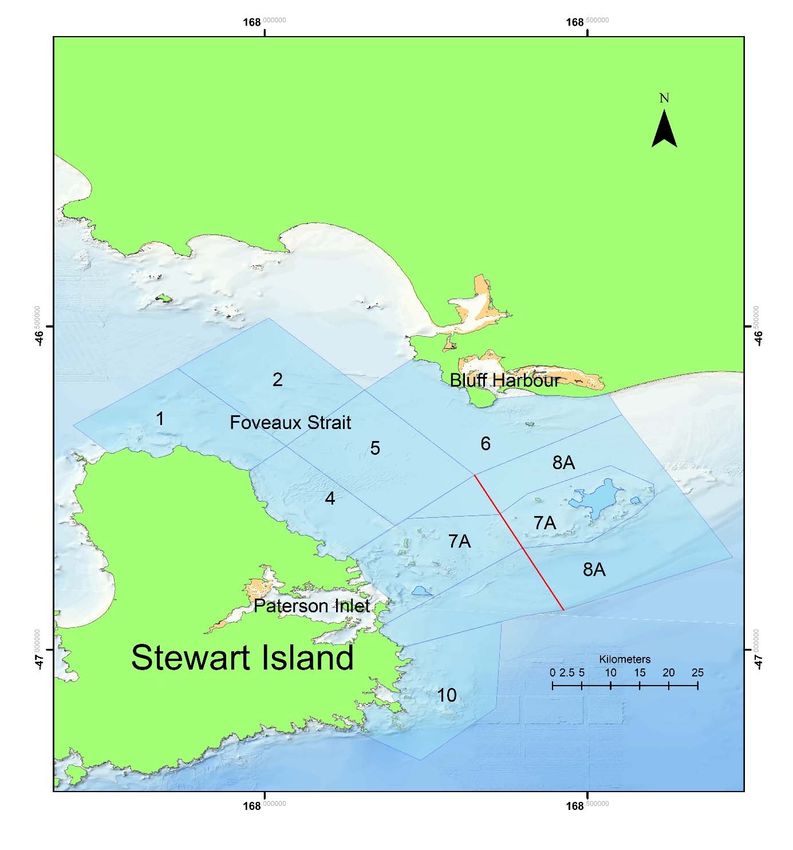
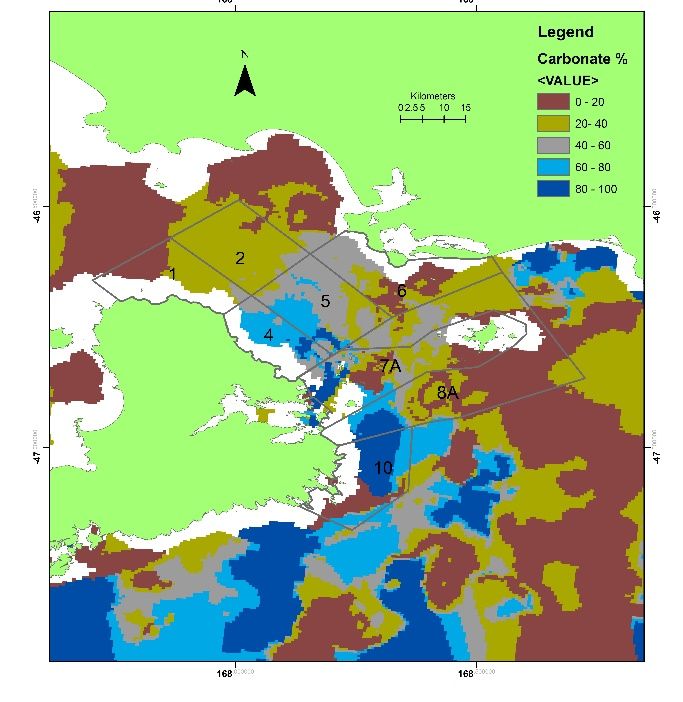
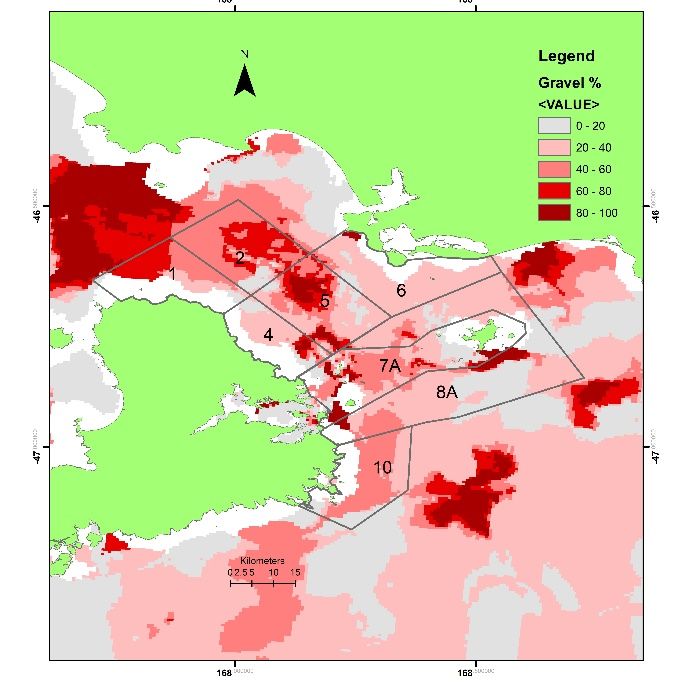
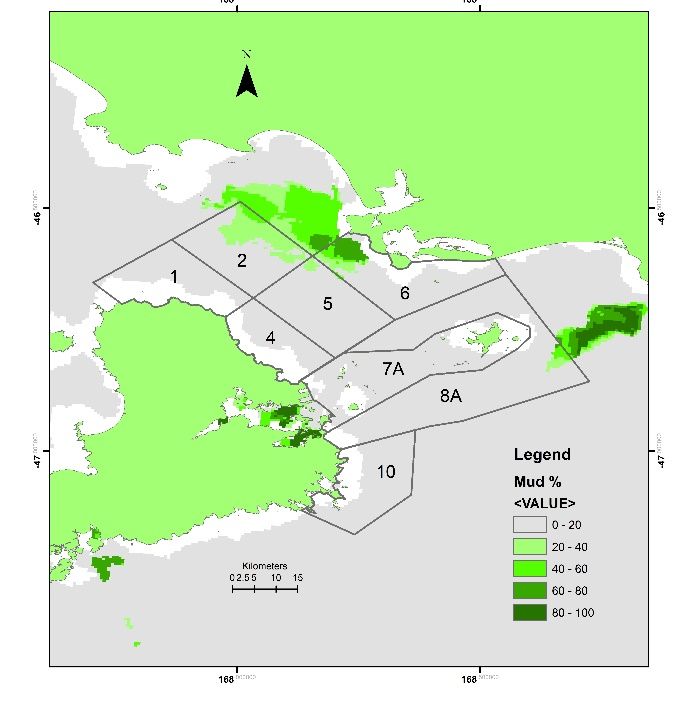
1. INTRODUCTION This report describes the random-site potting survey of blue cod (Parapercis colias) relative abundance, population length/age structure and stock status in Foveaux Strait in February 2018. This is the third in the time series with previous random-site surveys in 2010 and 2014 (Carbines & Beentjes 2012, Carbines & Haist 2017a). 1.1 Foveaux Strait blue cod fishery In the South Island, blue cod is the finfish species most frequently targeted and landed by recreational fishers (Ministry for Primary Industries 2017) and is caught from small vessels fishing over reef edges on shingle/gravel, biogenic reefs, or sandy bottoms close to rocky outcrops. The Quota Management Area BCO 5 extends from the Slope Point in Southland to Awarua Point in Fiordland (Figure 1). The 2011–2012 panel survey involving face to face interviews with fishers estimated BCO 5 recreational annual take at 51 t (Wynne-Jones et al. 2014), accounting for 15% of the total national recreational blue cod catch, virtually all taken by rod and line. Recreational blue cod catch is spread across BCO 5 with 38% from Slope Point to Te Waewae Bay, 33% from Stewart Island and Foveaux Strait, 19% from Fiordland, and 10% from Paterson Inlet (National Research Bureau unpublished data from 2017–18 panel survey, pers. comm. Bruce Hartill). Within Fiordland, from 2006–2008 recreational fishing was focused on Dusky and Doubtful Sounds, and off Preservation Inlet (Davey & Hartill 2008). The recreational minimum legal size within BCO 5 is 33 cm, with a combined daily bag limit of 20 fish (or blue cod), except for the internal waters of Fiordland where daily bags limits are 1 to 3 blue cod depending on the fiord, and Paterson Inlet where the daily bag limit is 15 blue cod or 10 inside the mātaitai known as Te Whaka ā Te Wera Mātaitai Reserve; Milford Sound, Doubtful Sound and Ulva Island Marine Reserve (Te Wharawhara Marine Reserve) are closed to all blue cod fishing (Fisheries New Zealand 2018). The commercial blue cod catch from BCO 5 is the highest by far for any Quota Management Area, with annual catches of 1100–1200 t in the six years up to 2016–17 (Fisheries New Zealand 2018), and is over 20 times higher than the BCO 5 estimated recreational catch in 2011–12 of 51 t. Nearly all commercially landed blue cod in BCO 5 is caught by cod potting, and about half of this is from Statistical Area 025 (Foveaux Strait), and 20% from each of Statistical Areas 030 (west of Stewart Island) and 027 (east of Stewart Island) (Figure 1) (Haist et al. 2013). 1.2 Foveaux Strait bathymetry and substrate Foveaux Strait is a narrow body of water between Stewart Island and the most southern part of the South Island. It is generally around 30 m deep, becoming gradually deeper at the east and west ends over the continental shelf, before steeply dropping away over the shelf edge (Figure 2). The shallow bathymetry and proximity to the mainland tends to accelerate the west to east moving Southland Current through the strait. Tidal velocities within the strait can be high, driven by prevailing westerly winds which frequently result in rough sea conditions. The survey area includes the entire Foveaux Strait, the eastern Islands such as Ruapuke Island, the north east Stewart Island coastline from Cave Point to Owen Point (excluding Paterson Inlet), and the mainland coastline from New River Estuary to about 25 km east of Bluff (Figure 3). The sediments within Foveaux Strait are predominantly sand and gravel distributed in patches (Figure 4). There is very little mud except for a relatively small area of mud in the north west off the Bluff coast. The carbonate map indicates the level of biological material in the water column or on the seafloor and tends to be most concentrated on the east coast of Stewart Island. Foveaux Strait offers substantial and varied blue cod habitat, both inshore, within the strait, and around the many rugged islands to the east. Fisheries New Zealand Foveaux Strait blue cod survey 2018 3
1.3 South Island blue cod potting surveys South Island recreational blue cod fisheries are monitored using potting surveys. These surveys take place predominantly in areas where blue cod recreational fishing is common, but in some areas, including Foveaux Strait, there is substantial overlap between the commercial and recreational fishing grounds. Surveys are generally carried out every four years and provide data that can be used to monitor local relative abundance, size, age, and sex structure of geographically separate blue cod populations. The surveys provide a measure of the response of populations to changes in fishing pressure and management initiatives such as changes to the daily bag limit, minimum legal size, and area closures. One method to investigate the status of blue cod stocks is to estimate fishing mortality, the associated spawner-per-recruit ratio (SPR) and the Maximum Sustainable Yield (MSY) related proxy. The recommended Harvest Strategy Standard target reference point for blue cod (a low productivity stock) is F45%SPR (Ministry of Fisheries 2011) - i.e., target fishing mortality should be at or below a level that reduces the spawner biomass to 45% of that if there was no fishing. In addition to Foveaux Strait, there are currently eight other South Island areas located in key recreational fisheries that are surveyed by Fisheries New Zealand: Kaikoura (Carbines & Beentjes 2006a, 2009, Beentjes & Page 2017, 2018, Carbines & Haist 2018d), Motunau (Carbines & Beentjes 2006a, 2009, Beentjes & Sutton 2017, Carbines & Haist 2018d), Banks Peninsula (Beentjes & Carbines 2003, 2006, 2009, Beentjes & Fenwick 2017, Carbines & Haist 2017b), north Otago (Carbines & Beentjes 2006b, 2011, Carbines & Haist 2018b, Beentjes & Fenwick 2019), south Otago (Beentjes & Carbines 2011, Carbines & Haist 2018c), Paterson Inlet (Carbines 2007, Carbines & Haist 2014, 2018a), Dusky Sound (Carbines & Beentjes 2006a, 2009, Beentjes & Page 2016), and the Marlborough Sounds (Blackwell 1997, 1998, 2002, 2006, 2008, Beentjes & Carbines 2012, Beentjes et al. 2017, Beentjes et al. 2018). 1.4 Potting survey design All South Island potting surveys, except Foveaux Strait, originally used a fixed site design, with predetermined (fixed) locations randomly selected from a limited pool of such sites (Beentjes & Francis 2011). The South Island potting surveys were reviewed by an international expert panel in 2009, which recommended that blue cod would be more appropriately surveyed using random-site potting surveys (Stephenson et al. 2009). A random-site is any location (single latitude and longitude) generated randomly from within a stratum (Beentjes & Francis 2011). Following this recommendation, all survey series started to transition to fully random survey designs with interim sampling of both fixed and random sites allowing comparison of catch rates, length and age composition, and sex ratios between the survey designs. Random sites were the only site type used in all the Foveaux Strait surveys, and surveys in south Otago (2013 survey), Kaikoura (2017 survey), and Paterson Inlet (2018 survey) have transitioned to solely random-site surveys. For other areas, the most recent surveys included both fixed and random sites. 1.5 Objectives Overall Objective To estimate relative abundance, maturity state, sex ratio, and age structure of blue cod (Parapercis colias) in Foveaux Strait. Specific objectives 1. To undertake a potting survey in Foveaux Strait to estimate relative abundance, size- and age-at- maturity, sex ratio and collect otoliths from pre-recruited and recruited blue cod. 2. To analyse biological samples collected from the potting survey. 3. To determine stock status of blue cod populations in this area. 4 Foveaux Strait blue cod survey 2018 Fisheries New Zealand
In this report we use the terms defined in the blue cod potting survey standards and specifications (Beentjes
& Francis 2011) (Appendix 1).
2. METHODS
2.1 2018 survey timing and area
A random-site potting survey of Foveaux Strait was carried out by NIWA from 6–20 February 2018.
The survey was consistent with start dates of previous surveys but finished earlier.
The survey area for the 2018 Foveaux Strait random-site survey was identical to the 2014 survey (Figure 3).
Strata 7 and 8 were redrawn in 2014 to include mostly foul rugged habitat in stratum 7, and sandy bottom
habitat in stratum 8. There are eight strata, six of which are contiguous with the coast and two are in the
middle of Foveaux Strait. The inner strata are mostly 10–30 m deep whereas the north (stratum 1) and south
strata (strata 10 and 8A) have depths exceeding 50 m (Figure 2). Each stratum was assumed to contain
roughly random distributions of blue cod habitat and the total area (km2) within each stratum was taken
as a proxy for available habitat for blue cod. Strata were defined before seabed substrate sediment maps
were available (Figure 4).
2.2 2018 survey design
2.2.1 Allocation of sites
Simulations to determine the optimal allocation of random sites among the eight strata were carried out
using catch rate data from the 2010 and 2014 random-site surveys and NIWA’s Optimal Station
Allocation Program (allocate). The 2010 strata 7 and 8 sites were re-assigned to either strata 7A or 8A.
Simulations were constrained to have a minimum of three sites per stratum and a CV (coefficient of
variation) of no greater than 12%. The simulations indicated that 38 random sites were required to
achieve the target CV of 12%.
The 2018 survey used a two-phase stratified random station design (Francis 1984) with 34 sites allocated
to phase 1, and the remaining four available for phase 2, consistent with the proportion of phase 2 sites used
in previous surveys (Table 1). Allocation of phase 2 stations was based on the mean pot catch rate
(kg.pot- 1) of all blue cod per stratum and optimised using the “area mean squared” method of Francis
(1984). In this way, stations were assigned iteratively to the stratum in which the expected gain is
greatest, where expected gain is given by:
expected gaini = areai 2 meani 2 / (ni(ni+1))
where for the ith stratum meani is the mean catch rate of blue cod per pot, areai is the fishable stratum
area, and ni is the number of sets in phase 1. In the iterative application of this equation, ni is incremented
by 1 each time a phase 2 set is allocated to stratum i.
Random sites
A random site has a location (single latitude and longitude) generated randomly within a stratum (Beentjes
& Francis 2011). Sufficient sites to cover both first and second phase stations were generated for each
stratum using the NIWA random station generator program (Rand_stn v1.00-2014-07-21) with the
constraint that sites were at least 800 m apart. From this list, the allocated number of random sites per
stratum to be surveyed was selected in the order they were generated.
Pot configuration and placement for random sites is defined in the blue cod potting manual (Beentjes &
Francis 2011). Random-site surveys used systematic pot placement where the position of each pot was
Fisheries New Zealand Foveaux Strait blue cod survey 2018 5arranged systematically with the first pot set 200 m to the north of the site location and remaining pots set in a hexagon pattern around the site, at about 200 m from the site position. 2.2.2 Vessels and gear The Stewart Island-based vessel F.V. Provider (Vessel registration 900807) was used on the 2018 Foveaux Strait survey. The Provider is a 17 m fibreglass over plywood monohull, equipped with Cummins diesel engines rated at 1375 kw. The Provider was skippered by Brett Hamilton, who has considerable experience in commercial blue cod potting, and was the skipper on the 2014 Foveaux blue cod survey using the F.V. Francis. Six custom designed and built cod pots were used to conduct the survey (Pot Plan 2 in Beentjes & Francis 2011). Pots were baited with 700 g paua viscera in “snifter pottles”. Bait was topped up after every lift. The same pot design and bait type were used in all previous surveys. A high-performance, 3-axis (3D) acoustic Doppler current profiler (ADCP, RDI Instruments, 600 kHz) was initially deployed at each site, but this was discontinued after it was found that the equipment was damaged and was not recording. The ADCP records current flow and direction in 1 m depth bins above the seafloor as well as bottom water temperature. 2.2.3 Sampling methods All sampling methods adhered strictly to the blue cod potting survey standards and specifications (Beentjes & Francis 2011). At each site, six pots were set and left to fish (soak) for a target period of one hour during daylight hours. As each pot was placed, a record was made of sequential pot number (1 to 6), latitude and longitude from GPS, depth, and time of day. After each site was completed, the next closest site in the stratum was sampled. The ADCP was deployed at the centre of each site prior to the setting of pots and recovered after the last pot of each set was lifted. The order that strata were surveyed depended on the prevailing weather conditions, with the most distant strata and/or sites sampled in calm weather. Pots were lifted aboard using the vessel’s hydraulic pot lifter in the order they were set, and the time of each lift was recorded. Pots were then emptied and the contents sorted by species. Total catch weight per pot was recorded for each species to the nearest 10 g using 0–6/6–15 kg Marel motion compensating scales. The number of individuals of each species per pot was also recorded. Total length to the nearest centimetre below actual length, individual fish weight to the nearest 10 g, sex and gonad maturity were recorded for all blue cod. Sagittal otoliths were removed from a representative length range of blue cod males and females over the available length range across all strata. To ensure that otolith collection was spread across the survey area, the following collection schedule was used – collect three otoliths per 1 cm size class for each sex in strata 1, 2 and 4 combined, and strata 5, 6, 7A, 8A and 10 combined (Appendix 2). Sex and maturity were determined by dissection and macroscopic examination of the gonads (Carbines 1998, 2004). Blue cod gonad staging was undertaken using the five stage Stock Monitoring (SM) method used on previous surveys. Gonads were recorded as follows: 1, immature or resting; 2, maturing (oocytes visible in females); 3, mature (hyaline oocytes in females, milt expressible in males); 4, running ripe (eggs and milt free flowing); 5, spent. 6 Foveaux Strait blue cod survey 2018 Fisheries New Zealand
2.2.4 Data storage
The 2018 Foveaux Strait survey trip code was PRO1801. At the completion of the survey, trip, station,
catch, and biological data were entered into the trawl database in accordance with the business rules and
the blue cod potting survey standards and specifications (Beentjes & Francis 2011). All catch rate, length
and sex-based analyses were from data extracted from the trawl database. Catch-at-age analyses were
based on the ageing results provided by the otolith readers, and at the completion of the catch-at-age
analyses, after any possible errors in the age and length data were identified and corrected, age data were
entered into the age database. Random sites were entered into attribute stn_code, prefixed with R (e.g.,
R1A, R2B). Random-site locations were also entered into trawl table t_site. Pot locations were entered
in table t_station in attribute station_no (concatenating set number and pot number e.g., 11 to 16, or 31
to 36 etc.). In the age database the sample_no is equivalent to station_no in the trawl database.
There were no ADCP data collected on this survey.
2.2.5 Age estimates
Otolith preparation and reading
Preparation and reading of otoliths followed the methods of the blue cod age determination protocol
(ADP) (Walsh 2017).
1. Blue cod otolith thin-section preparations were made as follows: otoliths were individually marked
on their distal faces with a dot in the centrum using a cold light source on low power to light the
otolith from behind. Five otoliths (from five different fish) were then embedded in an epoxy resin
mould and cured at 50 ºC. Thin sections were taken along the otolith dorso-ventral axis through the
centrum of all five otoliths, using a Struers Accutom-50 digital sectioning machine, with a section
thickness of approximately 350 µm. Resulting thin section wafers were cleaned and embedded on
microscope slides using epoxy resin and covered with a coverslip. Finally, these slides were oven
cured at 50ºC.
2. Otolith sections were read against a black background using reflected light under a compound
microscope at a magnification of 40–100 times. Under reflected light opaque zones appear light
and translucent zones dark. Translucent zones were counted (ageing of blue cod otolith thin sections
prior to 2015 counted opaque zones to estimate age).
3. Two readers read all otoliths without reference to fish length.
4. When interpreting blue cod zone counts, both ventral and dorsal sides of the otolith were read,
mainly from the core toward the proximal surface close to the sulcus.
5. The forced margin method was used: ‘Wide’ (a moderate to wide translucent zone present on the
margin), October–February; ‘Line’ (an opaque zone in the process of being laid down or fully
formed on the margin), March–April; ‘Narrow’ (a narrow to moderate translucent zone present on
the margin), May–September.
6. Where between-reader counts differed, the readers rechecked the count and conferred until
agreement was reached, unless the section was a grade 5 (unreadable) or damaged (removed from
the collection).
7. Between-reader ageing precision was assessed by the application of the methods and graphical
techniques documented in Campana et al. (1995) and Campana (2001); including APE (average
percent error) and coefficient of variation (CV).
2.2.6 Data analyses
Analyses of catch rates, sex ratios, scaled length distribution, catch-at-age, total mortality (Z) estimates, and
spawner-per-recruit were carried out and are presented for the 2018 Foveaux Strait random-site survey.
Analyses of catch rates and coefficients of variation (CV), length-weight parameters, scaled length and age
frequencies and CVs, sex ratios, mean length, and mean age, were carried out using the equations
Fisheries New Zealand Foveaux Strait blue cod survey 2018 7documented in the blue cod potting survey standards and specifications (Beentjes & Francis 2011). Fish
length was recorded to the nearest millimetre on the survey, but following standard protocol, all lengths
were rounded down to the nearest centimetre for analyses of the scaled length distribution, and mean length
(i.e., using data extracted from t_lgth in the trawl database).
2.2.6.1 Catch rates
The catch rate (kg.pot-1) estimates were pot-based and the CV estimates were set-based (Beentjes & Francis
2011). Catch rates and 95% confidence intervals (± 1.96 standard error) were estimated for all blue cod and
for recruited blue cod (33 cm and over). Catch rates of recruited blue cod were based on the sum of the
weights of individual recruited fish which were all weighed on the survey. The stratum areas (km2)
shown in Table 1 were used as the area of the stratum (At) when scaling catch rates (equations 3 and 5
in Beentjes & Francis 2011). Catch rates are presented by stratum and overall. Catch rates were
estimated for individual strata and for all strata combined.
2.2.6.2 Length-weight parameters
The length-weight parameters ak, bk from the 2018 Foveaux Strait survey were used in the following
equation:
w lk a k l
bk
This calculates the expected weight (g) for a fish of sex k and length l (cm) in the survey catch. These
parameters were calculated from the coefficients of sex-specific linear regressions of log(weight) on
log(length) using all fish for which length, weight, and sex were recorded: bk is the slope of the regression
line, and log(ak) is its y-intercept.
2.2.6.3 Growth parameters
Separate von Bertalanffy growth models (von Bertalanffy 1938) were fitted to the 2018 Foveaux Strait
survey length-age data by sex as follows:
Lt = L(1 – exp–K[t – t0])
where Lt is the length (cm) at age t, L is the asymptotic mean maximum length, K is a constant (growth
rate coefficient) and t0 is hypothetical age (years) for a fish of zero length.
Von Bertalanffy growth models (von Bertalanffy 1938) were fitted to the 2010, 2014 and 2018 Foveaux
Strait surveys length-age data combined.
2.2.6.4 Scaled length and age frequencies
Length and age compositions were estimated using the NIWA program Catch-at-Age (Bull & Dunn
2002). The program scales the length frequency data by the area of the stratum, number of sets in each
stratum, and estimated catch weight determined from the length-weight relationship of individual fish.
The latter scaling should be negligible or very close to one if all fish caught during the survey were
measured (which they were) and if the actual weight of the catch is close to the estimated weight of the
catch. The stratum area (km2) shown in Table 1 was taken as the area of the stratum (At), and the length-
weight parameter estimates are from the 2018 Foveaux Strait survey data for males and females
separately.
8 Foveaux Strait blue cod survey 2018 Fisheries New ZealandLength and age frequencies were calculated as numbers of fish from equations 7, 8, and 9 of Beentjes & Francis (2011). The length and age frequencies in this report are expressed as proportions by dividing by total numbers. Bootstrap resampling (300 bootstraps) was used to calculate CV for proportions and numbers-at-length and age using equation 12 of Beentjes & Francis (2011). That is, simulated data sets were created by resampling (with replacement) sets from each stratum, and fish from each set (for length and sex information); and also fish from the age-length-sex data that were used to construct the age-length key. Catch-at-age was estimated using a single age-length-key (ALK) for each sex applied to the length data from the entire survey area. Scaled length frequency and age frequency proportions are presented, together with CVs for each length and age class, and the mean weighted coefficients of variation (MWCV). 2.2.6.5 Unsexed fish All but two very small blue cod (under 10 cm TL) were sexed during the 2018 Foveaux Strait survey. The unsexed fish were not used in ageing or to estimate total mortality (Z), but were used to show the total scaled length frequency and corresponding total scaled age compositions. 2.2.6.6 Sex ratios, and mean length and age Sex ratios (expressed as percentage male) and mean lengths, for the stratum and survey, were calculated using equations 10 and 11 of Beentjes & Francis (2011) from the stratum or survey scaled LFs. Mean ages were calculated analogously from the scaled age frequencies. Sex ratios were also estimated for recruited blue cod (33 cm and over), and overall survey 95% confidence intervals around sex ratios were generated from the 300 LF bootstraps. 2.2.6.7 Total mortality estimates Total mortality (Z) was estimated from catch-curve analysis using the Chapman-Robson estimator (CR) (Chapman & Robson 1960). Catch curve analyses measure the sequential decline of cohorts annually. The CR method was shown to be less biased than the simple regression catch curve analysis (Dunn et al. 2002). Catch curve analysis assumes that the right-hand descending part of the curve declines exponentially and that the slope is equivalent to the total mortality Z (= natural mortality M + fishing mortality F). This assumes that recruitment and mortality are constant, that all recruited fish are equally vulnerable to capture, and that there are no age estimation errors. Estimates of CR total mortality, Z, were calculated for age-at-recruitment values of 5 to 10 y using the maximum-likelihood estimator (equation 13 of Beentjes & Francis (2011). Variance (95% confidence intervals) associated with Z was estimated under three different parameters of recruitment, ageing error, and Z estimate error (equations 14 to 18 of Beentjes & Francis (2011)). Catch-at-age distributions were estimated separately for males and females and then combined before the CR analysis, hence providing a single Z estimate for the population. A traditional catch curve was also plotted from the natural log of catch (numbers) against age and a regression line fitted to the descending curve from age-at-full recruitment. Although the Z estimate from the traditional catch curve was not used in further analyses, it provides a comparison for the CR estimate of Z. This is useful in situations where there are not many age classes, and so there is potential for strong or weak year classes to introduce bias. Fisheries New Zealand Foveaux Strait blue cod survey 2018 9
2.2.6.8 Spawner-per-recruit estimates
A spawner-per-recruit analysis for 2018 was conducted using CASAL (Bull et al. 2005). The
calculations involved simulating fishing with constant fishing mortality (F), and estimating the
equilibrium spawning biomass per recruit (SPR) associated with that value of F (Beentjes & Francis
2011). The %SPR for that F is then simply that SPR, expressed as a percentage of the equilibrium SPR
when there is no fishing (i.e., when F = 0, and %SPR =100%).
Because the lack of older fish often results in unrealistically high L estimates for fitted growth curves,
Fisheries New Zealand Southern Inshore Working Group (SINSWG 2018/41) recommended that the
growth curve from the combined surveys (2010, 2014 and 2018) be used to estimate growth parameters
for the 2018 spawner-per-recruit analysis.
Input parameters used in SPR analyses
Growth parameters von Bertalanffy growth parameters are from the 2010, 2014 and 2018 length
and age data combined, and length-weight coefficients are from the 2018
survey:
Parameter Males Females
K (yr-1) 0.137 0.198
t0 (yr) -0.822 -0.54
L (cm) 55.72 39.96
a 0.007289 0.008362
b 3.2055 3.1696
Natural mortality default assumed to be 0.14. Sensitivity analyses were carried out for M values
20% above and below the default (0.11 and 0.17).
Maturity the following maturity ogive was used: 0, 0, 0, 0.1, 0.4, 0.7, and 1; where 10%
of blue cod are mature at 4 years old and all are mature at 7 years.
Selectivity selectivity to the fishery (recreational/commercial) is described as knife-edge
equal to age-at-MLS calculated from the combined 2010, 2014 and 2018
Foveaux Strait surveys von Bertalanffy model. The Foveaux Strait recreational
MLS is 33 cm and selectivity was 5.7 years for males and 8.3 years for females.
Fishing mortality (F) fishing mortality was estimated from the results of the Chapman-Robson Z
analyses and the assumed estimate of M (i.e., F = Z–M). The Z value was for
age-at-full recruitment (8 years for females).
Maximum age assumed to be 31 years.
To estimate SPR the CASAL model uses the Baranov catch equation which assumes that M and F are
occurring continuously throughout the fishing year. i.e., instantaneous natural and fishing mortality.
The SPR estimates are based on age at recruitment equal to the MLS for females, in this case 8 years.
2.3 Analyses of 2010 and 2014 Foveaux Strait surveys
The 2010 and 2014 Foveaux Strait surveys (trip_codes THE1010 and FRA1401) were re-analysed as
part of this report to ensure consistency and compliance with the analytical methods in the potting
manual (Beentjes & Francis 2011). All analyses used survey data extracted from the Fisheries New
Zealand trawl database. Catch rates of recruited blue cod were based on sum of the weights of individual
fish 33 cm and over, estimated from the respective 2010 and 2014 survey’s published length-weight
coefficients (Carbines & Beentjes 2012, Carbines & Haist 2017a). The otoliths from these two surveys
10 Foveaux Strait blue cod survey 2018 Fisheries New Zealandwere re-aged in 2017 (Fisheries New Zealand project SEA201706), and ages are archived in the age database. The same readers aged these and the 2018 survey otoliths in accordance with the ADP, and hence ages are directly comparable among surveys. The new ages from the 2010 and 2014 surveys were analysed in this report and used to estimate population age structure, and mortality (M and Z). The spawner-per-recruit growth parameters inputs were estimated from the combined length and age data of 2010, 2014 and 2018 surveys. Estimates of population age structure, mortality, and SPR given in this report for the 2010 and 2014 Foveaux Strait surveys, supersede those published in previous reports (Carbines & Beentjes 2012, Carbines & Haist 2017a). 3. RESULTS 3.1 2018 random-site survey Thirty-eight random sites (6 pots per site, producing 228 pot lifts) from eight strata in Foveaux Strait were surveyed from 6–20 February 2018 (Table 1, Figure 5). Depths sampled were 14–95 m (mean = 38.5 m). Thirty-four sites were sampled in phase-one and four in phase-two. An example of the systematic pot placement configuration for random sites is shown in Figure 6. 3.1.1 Catch and catch rates A total of 1384 kg of blue cod (3015 fish) was taken, comprising 75.1% by weight of the catch of all species on the survey (Table 2). Bycatch species included seven teleost fishes, and octopus. The most abundant bycatch species by far was leatherjacket (Meuschenia scaber) comprising 23.1% of the catch weight. Mean catch rates (kg.pot-1) of blue cod (all blue cod, and 33 cm and over) are presented by stratum and overall (Table 3, Figure 7). Mean catch rates of blue cod (all sizes) by stratum were 4.01–8.41 kg.pot-1 with the lowest catch in stratum 5 (middle of strait) and highest in stratum 10 (most southern stratum contiguous with Stewart Island) (Table 3, Figure 7). The all-blue-cod overall survey catch rate was 5.66 kg.pot-1 with a CV of 20.5%. Catch rates for recruited blue cod (33 cm and over) followed a similar pattern among strata as for all blue cod and the overall survey catch rate was 2.45 kg.pot-1 (CV 18.4%) (Table 3, Figure 7). Of the 228 random-site pots, 63 (28%) had zero catch of blue cod. 3.1.2 Biological and length frequency data Of the 3015 blue cod caught, all were measured for length and weighed, and all but two very small fish were sexed (Table 4). The sex ratios were 34–63% male across the eight strata and the overall weighted sex ratio was 51% male (Table 4). Length was 12–51 cm for males and 10–42 cm for females, although this range varied among strata and the overall weighted mean length was 30.6 cm for males and 28.4 cm for females. The scaled length frequency distributions were generally unimodal and broadly similar among the eight strata for males and females, respectively (Figure 8). 3.1.3 Age and growth Otolith section ages from 199 males and 159 females collected from the 2018 random-site survey were used to estimate the population age structure from Foveaux Strait in 2018 (Table 5). Similarly, ages from 151 males and 140 females collected from the 2010 random-site survey and 145 males and 130 females collected from the 2014 random-site survey combined were used to estimate the population age structure in those years (Table 5). For each survey, the length-age data are plotted and the von Bertalanffy model fits and growth parameters (K, t0 and L) are shown for males and females separately (Figure 9). There is a large range in length-at-age, particularly for males; and males generally grow Fisheries New Zealand Foveaux Strait blue cod survey 2018 11
faster and comprise most of the largest fish. The growth rates for all three surveys are similar by sex up to about age 10, after which they tend to diverge as older fish become scarce (Figure 10). The von Bertalanffy model fits and growth parameters for the three surveys combined are shown in Figure 11. Between-reader age comparisons for 2018 are presented in Figure 12. The first counts of the two readers showed 88% agreement, and overall there was no bias between readers with a CV of 1.1% and average percent error (APE) of 0.8%. The 2010 and 2014 surveys between reader comparisons are not shown but indicated good agreement and no bias between the two readers (Fisheries New Zealand, unpublished data). 3.1.4 Spawning activity Gonad stages of blue cod sampled on the Foveaux Strait survey in February 2018 are presented for all fish combined (Table 6). There were few indications of spawning activity during the survey period with no fish in the running ripe condition and a small percentage in the mature condition, suggesting that the survey took place either before or after the spawning peak. 3.1.5 Population length and age composition The scaled length frequency and age distributions for the 2018 Foveaux Strait random-site survey are shown for all strata combined, as histograms, and as cumulative frequency line plots for males, females, and both sexes combined (Figure 13). The scaled length frequency distribution for males was unimodal with a broad flat peak centred at about 32 cm and an overall mean length of 30.6 cm. The female distribution was also unimodal with a strong peak at about 30 cm and the overall mean length of 28 cm (Figure 13). The cumulative distribution plots of length frequency are generally similar between sexes, but males are skewed to the right. The mean weighted coefficients of variation (MWCVs) around the length distributions were 22% for both males and females. The 2018 survey age estimates were 1–14 years for males and 1–17 years for females, but most males and females were 4–8 years old (Figure 13). The estimated population age distributions indicate almost knife-edge selectivity to the potting method at about three years with no indications of strong or weak modes for either males or females. The cumulative distribution plots of age frequency show clearly that females had a higher proportion of older fish than males (Figure 13). The mean age of females was greater than that of males (5.7 for males and 6.8 years for females). The MWCVs around the age distributions were 22% for males and 31% for females, the latter was higher than desired to provide a good representation of the overall population age structure. 3.1.6 Total mortality estimates (Z) and spawner-per-recruit (SPR) Chapman-Robson total mortality estimates (Z) and 95% confidence intervals are given for a range of recruitment ages (5–10 y) in Table 7. Age-at-full recruitment (AgeR) is assumed to be eight years, equal to the age at which females reach the MLS of 33 cm. In 2018 the CR Z for AgeR of eight years was 0.70 (95% confidence interval of 0.47–0.98). The traditional catch curve, based on log catch (numbers) plotted against age with a regression line fitted to the descending limb from age-at-full recruitment of eight years, is shown for the 2018 survey for diagnostic purposes (Figure 14). The natural log of numbers-at-age appears to follow the ideal straight- line descending limb, suggesting that the assumption of constant recruitment has not been violated, and gives confidence in the CR Z estimates which tends to be less sensitive to age classes with few fish (see 12 Foveaux Strait blue cod survey 2018 Fisheries New Zealand
Table 7). The steepness of the descending curve, and hence high Z value, is a direct result of the lack of recruited older age classes. Mortality parameters (CR Z and F, and M) and spawner-per-recruit (SPR) estimates at three values of M and age at full recruitment of eight years are shown for the 2018 survey in Table 8. Based on the default M of 0.14, estimated fishing mortality (F) was 0.56 and associated spawner-per-recruit was 21.8% (Figure 15). At the 2018 levels of fishing mortality, the expected contribution to the spawning biomass over the lifetime of an average recruit is reduced to 22% of the contribution in the absence of fishing. The 95% confidence intervals around the 2018 SPR ratios were 18–29% (Table 8). 3.2 Foveaux Strait random-site survey time series (2010, 2014, 2018) Mean catch rates (kg.pot-1) for all blue cod and recruited blue cod for the three surveys are presented in Figure 16. The pattern of catch rates among the eight strata are most similar in 2010 and 2014 when the highest catch rates were from strata 1 and 2 and the lowest by far were from stratum 8A (see Figure 3). The 2018 catch rates were similar across all strata, and the large confidence intervals indicate that these are not significantly different. For Foveaux Strait overall, there was no trend in abundance across the three surveys (Figure 16). The scaled length frequency distributions and mean length of all blue cod were remarkably similar for all three surveys, shown clearly by the cumulative distributions (Figure 17). Similarly, there was no change in the mean length of recruited blue cod (Figure 18). The sex ratio for all surveys was 47–51% male for all blue cod, and 68–76% male for recruited blue cod, with no clear trends (Figure 19). The male age structure is similar among the three surveys except for a weak 5-year-old age class in 2014, and it is not clear if this also resulted in a weak 9-year-old age class in 2018 (Figure 20). Female age structure is also generally similar, except for weak 5-year-old and 8-year-old age classes in 2010. The weak 5-year-old age class appears to have progressed through to 2014 as a weak 9-year-old age class (Figure 20). Despite the general similarities in age compositions, the Chapman Robson total mortality estimates (Z) increased from 0.52 in both 2010 and 2014, to 0.70 in 2018 with a corresponding decrease in the SPR estimates from about 27% to 22% (see Table 8 and Figure 15). The slopes of the right-hand limbs of the catch curves can vary considerably depending on the number of recruited age classes, which numbered just five for males in 2018 and four in 2014. With so few age classes, the slope can be strongly affected by one older age class, as in 2010 when there was a 29-year-old male which markedly reduced the slope of the catch curve (see Figure 14). A cautious approach should therefore be taken when interpreting Z and SPR estimates when so few age classes are included. The proportion of pots with zero catch for the three random-site surveys ranged from 25–32% with no clear trends (Figure 21). 4. DISCUSSION 4.1 General The 2018 Foveaux Strait random-site potting survey was the third Fisheries New Zealand survey in the time series of relative abundance and population structure of blue cod from this area, after previous random-site surveys in 2010 and 2014. Fisheries New Zealand Foveaux Strait blue cod survey 2018 13
4.2 Blue cod habitat and abundance Sediment samples (n = 30 000 stations) collected predominantly on the New Zealand continental shelf have been used to build sediment distribution maps that are now freely available online in the New Zealand Oceanographic Data Network (see Figure 4) (Bostock et al. 2018). The sediment maps of Foveaux Strait show how sand, mud, and carbonates are distributed within the eight strata and may be useful for re-stratifying future surveys. Foveaux Strait is presently characterised by substrates of predominantly patchy sand and gravel with very little mud, and carbonate is restricted to the east coast of Stewart Island. Foveaux Strait is most famously known for its dredge oyster (Ostrea chilensis) fishery which has been in operation since the 1860s when the virgin seafloor was predominantly biogenic reef comprised mainly of oysters and invertebrates including bryozoans, mussels, sponges and tunicates, habitat also known to be favoured by blue cod in Foveaux Strait (Cranfield et al. 1999, Cranfield et al. 2001). The dredge oyster fishery operates on the south west of Foveaux Strait on dense patches or beds which lie within the blue cod survey strata. Where dredging for oysters has occurred, these biogenic reefs have largely been replaced by sandy or gravel bottoms, causing localised depletion of blue cod living on previously undisturbed or recovering biogenic reefs (Cranfield et al. 2001). Further, growth rates of juvenile blue cod were shown to be on average 20% higher on biogenic reefs than from dredged areas (Carbines et al. 2004). Hence, it seems likely that optimal habitat for blue cod is less than in the past and that any enhancement of the biogenic reefs would also benefit blue cod. Foveaux Strait offers substantial and varied blue cod habitat, both inshore, within the strait, and around the many rugged islands to the east. The relative abundance of blue cod across the eight survey strata does not show any clear pattern in either 2014 and 20181, nor is there a clear association between habitat type and abundance (Figures 22 and 23, see Figure 4). The carbonate sediment map indicates the level of biological material in the water column or on the seafloor and hence can be regarded as a proxy for locations of biogenic reef; there is no clear association between blue cod abundance and concentrations of carbonate. The sediment maps, however, are only approximations based on extrapolations from the nearest sediment sampling stations and most likely do not reflect the dynamic nature of sediment shifts and the ongoing impacts of oyster dredging in Foveaux Strait. A more detailed analyses of habitat type by pot location in real time is required to determine if a relationship exists between habitat type and blue cod abundance. For example, dropped underwater video at selected sites during the 2010 potting survey showed some preference by small and large fish for specific habitats (Carbines & Beentjes 2012). The Foveaux Strait survey abundance estimates, length and age distributions, and sex ratio were weighted (scaled) by the area of each stratum. Scaling by stratum area assumes that average blue cod density in sampled sites is similar to density in unsampled area within that stratum. 4.3 Survey precision The survey CV around relative abundance (catch rates) was not specified in the project objectives for the 2018 Foveaux Strait survey, but a CV of around 15% is generally targeted. The achieved CV of 20% in 2018 (from 38 sites) was slightly higher than desired and higher than previous random-site surveys (13% for 2010 from 56 sites, and 12% for 2014 from 53 sites). The achieved 2018 CV of 20% indicates that the number of sites used should be increased in future surveys if a lower CV is desired. 4.4 Cohort progression and genetic mixing Growth estimates indicate that males are on average nearly 6-years-old, and females nearly 8-years-old when they reach the current MLS of 33 cm in Foveaux Strait (see Figure 11). Blue cod are not fully 1 2010 survey catch rate distribution was not plotted because random sites were not assigned codes in the trawl database and joining catch with location of the random site was problematical. 14 Foveaux Strait blue cod survey 2018 Fisheries New Zealand
selected to the potting method until at least 4 to 5 years old, a finding also supported by the age composition in other areas surveyed, most recently Kaikoura and north Otago (Beentjes & Page 2018, Beentjes & Fenwick 2019). The Foveaux Strait blue cod age structure is reasonably stable showing little in the way of strong or weak year classes, with the exception of a weak 5-year-old age class in 2010 progressing through to 2014 as 9-year olds (see Figure 20). The Foveaux Strait age structure differs from the east coast South Island areas that have been surveyed from 2015 to 2018 (Banks Peninsula Kaikoura, Motunau, and north Otago) which have all displayed a strong 2012 year-class and weak 2011 year-class. If the age characteristics were broadly similar, a strong 5-year-old and weak 4-year-old age class would be apparent in Foveaux Strait in 2018. These findings indicate that blue cod on the east coast South Island are prone to variable recruitment with intermittent pulses of strong and weak year classes, but this is not evident in Foveaux Strait. The consistent age pattern on the northeast and southeast coast of the South Island suggests that the 2012 spawning event was more successful than average and/or that natural mortality was low, possibly as a result of favourable environmental conditions along the east coast South Island. Blue cod tend to have a restricted home range (Rapson 1956, Mace & Johnston 1983, Mutch 1983, Carbines & McKenzie 2001, Carbines & McKenzie 2004) and stocks are likely to consist of largely independent sub-populations. However, there is no evidence that blue cod are genetically distinct around the New Zealand mainland (Gebbie 2014) suggesting that mixing is occurring on a wider geographical scale than within the mainly restricted home range indicated by some tagging studies. Tagging studies in Dusky Sound and Foveaux Strait have shown that while most blue cod move very little from the tagging location, some have been recaptured many kilometres away (Carbines & McKenzie 2001, Carbines & McKenzie 2004). Similarly, a recent tagging study of blue cod at Kaikoura showed that most returns were from locations close to the site of release, but one tag was reportedly recaptured off Kapiti Island eight months after release (Emma Kearney, University of Otago, pers. comm.). Mechanisms for genetic mixing are unknown, but clearly some blue cod do undertake large movements. The age compositions from Foveaux Strait compared to those of the east coast South Island surveys suggest that there may be less mixing and/or different environmental conditions affecting recruitment in these areas. 4.5 Sex change and sex ratio The 2018 Foveaux Strait sex ratio is at parity, consistent with the previous surveys in 2010 and 2014. (see Figure 19). Blue cod are protogynous hermaphrodites with some (but not all) females changing into males as they grow (Carbines 2004). In areas where fishing pressure is known to be high, such as Motunau, inshore Banks Peninsula, and the Marlborough Sounds, the sex ratios are strongly skewed towards males, contrary to an expected dominance of females resulting from selective removal of the larger final phase male fish (Beentjes & Carbines 2003, 2006, Carbines & Beentjes 2006a, Beentjes & Carbines 2012, Beentjes & Sutton 2017). Beentjes & Carbines (2005) suggest that the shift towards a higher proportion of males in heavily fished blue cod populations may be caused by removal of the possible inhibitory effect of large males, resulting in a higher rate (and possibly earlier onset) of sex change by primary females. Recent experimental studies have indicated that in the protogynous hermaphroditic tuskfish (Choerodon schoenleinii), this process may be density dependent, with the degree of male to female tactile stimulation regulating the extent of sex change from females to males (Sato et al. 2018). Sex change is more likely to occur at low levels of behavioural interaction between a dominant male and a female. However, in Foveaux Strait, offshore Banks Peninsula, and particularly Dusky Sound populations have sex ratios that are more balanced, suggesting that fishing pressure is less intense (Beentjes & Carbines 2009, Carbines & Beentjes 2012, Beentjes & Page 2016). Line caught blue cod around Stewart Island in the mid-1940s were on average much larger than those caught on the last three Foveaux Strait potting surveys (2010, 2014 and 2018), notwithstanding the method selectivity differences which are more likely to affect the catch of small blue cod (Rapson 1956, Beentjes & Carbines 2005). The movement of the length frequency distribution to the left is evidence of the effect of fishing on the Foveaux Strait blue Fisheries New Zealand Foveaux Strait blue cod survey 2018 15
You can also read