Inferring efficiency of translation initiation and elongation from ribosome profiling
←
→
Page content transcription
If your browser does not render page correctly, please read the page content below
Nucleic Acids Research, 2020 1
                                                                                                                        doi: 10.1093/nar/gkaa678

Inferring efficiency of translation initiation and
elongation from ribosome profiling
                                       1,*                                    2,*
Juraj Szavits-Nossan                         and Luca Ciandrini
1
 SUPA, School of Physics and Astronomy, University of Edinburgh, Peter Guthrie Tait Road, Edinburgh EH9 3FD, UK

                                                                                                                                                              Downloaded from https://academic.oup.com/nar/advance-article/doi/10.1093/nar/gkaa678/5895331 by guest on 16 September 2020
and 2 Centre de Biologie Structurale (CBS), CNRS, INSERM, Univ Montpellier, Montpellier 34090, France

Received June 13, 2020; Revised July 29, 2020; Editorial Decision August 02, 2020; Accepted August 15, 2020

ABSTRACT                                                                        veloped at the end of the 1960s to study translation initia-
                                                                                tion (3,4), and has been extended in the 1980s to investigate
One of the main goals of ribosome profiling is to                               the role of slow codons and ribosome pausing (5). Recently,
quantify the rate of protein synthesis at the level of                          Ingolia et al. (2) revamped this technique to exploit the next
translation. Here, we develop a method for inferring                            generation sequencing, and since then it is considered to be
translation elongation kinetics from ribosome pro-                              the state-of-the-art technique for studying gene expression
filing data using recent advances in mathematical                               at the level of translation.
modelling of mRNA translation. Our method distin-                                  In short, the method consists in isolating mRNA frag-
guishes between the elongation rate intrinsic to the                            ments (called ‘reads’) covered by a ribosome engaged in
ribosome’s stepping cycle and the actual elongation                             translation (∼30 nt), which are then sequenced and aligned
rate that takes into account ribosome interference.                             in order to build histograms of ribosome occupancy at
This distinction allows us to quantify the extent of                            codon resolution on each transcript. This technique has
                                                                                provided an unprecedented view on translation leading to
ribosomal collisions along the transcript and iden-
                                                                                many new discoveries (6). Examples include detecting novel
tify individual codons where ribosomal collisions are                           translation initiation sites (7), identifying actively translated
likely. When examining ribosome profiling in yeast,                             open reading frames (8), quantifying the extent of stop
we observe that translation initiation and elongation                           codon readthrough (9) and elucidating the translation of
are close to their optima and traffic is minimized at                           long non-coding RNAs (10).
the beginning of the transcript to favour ribosome re-                             Translational activity on a given transcript is typically as-
cruitment. However, we find many individual sites of                            sessed by the number of read counts per kilobase of tran-
congestion along the mRNAs where the probability                                script per million mapped reads of the sample (RPKM),
of ribosome interference can reach 50%. Our work                                which takes into account the length of the transcript and
provides new measures of translation initiation and                             the size of the sample. The RPKM is proportional to the
elongation efficiencies, emphasizing the importance                             ribosome density, which in turn is assumed to be propor-
                                                                                tional to the rate of translation––the more ribosomes on a
of rating these two stages of translation separately.
                                                                                transcript, the more efficient is protein synthesis. However,
                                                                                a large body of work based on mathematical modelling of
INTRODUCTION                                                                    ribosome dynamics suggests that the protein synthesis rate
Understanding the rationale behind codon usage bias and                         is negatively affected by increased ribosome density due to
the role of synonymous codons in regulating protein syn-                        ribosome collisions (11–13). To which extent ribosome col-
thesis are amongst the main open questions in molecular                         lisions can be found using ribosome profiling has been an
biology. Despite the fact that mRNA translation is a piv-                       active topic of research (14–18).
otal stage of gene expression, its sequence determinants are                       One of the goals of ribosome profiling is to understand
in fact still largely elusive (1). Recent advances in sequenc-                  how the elongation rate along the transcript depends on
ing, such as ribosome profiling (2), have made it possible to                   the choice of codons. Codon elongation rates are usually
probe translation dynamics at codon resolution, allowing                        estimated assuming that the ribosome density at codon i
for quantitative studies of translational efficiency.                           is proportional to the ribosome’s dwell time on that par-
   Ribosome profiling (Ribo-seq or ribosome footprinting                        ticular codon (15–16,19–24); this assumption follows from
as it is often called), is an experimental technique delivering                 the conservation of the ribosome current assuming no ribo-
a snapshot of ribosome positions along all transcripts in the                   some drop-off. Our estimate of the drop-off rate of ∼10−3
cell at a given condition. Its archetypal version has been de-                  s−1 (obtained from the probability of premature termina-

* To
   whom correspondence should be addressed. Tel: +33 4 67 41 77 04; Email: luca.ciandrini@umontpellier.fr
Correspondence may also be addressed to Juraj Szavits-Nossan. Email: jszavits@staffmail.ed.ac.uk


C The Author(s) 2020. Published by Oxford University Press on behalf of Nucleic Acids Research.
This is an Open Access article distributed under the terms of the Creative Commons Attribution License (http://creativecommons.org/licenses/by/4.0/), which
permits unrestricted reuse, distribution, and reproduction in any medium, provided the original work is properly cited.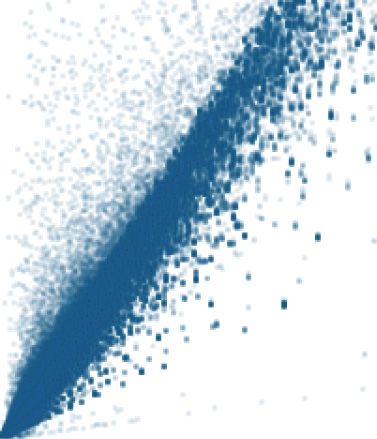
2 Nucleic Acids Research, 2020
tion estimated to 10−4 per codon (25,26) and the elonga- Table 1. A-site locations for various footprint sizes
tion rate of the order of magnitude of ≈10 codon/s) justi- Fragment size Frame 0 Frame 1 Frame 2
fies the hypothesis. The inferred elongation rates are then
27 15 15 18
checked against mRNA codon sequence features, such as 28 15 15 18
codon usage bias, tRNA availability and mRNA secondary 29 15 X 18
structures. 30 15 18 18
If ribosome collisions are not rare, then the elongation 31 15 18 18
rates proxied by the inverse ribosome densities do not de- 32 X 18 18
33 18 18 18
pend only on the molecular details of the elongation cycle,
Downloaded from https://academic.oup.com/nar/advance-article/doi/10.1093/nar/gkaa678/5895331 by guest on 16 September 2020
but also on the extent of slowing down due to ribosome
traffic. The crux of the matter is that it is difficult to dis- Table 2. Summary of the symbols used and their meaning
tinguish from the ribosome density alone whether the ribo- Symbol Meaning
some spent long time on a particular codon because of the
L length of the mRNA (in codons, including
long decoding time or because it had to wait for the down- START)
stream ribosome to move away. This distinction between length of the ribosome (in codons)
the actual elongation rates that account for ribosome traffic ␣ initiation rate [s−1 ]
and the intrinsic ones in the absence of other ribosomes has ki elongation rate [s−1 ] of codon i
been well accounted for in the standard model for mRNA kL (or ) termination rate [s−1 ]
translation known as the totally asymmetric simple exclu- {ki } speed profile (elongation) of a given transcript
i = ki /␣ relative (to initiation) elongation rate at
sion process (TASEP), which considers ribosomes moving codon i
along the transcript in a stochastic manner (11). Yet, very {i } relative (to initiation) elongation profile
few of the existing studies use the TASEP to infer elonga- ri experimental (normalized) density of codon i
tion rates from Ribo-seq; ones that do either do not infer the {ri } experimental (normalized) density profile
intrinsic rates (24) or use time consuming stochastic simu- r = iL=2 ri /(L − 1) mean density of a given gene
i theoretical (normalized) density of codon i
lations to fit the Ribo-seq data (16,22).
ρiILA theoretical (normalized) density of codon i in
In this work we develop an efficient method for inferring the initiation-limited approximation
both actual and intrinsic codon-specific elongation rates { i } theoretical (normalized) density profile
from the ribosome profiling data based on the mathematical ρisim simulated (normalized) density of codon i
solution of the TASEP that we recently developed (12,27). {ρisim } simulated (normalized) density profile
Using the TASEP, we argue that the ribosome density alone
is not sufficient to estimate the absolute elongation rates
from the ribosome profiling data. Instead, our method in- Notations
fers elongation rates of an mRNA relative to the initiation
rate of that transcript. Moreover, we propose new measures In this section we summarize the notations used in the pa-
of translation efficiency that quantify the amount of ribo- per. The main symbols for densities, rates and rates rela-
some traffic around the START codon and along the tran- tive to initiation are given in Table 2. When the quantity is
script. We apply our method to several Ribo-seq datasets in codon-specific we use the suffix i = 2, . . . , L to identify the
Saccharomyces cerevisiae and show evidence of local queu- codon number (the first codon after the START codon is at
ing in vivo. i = 2, the STOP codon is at i = L). Brackets { · } indicate a
set of values: for instance {ai } is the set of all the values ai
for i = 2, . . . , L.
We emphasize that we use normalized densities, in units
of ribosomes (A-sites) per codon. The total density is thus
MATERIALS AND METHODS
the averaged ribosome profile r = iL=2 ri /(L − 1), and the
Ribosome profiling data number of ribosomes translating an mRNA is N = r(L −
We have analysed publicly available ribosome profiling 1).
data of S. cerevisiae from Guydosh et al. (14), Pop et al.
(20) and Weinberg et al. (23): NCBI GEO accession
Mathematical model for mRNA translation
numbers GSM1279568, GSM1557447 and GSE75897 re-
spectively. We downloaded the HDF5 files from Riboviz We model translation by a stochastic process called the
(https://riboviz.org) (28) and mapped to A-site positions TASEP introduced by MacDonald et al. (11,31). The
according to Table 1 (29). TASEP describes ribosome dynamics on a discrete one-
After obtaining the A-site read density profiles, our dimensional lattice representing the coding part of the
method successfully optimized 345 of the total 346 genes mRNA molecule. Each lattice site corresponds to a codon,
from the Guydosh dataset for which the experimental ribo- and ribosomes cover = 10 sites, as the ribosome footprint
some density necessary for normalization was known from covers ∼30 nt or equivalently ∼10 codons. Ribosomes on
MacKay et al. (30). Analogously, the optimization was suc- the lattice are tracked according to the position of their A-
cessful for 1051 out 1053 genes of the Pop dataset and for all site. A codon i that is occupied by the A-site of the ribosome
1589 genes in the Weinberg dataset. For the omitted genes is labelled by Ai and is otherwise labelled by ∅i .
the normalization was not possible because it resulted in ri- A ribosome initiates translation at rate ␣, whereby its A-
bosome density larger than 1. site is positioned at codon 2; this happens only if the codons
Nucleic Acids Research, 2020 3
2, . . . , + 1 are not occupied by another ribosome’s A-site. Computer program
The ribosome then advances from codon i to codon i + 1
Computer program (NEAR) for inferring elongation rates
at rate ki , provided that codon i + is not covered by the
from ribosome profiling data is available under GNU
downstream ribosome (see top right drawing of the model
General Public License v3.0 at https://github.com/jszavits/
in Figure 1). We refer to ki as the intrinsic elongation rate
NEAR.
at which the ribosome advances in the absence of other ri-
bosomes. Eventually, when the A-site of the ribosome is at
the STOP codon (the L-th site), the ribosome detaches the RESULTS
mRNA at rate kL = . Each transcript in the model is then We base our method on a well-established stochastic model
Downloaded from https://academic.oup.com/nar/advance-article/doi/10.1093/nar/gkaa678/5895331 by guest on 16 September 2020
characterized by a set of L rates: initiation rate ␣, and elon- for mRNA translation, the TASEP, which we describe in de-
gation and termination rates {ki } = {k2 , . . . , kL }. tail in the ‘Materials and Methods’ section. Over the years,
The process is described by the probability density P(C, the model has been improved in many ways to better match
t) to find a configuration C of ribosomes on an mRNA at real translation (33,34) and has been repeatedly used to in-
a particular time t. By configuration we mean a particular terpret experimental data (16,18,24,35–38).
arrangement of ribosomes described by the positions {Ai } In principle, the knowledge of initiation, elongation and
of their A-sites. The time evolution of P(C, t) is governed by termination rates allows one to compute simulated ribo-
the master equation: some density profiles and protein production rates that can
dP(C, t) be compared to experimental outcomes. However, there is
= WC →C P(C , t) − WC→C P(C, t) , (1) an open debate regarding the estimates of these rates, and
dt C =C no direct experimental method to measure them exists. For
example, codon-specific translation elongation rates ki are
where WC→C is the rate of transition from C to C . We as-
often assumed to be proportional to the tRNA gene copy
sume that translation takes place in the stationary limit in
number (GCN) or to the local tRNA adaptation index
which case Equation (1) becomes a system of linear equa-
(tAI) (39–41).
tions,
Here we take a different approach and use the model to
0= WC →C P∗ (C ) − WC→C P∗ (C) . (2) quantitatively determine codon elongation rates from ribo-
C =C some profiling data. This is an inverse problem, since we need
to optimize the inputs (parameters ␣ and {ki }) in order to
The three main quantities of interest are the rate of match the outputs (Ribo-seq data). There are three main
translation J, which measures the amount of proteins pro- difficulties in solving this problem, which we discuss below.
duced per unit time, the local ribosome densities i , which
measures the probability of detecting a ribosome at codon i. The parameter space is extremely vast. A typical protein
i and total ribosome density , which measures the average consists of a several hundreds of amino acids, meaning
number of ribosomes per unit length of the transcript (in that one generally needs to optimize a comparable num-
codons). In the stationary TASEP, J, i and are defined ber of parameters.
as: ii. There is a complex non-linear relation between the set
of rates {ki } and the ribosome density profile. A change
1
L
J = kL τ L , ρi = τi , ρ= ρi , (3) in a single ki may affect a large part of the density profile.
L−1 iii. Ribosome density profile predicted by the stochastic
i =2
model depends only on the ratios between the elonga-
where averaging is performed with respect to the steady- tion rates and the initiation rate, meaning that it is not
state probability P* (C) and i is an occupation number possible to estimate absolute rates without integrating
whose value is equal to 1 if codon i is occupied by the A-site more information.
of the ribosome and is 0 otherwise. If we ignore premature
termination due to ribosome drop-off, then J is constant We now explain how our method tackles these problems
across the transcript and is equal to the actual rate at which and how it compares to existing methods that have been
ribosomes initiate translation, proposed to infer ribosome dynamics from ribosome pro-
+1
filing data (16,20,22,24).
∗
J = α P (first codons free) = α 1 − ρi , (4) Our method searches for optimal elongation rates at each
codon position and separately for every transcript, i.e. we do
i=2
not reduce the parameter space by assuming equal elonga-
where P (first codons free) is the steady-state probability
*
tion rates for every instance of the same codon (20,22). Im-
that codons 2, . . . , + 1 are not occupied by an A-site. portantly, we use an analytic expression for the ribosome
Computing these quantities requires an exact knowledge density profile that we recently derived in the initiation-
of P* (C), which is known only in the biologically unrealistic limited regime (12,27). This relationship allows for a quick
case of = 1 and uniform elongation rates (32). Instead, we computation of the ribosome density profile instead of run-
compute J, i and using two approximation methods: the ning costly stochastic simulations for every iteration of the
mean-field approximation developed in MacDonald et al. optimization process (16,22). Furthermore, we emphasize
(11,31) and initiation-limited approximation (ILA) devel- that our method infers intrinsic elongation rates (relative to
oped in Szavits-Nossan et al. (12,27). Details of these meth- the initiation rate) related to the ribosomal elongation cy-
ods are presented in Supplementary Data. cle, which may differ from the actual elongation rates that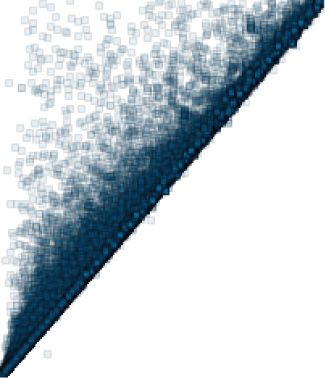
4 Nucleic Acids Research, 2020
Downloaded from https://academic.oup.com/nar/advance-article/doi/10.1093/nar/gkaa678/5895331 by guest on 16 September 2020
Figure 1. Sketch of the NEAR workflow for an individual gene (YAL007C). Experimental Ribo-seq profiles are first normalized and then analysed using
the stochastic model. The normalized ribosome density profile {ri } is represented in the bottom left panel. The model is shown in the top right box:
ribosomes covering sites are added to the lattice with an initiation rate ␣, provided that the first sites are not occupied by the A-site of another ribosome.
Ribosomes then move from site i to site i + 1 at rate ki provided that the A-site of the neighbouring ribosome downstream is at least sites away. Eventually,
ribosomes leave the lattice at rate  (kL = ) when their A-site is on the last site. In this drawing = 3 for clarity, whilst in our analysis we used = 10.
NEAR searches for the optimal elongation rates ki (relative to initiation rate ␣) for which the stochastic model reproduces the experimental ribosome
profile. Once we find the optimal rates, we examine the extent of ribosome traffic using the translation initiation and elongation efficiencies (TIE and TEE),
analyse the context dependence of elongation rates and identify problematic transcript regions in which Ribo-seq data are not consistent with the model.
also take into account slowing down due to ribosome traffic different absolute rates {ki } but the same relative speed
(24). Thus, we are able to detect separately the mean decod- profile {i }.
ing time for a particular codon and the mean time that the We now examine two approaches that have been pro-
ribosome spends waiting for a ribosome downstream of it posed to deal with this problem. The first approach is to fix
to move away. This distinction is central to our method. a unique timescale shared by all mRNAs, for instance the
Before we present further details of our method, we first average ribosome speed (42) or the average codon decoding
discuss the problem of estimating absolute elongation rates, time (24), which in turn allows one to estimate the initiation
which limits the amount of information that can be inferred rate for each gene. The second approach is to normalize i
from ribosome profiling data alone. by the average ribosome density for that gene. This is a
common practice in the analysis of Ribo-seq data, whereby
Ribosome profiles alone cannot estimate absolute elongation the ribosome footprint read densities on individual codons
rates are normalized by the average ribosome footprint density
for that gene. The scaled read density is then assumed to
We remind that the ribosome density i measures the prob- be independent of the initiation rate, allowing for differ-
ability of detecting a ribosome’s A-site at codon position ent genes to be compared. We argue that both of these ap-
i (see ‘Materials and Methods’ for further details). In the proaches are problematic. In the first approach, the average
Supplementary Data, we show that i depends only on the elongation rate or the average decoding time could be highly
ratios between the elongation/termination rates {kj } and variable from transcript to transcript, which in turn would
the initiation rate ␣–we will refer to these ratios as {j }. introduce a bias when comparing absolute elongation rates
Thus given the ribosome densities { j }, one can only in- between different genes. In the second approach, the nor-
fer the ratios {j }, but not the absolute rates {kj } and ␣. malization of i by does not necessarily mean that genes
Since the initiation rate ␣ is highly gene-dependent, it is with different initiation rates can be directly compared. We
not possible to compare the elongation-to-initiation ratios show that explicitly by computing i / in our model for dif-
{j } from different genes without the knowledge of ␣ for ferent initiation rates but keeping the elongation speed pro-
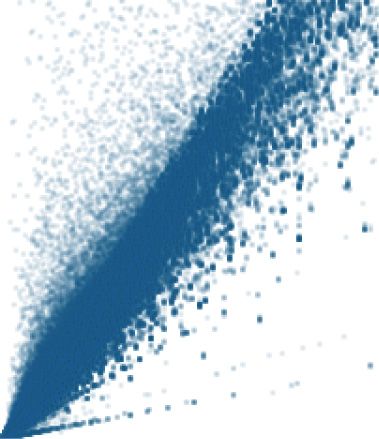
each gene. We demonstrate this point in Figure 2A, which file {ki } fixed. As shown in Figure 2B, we find qualitatively
shows the outcome of simulations of translation having different profiles for different initiation rates. This observa-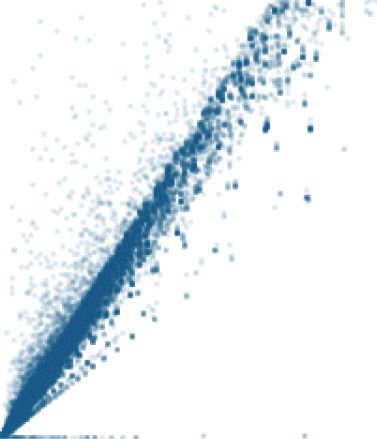
Nucleic Acids Research, 2020 5
A
Downloaded from https://academic.oup.com/nar/advance-article/doi/10.1093/nar/gkaa678/5895331 by guest on 16 September 2020
B
Figure 2. in silico density profiles. In panel (A), the black line shows the density profile obtained from the stochastic simulation of a transcript with a speed
profile {ki } and initiation rate α = 0.1/s. The shadowed region corresponds to the profile of a transcript simulated with a 10-fold larger initiation rate, but
keeping {i } constant (i.e. also increasing the elongation rates by a factor 10). This shows that densities obtained with the same elongation-to-initiation
ratios {i } are indistinguishable. In panel (B), we fix the speed profile {ki } for three different values of the initiation rate ␣ and we plot the rescaled profiles
i / . As expected, by increasing the initiation rate we obtain different profiles with increasing density and traffic effects.
tion is further supported by the analytic expression for i , is applicable to a wide range of initiation rates as long as
which predicts a non-linear ␣-dependent correction to the they are smaller than the elongation and termination rates
linear expression i ≈ ␣/ki (see Supplementary Data). (see Supplementary Data).
Instead, our approach is to scale i by the termination-to- We have applied our method to ribosome profiling data
initiation ratio L which removes dependence on the initia- of S. cerevisiae obtained by Guydosh et al. (14), Pop et al.
tion rate since i /L = ki /kL . Later we show that the values (20) and Weinberg et al. (23). These datasets were selected
of L inferred from ribosome profiling data in S. cerevisiae for their lack of using cycloheximide to inhibit translation
have amongst the least variation of all codons, which sup- elongation, which is known to distort ribosome coverage
ports our choice for L as the scaling factor. In addition, profiles (43,44). The raw data was processed by the Riboviz
we introduce new measures of translation efficiency and ri- software (28) and mapped to A-site positions following the
bosome traffic that take values between 0 and 1 and can be table provided in Ahmed et al. (29). After obtaining the A-
compared between different genes. site read density profiles the method proceeded in four steps,
which we summarize below.
Non-equilibrium analysis of Ribo-seq (NEAR) i. We first normalized the number of A-site reads on each
After we have shown that the ribosome density profile alone codon by the total number of reads mapped to the tran-
can inform us only on the ratios {i } between the elonga- script. This number was then multiplied by the absolute
tion rates and the initiation rate, we now turn to the method ribosome density for that particular gene obtained by
for inferring {i } from Ribo-seq. We call the method non- polysome profiling experiments in MacKay et al. (30).
equilibrium analysis of Ribo-seq data (NEAR) because the The end result is a normalized ribosome density pro-
model (the TASEP) that we use is borrowed from non- file {ri } that reveals how likely is to find a ribosome at
equilibrium statistical mechanics. codon i.
NEAR infers {i } with an optimization procedure that ii. Next, we solved a least-squares optimization problem
aims to find a model-predicted density profile { i } which which consisted in finding {i } that minimize the ob-
is a close match to the experimental one {ri } (see Figure 1). jective function:
This is possible since we have recently found a mathematical
L
ILA 2
expression for the ribosome density profile in terms of trans- S= ρi ({κi }) − ri . (5)
lation initiation, elongation and termination rates. This ex- i =2
pression was obtained under the assumption of a limiting
initiation rate ␣ (12,27), which is supposed to hold for most Here ρiILA is the model-predicted ribosome density in
of the mRNAs under physiological conditions (see Supple- the ILA. The starting point for optimization were {i }
mentary Data). However, we emphasize that the ILA does obtained from the mean-field solution of the exclusion
not assume that ribosome collisions are absent. Instead, our process. Details of ρiILA and the mean-field solution are
analytic solution takes ribosome collisions into account and presented in Supplementary Data.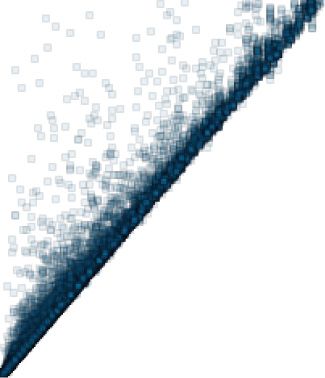
6 Nucleic Acids Research, 2020
iii. Once we found the best estimate of {i }, we then com- using Ribo-seq data from the Weinberg dataset (23). We
puted the exact density profile from stochastic simula- first compute the normalized experimental density profile
tions using the estimated {i }. We note that the simu- {ri } using the experimental absolute density r from MacKay
lated density may be different from the analytic density et al. (30) (in units of ribosomes/codon). This profile is
if the initiation rate is too high, which we checked in the then analysed following the method explained in the pre-
next step. vious section. A set of elongation-to-initiation ratios {i }
iv. In the last step we performed two quality checks on each is obtained by optimizing the match between the model-
i obtained by least-squares optimization: predicted density profile and the experimental one. Each i
(a) We first verified that the ILA was applicable by is then examined to see whether it provides a good predic-
Downloaded from https://academic.oup.com/nar/advance-article/doi/10.1093/nar/gkaa678/5895331 by guest on 16 September 2020
comparing the analytic density with the simulated tion for that particular codon position and to check for in-
one. This step is necessary because our solution of consistencies in the method as previously explained. There
the model is approximate and may not be valid if the are few values of i that do not pass this quality check,
initiation rate is too high, see Refs. (12,27) and also which are rejected and are not included in the final anal-
the Supplementary Data. We accepted i if the rel- ysis. This is a typical example, though for some genes the
ative error between the analytic and simulated den- fraction of rejected codons is substantial and our inference
sity was smaller than 10 %. If not, we repeated the procedure may be less reliable. We will come back to this
check using the value of i obtained in the mean- point later.
field approximation. In Figure 3A we plot the optimized {i } profile that
(b) For those i that passed the previous check, we ver- passed the quality check (blue line, triangle markers) com-
ified that the simulated density reproduced the ex- pared to the naive estimate 1/ri (orange line, round marker)
perimental density ri (within 5% tolerance). that ignores ribosome interference but it is usually judged
as a good estimator of the elongation rate. We find many
These are the main steps of NEAR, and we provide fur- codon positions where the two profiles {i } and {1/ri } sig-
ther mathematical details in the Supplementary Data. nificantly differ from each other. Moreover, we identify val-
We emphasize the importance of optimizing the absolute ues of i that are not consistent with the model, whilst this
ribosome densities { i } (step 2), rather than the scaled ones, cannot be done when using {1/ri } as a proxy for elongation
{ i / }, as in other methods that analyse ribosome profil- determinants.
ing data (16,20). The problem is that { i / } remains the The result of a stochastic simulation of ribosome dynam-
same if we multiply all i by a constant factor, which in ics performed with the optimized elongation ratios {i } is
turn means that different density profiles { i } can result in shown in Figure 3B. The agreement between the simulated
the same scaled profile { i / }. Since each i is uniquely de- density profile {ρisim } (green line) and the experimental one
termined by the set of elongation-to-initiation ratios {i }, (in blue) is excellent for most of the codons. The inset shows
we conclude that the scaled density profile { i / } does not the scatter plot between the values (for each codon) of the
uniquely determine {i }, see for instance Supplementary simulated and experimental ribosome density.
Figure S2. Thus, we reiterate that ribosome profiling data
are not sufficient to infer ribosome dynamics and in turn the
extent of ribosome traffic without the additional informa- Estimate of elongation-to-initiation ratios at codon resolution
tion on the mean number of ribosomes bound per mRNA in yeast
(step 1). We analysed three different datasets (14,20,23) and gath-
Our quality check in step 4 is also able to reject codons ered the NEAR elongation-to-initiation ratios {i } for each
whose i cannot be trusted, and identify why the inference gene. The percentage of codons that passed the quality
of elongation rates for those codons is problematic. Impor- check (points 4(a) and (b)) for the Weinberg, Pop and Guy-
tantly, we are able to distinguish whether our analytic solu- dosh datasets is 75, 66 and 44%, respectively. These are the
tion is satisfied or not (point 4(a)), or if the problem is due percentages of the total number of analysed codons, i.e.
to the model being inconsistent with the experimental data without taking into account different transcript lengths.
(point 4(b)). We also computed the percentage of rejected codons for
Before moving on to real sequences of S. cerevisiae, we each transcript. The percentages of codons that were re-
tested NEAR on a mock sequence with known {ki } (Sup- jected at point 4(a) have a median value of 2.3% (Weinberg),
plementary Figure S3a), and checked that it can accurately 3.8% (Pop) and 8.2% (Guydosh). The respective medians
infer the original elongation rates provided the initiation for the percentages of codons that passed 4(a) but were re-
rate is not too high (Supplementary Figure S3b and c). We jected at point 4(b) are 9.5, 16 and 26.7%. Again, the best
also remark that the quality check allows us to push the fit is achieved for the Weinberg dataset.
analysis to relatively high initiation rates (Supplementary We note that our analysis included only transcripts with
Figure S3d). In those cases, however, the number of rejected large number of reads per codon (10 or more), i.e. with high
codons may become significant. For a very high initiation ribosome traffic. If we had analysed all transcripts, the per-
rate we expect the ILA to fail in which case NEAR resorts centage of accepted codons would have been higher. How-
to the mean-field approximation, whose estimates are fur- ever, many transcripts with low read count have codons with
ther verified. zero reads, which are difficult to handle in the model as they
imply unphysically large elongation speed.
Using NEAR to study translation of individual genes. We We now turn to the codons that passed the quality check.
demonstrate our method on a particular gene (YLR301W) The estimated elongation-to-initiation ratios passing the
Nucleic Acids Research, 2020 7
A Next, we wanted to understand if each codon type has
a characteristic decoding time and verify or reject a com-
mon hypothesis that elongation rates are determined by the
availability of aminoacyl-tRNAs. By definition, i is equal
to the ratio ki /␣ between the elongation rate of codon i
and the initiation rate ␣ of the gene. Because the initiation
rates are likely to be gene-specific, we do not know if the
observed variation in elongation-to-initiation ratios of the
same codon types (see Supplementary Figure S4) is due to
Downloaded from https://academic.oup.com/nar/advance-article/doi/10.1093/nar/gkaa678/5895331 by guest on 16 September 2020
variation in the elongation or initiation rates.
However, we observe that STOP codons show the least
variability of all the elongation-to-initiation ratios {i } in
the Guydosh and Weinberg datasets (Supplementary Fig-
ure S4). This result is consistent with the expectation of a
B context-independent termination. Thanks to this observa-
tion, we then compute the elongation-to-termination ratio
i /L = ki /, i.e. the elongation rate of codon i with respect
to the termination of the gene under investigation (Supple-
mentary Figure S5). This quantity does not depend on the
initiation rate ␣ that is likely to be context-dependent and
different from gene to gene. Indeed, the variation in i /L
linked to the same codon type is now more uniform across
61 codon types, especially in the Guydosh dataset (Supple-
mentary Figure S5). We have also compared median val-
ues of i /L for each codon type against two common mea-
sures of tRNA availability: a codon-dependent rate of trans-
lation based on the tRNA GCN corrected for the wobble
base pairing from Weinberg et al. (23), and the tAI (45). We
find a moderate correlation between the median of the i /L
Figure 3. Results of NEAR applied to the YLR301W gene. (A) The opti- distributions and the corresponding tRNA GCNs (Supple-
mized profile {i } is plotted (triangle markers) as a function of the codon
position i, and compared to the naive estimates {1/ri } (round marker). In mentary Figure S6). This result suggests that the elongation
panel (B), we compare the model-predicted density profile obtained using speed of individual codons is only partially determined by
the inferred {i } (lighter line) with the experimental normalized profile their codon type.
{ri }. The inset shows the scatter plot between the two densities (for each We now turn to ribosome traffic and its impact on trans-
codon i) demonstrating an excellent agreement between theory and exper-
iments.
lation efficiency. In the following sections we will define
quantities that, contrary to the i , can be used to compare
translation efficiency of different genes. Those quantities,
quality check are plotted in Figure 4 and compared to the which we name the translation initiation efficiency (TIE)
naive estimates 1/ri . In particular, we find many instances and the translation elongation efficiency (TEE), can be used
where 1/ri deviates from i obtained by NEAR. The model to rank initiation of different transcripts and quantify the
predicts that i ≈ 1/ri if there are very few ribosomes on the impact of ribosome interference along a mRNA.
transcript so that ribosome collisions are rare. Our findings
in Figure 4 thus suggest that the effect of ribosome interfer-
Translation Initiation Efficiency (TIE)
ence is not negligible. We will discuss this point later when
we introduce better measures for detecting ribosome inter- By running stochastic simulations with the inferred i we
ference. can measure the ribosomal current J divided by the initia-
Figure 4. Scatter plot of the elongation-to-initiation i for each codon that passed the quality check versus the inverse of the experimental density 1/ri for
the Guydosh, Pop and Weinberg datasets. The dashed line corresponds to the bisect.
8 Nucleic Acids Research, 2020
A B C
Downloaded from https://academic.oup.com/nar/advance-article/doi/10.1093/nar/gkaa678/5895331 by guest on 16 September 2020
Figure 5. Histogram of estimated TIE for all Saccharomyces cerevisiae genes included in our study for the Guydosh, Pop and Weinberg datasets. The TIE
gives the probability that the first codons are unoccupied.
tion rate ␣, which is a quantity dependent on {i } only; the the total time ti (total) that a ribosome spends with its A-
current J can be used as a proxy for protein synthesis rate site on a given codon i can be seen as the sum of two
per mRNA. contributions: the time ti (intrinsic) needed to decode this
In the biological literature translation initiation is often codon and incorporate the new amino acid to the growing
identified with protein synthesis rate, i.e. J = ␣. However peptide chain, plus the time ti (collision) spent in a queue
this is true only if initiation is much slower than elongation waiting for the downstream ribosome to move. For each
so that essentially only one ribosome is translating a tran- codon i, ti (total) = ti (intrinsic) + ti (collision). The inverse
script at a given time. Yet, this approximation is too crude to of ti (total) is the actual elongation rate, whilst the inverse of
quantitatively describe translation (12). Instead, when more ti (intrinsic) is the intrinsic elongation rate ki , i.e. the elon-
than one ribosome is engaged in translation, J becomes a gation rate in the absence of other ribosomes. The distinc-
function of ␣ and the elongation rates {ki }; the current J tion between these two rates is important because the ac-
can be thought of as the intrinsic initiation rate ␣ multi- tual elongation rates may be much smaller than the intrin-
plied by the probability that the first codons of the mRNA sic ones in genes with higher initiation rates in which ri-
are not occupied by another ribosome (which would other- bosomal collisions are more likely. Thus analysing the ac-
wise obstruct initiation). tual instead of intrinsic elongation rates could obscure our
Therefore we propose to use J/␣ as a measure of the TIE, search for the molecular determinants of the translation
which takes values between 0 and 1. The TIE would be equal speed.
to 1 in the optimal case in which initiation is not hindered by We consider a codon as efficient if a ribosome attempting
ribosome traffic (J = ␣, hence TIE = 1). Otherwise, the TIE to translate it is not blocked by other ribosomes. We thus de-
gives the probability that the first codons, potentially inter- fine the TEE at codon i (TEEi ) as the ratio of intrinsic and
fering with ribosome recruitment and initiation, are unoc- total time: TEEi = ti (intrinsic)/ti (total), or put differently,
cupied. A TIE smaller than 0.5 means that more than half as the ratio between the actual and intrinsic elongation rate.
of the times a new ribosome tries to initiate, it fails because The TEEi is a measure of the local mRNA congestion seen
of another ribosome whose A-site is located within the first by a ribosome translating the codon i and it depends on the
10 codons. In Figure 5 we plot the histograms of TIE for context at which the codon is placed. Mathematically, it is
all the genes and datasets included in our study. We find equivalent to the probability that the i + 1. . . i + codons
that almost all genes show TIE > 0.5 with a median value are not occupied, given that a ribosome’s A-site is at site
around 0.8 for all the datasets. These values suggest that the i. If the intrinsic decoding time of the ribosome is equal to
first codons are mainly free from ribosomes that are already the total time dwelt on the codon, then the ribosome experi-
engaged in translation. ences on average no interference with other ribosomes and
Our previous theoretical work on the exclusion process TEEi = 1. Otherwise, 0 < TEE 0.5 is a strong signature thermore there is a relationship between the TEEi and TIE
that the codon sequences, and in particular the first codons given by TEEi = TIE/(i i ). Further details are given in
of S. cerevisiae genes might have been selected to optimize Supplementary Data.
translation initiation. We note that the TEEi is a function of {i } only, mean-
ing that ribosome interference is governed by the balance
Translation elongation efficiency (TEE) shows congestion of between initiation and elongation rates. A TEE profile that
ribosomes in vivo is close to 1 means that initiation is not frequent enough to
cause ribosome congestion along the transcript. Inferring
In contrast to the TIE, we define an efficiency index for TEE profile from ribosome profiling data is thus a conve-
translation elongation that identifies local ribosome inter- nient method for testing whether translation is limited by
ference along the transcript and not only around the ini- initiation. We also stress that both the TIE and TEEi are
tiation region. In order to do that, we emphasize that dimensionless quantities that take values between 0 and 1.
Nucleic Acids Research, 2020 9
A B If the ribosome density on a given transcript is high, one
would expect to see an increased number of ribosomal colli-
sions resulting in the TEE profile that clearly deviates from
1. In Figure 7 we present the mean of the TEE profile for
each gene that we analysed compared to the ratio of the
ribosome density for that gene and the maximum achiev-
able density ρ max = 1/, where ≈ 10 codons is the ribo-
some footprint length. The results across all three Ribo-seq
C D datasets clearly show that genes with low ribosome density
Downloaded from https://academic.oup.com/nar/advance-article/doi/10.1093/nar/gkaa678/5895331 by guest on 16 September 2020
have the mean TEE very close to 1 (few collisions). On the
other hand, the mean TEE of genes with high ribosome den-
sity deviates significantly from 1 (many collisions).
Another way to demonstrate the importance of ribosome
collisions is to directly estimate ti (collisions). Since the total
time spent on a codon is given by ri divided by the ribosomal
current, we obtain:
ri 1
E α ti (collisions) = − . (6)
TIE κi
The time spent in traffic on codon i is then larger than zero if
ri /TIE > 1/i and equal to zero only if there is no ribosome
interference. In the second row of Figure 7 we show that
many of the codons analysed deviate from the bisect. This
is another quantitative evidence that, according to experi-
mental data, it is not that rare to observe ribosomes queuing
in vivo.
Initiation and elongation interdependence
After observing that TEE is generally close to its optimum
value of 1, we now look for spatial distribution of the TEEi
along the transcripts. To this end we compute a metagene
TEE profile by aligning the genes at their START codon and
computing the distributions of the TEEi at each position i.
We then take the median of the distribution on each codon.
Figure 6. Panels (A–D) show single-gene TEE profiles (randomly selected The results are plotted in Figure 8A. This genome-averaged
genes from Weinberg dataset). Each point represents a codon, blue lines
connects adjacent codons. Isolated points mean that their neighbouring
profile confirms our earlier observation that TEE is close to
codons have been rejected. In panel (E) we plot the distributions of the 1. However, we also observe that the first ∼10 sites have a
TEE collected on all codons of the three datasets analysed. The dashed larger elongation efficiency. A large value of TEE around
vertical lines represent the median of those distributions (Guydosh: 0.988, the START codon helps to clear this region from queue-
Pop: 0.988, Weinberg: 0.990). ing ribosomes and thus facilitates ribosome recruitment (see
also Relationship between TIE and TEE in Supplementary
Data). This result is consistent with a large value of TIE
previously observed in Figure 5, and it confirms the impor-
Therefore it is possible to compare the TIE and TEE pro- tance of the beginning of the coding sequence in controlling
files between different genes. translation.
In Figure 6A–D we plot the TEE profile of four randomly Our results seem to suggest that TIE and TEE should be
selected genes. We observe that the TEE is typically close strongly related. On the one hand, if translation initiation is
to 1 indicating that traffic is negligible for most of codons. efficient but elongation is inefficient, ribosome interference
We also identify particular codons where ribosome inter- would dominate and ribosomal resources would be wasted.
ference is significant and TEEi drops to 0.6. These exam- On the other hand, effective elongation and weak initiation
ples demonstrate that NEAR can locate, at codon resolu- would still finely tune the overall protein production with-
tion and excluding unreliable estimates, particular regions out harming cellular fitness. Following these considerations,
on the transcript that are affected by ribosome interference. from the evolutionary point of view there should exist a con-
After analysing TEE profiles of all genes included in our straint between the relative weights of initiation and elonga-
study, we observe that the distribution of TEEi for all the tion, and a situation with strong initiation and weak elon-
codons that passed the NEAR quality check is peaked at gation should be avoided.
1, with the median at about 0.99, as shown in Figure 6E. We can roughly evaluate the overall elongation efficiency
This result is consistently found in all three datasets that we as the mean of the TEEi profile of each gene, and thus as-
analysed, suggesting that ribosome interference is present sociate a couple of values (TIE, mean TEE) to each gene
only locally on a few codons, and is generally absent in vivo. analysed. In Figure 8B we observe that the constraint TIE10 Nucleic Acids Research, 2020
A
Downloaded from https://academic.oup.com/nar/advance-article/doi/10.1093/nar/gkaa678/5895331 by guest on 16 September 2020
B
Figure 7. In the first row (A) we show the ribosome density normalized with the maximal density ρ max versus the mean value of TEE along the transcript.
In the second raw (B) we plot TIE/ri versus i to emphasize the extent of traffic in determining the ribosome’s dwelling time. The orange dashed line is the
bisect TIE/ri = i (no traffic). Codons far from that line are the ones more impacted by ribosome interference.
A < mean TEE is satisfied for most of the genes analysed (only
a few exceed the TIE = mean TEE dashed line, and for very
initiation-efficient genes); thus the data analysed are con-
sistent with the hypothesis explained above. We also notice
that transcripts with inefficient initiation might also present
a less optimized elongation, suggesting that initiation and
elongation are interdependent.
DISCUSSION
In this work we introduce NEAR, which is based on a well-
studied model borrowed from statistical physics. The model
tracks individual ribosomes engaged in translation and pre-
dicts their spatial distribution on the mRNA and the rate of
protein synthesis using initiation, elongation and termina-
tion rates as input parameters. Here we do the opposite––we
B develop a method that infers elongation-to-initiation ratios
at codon resolution directly from ribosome profiling data.
We first emphasize that Ribo-seq profiles, being an av-
eraged snapshot of the translatome, do not contain infor-
mation on the absolute timescales of the process and that
thus it is possible to estimate relative rates only. These rates
uniquely determine the density profile and allow us to eval-
uate the extent of ribosome traffic along the transcript and
show a possible interplay between initiation and elongation.
To this end we introduce new measures of translation effi-
ciency that we named translation initiation and elongation
efficiencies (TIE and TEE, respectively). Importantly, both
TIE and TEE are dimensionless scores taking values be-
tween 0 and 1, which allows us to compare ribosome traffic
Figure 8. (A) TEE metagene profile. The full line is the median TEE profile
between different genes.
for three different datasets included in our study. Dotted lines delimiting TIE is defined as the probability that a ribosome attempt-
the shadow area correspond to the first and third quartiles of the distribu- ing to initiate translation is not obstructed by another ri-
tion. In panel (B), we show the scatter plot of the TIE and mean TEE of bosome on the coding sequence. The distribution of TIE
each gene in the Weinberg dataset. The dashed line represents mean TEE for the three datasets that we used in this study show that
= TIE. The analysis of the other datasets can be found in Supplementary
Figure S8. Points are coloured according to the fraction of codons passing ribosomes can easily access most transcripts, with the me-
the quality check. dian value of 0.8 for the probability to find the initiationNucleic Acids Research, 2020 11
region unobstructed (Figure 6). Yet, we find genes with low applications will probably not lead to the expected results.
TIE suggesting that the first codons can exert control over Instead, our findings indicate that codon context in the se-
protein synthesis through ribosome traffic interfering with quence is as relevant as the particular codon used, and fur-
translation initiation. These results are in line with recent ther studies should focus on the discovery of mechanisms
experimental evidence on ribosome stalling and traffic in giving rise to the codon context dependence. For instance,
the initiation region (17,46–47). mRNA secondary structures might be relevant, particularly
Similarly, TEEi is defined as the probability that a ribo- around the initiation region (49–51,53) or the amino-acid
some at codon position i is not blocked by another ribo- charge at the beginning of the coding sequence (42).
some downstream of i. The distribution of TEEi across all Our method has detected many codons at which the
Downloaded from https://academic.oup.com/nar/advance-article/doi/10.1093/nar/gkaa678/5895331 by guest on 16 September 2020
transcripts shows that TEEi is generally close to 1 suggest- model is incompatible with the ribosome profiling data, par-
ing that ribosome interference is negligible for most codons ticularly for genes for which we estimated high level of ri-
(Figure 6E). However, when looking at the individual gene bosome interference (see for instance Supplementary Fig-
TEE profiles, we observe that it is not so rare to find the ure S7). One possibility is that our results are affected by
probability of ribosome interference as high as 50% (Fig- known biases during the bioinformatic analysis (54). An-
ure 6A–D). In accordance with these results, we find more other source of inconsistency between the model and the
evidence of ribosome interference (lower TEE) in genes with data is possibly hidden in the nature of the ribosome profil-
higher ribosome density (Figure 7). We also compute the ing technique. Queuing ribosomes generate large footprints
average time ti (collisions) that each ribosome spends on a (14) that are usually discarded in the experimental pipeline.
codon due to the blockage of downstream ribosomes. If no Intuitively, one would expect that ribosome profiling dis-
traffic is present then ti (collisions) = 0. Instead, we observe carding large footprints would be insensitive to ribosome
many codons for which ti (collisions) > 0 (Figure 7). interference. However, we note that the model is able to cap-
The fact that the value of TEE at each codon must fall ture correlations between ribosomes that are not immedi-
between 0 and 1 allows us to agglomerate all values of TEE ately adjacent to each other. A recent theoretical study by
into a ‘metagene’ profile (Figure 8). Interestingly, the me- Scott and Szavits-Nossan (48) showed that a slow codon af-
dian TEE shows slightly higher values at the first 10 codons, fects ribosome density over multiple codons, although the
suggesting that queuing is avoided in order to allow for ef- effect subsides with the distance from the slow codon. In-
ficient ribosome recruitment at the start codon. This re- deed, NEAR finds evidence of local jamming despite the
sult is consistent with a recent study in which replacing the experimental bias that discards jammed ribosomes. We re-
first eight codons with their slower synonymous variants mark that the high TIE and TEE values at the first 10
significantly reduced protein expression without affecting codons could also be attributed to the nature of Ribo-seq
mRNA levels (46). Furthermore, the first codons have been that exclude disome footprints; a recent study by Diament
recognized as critical in determining protein synthesis both et al. (17) in fact showed that the largest concentration of
theoretically (12–13,48) and experimentally (47,49–51). Be- disomes in S. cerevisiae is at the first 10 codons.
yond the first 10 codons, the metagene profile of TEE fur- Finally, we note that some transcripts show a significant
ther reveals a small but noticeable drop between codons 10 number of rejected codons whose estimated i cannot be
and 20, followed by a slow increase between codons 20 and considered reliable (see Supplementary Figure S1). In those
100. These results are consistent with the ‘ramp hypothe- cases the best estimate we have for i is the mean-field
sis’ proposing that rare codons are more frequent at the be- approximation that neglects correlations between closely
ginning of genes in order to avoid ribosome traffic further spaced ribosomes. Consequently, TIE and TEE may be-
along the transcript (52). come less reliable, too. Interestingly, transcripts with many
All together, our results indicate that translation initia- rejected codons generally display low values of TIE and
tion is slow compared to elongation (all i = ki /␣ < 1) and mean TEE (Figure 8B). There seems to be a connection be-
the coding sequence interfering with initiation is cleared ef- tween how well the TASEP fits the ribosome profiling data
ficiently (median TIE at 0.8). We also find that translation and the extent of ribosome traffic that needs further inves-
elongation is largely optimized to avoid traffic (median TEE tigation.
at 0.99), although one can locally observe high levels of ri- To summarize, we have developed a model-based method
bosome interference. Interestingly, despite variations in TIE for inferring codon-specific elongation rates (relative to the
between genes (Figure 5), elongation remains consistently initiation rate) from ribosome profiling data. In addition,
more efficient than initiation (mean TEE > TIE, Figure 8). we have proposed new measures of translation initiation
It is possible that the relative role of elongation and initia- and elongation efficiencies that quantify the extent of ribo-
tion is under evolutionary pressure to allow for an efficient some traffic in vivo and can be used to compare different
ribosome recruitment and to avoid ribosome interference genes and experimental conditions. We believe these new
for efficient transition from initiation to elongation (52). scores will complement the standard indices of translation
Perhaps the most surprising result of our study is the vari- efficiency and will contribute to the understanding of this
ability of the inferred elongation-to-initiation ratios i . We complex biological process.
can affirm that there is a correlation between common in- Despite the tremendous importance and potential of ri-
dices of codon optimality, such as the local tAI, and the es- bosome profiling, our work emphasizes its limitations when
timated elongation-to-initiation ratios (see Supplementary deciphering translation dynamics such as the lack of quan-
Figure S6). However, the large variability of the estimated tification in physical units and the lack of absolute time
rates of each individual codon type implies that using those scales. These challenges have been recognized and steps
indices for protein synthesis optimization or other synthetic have been made recently to combine Ribo-seq with other12 Nucleic Acids Research, 2020
methods for absolute quantification such as RNA-seq with 15. Li,G.W. (2015) How do bacteria tune translation efficiency? Curr.
spike-ins (1) and pulsed stable isotope labelling of amino Opin. Biotech., 24, 66–71.
16. Dao Duc,K. and Song,Y.S. (2018) The impact of ribosomal
acids (18). Future developments of NEAR will include interference, codon usage, and exit tunnel interactions on translation
these data to obtain a more detailed view on translation elongation rate variation. PLoS Genet., 14, e1007166.
dynamics. Another key question that quantitative studies 17. Diament,A., Feldman,A., Schochet,E., Kupiec,M., Arava,Y. and
using ribosome profiling should address in the future is the Tuller,T. (2018) The extent of ribosome queuing in budding yeast.
role of density normalization in order to better compare the PLOS Comput. Biol., 14, e1005951.
18. Riba,A., Di Nanni,N., Mittal,N., Arhné,E., Schmidt,A. and
outcome of different genes and of different organisms. Zavolan,M. (2019) Protein synthesis rates and ribosome occupancies
reveal determinants of translation elongation rates. Proc. Natl. Acad.
Downloaded from https://academic.oup.com/nar/advance-article/doi/10.1093/nar/gkaa678/5895331 by guest on 16 September 2020
Sci. U.S.A., 201817299.
SUPPLEMENTARY DATA 19. Siwiak,M. and Zielenkiewicz,P. (2010) A comprehensive, quantitative,
and genome-wide model of translation. PLOS Comput. Biol., 6,
Supplementary Data are available at NAR Online. e1000865.
20. Pop,C., Rouskin,S., Ingolia,N.T., Han,L., Phizicky,E.M.,
Weissman,J.S. and Koller,D. (2014) Causal signals between codon
ACKNOWLEDGEMENTS bias, mRNA structure, and the efficiency of translation and
elongation. Mol. Syst. Biol., 10, 770.
We would like to thank Guillaume Cambray and Edward 21. Gardin,J., Yeasmin,R., Yurovsky,A., Cai,Y., Skiena,S. and Futcher,B.
Wallace for useful discussions. (2014) Measurement of average decoding rates of the 61 sense codons
in vivo. eLife, 3, e03735.
22. Gritsenko,A.A., Hulsman,M., Reinders,M.J.T. and de Ridder,D.
FUNDING (2015) Unbiased quantitative models of protein translation derived
from ribosome profiling data. PLOS Comput. Biol., 11, e1004336.
Leverhulme Trust, Early Career Fellowship [ECF-2016-768 23. Weinberg,D.E., Shah,P., Eichhorn,S.W., Hussmann,J.A., Plotkin,J.B.
to J.S.N.]; Centre National de la Recherche Scientifique, and Bartel,D.P. (2016) Improved ribosome-footprint and mRNA
Défi InPhyNiTi Exploratory Project (to L.C.). Funding for measurements provide insights into dynamics and regulation of yeast
open access charge: None/Departmental Resources. translation. Cell Rep., 14, 1787–1799.
24. Sharma,A.K., Sormanni,P., Ahmed,N., Ciryam,P., Friedrich,U.A.,
Conflict of interest statement. None declared. Kramer,G. and O’Brien,E.P. (2019) A chemical kinetic basis for
measuring translation initiation and elongation rates from ribosome
profiling data. PLOS Comput. Biol., 15, e1007070.
REFERENCES 25. Sin,C., Chiarugi,D. and Valleriani,A. (2016) Quantitative assessment
1. Gorochowski,T.E. and Ellis,T. (2018) Designing efficient translation. of ribosome drop-off in E. coli. Nucleic Acids Res., 44, 2528–2537.
Nat. Biotechnol., 36, 934–935. 26. Bonnin,P., Kern,N., Young,N.T., Stansfield,I. and Romano,M.C.
2. Ingolia,N.T., Ghaemmaghami,S., Newman,J.R.S. and Weissman,J.S. (2017) Novel mRNA-specific effects of ribosome drop-off on
(2009) Genome-wide analysis in vivo of translation with nucleotide translation rate and polysome profile. PLOS Comput. Biol., 13,
resolution using ribosome profiling. Science, 324, 218–223. e1005555.
3. Steitz,J.A. (1969) Polypeptide chain initiation: nucleotide sequences 27. Szavits-Nossan,J., Romano,M.C. and Ciandrini,L. (2018) Power
of the three ribosomal binding sites in bacteriophage R17 RNA. series solution of the inhomogeneous exclusion process. Phys. Rev. E,
Nature, 224, 957–964. 97, 1–13.
4. Kozak,M. (1981) Possible role of flanking nucleotides in recognition 28. Carja,O., Xing,T., Wallace,E.W., Plotkin,J.B. and Shah,P. (2017)
of the AUG initiator codon by eukaryotic ribosomes. Nucleic Acids Riboviz: analysis and visualization of ribosome profiling datasets.
Res., 9, 5233–5252. BMC Bioinformatics, 18, 461.
5. Wolin,S.L. and Walter,P. (1988) Ribosome pausing and stacking 29. Ahmed,N., Sormanni,P., Ciryam,P., Vendruscolo,M., Dobson,C.M.
during translation of a eukaryotic mRNA. EMBO J., 7, 3559–3569. and O’Brien,E.P. (2019) Identifying A- and P-site locations on
6. Brar,G.A. and Weissman,J.S. (2015) Ribosome profiling reveals the ribosome-protected mRNA fragments using Integer Programming.
what, when, where and how of protein synthesis. Nat. Rev. Mol. Cell Sci. Rep. (2019), 9, 6256.
Biol., 16, 651–664. 30. MacKay,V.L., Li,X., Flory,M.R., Turcott,E., Law,G.L.,
7. Fritsch,C., Herrmann,A., Nothnagel,M., Szafranski,K., Huse,K., Serikawa,K.A., Xu,X.L., Lee,H., Goodlett,D.R., Aebersold,R. et al.
Schumann,F., Schreiber,S., Platzer,M., Krawczak,M., Hampe,J. et al. (2004) Gene expression analyzed by high-resolution state array
(2012) Genome-wide search for novel human uORFs and N-terminal analysis and quantitative proteomics: response of yeast to mating
protein extensions using ribosomal footprinting. Genome Res., 22, pheromone. Mol. Cell. Proteomics, 3, 478–89.
2208–2218. 31. MacDonald,C.T. and Gibbs,J.H. (1969) Concerning the kinetics of
8. Calviello,L., Mukherjee,N., Wyler,E., Zauber,H., Hirsekorn,A., polypeptide synthesis on polyribosomes. Biopolymers, 7, 707–725.
Selbach,M., Landthaler,M., Obermayer,B. and Ohler,U. (2016) 32. Derrida,B., Evans,M.R., Hakim,V. and Pasquier,V. (1993) Exact
Detecting actively translated open reading frames in ribosome solution of a 1D asymmetric exclusion model using a matrix
profiling data. Nat. Methods, 13, 165–170. formulation. J. Phys. A: Math Gen., 26, 1493–1517.
9. Dunn,J.G., Foo,C.K., Belletier,N.G., Gavis,E.R. and Weissman,J.S. 33. von der Haar,T. (2012) Mathematical and computational modelling
(2013) Ribosome profiling reveals pervasive and regulated stop codon of ribosomal movement and protein synthesis: an overview. Comput.
readthrough in Drosophila melanogaster. eLife, 2, e01179. Struct. Biotechnol. J., 1, e201204002.
10. Guttman,M., Russell,P., Ingolia,N., Weissman,J. and Lander,E. 34. Zur,H. and Tuller,T. (2016) Predictive biophysical modeling and
(2013) Ribosome profiling provides evidence that large noncoding understanding of the dynamics of mRNA translation and its
RNAs do not encode proteins. Cell, 154, 240–251. evolution. Nucleic Acids Res., 44, 9031–9049.
11. MacDonald,C.T., Gibbs,J.H. and Pipkin,A.C. (1968) Kinetics of 35. Mitarai,N., Sneppen,K. and Pedersen,S. (2008) Ribosome collisions
biopolymerization on nucleic acid templates. Biopolymers, 6, 1–25. and translation efficiency: optimization by codon usage and mRNA
12. Szavits-Nossan,J., Ciandrini,L. and Romano,M.C. (2018) destabilization. J. Mol. Bio., 382, 236–245.
Deciphering mRNA sequence determinants of protein production 36. Reuveni,S., Meilijson,I., Kupiec,M., Ruppin,E. and Tuller,T. (2011)
rate. Phys. Rev. Lett., 120, 128101. Genome-scale analysis of translation elongation with a ribosome flow
13. Erdmann-Pham,D.D., Dao Duc,K. and Song,Y.S. (2020) The key model. PLoS Comput. Biol., 7, e1002127.
parameters that govern translation efficiency. Cell Syst., 10, 183–192. 37. Ciandrini,L., Stansfield,I. and Romano,M.C. (2013) Ribosome traffic
14. Guydosh,N. and Green,R. (2014) Dom34 rescues ribosomes in 3 on mRNAs maps to gene ontology: genome-wide quantification of
untranslated regions. Cell, 156, 950–962.You can also read