Spatial dynamics of Chinese Muntjac related to past and future climate fluctuations
←
→
Page content transcription
If your browser does not render page correctly, please read the page content below
Current Zoology, 2021, 1–10
                                                                                                                     doi: 10.1093/cz/zoaa080
                                                                                          Advance Access Publication Date: 11 January 2021
                                                                                                                            Original Article

Original Article

Spatial dynamics of Chinese Muntjac related to
past and future climate fluctuations

                                                                                                                                                                          Downloaded from https://academic.oup.com/cz/advance-article/doi/10.1093/cz/zoaa080/6081007 by guest on 04 May 2021
Zhonglou SUNa,§, Pablo OROZCO-TERWENGELb,§, Guotao CHENa,
Ruolei SUNa, Lu SUNc, Hui WANGa, Wenbo SHIa, and Baowei ZHANGa,*
a
 School of Life Sciences, Anhui University, Hefei, 230601, China, bSchool of Biosciences, Cardiff University, Cardiff,
CF103AX, UK, and cKey Laboratory for Plant Diversity and Biogeography of East Asia, Kunming Institute of Botany,
Chinese Academy of Sciences, Kunming, 650201, China
*Address correspondence to Baowei Zhang. E-mail: zhangbw@ahu.edu.cn.
§
 These authors contributed equally to this work.

Handling editor: Yanping Wang
Received on 26 July 2020; accepted on 16 December 2020

Abstract
Climate fluctuations in the past and in the future are likely to result in population expansions, shifts,
or the contraction of the ecological niche of many species, and potentially leading to the changes
in their geographical distributions. Prediction of suitable habitats has been developed as a useful
tool for the assessment of habitat suitability and resource conservation to protect wildlife. Here, we
model the ancestral demographic history of the extant modern Chinese Muntjac Muntiacus reevesi
populations using approximate Bayesian computation (ABC) and used the maximum entropy
model to simulate the past and predict the future spatial dynamics of the species under climate
oscillations. Our results indicated that the suitable habitats for the M. reevesi shifted to the
Southeast and contracted during the Last Glacial Maximum, whereas they covered a broader and
more northern position in the Middle Holocene. The ABC analyses revealed that the modern
M. reevesi populations diverged in the Middle Holocene coinciding with the significant contraction
of the highly suitable habitat areas. Furthermore, our predictions suggest that the potentially
suitable environment distribution for the species will expand under all future climate scenarios.
These results indicated that the M. reevesi diverged in the recent time after the glacial period and
simultaneously as its habitat’s expanded in the Middle Holocene. Furthermore, the past and future
climate fluctuation triggered the change of Chinese muntjac spatial distribution, which has great
influence on the Chinese muntjac’s population demographic history.

Key words: climate fluctuations, Middle Holocene, Muntiacus reevesi, spatial dynamics, suitable habitat

Herbivores are known to be strongly affected by environmental and                          forest-dwelling species, inhabiting mountainous terrain with good
subtle landscape changes, being particularly sensitive to extremely                        cover (Wang 1990; Sheng et al. 1992). IUCN categorizes the
cold temperatures and dry environmental conditions (Storfer et al.                         M. reevesi as of least concern (LC), however, they report a decreas-
2010; Sun et al. 2019), therefore making them ideal taxa for                               ing population trend throughout the species’ range with their habitat
studying how historical events affected their demographic history                          being threatened due to the development of residential and commer-
(Baker and Hoelzel 2014; Yannic et al. 2014; Jenkins et al. 2018).                         cial infrastructures, land conversion for agriculture, logging, and
The Chinese muntjac Muntiacus reevesi is a small deer widely                               direct hunting (IUCN Red List 2020, https://www.iucnredlist.org/).
distributed in Southern China and Taiwan (Sheng et al. 1992). It is a                      In a previous study, the demographic history of M. reevesi seems to

C The Author(s) (2021). Published by Oxford University Press on behalf of Editorial Office, Current Zoology.
V                                                                                                                                                                    1
This is an Open Access article distributed under the terms of the Creative Commons Attribution Non-Commercial License (http://creativecommons.org/licenses/by-nc/4.0/),
which permits non-commercial re-use, distribution, and reproduction in any medium, provided the original work is properly cited. For commercial re-use, please contact
journals.permissions@oup.com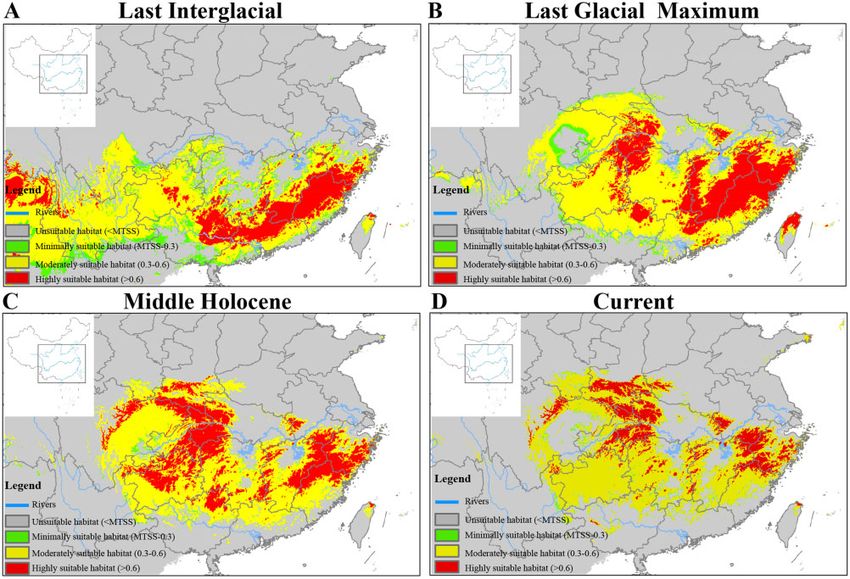
2                                                                                                           Current Zoology, 2021, Vol. 0, No. 0

indicate a concordance with the cycling of glacial–interglacials in         providing evidence about the peopling patterns of nomads and the
late Pleistocene, whereas the recent population history having been         expansion of early pastoralism in East Asia. Using a combination of
influenced by early anthropogenic activity (Sun et al. 2019).               whole-genome sequence data, Y-chromosomes, and mitochondrial
Southern China is a biodiversity hotspot in East Asia, harboring            genomes, Hu et al. (2020) provided the first comprehensive genetic
high levels of endemism and extensive biodiversity (He and Jiang            evidence for species divergence and long-term population bottlenecks
2014). It is necessary for us to understand how climate-driven effects      in red pandas Ailurus fulgens, demonstrating substantial inter-
on M. reevesi spatial dynamics and its early evolutionary history. In       species genetic divergence. In addition, using expressed sequence tag–
view of the spatial dynamics, together with the population evolu-           Simple Sequence Repeat (EST-SSR) nuclear markers, Erichsen et al.
tionary history, we predicted that M. reevesi may be an ideal model         (2018) found that the ash Fraxinus excelsior population divergence be-
mammal to test the hypotheses on how climate change can impact              tween European and Hyrcanian populations was dated back to the
species distribution modeling (SDM) in Southern China.                      end of the middle to Upper Pleistocene and the populations experi-

                                                                                                                                                        Downloaded from https://academic.oup.com/cz/advance-article/doi/10.1093/cz/zoaa080/6081007 by guest on 04 May 2021
    Climate-driven range fluctuations during the Late Pleistocene           enced a recent reduction in its effective population size. Because genet-
have continuously shaped species distributions, diversification pat-        ic data carries such a rich information about species old and recent
terns, and demographic dynamics (Hewitt 2000; Hewitt 2004;                  evolutionary history (e.g., Aitken et al. 2008; Taubmann et al. 2011;
Yannic et al. 2014). Contemporary climate change is similarly influ-        Hu et al. 2017; Liu et al. 2018; Liao et al. 2020), embedding that in-
encing species distributions and population structure, with import-         formation within management plans for species’ conservation is likely
ant consequences for species’ evolutionary potential (Araújo and           to have a positive effect and reduce extinction rates.
Rahbek 2006; Parmesan 2006; Morin and Lechowicz 2008; Beever                    In this study, we sampled M. reevesi along the Yangtze River and
et al. 2011; Comte et al. 2013; O’Brien et al. 2013). Furthermore,          used molecular markers combined with geographic information
human-induced environmental change and habitat fragmentation                system-based environmental niche analyses to better evaluate popula-
pose major threats to biodiversity and require active conservation          tion genetic differentiation processes and understand how historical
efforts to mitigate their consequences (Cincotta et al. 2000;               climate-induced species’ distributional shifts. First, we used ecological
Condamine et al. 2013; Sievers et al. 2018; Feng et al. 2019).              niche modeling (ENM), combined with paleoclimate data to infer his-
Therefore, identifying species vulnerable to climate change and the         torical causes for the distribution pattern of M. reevesi as well as we
extent of their vulnerability is vital for guiding effective conservation   used future climate predictions to define the species future distribution
efforts (Araújo and Rahbek 2006; O’Brien et al. 2013; Stanton et al.       under different climate scenarios. Second, we used statistical phylogen-
2015). Although Southern China was not glaciated, it also experi-           etic methods to test the M. reevesi’s population differentiation process.
enced cooler and possibly drier climates during the Pleistocene             The integrative analysis of population history and SDM enabled
(Williams et al. 1998; Li et al. 2004). In the context of climatic
                                                                            exploring the architecture of the evolutionary history and population
cycling, many species experienced periodic habitat expansions or
                                                                            dynamics of M. reevesi while shedding light on the ancient and future
contractions to meet their ecological requirements. For example,
                                                                            climate fluctuations in Southern China.
Feng et al. (2019) showed how the endangered crested ibis Nipponia
nippon expanded its range during the Last Interglacial (LIG, 120–
140 Kya) and retracted into small refugia during the Last Glacial           Materials and Methods
Maximum (LGM, 21 Kya) whereas Zhou et al. (2016) revealed
                                                                            Distribution records collection, sample collection
the suitable habitat of golden snub-nosed monkeys Rhinopithecus
                                                                            In this study, we collected the M. reevesi distribution records from pre-
roxellana expanded toward warmer Southern areas during the
                                                                            viously published data between 1976 and 2018 (Supplementary Table
LGM. Amphibians (Zhang et al. 2008; Blair et al. 2013; Yuan et al.
                                                                            S1). If samples only had localities available, Google Earth was used to
2016; Wei et al. 2020), as well as some plants (Qi et al. 2012; Tian
                                                                            infer the coordinates of the records at the center point of the locality.
et al. 2015; Ma et al. 2019), also exhibit such geographic range dis-
                                                                            Records with obvious geocoding errors were discarded, and duplicate
tribution changes during Late Pleistocene. However, several studies
                                                                            records were removed manually. Finally, a total of 226 records of M.
also detected unusual distribution modeling during the LGM
                                                                            reevesi in China were collected, resulting in a detailed distribution map
(Yannic et al. 2014; Pan et al. 2019b).
    Since the 1920s, population geneticists focus on species’ popula-       cover (Figure 1). What’s more, 360 skin samples of M. reevesi were col-
tion evolutionary history, their genetic structure, and how changes         lected from 7 populations as previously described (Sun et al. 2019).
in their effective population sizes modify genetic variation
(Templeton 1998; Condamine et al. 2013). The main aims of popu-             Data analysis
lation genetics are to characterize the distribution of genetic vari-       For forecasting the potential distribution shifts of M. reevesi under
ation within and among subpopulations of interbreeding organisms,           different climate scenarios (current, past, and future), we carried out
to study gene flow, genetic drift, mating systems, mutation, and nat-       ecological niche modelling using the MAXENT software (version
ural selection, etc. (Slatkin 1977; Templeton 1998; Tremblay and            3.4.1) that is widely applied to conservation research (Phillips et al.
Ackerman 2001). With the help of modern genetic techniques,                 2006). Compared with other methods, MAXENT has higher per-
population genetics has revealed complex demographic processes              formance, it is suitable for datasets consisting of presence-only
(Cornuet et al. 2014; Zhao et al. 2017; Liu et al. 2018; Hu et al.          recordings (Elith et al. 2006; Peterson et al. 2011), and it is
2019), as well as have helped characterizing the relationships among        insensitive to small sample sizes (Wisz et al. 2008). In this study, we
the alleles or haplotypes and their spatial distributions (Templeton        collected all reported M. reevesi records, which covered nearly all
1998; Zhou et al. 2016; Stucki et al 2017; Wei et al. 2020). For ex-        habitats for this species in China. For the current climate predic-
ample, using a combination of population genomic analyses, archeo-          tions, we downloaded raster coverages of 20 environmental varia-
logical records, and historical ethnic demographics data, Zhao et al.       bles (Supplementary Table S2) from the WorldClim database (http://
(2017) identified the genetic signatures of the origins, secondary          www.worldclim.org) at 2.5 arc-min resolution (Hijmans et al.
expansions, and admixtures in Chinese sheep Ovis aries, thereby             2005). To avoid multicollinearity of variables, we estimated the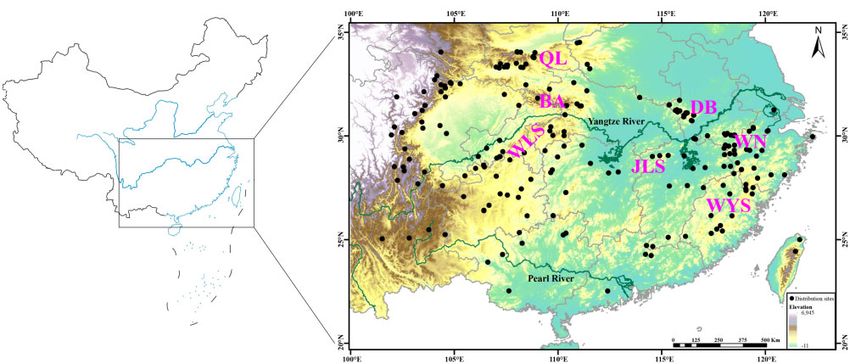
Sun et al.  Spatial dynamics of Chinese Muntjac                                                                                                     3

                                                                                                                                                          Downloaded from https://academic.oup.com/cz/advance-article/doi/10.1093/cz/zoaa080/6081007 by guest on 04 May 2021
Figure 1. Map showing the distribution sites and sampling location of Chinese muntjac in Southern China. QL, Qinling Mountains; BA, Dabashan Mountains;
WLS, Wulingshan Mountains; DB, Dabieshan Mountains; JLS, Jiulingshan Mountains; WN, Wannan Mountains; WYS, Wuyishan Mountains. The base maps are
from Standard Map Service website (http://bzdt.ch.mnr.gov.cn/index.html).

Pearson correlation coefficients for each pair of variables and               reclassified the suitability layer into 4 classes: unsuitable habitat
eliminated the variables with high correlation (jPearson rj  0.85;           (0.6) as Liao
we selected a subset of 9 variables with a correlation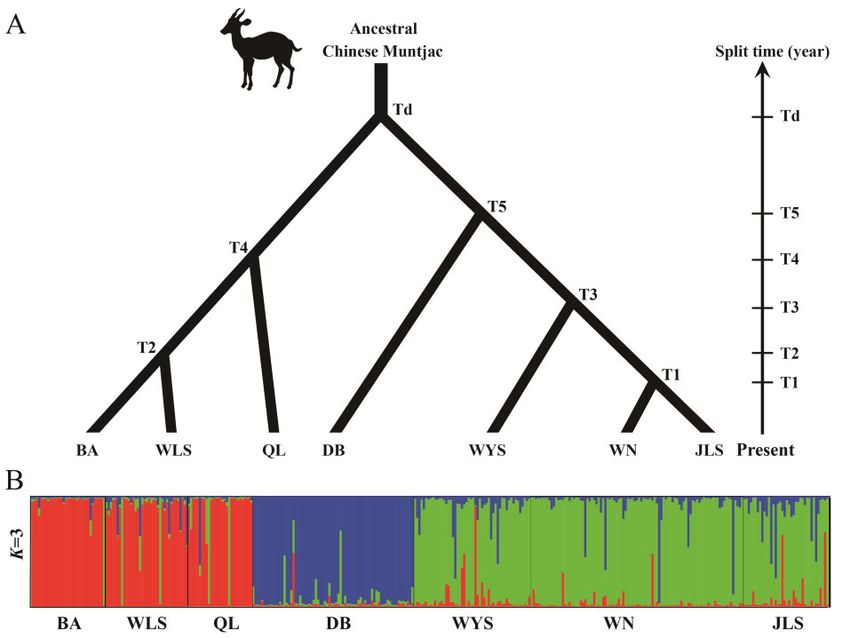
4                                                                                                             Current Zoology, 2021, Vol. 0, No. 0

implemented in DIY-ABC, and the most suitable model was used to               Results
estimate demographic parameters for the 7 populations (Ne) and the
                                                                              Historical dynamics of distributions
time of divergence between pairs of populations. A total of 100,000
                                                                              The ENMs had excellent predictive power for occurrences under
simulations were carried out for each scenario. The divergence pattern
                                                                              conditions of the Current, the Holocene (8–4 Ka), the LGM (29–
between populations was determined based on the Fst estimates of the
                                                                              11 Ka), and the LIG (140–120 Ka). The AUC had values >0.85 in
pairwise population divergence. This consisted of a tree with a deep
                                                                              all analyses, which implied that the results greatly differed from ran-
divergence splitting the samples into 2 branches, with 1 branch includ-
                                                                              dom prediction (AUC ¼ 0.5; Supplementary Table S4). What’s
ing the QL, BA, and WLS populations, and the other one including
                                                                              more, TSS results showed similar tendency and suggest that all
the DB, JLS, WN, and WYS populations (Figure 2A), in line with pre-
                                                                              model outputs also with no random effect (Supplementary Table
vious Structure result (Figure 2B, Sun et al. 2019). This analysis was
                                                                              S4). For M. reevesi, suitable habitats presently occurred in Southern
carried out in DIY-ABC 2.1.0 (Cornuet et al. 2014) with 1 million
                                                                              China (Figure 1). Compared with the LIG, the LGM MAXENT pro-

                                                                                                                                                          Downloaded from https://academic.oup.com/cz/advance-article/doi/10.1093/cz/zoaa080/6081007 by guest on 04 May 2021
simulations to estimate the posterior distribution for each of the popu-
lations’ Ne and the times of divergence. Wide uniform prior distribu-         jection predicted more narrow habitat hotspots and shifted them to
tions (where all numbers between the smallest and the largest number          China’s Southeast (Figure 3A and B). Furthermore, the Middle
of the range have the same probability; Durrett 1999) for each param-         Holocene MAXENT projection predicted a broader distribution,
eter were used with the prior range for the Ne values ranging between         which M. reevesi potentially having dispersed to the North of China
10 and 400,000, and for the times of divergence between 10 and                (Figure 3C). Today, our simulations predict a similar continuous
30,000 years ago (Supplementary Table S3). The simulations gener-             distribution compared with the Middle Holocene area, but some dif-
ated in DIY-ABC followed default parameters for the mutation model            ferences existed for the most suitable areas (Figure 3D).
for microsatellites implemented in DIY-ABC. The simulations were
summarized with the mean number of alleles per locus and mean gen-            Future potentially suitable climatic distribution
etic diversity measured in each simulated population separately as            The predicted future (the 2050s) suitable habitat distributions of M.
well as measured on all combined pairs of populations, and with the           reevesi under RCP 2.6, RCP 4.5, RCP 6.0, and RCP 8.5 climate
pairwise Fst measured between all pairs of populations. The posterior         change scenarios are shown in Figure 4. We also obtained high AUC
distribution of each parameter was estimated using the 1% closest             and TSS values for each climate scenario, suggesting model perform-
simulations to the observed data.                                             ance of ENM is reliable (Supplementary Table S4). Compared with

Figure 2. Divergence patterns used for the DIY-ABC simulations (A), and Bayesian STRUCTURE clustering among Chinese muntjac populations (B). The bottom
Bayesian STRUCTURE clustering results of microsatellite variation among 7 Chinese muntjac populations at K ¼ 3 were derived from Sun et al. (2019).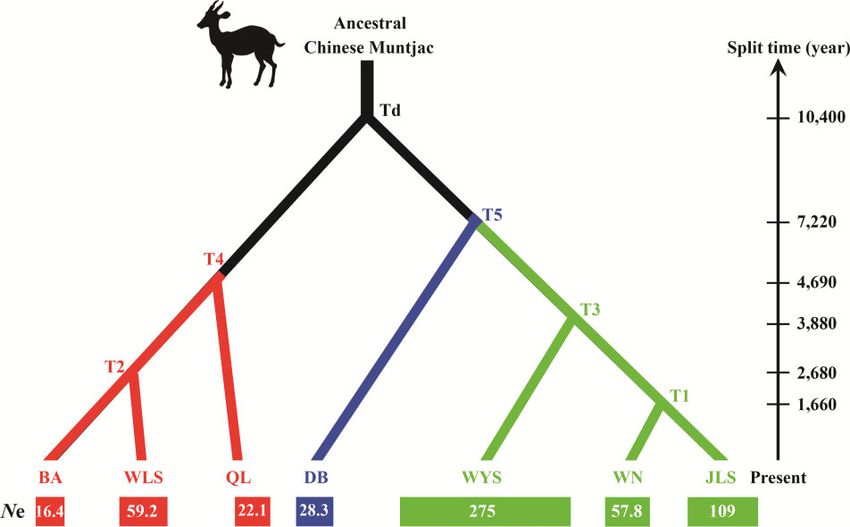
Sun et al. Spatial dynamics of Chinese Muntjac 5
Downloaded from https://academic.oup.com/cz/advance-article/doi/10.1093/cz/zoaa080/6081007 by guest on 04 May 2021
Figure 3. Species distribution models of Chinese muntjac at (A) the Last Interglacial, (B) the Last Glacial Maximum, (C) the Middle Holocene, and (D) the Current.
Color scale refers to probability of habitat suitability as predicted by MAXENT. The base maps are from Standard Map Service website (http://bzdt.ch.mnr.gov.cn/
index.html).
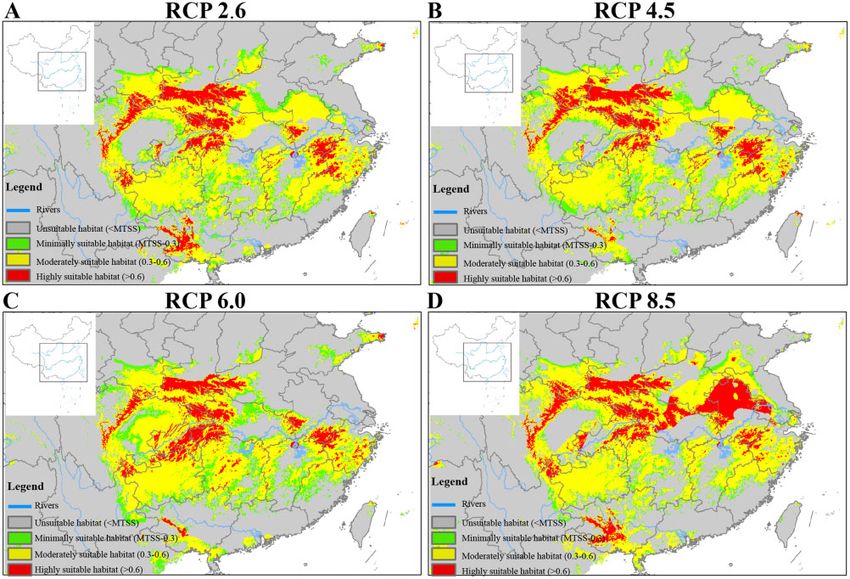
the current distribution, in the 2050s, the total area of the unsuitable distributions values with modes ranging between 16,400 and
habitat regions for M. reevesi under the 4 RCPs (RCP 2.6, RCP 4.5, 275,000, and with the mode of posterior distribution of the diver-
RCP 6.0, and RCP 8.5) would decrease by 6.95, 5.19, 6.51, and gence age between the 2 main groups of populations at 10,400 years
8.5%, respectively (Table 1), and the total area of the minimally ago (95% HPD 4,180–27,900 years ago; Table 3, Figure 5). Overall,
suitable regions would increase by 5.02, 4.73, 5.94, and 3.49%, re- the effective population size of posterior distributions South popula-
spectively (Table 1). Meanwhile, the total area of the moderately tions (JLS, WN, and WYS; 16,400–59,200) was much smaller than
suitable regions for M. reevesi would increase by 2, 1.06, 0.9, and those of the North (QL, BA, WLS, and DB; 57,800–275,000;
3.14%, respectively (Table 1). Under scenario RCP 8.5, the area of Table 2, Figure 5). The divergences between pairs of populations in
the highly suitable regions would increase by 1.87%, whereas under the DB, JLS, WN, and WYS cluster had the modes of their posterior
scenario RCP 2.6, RCP 4.5, and RCP 6.0, the areas of the highly distributions ranging between 1,660 and 7,220 years ago, while
suitable regions would decrease by 0.07, 0.6, and 0.32% (Table 1). those for the QL, BA, and WLS cluster it ranged between 2,680 and
4,690 years ago (Table 3, Figure 5). Overall, the divergence between
Demographic reconstruction the modern M. reevesi was dated back to the Middle Holocene.
The demographic scenario comparison between a model including a
bottleneck versus one without it and with both models having the
same prior probability, showed that the model without a bottleneck
Discussion
fitted the observed data substantially better (no bottleneck scenario: The Chinese muntjac is widely distributed in Southern China, typic-
probability 0.99–95% confidence interval (CI) 0.991–0.997; bottle- ally inhabiting temperate forests with occasional snowfall, as well as
neck scenario: probability 0.0059–95% CI 0.0029–0.0089). We dense forests in the warm subtropical zone (Wang 1990; Sheng et al.
estimated the recent demographic history of the 7 M. reevesi popula- 1992). In this study, the ENM revealed that the suitable habitat
tions based on the scenario without forcing a bottleneck in the popu- areas for M. reevesi significantly changed in the Late Pleistocene.
lations’ recent history (Table 2). Overall, this scenario indicates that Particularly, the species’ highly suitable habitats were mainly distrib-
the posterior distribution of the ancestral population to the 7 mod- uted in Southern China and in Northern Myanmar during the LIG
ern M. reevesi population was characterized by a Ne mode of 751 (140–120 Ka, Figure 3A), whereas they shifted to Southeast China
(95% Highest Posterior Density [HPD] 346–41,900) whereas its during the LGM (29–11 Ka, Figure 3B). In the Middle Holocene
derived populations presented substantially larger Ne posterior (8 Ka–4 Ka), the suitable habitats for the M. reevesi were much6 Current Zoology, 2021, Vol. 0, No. 0
Downloaded from https://academic.oup.com/cz/advance-article/doi/10.1093/cz/zoaa080/6081007 by guest on 04 May 2021
Figure 4. Species distribution models of Chinese muntjac predicted in the 2050s under 4 emission scenarios (A) RCP 2.6, (B) RCP 4.5, (C) RCP 6.0, and (D) RCP 8.5.
Color scale refers to probability of habitat suitability as predicted by MAXENT. The base maps are from Standard Map Service website (http://bzdt.ch.mnr.gov.cn/
index.html).
Table 1. Predicted distribution for Chinese muntjac under current and future climatic conditions
Decades scenarios Predicated distribution (cells) Increased/decreased rate (%)
Unsuitable Minimally Moderately Highly Unsuitable Minimally Moderately Highly
habitat suitable habitat suitable habitat suitable habitat suitable habitat suitable habitat suitable habitat
habitat
Current / 198,201 2,127 48,869 13,129 / / / /
2050s RCP2.6 179,979 15,289 54,124 12,934 6.95 5.02 2.00 0.07
RCP4.5 184,587 14,536 51,652 11,551 5.19 4.73 1.06 0.6
RCP6.0 181,122 17,710 51,224 12,270 6.51 5.94 0.90 0.32
RCP8.5 175,898 11,292 57,114 18,022 8.50 3.49 3.14 1.87
Notes: Number of spatially defined cells under different scenarios at a resolution of 2.5 arc-min 2.5 arc-min. The increased/decreased rate was compared with
the current distribution.
broader than ever including parts of Northern China (Figure 3C); (Yuan et al. 2016) and Odorrana graminea (Chen et al. 2020) pre-
however, following that period of time, these habitats started con- sented extensive range during the LGM in Southern China.
tracting until finally reaching the current distribution (Figure 3D). Compared with the LIG, the temperature and precipitation declined
Previous studies in other Asiatic species have also shown that despite rapidly during the LGM (Shi et al. 2008; Zhao et al. 2011).
having formally extensive ranges, their suitable niches contracted Particularly, in Southern China, the temperature reduced by
during the change from the LIG to the LGM, for example, the 6 C–7 C and precipitation decreased by 400–600 mm/year during
crested ibis (N. nippon, Feng et al. 2019) and the Jerdon’s tree frog the LGM (Zhou et al. 1991). In consistence with these changes, it
Hyla annectans (Wei et al. 2020). A similar observation but with a was been shown that most vegetation ranges contracted and shifted
drastic shift of the distribution range toward the south has been to the south during the LGM (Wang et al. 2019), whereas during
described for the golden snub-nosed monkey R. roxellana (Zhou the Holocene forests expanded and the climate became moistier,
et al. 2016), whereas some amphibians Microhyla fissipes complex particularly toward the middle Holocene (Zhao and Yu 2012). As aSun et al. Spatial dynamics of Chinese Muntjac 7
typical forest-dwelling species, the M. reevesi is very sensitive to ago that is consistent with our demographic analyses results that
cold temperatures and dry environmental conditions (Sun et al. suggest the extant M. reevesi populations derive from an ancestral
2019). During the Pleistocene, climatic fluctuations had important small population. Previous studies also showed that other Southern
effects on biodiversity and changes in the geographic distribution of China mammals experienced recent population decline events,
mammals (He and Jiang 2014; He et al. 2016; Zhou et al. 2016). which may have been triggered by the increase in early human activ-
Therefore, it is likely that the cold weather in the LGM triggered the ities in the region during the Holocene (Zhang et al. 2007; Hu et al.
M. reevesi hotspots habitat contraction and shift to the Southeast, 2011; Sun et al. 2016; Sun et al. 2019). However, in this study, we
whereas the more comfortable environment in the Middle Holocene found the M. reevesi habitat shifted and contracted significantly
broadened the habitat hotspots for the M. reevesi. since the Middle Holocene (Figure 3C and D). Therefore, we specu-
Sun et al. (2019) revealed that the relative warmer weather in the lated that the climate fluctuations induced habitat shifting or con-
LIG triggered M. reevesi population expansion, whereas the cold traction may have had a greater influence than the early human
Downloaded from https://academic.oup.com/cz/advance-article/doi/10.1093/cz/zoaa080/6081007 by guest on 04 May 2021
weather in the LGM induced a severe population decline. activities on recent population decline events.
Nevertheless, the Bayesian Skyline Plot analysis by Sun et al. (2019) In this study, the demographic reconstruction analysis revealed
reveals a rapid demographic expansion starting 8,000–7,000 years that the modern M. reevesi grouped into 3 main genetic clusters
(QL/BA/WLS, DB, and JLS/WN/WYS), which diverged in the
Table 2. Demographic parameters inferred with DIY-ABC Middle Holocene (Figure 5). In Southern China, population
Mode 5% HPD LB 95% HPD UB Table 3. Divergence parameters inferred with DIY-ABC
QL 22100.00 8850.00 36500.00 Mode 5% HPD LB 95% HPD UB
BA 16400.00 5090.00 36600.00
WLS 59200.00 29300.00 77400.00 T1 1660.00 268.00 6950.00
DB 28300.00 14600.00 38300.00 T2 3880.00 924.00 9360.00
JLS 109000.00 51700.00 194000.00 T3 7220.00 3230.00 14300.00
WN 57800.00 20500.00 77800.00 T4 2680.00 579.00 11100.00
WYS 275000.00 93500.00 1410000.00 T5 4690.00 2170.00 17500.00
Ancestral population 751.00 346.00 41900.00 Td 10400.00 4180.00 27900.00
Notes: The model of the posterior distribution of each parameter is shown in Notes: The model of the posterior distribution of each parameter is shown in
the column Mode, with the 2 adjacent columns presenting the lower bound of the column mode, with the 2 adjacent columns presenting the lower bound of
the 95% HPD of the distribution (5% HPD LB) and the corresponding upper the 95% HPD of the distribution (5% HPD LB) and the corresponding upper
bound (95% HPD UB). Parameter names are shown in Figure 5. bound (95% HPD UB). Parameters are also shown in Figure 5.
Figure 5. The inferred divergence time and demographic history of Chinese muntjac populations in Southern China with DIY-ABC. The bottom rectangles repre-
sent the population size of each population, and the number in the rectangles is the effective population size (Ne, unit: 1,000).8 Current Zoology, 2021, Vol. 0, No. 0
divergence events also happened in the recent time as observed in et al. 2016; Cui et al. 2018; Newbold 2018; Wei et al. 2018). For M.
the giant panda Ailuropoda melanoleuca (Zhao et al. 2013), the reevesi, future warmer climates are likely to result in an increase of
snub-nosed monkeys Rhinopithecus spp. (Zhou et al. 2016), the vegetation in currently unhabitable areas (VanDerWal et al. 2013;
brown Norway rats Rattus norvegicus (Teng et al. 2017), and the Liao et al. 2020) suggesting that increased suitable habitats may fur-
red panda A. fulgens (Hu et al. 2020). The ENM analysis showed ther guarantee the species survival into the future, and leaving as
that the suitable habitat for the M. reevesi covered a much broader main threats for the species habitat degradation due to logging and
region than ever thought, and that it may have migrated to the wood harvesting, land conversion for agriculture and urbanization,
North in the Middle Holocene as suitable habitat became available along with hunting.
(Figure 3C). Therefore, we hypothesized that the M. reevesi popula- In this study, our results revealed that the modern M. reevesi
tions diverged with the expansion of their habitats’ area. Among 7 populations diverged in the Middle Holocene, thus should be treated
populations, the DB population from the Dabie Mountains diverged as 3 independent management units to maintain their distinct genet-
Downloaded from https://academic.oup.com/cz/advance-article/doi/10.1093/cz/zoaa080/6081007 by guest on 04 May 2021
first 7,220 years ago and formed an independent cluster that was ic variation, and considering the DB population as a separate evolu-
closer to the JLS/WN/WYS (Figure 5). The uniqueness of the DB M. tionarily significant unit from the other 2 groups. What’s more, the
reevesi population is not surprising considering their occurrence in ENM analysis showed that the past distribution of M. reevesi was
the Dabie Mountains. Located at mid-latitude in East Asia, the strongly susceptible to climate change and that the species’ habitat
Dabie Mountains are composed of a chain of ancient, isolated, low- response to the current and forecasted climate change is likely to re-
middle elevation massifs (Pan et al. 2019b). Furthermore, the Dabie sult in a net suitable habitat increase. Therefore, we think that prior-
Mountains are in the ecotone of subtropical evergreen broad-leaved ity should be given to the conservation and restoration of M. reevesi
forest and the warm-temperate deciduous broad-leaved forest zone, current habitat to better maintain the species population sizes and at
with annual average temperature of 12.5 C and mean annual pre- the same time benefit other Southern China mammals.
cipitation of 1,832.8 mm (Zheng et al. 2012). In recent decades, sev-
eral new species were discovered in Dabie Mountains in various
taxonomic groups including mammals (e.g., Anhui Musk Deer,
Acknowledgments
Moschus anhuiensis, Li et al. 1999), reptiles (e.g., Dabie Mountains The authors would like to thank Liu Yang and Xuyu Wang for their help in
Pit Viper, Protobothrops dabieshanensis, Huang et al. 2012; Zhang distribution records collection. We would also like to thank Dr. Chunlin Li,
et al. 2013), and amphibians (e.g., Anhui Tree Frog, Rhacophorus Dr. Tao Pan, and 2 anonymous reviewers for providing helpful advice on the
early manuscript preparation.
zhoukaiyae, Pan et al. 2017; Dabie Mountain Brown Frog, Rana
dabieshanensis, Wang et al. 2017; Anhui Knobby Newt,
Tylototriton anhuiensis, Qian et al. 2017). Furthermore, Pan et al. Funding
(2019a) presented evidence that multiple hidden species exist in the
This work was funded by the Key Science and Technology Financing Projects
genus Pachyhynobius, which presents a narrow habitat distribution
of the Ministry of Education (2012), the Scientific Research and Protection
across this mountain range. Together these findings strongly suggest
Project of Black Muntjac in Qianjiangyuan National Park, Zhejiang, China
that species endemic to the Dabie Mountains correspond to distinct (2019–2021), the Biodiversity Survey, Monitoring and Assessment Project of
lineages and the DB M. reevesi falls within this category. What’s Ministry of Ecology and Environment, China (Grant No.
more, we think that the isolated massifs in this mountain range, pre- 2019HB2096001006), and the National Science & Technology Fundamental
sent more comfortable and stable climate environments that may fa- Resources Investigation Program of China (Grant No. 2019FY101803).
cilitate their continuous inhabitation throughout climatic changes,
which likely has contributed to exacerbating differences between
lineages. Authors’ Contributions
Our predictions showed that the potentially suitable climatic dis- Z.S. and B.Z. conceived and designed the study. Z.S., G.C., R.S., W.S., and
tribution for M. reevesi would expand under all future climate scen- H.W. collected the data. Z.S., P.O.t.W., and L.S. analyzed the data. Z.S.,
arios (RCP 2.6, RCP 4.5, RCP 6.0, and RCP 8.5; Table 1), P.O.t.W., and B.Z. led the writing. All authors have read and approved the
indicating that more suitable habitats would be available for the M. manuscript for submission.
reevesi in the future. Furthermore, this change was more obvious in
the high greenhouse gas concentration scenarios (RCP 8.5) than in
Supplementary Material
the low greenhouse gas concentration scenarios (RCP2.6, RCP4.5,
and RCP 8.5; Figure 4, Table 1). Overall, the suitable habitats for Supplementary material can be found at https://academic.oup.com/cz.
M. reevesi would expand potentially enabling migration to the north
in the future. However, studies have shown that different species
Conflict of Interest
habitat’s respond differently to climate change, for example, the spa-
The authors declare that they have no conflict of interest.
tial distributions of habitat for the Golden bowerbird Prionodura
newtonia would decrease under different future scenarios (Hilbert
et al. 2004), whereas the beaded lizard Heloderma horridum References
(Domı́guez-Vega et al. 2012) and the white-lipped deer
Aitken SN, Yeaman S, Holliday JA, Wang TL, Curtis-McLane S, 2008.
Przewalskium albirostris (Cui et al. 2018) habitats are predicted to
Adaptation, migration or extirpation: climate change outcomes for tree pop-
increase, and for other species, no appreciable habitable range
ulations. Evol Appl 1:95–111.
changes are forecasted (e.g., Chinese Skink, Eumeces chinensis;
Allouche O, Tsoar A, Kadmon R, 2006. Assessing the accuracy of species dis-
Yang et al. 2020). Previous studies had concluded that global warm- tribution models: prevalence, kappa and the true skill statistic (TSS). J Appl
ing would greatly influence species distributions by causing expan- Ecol 43:1223–1232.
sions, shifts, or contractions in the species ranges both in vertebrates Araújo MB, Rahbek C, 2006. How does climate change affect biodiversity?
and plants (Thomas et al. 2004; Domı́guez-Vega et al. 2012; Yi Science 313:1396–1397.Sun et al. Spatial dynamics of Chinese Muntjac 9
Baker KH, Hoelzel AR, 2014. Influence of Holocene environmental change Hilbert DW, Bradford M, Parker T, Westcott DA, 2004. Golden bowerbird
and anthropogenic impact on the diversity and distribution of roe deer. (Prionodura newtonia) habitat in past, present and future climates: pre-
Heredity 112:607–615. dicted extinction of a vertebrate in tropical highlands due to global warm-
Beever EA, Ray C, Wilkening JL, Brussard PF, Mote PW, 2011. ing. Biol Conserv 116:367–377.
Contemporary climate change alters the pace and drivers of extinction. Hu XJ, Yang J, Xie XL, Lv FH, Cao YH et al., 2019. The genome landscape of
Glob Change Biol 17:2054–2070. Tibetan sheep reveals adaptive introgression from argali and the history of
Blair C, Davy CM, Ngo A, Orlov NL, Shi HT et al., 2013. Genealogy and early human settlements on the Qinghai–Tibetan Plateau. Mol Biol Evol 36:
demographic history of a widespread amphibian throughout Indochina. J 283–303.
Hered 104:72–85. Hu YB, Guo Y, Qi DW, Zhan XJ, Wu H et al., 2011. Genetic structuring and
Chen Z, Li HY, Zhai XF, Zhu YJ, He YX et al., 2020. Phylogeography, speci- recent demographic history of red pandas (Ailurus fulgens) inferred from
ation and demographic history: contrasting evidence from mitochondrial microsatellite and mitochondrial DNA. Mol Ecol 20:2662–2675.
and nuclear markers of the Odorrana graminea sensu lato (Anura, Ranidae) Hu YB, Thapa A, Fan HZ, Ma TX, Wu Q et al., 2020. Genomic evidence for
Downloaded from https://academic.oup.com/cz/advance-article/doi/10.1093/cz/zoaa080/6081007 by guest on 04 May 2021
in China. Mol Phylogenet Evol 144:106701. two phylogenetic species and long-term population bottlenecks in red pan-
Cincotta RP, Wisnewski J, Engelman R, 2000. Human population in the bio- das. Sci Adv 6:eaax5751.
diversity hotspots. Nature 404:990–992. Hu YB, Wu Q, Ma S, Ma TX, Shan L et al., 2017. Comparative genomics
Comte L, Buisson L, Daufresne M, Grenouillet G, 2013. Climate-induced reveals convergent evolution between the bamboo-eating giant and red pan-
changes in the distribution of freshwater fish: observed and predicted trends. das. Proc Natl Acad Sci USA 114:1081–1086.
Freshw Biol 58:625–639. Huang X, Pan T, Han DM, Zhang L, Hou YX et al., 2012. A new species of
Condamine FL, Rolland J, Morlon H, 2013. Macroevolutionary perspectives the genus Protobothrops (Squamata: viperidae: crotalinae) from the Dabie
to environmental change. Ecol Lett 16:72–85. mountains, Anhui, China. Asian Herpetol Res 3:213–218.
Cornuet JM, Pudlo P, Veyssier J, Dehne-Garcia A, Gautier M et al., 2014. IUCN, 2020. IUCN Red List of Threatened Species. Glan, Switzerland and
DIYABC v2. 0: a software to make approximate bayesian computation Cambridge. Available from: http://www.iucnredlist.org (Accessed 25 June,
inferences about population history using single nucleotide polymorphism, 2020).
DNA sequence and microsatellite data. Bioinformatics 30:1187–1189. Jenkins DA, Yannic G, Schaefer JA, Conolly J, Lecomte N, 2018. Population
Cui SP, Luo X, Li CW, Hu HJ, Jiang ZG, 2018. Predicting the potential distri- structure of caribou in an ice-bound archipelago. Divers Distrib 24:
bution of white-lipped deer using the maxent model. Biodivers Sci 26: 1092–1108.
171–176. Jiménez-Valverde A, Lobo JM, 2007. Threshold criteria for conversion of
Dieringer D, Schlötterer C, 2003. Microsatellite analyser (MSA): a platform probability of species presence to either–or presence–absence. Acta Oecol
independent analysis tool for large microsatellite data sets. Mol Ecol Notes 31:361–369.
3:167–169. Li JJ, Shu Q, Zhou SZ, Zhang J, 2004. Review and prospects of Quaternary
Domı́guez-Vega H, Monroy-Vilchis O, Balderas-Valdivia CJ, Gienger C, glaciation research in China. J Glaciol Geocryol 26:235–243.
Ariano-Sánchez D, 2012. Predicting the potential distribution of the beaded Li M, Li YG, Sheng HL, Tamate H, Masuda R et al., 1999. The re-study of the
lizard and identification of priority areas for conservation. J Nat Conserv classification of Moschus moschiferus anhuiensis. Chin Sci Bull 44:
20:247–253. 188–192.
Durrett R, 1999. Essentials of Stochastic Processes. New York: Springer. Liao ZY, Zhang L, Nobis MP, Wu XG, Pan KW et al., 2020. Climate change
Earl DA, vonHoldt BM, 2012. Structure harvester: a website and program for jointly with migration ability affect future range shifts of dominant fir spe-
visualizing structure output and implementing the evanno method. Conserv cies in Southwest China. Divers Distrib 26:352–367.
Genet Resour 4:359–361. Liu ZJ, Tan XX, Orozco-terWengel P, Zhou XM, Zhang LY et al., 2018.
Elith J, Graham CH, Anderson RP, Dudı́k M, Ferrier S et al., 2006. Novel Population genomics of wild Chinese rhesus macaques reveals a dynamic
methods improve prediction of species’ distributions from occurrence data. demographic history and local adaptation, with implications for biomedical
Ecography 29:129–151. research. GigaScience 7:giy106.
Erichsen EO, Budde KB, Sagheb-Talebi K, Bagnoli F, Vendramin GG et al., Ma XG, Wang ZW, Tian B, Sun H, 2019. Phylogeographic analyses of the
2018. Hyrcanian forests-Stable rear-edge populations harbouring high gen- East Asian endemic genus Prinsepia and the role of the East Asian monsoon
etic diversity of Fraxinus excelsior, a common European tree species. Divers system in shaping a North-South divergence pattern in China. Front Genet
Distrib 24:1521–1533. 10: 128.
Evanno G, Regnaut S, Goudet J, 2005. Detecting the number of clusters of Morin X, Lechowicz MJ, 2008. Contemporary perspectives on the niche that
individuals using the software structure: a simulation study. Mol Ecol 14: can improve models of species range shifts under climate change. Biol Lett
2611–2620. 4:573–576.
Feng SH, Fang Q, Barnett R, Li C, Han SJ et al., 2019. The genomic footprints Newbold T, 2018. Future effects of climate and land-use change on terrestrial
of the fall and recovery of the crested ibis. Curr Biol 29:340–349. vertebrate community diversity under different scenarios. Proc R Soc B Biol
Hanley JA, McNeil BJ, 1982. The meaning and use of the area under a receiver Sci 285:20180792.
operating characteristic (ROC) curve. Radiology 143:29–36. O’Brien SM, Gallucci VF, Hauser L, 2013. Effects of species biology on the
Hazzi NA, Moreno JS, Ortiz-Movliav C, Palacio RD, 2018. Biogeographic historical demography of sharks and their implications for likely consequen-
regions and events of isolation and diversification of the endemic biota of ces of contemporary climate change. Conserv Genet 14:125–144.
the tropical Andes. Proc Natl Acad Sci USA 115:7985–7990. Pan T, Sun ZL, Lai XL, Orozco-terWengel P, Yan P et al., 2019a. Hidden spe-
He K, Hu NQ, Chen Li JT, Jiang XL, 2016. Interglacial refugia preserved high cies diversity in Pachyhynobius: a multiple approaches species delimitation
genetic diversity of the Chinese mole shrew in the mountains of southwest with mitogenomes. Mol Phylogenet Evol 137:138–145.
China. Heredity 116:23–32. Pan T, Wang H, Orozco-terWengel P, Hu CC, Wu GY et al., 2019b.
He K, Jiang XL, 2014. Sky islands of southwest China. I: an overview of phy- Long-term sky islands generate highly divergent lineages of a narrowly dis-
logeographic patterns. Chin Sci Bull 59:585–597. tributed stream salamander (Pachyhynobius shangchengensis) in
Hewitt GM, 2000. The genetic legacy of the Quaternary ice ages. Nature 405: mid-latitude mountains of East Asia. BMC Evol Biol 19: 1.
907–913. Pan T, Zhang YN, Wang H, Wu J, Kang X et al., 2017. A new species of the
Hewitt GM, 2004. Genetic consequences of climatic oscillations in the genus Rhacophorus (Anura: Rhacophoridae) from Dabie Mountains in East
Quaternary. Philos Trans R Soc Lond B Biol Sci 359:183–195. China. Asian Herpetol Res 8:1–13.
Hijmans RJ, Cameron SE, Parra JL, Jones PG, Jarvis A, 2005. Very high reso- Parmesan C, 2006. Ecological and evolutionary responses to recent climate
lution interpolated climate surfaces for global land areas. Int J Climatol Int change. Annu Rev Ecol Evol Syst 37:637–669.
J Climatol 25:1965–1978. Pearson K, 1920. Notes on the history of correlation. Biometrika 13:25–45.10 Current Zoology, 2021, Vol. 0, No. 0
Peterson AT, Soberon J, Pearson RG, Anderson RP, Martı́nez-Meyer E et al., Wang CC, Qian LF, Zhang CL, Guo WB, Pan T et al., 2017. A new species of
2011. Ecological Niches and Geographic Distributions (MPB-49). Rana from the Dabie Mountains in eastern China (Anura, Ranidae).
Princeton (NJ): Princeton University Press. ZooKeys 724:135–153.
Phillips SJ, Anderson RP, Schapire RE, 2006. Maximum entropy modeling of Wang QS, 1990. The Mammal Fauna of Anhui. Hefei: Anhui Publishing
species geographic distributions. Ecol Model 190:231–259. House of Science and Technology.
Pritchard JK, Stephens M, Donnelly P, 2000. Inference of population structure Wang WM, Li CH, Shu JW, Chen W, 2019. Changes of vegetation in southern
using multilocus genotype data. Genetics 155:945–959. China. Sci China Earth Sci 49:1308–1320.
Qi XS, Chen C, Comes HP, Sakaguchi S, Liu YH et al., 2012. Molecular data Wei B, Wang RL, Hou K, Wang XY, Wu W, 2018. Predicting the current and
and ecological niche modelling reveal a highly dynamic evolutionary history future cultivation regions of Carthamus tinctorius L. Using maxent model
of the East Asian Tertiary relict Cercidiphyllum (Cercidiphyllaceae). New under climate change in China. Glob Ecol Conserv 16: e00477.
Phytol 196:617–630. Wei SC, Li ZT, Momigliano P, Fu C, Wu H et al., 2020. The roles of climate,
Qian LF, Sun XN, Li JQ, Guo WB, Pan T et al., 2017. A new species of the geography and natural selection as drivers of genetic and phenotypic differ-
Downloaded from https://academic.oup.com/cz/advance-article/doi/10.1093/cz/zoaa080/6081007 by guest on 04 May 2021
genus Tylototriton (Amphibia: urodela: salamandridae) from the southern entiation in a widespread amphibian Hyla annectans (Anura: hylidae). Mol
Dabie Mountains in Anhui Province. Asian Herpetol Res 8:151–164. Ecol 29:3667–3683.
Remya K, Ramachandran A, Jayakumar S, 2015. Predicting the current and Williams M, Dunkerley D, De Deckker P, Kershaw P, Chappell J et al., 1998.
future suitable habitat distribution of Myristica dactyloides gaertn. using Quaternary Environments. London: Arnold.
maxent model in the Eastern Ghats, India. Ecol Eng 82:184–188. Wisz MS, Hijmans RJ, Li J, Peterson AT, Graham CH et al., 2008. Effects of
Rousset F, 2008. Genepop’007: a complete re-implementation of the genepop sample size on the performance of species distribution models. Divers
software for windows and linux. Mol Ecol Resour 8:103–106. Distrib 14:763–773.
Sheng HL, Cao KJ, Li WJ, Ma YQ, Ohtaishi N et al., 1992. The Deer in Yang C, Tang SH, Luo ZH, 2020. Distribution changes of Chinese skink
China. Shanghai: East China Normal University Press. Eumeces chinensis in China: the impacts of global climate change. Asian
Shi Y, Liu S, Ye B, Liu C, Wang Z, 2008. Concise Glacier Inventory of China. Herpetol Res 11:132–138.
Shanghai: Shanghai Popular Science Press. Yannic G, Pellissier L, Ortego J, Lecomte N, Couturier S et al., 2014. Genetic
Sievers M, Hale R, Parris KM, Swearer SE, 2018. Impacts of human-induced en-
diversity in caribou linked to past and future climate change. Nat Clim
vironmental change in wetlands on aquatic animals. Biol Rev 93:529–554.
Change 4:132–137.
Slatkin M, 1977. Gene flow and genetic drift in a species subject to frequent
Yi YJ, Cheng X, Yang ZF, Zhang SH, 2016. Maxent modeling for predicting
local extinctions. Theor Popul Biol 12:253–262.
the potential distribution of endangered medicinal plant H. riparia Lour in
Stanton JC, Shoemaker KT, Pearson RG, Akçakaya HR, 2015. Warning times for
Yunnan. China. Ecol Eng 92:260–269.
species extinctions due to climate change. Glob Change Biol 21:1066–1077.
Yuan ZY, Suwannapoom C, Yan F, Poyarkov NA Jr, Nguyen SN et al., 2016.
Storfer A, Murphy MA, Spear SF, Holderegger R, Waits LP, 2010. Landscape
Red river barrier and pleistocene climatic fluctuations shaped the genetic
genetics: where are we now? Mol Ecol 19:3496–3514.
structure of Microhyla fissipes complex (Anura: microhylidae) in southern
Stucki S, Orozco-terWengel P, Forester BR, Duruz S, Colli L et al., 2017. High
China and Indochina. Curr Zool 62:531–543.
performance computation of landscape genomic models including local
Zhang BW, Huang X, Pan T, Zhang L, Zhou WL et al., 2013. Systematics and
indicators of spatial association. Mol Ecol Resour 17:1072–1089.
species validity of the Dabieshan Pit Viper Protobothrops dabieshanensis
Sun ZL, Pan T, Wang H, Pang MJ, Zhang BW, 2016. Yangtze River, an insig-
Huang et al. 2012: evidence from a mitochondrial gene sequence analysis.
nificant genetic boundary in tufted deer Elaphodus cephalophus: the evi-
Asian Herpetol Res 4:282–287.
dence from a first population genetics study. PeerJ 4:e2654.
Zhang BW, Li M, Zhang ZJ, Goossens B, Zhu LF et al., 2007. Genetic viabil-
Sun ZL, Wang H, Zhou WL, Shi WB, Zhu WQ et al., 2019. How rivers and
ity and population history of the giant panda, putting an end to the
historical climate oscillations impact on genetic structure in Chinese munt-
“evolutionary dead end”. Mol Biol Evol 24:1801–1810.
jac Muntiacus reevesi? Divers Distrib 25:116–128.
Zhang H, Yan J, Zhang GQ, Zhou KY, 2008. Phylogeography and demo-
Swets JA, 1988. Measuring the accuracy of diagnostic systems. Science 240:
graphic history of Chinese black-spotted frog populations Pelophylax nigro-
1285–1293.
maculata: evidence for independent refugia expansion and secondary
Taubmann J, Theissinger K, Feldheim KA, Laube I, Graf W et al., 2011.
Modelling range shifts and assessing genetic diversity distribution of the contact. BMC Evol Biol 8:21.
montane aquatic mayfly Ameletus inopinatus in Europe under climate Zhao J, Shi Y, Wang J, 2011. Comparison between quaternary glaciations in
change scenarios. Conserv Genet 12:503–515. china and the marine oxygen isotope stage (MIS): an improved schema.
Templeton AR, 1998. Nested clade analyses of phylogeographic data: testing Acta Geogr Sin 66:867–884.
hypotheses about gene flow and population history. Mol Ecol 7:381–397. Zhao SC, Zheng PP, Dong SS, Zhan XJ, Wu Q et al., 2013. Whole-genome
Teng HJ, Zhang YH, Shi CM, Mao FB, Cai WS et al., 2017. Population gen- sequencing of giant pandas provides insights into demographic history and
omics reveals speciation and introgression between brown norway rats and local adaptation. Nat Genet 45:67–71.
their sibling species. Mol Biol Evol 34:2214–2228. Zhao Y, Yu ZC, 2012. Vegetation response to holocene climate change in east
Thomas CD, Cameron A, Green RE, Bakkenes M, Beaumont LJ et al., 2004. asian monsoon-margin region. Earth-Sci Rev 113:1–10.
Extinction risk from climate change. Nature 427:145–148. Zhao YX, Yang J, Lv FH, Hu XJ, Xie XL et al., 2017. Genomic reconstruction
Tian S, Lei SQ, Hu W, Deng LL, Li B et al., 2015. Repeated range expansions of the history of native sheep reveals the peopling patterns of nomads and
and inter-/postglacial recolonization routes of Sargentodoxa cuneata (Oliv.) the expansion of early pastoralism in East Asia. Mol Biol Evol 34:
rehd. Et wils.(Lardizabalaceae) in subtropical china revealed by chloroplast 2380–2395.
phylogeography. Mol Phylogenet Evol 85:238–246. Zheng YH, Zhang Y, Shao XM, Yin ZY, Zhang J, 2012. Temperature vari-
Tremblay RL, Ackerman JD, 2001. Gene flow and effective population size in ability inferred from tree-ring widths in the dabie mountains of subtropical
Lepanthes (Orchidaceae): a case for genetic drift. Biol J Linn Soc 72:47–62. central China. Trees 26:1887–1894.
Van Oosterhout C, Hutchinson WF, Wills DP, Shipley P, 2004. Zhou XM, Meng XH, Liu ZJ, Chang J, Wang BS et al., 2016. Population gen-
Micro-checker: software for identifying and correcting genotyping errors in omics reveals low genetic diversity and adaptation to hypoxia in snub-nosed
microsatellite data. Mol Ecol Notes 4:535–538. monkeys. Mol Biol Evol 33:2670–2681.
VanDerWal J, Murphy HT, Kutt AS, Perkins GC, Bateman BL et al., 2013. Zhou Y, Qiu G, Guo D, 1991. Changes of permafrost in China during
Focus on poleward shifts in species’ distribution underestimates the finger- Quaternary. In: Liu TS, editor. Quaternary Geology and Environment in
print of climate change. Nat Clim Change 3:239–243. China. Beijing: Science Press. 86–94.You can also read