Honey bee hives decrease wild bee abundance, species richness, and fruit count on farms regardless of wildflower strips - Nature
←
→
Page content transcription
If your browser does not render page correctly, please read the page content below
www.nature.com/scientificreports
OPEN Honey bee hives decrease wild
bee abundance, species richness,
and fruit count on farms regardless
of wildflower strips
G. M. Angelella1,2*, C. T. McCullough1,3 & M. E. O’Rourke1,4
Pollinator refuges such as wildflower strips are planted on farms with the goals of mitigating wild
pollinator declines and promoting crop pollination services. It is unclear, however, whether or how
these goals are impacted by managed honey bee (Apis mellifera L.) hives on farms. We examined how
wildflower strips and honey bee hives and/or their interaction influence wild bee communities and
the fruit count of two pollinator-dependent crops across 21 farms in the Mid-Atlantic U.S. Although
wild bee species richness increased with bloom density within wildflower strips, populations did not
differ significantly between farms with and without them whereas fruit counts in both crops increased
on farms with wildflower strips during one of 2 years. By contrast, wild bee abundance decreased
by 48%, species richness by 20%, and strawberry fruit count by 18% across all farm with honey bee
hives regardless of wildflower strip presence, and winter squash fruit count was consistently lower on
farms with wildflower strips with hives as well. This work demonstrates that honey bee hives could
detrimentally affect fruit count and wild bee populations on farms, and that benefits conferred by
wildflower strips might not offset these negative impacts. Keeping honey bee hives on farms with
wildflower strips could reduce conservation and pollination services.
Declining pollinator populations coupled with increasing pollinator-dependent crop production worldwide
makes it crucial to understand how management techniques can enhance on-farm pollinator conservation and
crop pollination ecosystem s ervices1–3. Research in native plant systems suggests competition between managed
and wild bees over floral resources can suppress wild bee abundance and plant seed set4–7. This may be especially
true under resource limitations6–8, which can increase niche overlap between honey bees and wild pollinators
and heighten negative impacts on wild pollinator populations9–12. Competition from managed bees can affect
wild pollinator populations and crop production in agroecosystems as well13–17. However, we do not yet fully
understand the factors shaping honey bee–wild bee interactivity on farms, including whether or how modifying
floral resource availability modulates outcomes. Understanding how floral resource supplementation influences
the effects of bee competition is necessary to maximize ecosystem services in agricultural production.
Pollinator refuge habitats (often referred to as wildflower strips) are designed to supplement floral resources
and mitigate pollinator population and pollination service declines. Planting these habitats on farms is federally
subsidized in some countries through programs such as Agri-Environment Schemes in Europe18, and the Natu-
ral Resources Conservation Service’s (NRCS) Environmental Quality Incentives Program and the Farm Service
Agency’s Conservation Reserve Program in the USA19,20. Wildflower strips are designed to provide blooms
throughout the growing season (e.g., F SA21) to enhance local populations of wild and managed pollinators by
aggregating them on farms and supporting greater population growth22. They can increase both native bee23–25
and managed honey b ee26 populations as well as crop y ields27–30, but no studies to date have examined the impacts
maintaining honey bee hives on farms with wildflower strips has on these beneficial services.
There is well-documented evidence that managed bees, particularly honey bees (Apis mellifera L.), can have
negative effects on wild pollinators within natural s ystems4–7. Competition can also reduce seed set in native
plants when honey bees drive down floral visitations by wild pollinators but cannot pollinate as effectively as their
1
School of Plant and Environmental Sciences, Virginia Tech, Blacksburg, VA, USA. 2Present address: USDA,
Agricultural Research Service, Temperate Tree Fruit and Vegetable Research Unit, 5230 Konnowac Pass
Road, Wapato, WA 98951, USA. 3Present address: Department of Entomology, Virginia Tech, Blacksburg,
VA, USA. 4Present address: USDA, National Institute of Food and Agriculture, Kansas City, MO, USA. *email:
Gina.Angelella@usda.gov
Scientific Reports | (2021) 11:3202 | https://doi.org/10.1038/s41598-021-81967-1 1
Vol.:(0123456789)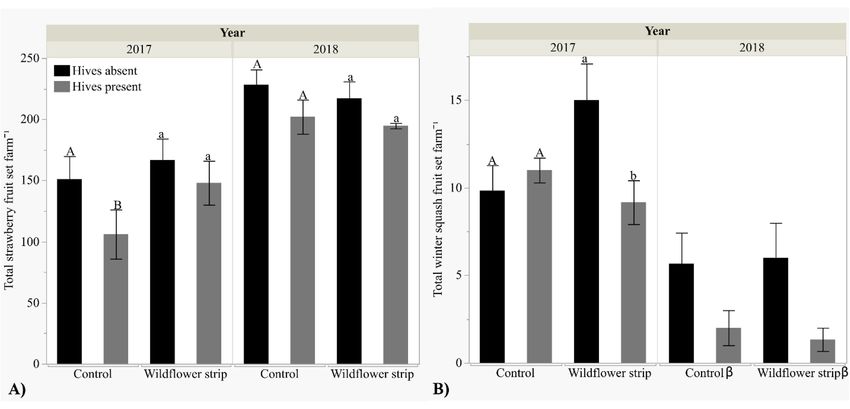
www.nature.com/scientificreports/
Figure 1. Map of farm locations. Farms planted with wildflower strips (pollinator refuge farms) and decimal
degree longitudinal and latitudinal coordinates indicated. (See Table S1 for more details).
wild counterparts31–33. Since evidence suggests many pollinator-dependent crops respond more strongly to pol-
lination services from wild pollinators than honey b ees34, competition could conceivably decrease yield in many
crop systems as well. However, the outcome of honey bee and wild pollinator co-occurrence in crops on yield
seems to be context dependent: studies report effects on yield ranging from n egative14,16,17, to positive or even
13,15,35
synergistic . This inconsistency illustrates the need to identify how underlying factors shape the outcome
of wild bee–honey bee interactions. Moreover, it is unknown whether additional floral resources provisioned by
wildflower strips could alleviate resource limitations and competition among pollinators.
This study examines wild bee (i.e., non-Apis spp.) conservation and crop pollination value relative to wild-
flower strips, honey bee hives, and their interactions. Specifically, we wanted to know how wildflower strips and
honey bee hives would independently influence wild bee abundance and fruit production on farms, and whether
hives would enhance or detract from wildflower strip-mediated services. To answer these questions, we surveyed
wild bee communities and measured strawberry and winter squash fruit count on a network of farms with or
without wildflower strips and honey bee hives (Fig. 1).
Results
The relative abundance and species diversity of blooms in field margins vs. wildflower strips varied by season.
In early spring, bloom density was greater in field margins (μ = 85.30 ± 45.20) than in the wildflower strips
(μ = 3.56 ± 1.54) (Z = − 3.29, P = 0.0010) but did not differ in diversity (field margins μ = 1.58 ± 0.16, wf strips
μ = 1.30 ± 0.18) (P = 0.28). Contrarily, in mid-summer there was no difference in bloom density between field
Scientific Reports | (2021) 11:3202 | https://doi.org/10.1038/s41598-021-81967-1 2
Vol:.(1234567890)www.nature.com/scientificreports/
Figure 2. Mean total wild bee abundance, species richness, Shannon–Wiener diversity index, and species
evenness (± SE) per farm by wildflower strip and honey bee hive presence/absence. Hive treatment means are
compared within each wildflower strip treatment: the same letter indicates means are not statistically significant
(α = 0.05). (A) Abundance, (B) Species richness, (C) Diversity, (D) Evenness.
margins (μ = 34.18 ± 10.74) and wildflower strips (μ = 17.26 ± 9.51) (P = 0.52), but diversity was much greater in
wildflower strips (field margins μ = 1.36 ± 0.36, wf strips μ = 2.88 ± 0.36) (F = 9.14, P = 0.0073).
Bees. Wildflower strips did not significantly increase wild bee abundance [+ wf strips μ = 37.82 ± 5.73, − wf
strips μ = 34.47 ± 5.82], species richness (+ wf strips µ = 8.36 ± 0.65, − wf strips µ = 7.42 ± 0.64), evenness (+ wf
strips µ = 0.77 ± 0.033, − wf strips µ = 0.80 ± 0.026), or Shannon–Wiener diversity (+ wf strips µ = 1.53 ± 0.10,
− wf strips µ = 1.42 ± 0.095) (Fig. 2A–D, Table 1). Wild bee diversity was significantly greater in mid-summer
(µ = 1.67 ± 0.074) than early spring (µ = 1.29 ± 0.11) but did not differ by year (Table 1). Neither wild bee abun-
dance, species richness, nor evenness differed by season or year (Table 1). Although wild bee species richness did
not significantly differ by wildflower strip presence/absence on farms, it increased with wildflower strip bloom
density (Z = 2.21, P = 0.027) but not bloom density in unmanaged field margins on control farms (P = 0.31)
(Fig. 3B). However, bloom density did not affect wild bee abundance (field margins P = 0.63, wf strips P = 0.31),
evenness (field margins P = 0.42, wf strips P = 0.94), or diversity (field margins P = 0.16, wf strips P = 0.21)
(Fig. 3A,C,D), and bloom species diversity did not affect any wild bee metric: abundance (field margins P = 0.63,
wf strips P = 0.31), species richness (field margins P = 0.60, wf strips P = 0.87), diversity (field margins P = 0.47, wf
strips P = 0.87), or evenness (field margins P = 0.58, wf strips P = 0.57).
Scientific Reports | (2021) 11:3202 | https://doi.org/10.1038/s41598-021-81967-1 3
Vol.:(0123456789)www.nature.com/scientificreports/
Response WF Hive Year WF*Year Hive*Year WF*Hive WF*Hive*Year Season
Wild bee abun-
P = 0.42 Z = − 2.41 P = 0.016 P = 0.86 – α
P = 0.087 – α
–α
P = 0.13
dance
Z = − 2.03,
Wild bee richness P = 0.50 P = 0.50 –α P = 0.098 –α –α Z = 2.45, P = 0.014
P = 0.042
Wild bee diversity P = 0.42 P = 0.45 P = 0.085 – α
–α
– α
– α
Z = 3.10, P = 0.0031
Wild bee evenness P = 0.81 P = 0.65 P = 0.88 –α –α –α –α Z = 2.08, P = 0.043
Strawberry fruit Z = − 2.02,
Z = 2.10, P = 0.036 Z = 2.43, P = 0.015 Z = 5.77, P < 0.001 –α –α –α
count P = 0.043
Winter squash fruit Z = − 3.15, Z = − 2.60,
P = 0.60 P = 0.34 –α –β –β
count P = 0.0017 P = 0.0093
Table 1. Wild bee survey data (abundance, species richness, Shannon–Wiener diversity, and species evenness)
and fruit count data in response to wildflower strip (WF) and hive presence/absence, year, and/or season.
Significant predictors (P < 0.05) are bolded. α Nonsignificant interactions (α = 0.1) dropped from analyses.
β
Interaction not included in analysis due to limited winter squash fruit count in 2018.
Figure 3. Mean total wild bee abundance, species richness, Shannon–Wiener diversity index, and species
evenness (± SE) per farm by bloom density (mean bloom counts m −2) within wildflower strips or within
unmanaged field margins on control farms. (A) Abundance, (B) Species richness, (C) Evenness, (D) Diversity.
Scientific Reports | (2021) 11:3202 | https://doi.org/10.1038/s41598-021-81967-1 4
Vol:.(1234567890)www.nature.com/scientificreports/
Figure 4. Mean total fruit count (± SE) per farm by wildflower strip and honey bee hive presence/absence on
farms. Hive treatment means are compared within each wildflower strip treatment: the same letter indicates
means are not statistically significant (α = 0.05), and β indicates sample sizes are insufficient for means
comparisons. (See Supplemental Table S4 for sample size details.) (A) Strawberries, (B) Winter squash.
Honey bee hive presence was associated with a 48% decrease in wild bee abundance (+ hives μ = 24.00 ± 3.71,
− hives μ = 46.31 ± 6.40), and a 20% decrease in species richness (+ hives μ = 6.94 ± 0.73, − hives μ = 8.69 ± 0.55)
(Fig. 2A–B), whereas diversity (+ hives µ = 1.40 ± 0.12, − hives µ = 1.55 ± 0.077) and evenness (+ hives
µ = 0.81 ± 0.034, − hives µ = 0.76 ± 0.026) did not differ significantly (Table 1). The honey bee hive effects on both
wild bee abundance and species richness were marginally affected by year (Table 1), with overall differences of
slightly greater magnitude occurring in 2017 than 2018 (Fig. 2A,B). Total honey bee abundance within traps was
low but nevertheless greater on farms with hives than without (+ hives μ = 1.20 ± 0.57, − hives μ = 0.095 ± 0.057)
(Z = 2.19, P = 0.029), and did not vary by year (P = 0.12) or season (P = 1.00).
Fruit count. Wildflower strips significantly increased overall strawberry and not winter squash fruit
count (Table 1). However, upon closer inspection, wildflower strips enhanced fruit counts of both during
2017 (strawberry: + wf strips µ = 157.30 ± 12.22, − wf strips µ = 124.50 ± 14.97; t = − 2.51, P = 0.018) (squash:
+ wf strips µ = 11.11 ± 1.40, − wf strips µ = 10.09 ± 0.84; Z = 2.33, P = 0.020) but not 2018 (strawberry: + wf
strips µ = 209.67 ± 9.60, − wf strips µ = 215.10 ± 9.85; P = 0.55) (squash: + wf strips µ = 5.71 ± 1.64, − wf strips
µ = 5.43 ± 1.46; P = 0.82) (Fig. 4A,B, Table 1). Total strawberry fruit count per farm was greater in 2018 than 2017
(2017 µ = 140.90 ± 10.13, 2018 µ = 212.53 ± 6.73) but the reverse was true for winter squash (2017 µ = 10.55 ± 0.77,
2018 µ = 5.57 ± 1.06) (Table 1).
Strawberry fruit count decreased by 18% across all farms with hives (+ hives µ = 156.89 ± 12.62, − hives
µ = 192.00 ± 10.22) while the effect of hives on winter squash fruit count was less consistent (Fig. 4A,B, Table 1).
Winter squash fruit count decreases across all farms with hives were not significant in 2017 (2017 + hives
µ = 9.90 ± 0.82, − hives µ = 11.20 ± 1.31; P = 0.34), but they were in 2018 (2018 + hives µ = 2.00 ± 0.41, − hives
µ = 7.00 ± 1.20; t = 3.16 P = 0.0038) (Table 1). Separately analyzing 2017 data with a hive by wildflower strip
interaction showed fruit count differed by hive presence on farms with wildflower strips (+ hives µ = 9.17 ± 1.25,
− hives µ = 15.00 ± 2.08; Z = 2.45, P = 0.014) but not without wildflower strips (+ hives µ = 11.00 ± 0.71, − hives
µ = 9.57; P = 0.57) (hive*wildflower strip interaction: Z = − 2.14, P = 0.033) (Fig. 4B). Thus, winter squash fruit
count decreased on farms with wildflower strips both years but only during 2018 on control farms. We were
unable to analyze hive by wildflower strip interactions in the winter squash model with both years combined
because of insufficient sample size in 2018 (Supplemental Table S4).
Winter squash fruit count increased with greater wild bee species richness (Z = 2.40, P = 0.017), but strawberry
fruit count did not (P = 0.54) (Fig. 5A,B). Fruit count was unaffected by wild bee abundance (P = 0.52, P = 0.27),
diversity (P = 0.91, P = 0.29), or evenness (P = 0.13, P = 0.23) in both strawberry and winter squash, respectively.
Neither honey bee abundance in traps (strawberries: P = 0.58; winter squash: P = 0.58), hive distance (strawber-
ries: P = 0.97; winter squash: P = 0.52), nor the number of hives per farm (strawberries: P = 0.68; winter squash:
P = 0.40) predicted changes in fruit count. The effect of wild bee abundance, species richness, diversity, evenness,
honey bee abundance, number of hives, or hive distance on fruit count did not vary by year.
Scientific Reports | (2021) 11:3202 | https://doi.org/10.1038/s41598-021-81967-1 5
Vol.:(0123456789)www.nature.com/scientificreports/
● = 2018. (A) Strawberry fruit count, (B) Winter squash fruit count.
Figure 5. Total strawberry and winter squash fruit count analyzed by wild bee species richness: ▲ = 2017,
Discussion
Wildflower strips induced responses ranging from neutral to limitedly positive in wild bee populations and fruit
count, whereas responses to honey bee hives on farms were largely negative. There were no measurable changes in
wild bee populations on farms with wildflower strips, although wild bee species richness increased with greater
wildflower strip bloom density, but wildflower strips enhanced fruit count in one of 2 years. Meanwhile, there
were marked overall decreases in wild bee abundance (48%), species richness (20%), and strawberry fruit count
(18%) on farms with hives, regardless of wildflower strip presence or absence. Winter squash fruit count also
decreased on farms with hives, but the effect was only consistent on farms with wildflower strips. Thus, negative
effects associated with honey bee hive presence were as strong or stronger on farms with wildflower strips than
on those without.
The lack of variation we observed in wild bee populations relative to supplementing farms with wildflower
strips differs from previous w ork23–25. Nevertheless, the positive relationship between wild bee species richness
and wildflower strip bloom density suggests significant treatment effects could arise at greater bloom densities.
We observed particularly low bloom densities in the wildflower strips relative to field margins during the early
spring; extending the bloom coverage of wildflower strips by including species with earlier phenologies could
improve floral resource availability and attraction to wild bee species active earlier in the year. However, greater
bloom densities within wildflower strips in mid-summer did not manifest in seasonal variation in wild bee
populations on farms with wildflower strips, suggesting greater bloom densities in the summer may be needed
to enhance wild bee populations as well. An alternative explanation for the lack of wildflower strip effect could
be effects from the surrounding landscape. While we did not incorporate effects of surrounding landscape into
analyses, its composition can modify the strength of wildflower strip effects as well by supporting nearby wild
pollinator populations or even competing with wildflower strips in drawing pollinator a ctivity36–38. For example,
areas with relatively robust natural habitat, such as the Eastern Shore of the Mid-Atlantic, U.S., may demon-
strate less of an effect from wildflower strips than areas with an intermediate proportion of natural habitat in
the landscapes surrounding farms39,40. Additionally, while necessary in our study due to logistical constraints,
pan and blue vane traps often under-sample bees relative to other methods such as netting at flowers or floral
visitation observations41,42. For example, in the U.K., pan traps collected a lower proportion of pollinator popula-
tions where floral resources were abundant than where they were scarce due to competing sources of attractive
stimuli43. Finally, shared floral resources can facilitate pathogen or parasite s pillover44,45, which could counteract
the benefits of supplemental floral resources on farms. It would be of interest to determine how wildflower strips
alter pathogen and parasite transmission dynamics and pollinator population health on farms.
The changes in wild bee abundance, species richness, and evenness we observed on farms with hives could
suggest competition of some kind is occurring between wild bees and honey bees. This would support previously
documented observations of honey bee competition leading to declines in wild pollinator a bundance46–49 and/
or richness4,50,51. Exploitative competition, in which honey bees out-forage wild species and deplete shared floral
resources, is thought by some to be the primary driver of negative outcomes in wild pollinator p opulations46,49,52.
And yet, supplemental floral resources provided by wildflower strips did not alleviate the negative effect of honey
bee hive presence on wild bees in our study, as would be predicted under limited floral resources. However,
wild bee populations did not measurably benefit from wildflower strips on farms and we cannot determine the
extent to which they were utilized relative to control farm field margins, as trap counts cannot infer foraging
behavior41,42. An additional possible mechanism is that honey bee foraging within an area can reduce wild bee
floral visitation51; thus, actively foraging honey bees on farms could have depressed wild bee activity. Behavioral
Scientific Reports | (2021) 11:3202 | https://doi.org/10.1038/s41598-021-81967-1 6
Vol:.(1234567890)www.nature.com/scientificreports/
studies incorporating floral visitation observations are needed to determine how and why wild bee populations
vary between farms with and without honey bee hives. Moreover, pathogen or parasite spillover from managed
bees can impact wild bee populations as w ell44. Future studies elucidating the behavioral and/or pathological
mechanisms linking wildflower strips, wild bees, and honey bees are clearly warranted.
Trends of decreasing wild bee abundance and species richness relative to hive presence could also explain fruit
count decreases. While previous research suggests the abundance of common species can have a greater impact
on pollination services than species r ichness53,54, species richness could also enhance pollination efficiency in
crops55. We observed enhanced winter squash fruit count with increasing species richness and not abundance,
suggesting rarer species contributed crucial pollination services in winter squash. Our results also support past
work suggesting pollination efficiency in strawberries is not associated with species r ichness56,57.
Our results documenting negative yield effects on farms with honey bee hives differ from several previous
studies in agricultural systems. Two examples include a study in almond orchards in Northern California15, and
another on sunflower production farms in Central California13 where honey bees enhanced outcrossing and
increased yields. One difference between our study and those which found a beneficial effect is the scale of crop
production involved. Because honey bees tend to seek out and concentrate in large floral resource patches58, they
may pollinate crops in large acreage production more effectively than our small plantings of strawberries and
winter squash. If the presence of honey bee hives decreased wild bee abundance on our study farms and honey
bees were not visiting the strawberry or winter squash blooms, that could explain why we saw deficits in fruit
count rather than a neutral or positive effect of honey bees. In fact, a recent study found that strawberries adja-
cent to mass-flowering oilseed rape received fewer honey and bumble bee visitations while the oilseed rape was
blooming59. However, in contrast with our results, Bänsch and others found that farms benefitted from wildflower
strips during mass oilseed rape blooms because the wildflower strips supported wild pollinators which stepped
in to pollinate strawberries, replacing managed bees and protecting strawberry y ields59.
The relative effectiveness of wild vs. honey bees as strawberry and winter squash pollinators differs in the
literature. Prior research in strawberries observed roughly equivalent56 or more efficient pollination services by
honey bees relative to wild bees56,60–62. However, a recent study found pollination from wild bees generated larger
strawberries relative to pollination from honey bees alone or from a combination of wild and honey bees57, and
Horth and Campbell compared strawberry production with pollination from managed honey bees with Osmia
lignaria, an endemic species to the Mid-Atlantic, U.S., and found O. lignaria increased berry size and growth
rates63. Relative to strawberries, cucurbits require a heavier pollen load to achieve maximum fruit count, and
larger species such as bumble bees tend to be more efficient pollinators than honey bees64,65. Regardless, our
observations of greater fruit count on farms without honey bee hives suggests wild pollinators populations in
the southeastern Mid-Atlantic region of the USA may be robust enough to fulfill pollination requirements to
an equal or greater degree than managed honey bees on small- or medium-scale farms. However, this should be
verified in commercial crop fields to determine whether wild pollinator communities could support larger scale
production needs. Two studies in the northeastern USA demonstrated that wild pollinators provide sufficient
pollination services to pumpkins66,67, suggesting it is not outside the realm of possibility.
Whereas the decrease in fruit count relative to honey bee hive presence was clear, fruit count did not vary by
honey bee density. This could indicate that the threshold of honey bees needed to affect wild bee communities
and their services is quite low. Indeed, four out of the 11 farms which maintained hives at some point during
our study kept them for only one season or year, but the effects on fruit count and wild bee abundance were
nevertheless strong enough to detect. In a recent review, Geslin and others68 recommended limiting honey bees
to ≤ 3.5 hives km−2 (0.035 hives h a−1) to conserve wild bees in protected a reas69,70. For comparison, current
recommendations range from 0.2 to 4 hives ha−1 to support strawberry production, and 0.02–1.2 hives ha−1 to
support pumpkin and winter squash p roduction71–73. Growers interested in wild pollinator conservation should
carefully consider whether to rent or maintain honey bee hives, especially if accompanying pollination service
benefits and associated costs are in question.
Conclusion
The results of our study suggest that under some circumstances, supplementing farms with honey bee hives could
detract from fruit count in pollinator-dependent crops and decrease wild bee abundance and species richness.
Moreover, although wildflower strips provided a limited boost to fruit count, they did not alleviate honey bee
hive-associated decreases in fruit count or decreases in wild bees on farms. As such, our study implies honey
bee hives may detract from the goals of wildflower strips to enhance fruit count and support wild pollinator
populations. Our research also suggests wild pollinators in the Mid-Atlantic region may have the potential to
meet or exceed pollination services by honey bees in pollinator-dependent crops such as strawberry and winter
squash. We suggest future work to investigate whether similar effects occur in larger-scale crop production, in
other pollinator-dependent crop systems, and with regional variations in wild pollinator communities. More
work identifying appropriate honey bee density thresholds relative to wild pollinator populations would benefit
growers making management decisions and help them avoid financial costs or even yield reductions resulting
from unnecessary hive rental.
Materials and methods
We conducted research on farms (n = 21) in the Eastern Shore and Virginia Beach areas within the Mid-Atlantic
USA (Fig. 1; Supplemental Table S1). Farms were small- or medium-scale (< 105 ha) with varied management
practices and crops in production, and all were ≥ 2 km apart. All but three farms grew one or more pollinator-
dependent crops, in which animal pollination is required to maximize production (Supplemental Table S1). We
established wildflower strips on nine farms in 201674, and one was established following the same guidelines in
Scientific Reports | (2021) 11:3202 | https://doi.org/10.1038/s41598-021-81967-1 7
Vol.:(0123456789)www.nature.com/scientificreports/
2015. Mixes contained at least nine species of wildflowers (Ernst Conservation Seeds, Meadowville, PA; Round-
stone Native Seed Company, Upton, KY), adapted for soil drainage conditions and to provide continual blooms
spring through fall (Supplemental Table S2). Wildflower strip size varied according to grower preference and
land availability (0.056–12.14 ha; μ = 0.22 ha ± 0.10 SE), but met or exceeded a size threshold at which detectable
changes in wild bee density and/or diversity could be e xpected75. Approximately half of the farms maintained or
rented honey bee hives (2017 early spring, WF + hives n = 5, WF − hives n = 5, control + hives n = 4, control − hives
n = 7; 2017 mid-summer: WF + hives n = 7, WF − hives n = 3, control + hives n = 4, control − hives n = 7; 2018
early spring: WF + hives n = 4, WF − hives n = 6, control + hives n = 5, control − hives n = 5; 2018 mid-summer:
WF + hives n = 4, WF − hives n = 6, control + hives n = 4, control − hives n = 6); the number and distance of hives
to wildflower strips varied by farm and season (Supplemental Table S3). We surveyed floral resources within
wildflower strips (n = 10 farms) and field margins (n = 10 farms) by counting blooms m−2 in early spring (May
7) and mid-summer (July 2) 2018 within a 1-m2 quadrat placed every 10 m along a 50-m transect. Blooming
plants were identified to genus and species when possible.
Bees. We surveyed the bee (Hymenoptera: Apidae) communities on farms in 2017 (n = 19) and 2018 (n = 20)
during strawberry and winter squash bloom periods (Supplemental Table S3): two surveys were completed on
each farm per year, occurring the weeks of May 14th and August 14th in 2017, and June 4th and August 13th in
2018. We placed nine bee bowls and three Blue Vane traps (Springstar Inc., Woodinville, WA, USA) out on each
farm for 48 h. Bee bowls were made from 750 mL plastic food storage bowls (Rubbermaid, Atlanta, GA), with an
equal number painted UV-bright yellow, blue, or white (Blick Art Materials, Galesburg, IL, USA). We included
blue vane traps in the survey as an attempt to mitigate some of the disadvantages of pan traps, because they are
effective at collecting larger bodied bees as well as bees which fly at higher e levations41. All bowls and traps were
filled halfway with water and a drop of unscented dish soap. We placed them ≥ 2 m apart in a row along unman-
aged field edges at control farms or wildflower strip edges at farms with plantings. Bowls were set on the ground
in alternating colors, and blue vane traps were taped to three-foot posts at the center and both ends of the array.
Collected bees were identified to species.
Fruit count. To examine pollination services, we quantified total fruit count of strawberries (Fra-
garia × ananassa var. Chandler) and winter squash (Cucurbita maxima var. Gold Nugget) (Johnny’s Selected
Seeds, Fairfield, ME, USA) in 2017 and 2018. Cultivated strawberry pollination occurs through a mix of self-,
wind-, and insect-facilitation, but it is well established that increases in insect-facilitated pollination benefit
yield63,76. Winter squash fruit development is entirely dependent on insect p ollination77. Thus, fruit count is
78,79
affected by insect pollination efficiency in both strawberries and winter s quash80.
In order to minimize the effects of environmental variation across farms, we planted strawberries and winter
squash in containers. We used two, 50-gal tubs (Rubbermaid, Atlanta, GA, USA) per farm augmented with drain-
age holes and filled with soil (Sun Gro, BFG, Burton, OH, USA). Containers were placed within field margins
located 5–10 m from wildflower strips on farms which had them established. We added 25 g 5–10–10 fertilizer
(Wetsel Fertilizer, BFG, Burton, OH, USA) upon transplanting strawberries or winter squash to each container,
and again to strawberries ca. two weeks after transplanting. If transplants died, were smaller than average, or
looked sickly, we replaced them with plants of the same size and growth stage within the first few weeks prior to
the flowering stage. Two sites experiencing squash plant mortality during the flowering stage were excluded from
the study in 2017. Four first-year strawberry plants were transplanted into each container in early April. Large
chicken wire cages enclosed each bin of strawberry plants to exclude vertebrates. Ripened berries (≥ 75% pink
or red surface) were collected weekly for seven weeks each year until plants stopped setting fruit in mid-June.
We transplanted two five-week-old winter squash seedlings into each bin following strawberry plant removal in
mid- to late-June. Winter squash fruits were collected when the connecting vine senesced and until plants either
died or bore no more fruit in late September–early October. We removed and destroyed squash bugs (Anasa
tristis) and eggs by hand from winter squash plants; if we observed larger outbreaks of squash bugs or cucumber
beetles (Acalymma vittatum, Diabrotica undecimpunctata) and plants were not flowering, they were sprayed with
Azera (MGK, Minneapolis, MN). Plants were watered on a weekly basis when container soil was dry to the touch.
Data analyses. The number of farms under wildflower and honey bee hive presence/absence treatments
involved in each analysis is presented in Supplemental Table S4. All post hoc comparisons of hive treatment
means within each wildflower strip treatment were generated from full models containing interaction terms, but
all nonsignificant interaction terms were subsequently dropped in the final analyses to more accurately gauge the
significance of main effects. All models were constructed with R Studio v. 1.0.13681. Initially, the floral resource
quantity and composition within field margins and wildflower strips in 2018 were compared. We calculated
bloom density as the mean bloom counts m−2 and Shannon Wiener diversity indices [∑[(pi)xln(pi), where pi = the
proportion of total specimens represented by species i] and compared them by season using Wilcoxon signed
rank tests for mean blooms m−2 and a one-way ANOVA for Shannon Wiener diversity indices. A datapoint from
one farm (HR AREC) in early spring was excluded from analyses because its value for bloom count m−2 was
more than 50 times greater than the median.
Bees. To assess whether wildflower strips, honey bee hive presence, or their interaction on farms induced
changes in conservation services, we first quantified wild bee abundance as the total number of non-Apis spp.
bees per farm from all bee bowls and blue vane traps combined per survey date. We calculated bee species rich-
ness (S), Shannon–Wiener diversity (H), and species evenness per farm [H/ln(S)]. We omitted a datapoint from
analyses driven by a spike in the abundance of a single species [Agapostemon virescens (Fabricius)] at one farm
Scientific Reports | (2021) 11:3202 | https://doi.org/10.1038/s41598-021-81967-1 8
Vol:.(1234567890)www.nature.com/scientificreports/
(M) from the June 2018 survey which generated outliers, making total wild bee abundance on the farm roughly
ten times greater than the median for early spring in 2018. We then analyzed data with models containing hive
treatment (presence/absence), wildflower strip treatment (presence/absence), and year fixed effects and their
interactions, season (late May/early June vs. August) as a covariate, and farm as a random effect. We fitted wild
bee abundance with a negative binomial distribution and species richness with a Poisson distribution using gen-
eralized linear mixed models (GLMMs), and analyzed diversity and evenness using linear mixed effects models
(LMMs). We fitted models with the same distributions to examine 2018 wild bee abundance, species richness,
diversity, and evenness data relative to the floral resources within field margins (control farms) or wildflower
strips. Models contained bloom density and bloom species diversity m−2 per farm nested within the wildflower
strip presence/absence treatment, a season covariate, two-way interactions with season, and a farm random
effect. The GLMMs were analyzed using the glmmTMB package82 and LMMs with the lme4 package83. When
year-by-treatment interaction terms were significant, we also ran pairwise post hoc tests on treatment effects by
year with the emmeans p ackage84. Additionally, we validated anecdotal evidence that feral honey bee hives in
the region are rare and confirm honey bee abundance on farms differed by hive presence/absence. To do so, we
analyzed total honey bee counts from bowls and traps per farm by hive treatment, year, and season fixed effects
with farm as a random effect using a GLMM fitted with a negative binomial distribution.
Fruit count. To determine whether wildflower strips, honey bee hive presence, or their interaction enhanced
fruit count on farms, we first calculated fruit count by year as the total number of strawberry or winter squash
fruit produced per farm. We then analyzed total fruit count per farm by crop in fully factorial GLMMs, fitting
strawberries with a negative binomial distribution to account for overdispersion and winter squash with a Pois-
son distribution. Predictor variables included year, hive treatment, wildflower strip treatment, and all two-way
interactions with farm as a random effect. When significant treatment-by-year interactions occurred, we ran
post hoc comparisons of treatment effects by year. Due to the limited number of farms producing winter squash
during 2018, possibly due to heat suppressing female flower production85, replication was insufficient to include
a wildflower strip-by-hive treatment interaction in the GLMM. Thus, we ran an additional GLM for 2017 winter
squash fruit count data including a wildflower strip-by-hive interaction effect. We investigated fruit count rela-
tive to honey bee density by analyzing fruit count with separate GLMMs containing honey bee abundance, hive
distance, or number of hives as predictor variables each fully crossed with year, and farm as a random effect.
To determine whether variation among wild bee populations corresponded to changes in fruit count, we
regressed strawberry fruit count by bee data collected during the early spring and winter squash fruit count by
the bee data collected during the summer sampling efforts. Separate GLMMs analyzed fruit count by wild bee
abundance, diversity, species richness, or evenness predictor variables, each of which was fully crossed with
year, with farm as a random effect. Again, we used a negative binomial distribution to analyze strawberry and a
Poisson distribution to analyze winter squash fruit count.
Data availability
The datasets generated during and/or analyzed during the current study were deposited in the Ag Data Com-
mons, https://data.nal.usda.gov/dataset/data-honey-bee-hives-decrease-wild-bee-abundance-species-richness-
and-fruit-count-farms-regardless-wildfl ower-strips.
Received: 1 September 2020; Accepted: 12 January 2021
References
1. Steffan-Dewenter, I., Potts, S. G. & Packer, L. Pollinator diversity and crop pollination services are at risk. Trends Ecol. Evol. 20,
651–652 (2005).
2. Aizen, M. A., Garibaldi, L. A., Cunningham, S. A. & Klein, A. M. Long-term global trends in crop yield and production reveal no
current pollination shortage but increasing pollinator dependency. Curr. Biol. 18, 1572–1575 (2008).
3. Garibaldi, L. A., Aizen, M. A., Klein, A. M., Cunningham, S. A. & Harder, L. D. Global growth and stability of agricultural yield
decrease with pollinator dependence. Proc. Natl. Acad. Sci. 108, 5909–5914 (2011).
4. Goulson, D. Effects of introduced bees on native ecosystems. Annu. Rev. Ecol. Evol. Syst. 34, 1–26 (2003).
5. Paini, D. Impact of the introduced honey bee (Apis mellifera) (Hymenoptera: Apidae) on native bees: A review. Aust. Ecol. 29,
399–407 (2004).
6. Aslan, C. E., Liang, C. T., Galindo, B., Kimberly, H. & Topete, W. The role of honey bees as pollinators in natural areas. Nat. Areas
J. 36, 478–489 (2016).
7. Mallinger, R. E., Gaines-Day, H. R. & Gratton, C. Do managed bees have negative effects on wild bees? A systematic review of the
literature. PLoS ONE 12, e0189268 (2017).
8. Wignall, V. R. et al. Seasonal variation in exploitative competition between honeybees and bumblebees. Oecologia 192, 351–361
(2020).
9. Thomson, D. M. Detecting the effects of introduced species: A case study of competition between Apis and Bombus. Oikos 114,
407–418 (2006).
10. Franco, E. L., Aguiar, C. M. & Ferreiraz, V. S. Plant use and niche overlap between the introduced honey bee (Apis mellifera) and
the native bumblebee (Bombus atratus) (Hymenoptera: Apidae) in an area of tropical mountain vegetation in northeastern Brazil.
Sociobiology 53, 141–150 (2009).
11. Herbertsson, L., Lindström, S. A., Rundlöf, M., Bommarco, R. & Smith, H. G. Competition between managed honeybees and wild
bumblebees depends on landscape context. Basic Appl. Ecol. 17, 609–616 (2016).
12. Thomson, D. M. Local bumble bee decline linked to recovery of honey bees, drought effects on floral resources. Ecol. Lett. 19,
1247–1255 (2016).
13. Greenleaf, S. S. & Kremen, C. Wild bees enhance honey bees’ pollination of hybrid sunflower. Proc. Natl. Acad. Sci. 103, 13890–
13895 (2006).
Scientific Reports | (2021) 11:3202 | https://doi.org/10.1038/s41598-021-81967-1 9
Vol.:(0123456789)www.nature.com/scientificreports/
14. Badano, E. I. & Vergara, C. H. Potential negative effects of exotic honey bees on the diversity of native pollinators and yield of
highland coffee plantations. Agric. For. Entomol. 13, 365–372 (2011).
15. Brittain, C., Williams, N., Kremen, C. & Klein, A.-M. Synergistic effects of non-Apis bees and honey bees for pollination services.
Proc. R. Soc. B Biol. Sci. 280, 20122767 (2013).
16. Müller, H. T. Interaction Between Bombus terrestris and Honeybees in Red Clover Fields Reduces Abundance of Other Bumblebees
and Red Clover Yield and Honeybees in Red Clover Fields Reduces Abundance of Other Bumblebees and Red Clover Yield (Norwegian
University of Life Sciences, Ås, 2016).
17. Grass, I. et al. Pollination limitation despite managed honeybees in South African macadamia orchards. Agric. Ecosyst. Environ.
260, 11–18 (2018).
18. hUallacháin, D. Ó. (United Nations Convention to Combat Desertification, Bonn, Germany, 2017).
19. Vaughan, M. & Skinner, M. Using 2014 farm bill programs for pollinator conservation. USDA Biol. Tech. Note 78, 2nd Ed. (2015).
20. Vaughan, M. & Skinner, M. Using Farm Bill programs for pollinator conservation. USDA-NRCS National Plant Data Center, USDA
Biol. Tech. Note 78 (2008).
21. FSA. CP42 pollinator habitat: Establishing and supporting diverse pollinator-friendly habitat. (Farm Service Agency, U.S. Depart-
ment of Agriculture, Washington, D.C., 2013).
22. Venturini, E. M., Drummond, F. A., Hoshide, A. K., Dibble, A. C. & Stack, L. B. Pollination reservoirs for wild bee habitat enhance-
ment in cropping systems: a review. Agroecol. Sustain. Food Syst. 41, 101–142 (2017).
23. Wood, T. J., Holland, J. M., Hughes, W. O. & Goulson, D. Targeted agri-environment schemes significantly improve the population
size of common farmland bumblebee species. Mol. Ecol. 24, 1668–1680 (2015).
24. Haaland, C. & Gyllin, M. Butterflies and bumblebees in greenways and sown wildflower strips in southern Sweden. J. Insect Conserv.
14, 125–132 (2010).
25. Ponisio, L. C., M’Gonigle, L. K. & Kremen, C. On-farm habitat restoration counters biotic homogenization in intensively managed
agriculture. Glob. Change Biol. 22, 704–715 (2016).
26. Dolezal, A. G., Clair, A. L. S., Zhang, G., Toth, A. L. & O’Neal, M. E. Native habitat mitigates feast–famine conditions faced by
honey bees in an agricultural landscape. Proc. Natl. Acad. Sci. 116, 25147–25155 (2019).
27. Venturini, E., Drummond, F., Hoshide, A., Dibble, A. & Stack, L. B. Pollination reservoirs in lowbush blueberry (Ericales: Eri-
caceae). J. Econ. Entomol. 110, 333–346 (2017).
28. Morandin, L. A. & Kremen, C. Hedgerow restoration promotes pollinator populations and exports native bees to adjacent fields.
Ecol. Appl. 23, 829–839 (2013).
29. Blaauw, B. R. & Isaacs, R. Flower plantings increase wild bee abundance and the pollination services provided to a pollination-
dependent crop. J. Appl. Ecol. 51, 890–898 (2014).
30. Feltham, H., Park, K., Minderman, J. & Goulson, D. Experimental evidence of the benefit of wild flower strips to crop pollination.
Ecol. Evolut. 5, 3523–3530 (2015).
31. Gross, C. & Mackay, D. Honeybees reduce fitness in the pioneer shrub Melastoma affine (Melastomataceae). Biol. Cons. 86, 169–178
(1998).
32. do Carmo, R. M., Franceschinelli, E. V. & da Silveira, F. A. Introduced honeybees (Apis mellifera) reduce pollination success without
affecting the floral resource taken by native pollinators. Biotropica 36, 371–376 (2004).
33. Bruckman, D. & Campbell, D. R. Floral neighborhood influences pollinator assemblages and effective pollination in a native plant.
Oecologia 176, 465–476 (2014).
34. Garibaldi, L. A. et al. Wild pollinators enhance fruit set of crops regardless of honey bee abundance. Science 339, 1608–1611 (2013).
35. Carvalheiro, L. G. et al. Natural and within-farmland biodiversity enhances crop productivity. Ecol. Lett. 14, 251–259 (2011).
36. Jönsson, A. M. et al. Modelling the potential impact of global warming on Ips typographus voltinism and reproductive diapause.
Clim. Change 109, 695–718 (2011).
37. Scheper, J. et al. Local and landscape-level floral resources explain effects of wildflower strips on wild bees across four European
countries. J. Appl. Ecol. 52, 1165–1175 (2015).
38. Krimmer, E., Martin, E. A., Krauss, J., Holzschuh, A. & Steffan-Dewenter, I. Size, age and surrounding semi-natural habitats
modulate the effectiveness of flower-rich agri-environment schemes to promote pollinator visitation in crop fields. Agric. Ecosyst.
Environ. 284, 106590 (2019).
39. Klein, A. M. et al. Wild pollination services to California almond rely on semi-natural habitat. J. Appl. Ecol. 49, 723–732 (2012).
40. Grab, H., Poveda, K., Danforth, B. & Loeb, G. Landscape context shifts the balance of costs and benefits from wildflower borders
on multiple ecosystem services. Proc. R. Soc. B Biol. Sci. 285, 20181102 (2018).
41. Prendergast, K. S., Menz, M. H., Dixon, K. W. & Bateman, P. W. The relative performance of sampling methods for native bees:
An empirical test and review of the literature. Ecosphere 11, e03076 (2020).
42. Cane, J. H., Minckley, R. L. & Kervin, L. J. Sampling bees (Hymenoptera: Apiformes) for pollinator community studies: pitfalls of
pan-trapping. J. Kansas Entomol. Soc. 73, 225–231 (2000).
43. O’Connor, R. S. et al. Monitoring insect pollinators and flower visitation: The effectiveness and feasibility of different survey
methods. Methods Ecol. Evol. 10, 2129–2140. https://doi.org/10.1111/2041-210x.13292 (2019).
44. Graystock, P., Blane, E. J., McFrederick, Q. S., Goulson, D. & Hughes, W. O. Do managed bees drive parasite spread and emergence
in wild bees?. Int. J. Parasitol. Parasites Wildlife 5, 64–75 (2016).
45. Alger, S. A., Burnham, P. A., Boncristiani, H. F. & Brody, A. K. RNA virus spillover from managed honeybees (Apis mellifera) to
wild bumblebees (Bombus spp.). PloS One 14, e0217822 (2019).
46. Schaffer, W. M. et al. Competition, foraging energetics, and the cost of sociality in three species of bees. Ecology 60, 976–987 (1979).
47. Pleasants, J. M. Bumblebee response to variation in nectar availability. Ecology 62, 1648–1661 (1981).
48. Ginsberg, H. S. Foraging ecology of bees in an old field. Ecology 64, 165–175 (1983).
49. Schaffer, W. M. et al. Competition for nectar between introduced honey bees and native North American bees and ants. Ecology
64, 564–577 (1983).
50. Gross, C. L. The effect of introduced honeybees on native bee visitation and fruit-set in Dillwynia juniperina (Fabaceae) in a
fragmented ecosystem. Biol. Cons. 102, 89–95 (2001).
51. Hudewenz, A. & Klein, A.-M. Competition between honey bees and wild bees and the role of nesting resources in a nature reserve.
J. Insect Conserv. 17, 1275–1283 (2013).
52. Johnson, L. K. & Hubbell, S. P. Aggression and competition among stingless bees: Field studies. Ecology 55, 120–127 (1974).
53. Winfree, R., Fox, J. W., Williams, N. M., Reilly, J. R. & Cariveau, D. P. Abundance of common species, not species richness, drives
delivery of a real-world ecosystem service. Ecol. Lett. 18, 626–635 (2015).
54. Woodcock, B. A. et al. Meta-analysis reveals that pollinator functional diversity and abundance enhance crop pollination and
yield. Nat. Commun. 10, 1–10 (2019).
55. Garibaldi, L. A. et al. From research to action: enhancing crop yield through wild pollinators. Front. Ecol. Environ. 12, 439–447
(2014).
56. Connelly, H., Poveda, K. & Loeb, G. Landscape simplification decreases wild bee pollination services to strawberry. Agric. Ecosyst.
Environ. 211, 51–56 (2015).
57. MacInnis, G. & Forrest, J. R. K. Pollination by wild bees yields larger strawberries than pollination by honey bees. J. Appl. Ecol. 56,
824–832. https://doi.org/10.1111/1365-2664.13344 (2019).
Scientific Reports | (2021) 11:3202 | https://doi.org/10.1038/s41598-021-81967-1 10
Vol:.(1234567890)www.nature.com/scientificreports/
58. Seeley, T. D. Social foraging by honeybees: how colonies allocate foragers among patches of flowers. Behav. Ecol. Sociobiol. 19,
343–354 (1986).
59. Bänsch, S., Tscharntke, T., Gabriel, D. & Westphal, C. Crop pollination services: complementary resource use by social vs solitary
bees facing crops with contrasting flower supply. J. Appl. Ecol. https://doi.org/10.1111/1365-2664.13777 (2020).
60. Nye, W. P. & Anderson, J. L. Insect pollinators frequenting strawberry blossoms and the effect of honey bees on yield and fruit
quality. J. Am. Soc. Horticult. Sci. 99, 40 (1974).
61. De Oliveira, D., Savoie, L. & Vincent, C. in VI International Symposium on Pollination 288, 420–424 (1990).
62. Chagnon, M., Gingras, J. & DeOliveira, D. Complementary aspects of strawberry pollination by honey and indigenous bees
(Hymenoptera). J. Econ. Entomol. 86, 416–420 (1993).
63. Horth, L. & Campbell, L. A. Supplementing small farms with native mason bees increases strawberry size and growth rate. J. Appl.
Ecol. 55, 591–599 (2018).
64. Pfister, S. C. et al. Dominance of cropland reduces the pollen deposition from bumble bees. Sci. Rep. 8, 13873 (2018).
65. Artz, D. R. & Nault, B. A. Performance of Apis mellifera, Bombus impatiens, and Peponapis pruinosa (Hymenoptera: Apidae) as
pollinators of pumpkin. J. Econ. Entomol. 104, 1153–1161 (2011).
66. Petersen, J., Huseth, A. & Nault, B. Evaluating pollination deficits in pumpkin production in New York. Environ. Entomol. 43,
1247–1253 (2014).
67. McGrady, C., Troyer, R. & Fleischer, S. Wild bee visitation rates exceed pollination thresholds in commercial cucurbita agroeco-
systems. J. Econ. Entomol. 113, 562–574 (2020).
68. Geslin, B. et al. Advances in Ecological Research Vol. 57, 147–199 (Elsevier, San Diego, 2017).
69. Steffan-Dewenter, I. & Tscharntke, T. Resource overlap and possible competition between honey bees and wild bees in central
Europe. Oecologia 122, 288–296 (2000).
70. Torné-Noguera, A., Rodrigo, A., Osorio, S. & Bosch, J. Collateral effects of beekeeping: Impacts on pollen-nectar resources and
wild bee communities. Basic Appl. Ecol. 17, 199–209 (2016).
71. Free, J. B. Insect Pollination of Crops (Academic Press, London, 1970).
72. Delaplane, K. S., Mayer, D. R. & Mayer, D. F. Crop pollination by bees. (CABI, 2000).
73. Phillips, B. Current honey bee and bumble bee stocking information. Michigan State University, MSU Extension: Pollination (2019).
https://www.canr.msu.edu/news/current_honey_bee_stocking_information_and_an_introduction_to_commercial_bu.
74. Angelella, G. M. & O’Rourke, M. E. Pollinator habitat establishment after organic and no-till seedbed preparation methods.
HortScience 52, 1349–1355 (2017).
75. Blaauw, B. R. & Isaacs, R. Larger patches of diverse floral resources increase insect pollinator density, diversity, and their pollination
of native wildflowers. Basic Appl. Ecol. 15, 701–711 (2014).
76. Klatt, B. K. et al. Bee pollination improves crop quality, shelf life and commercial value. Proc. R. Soc. B Biol. Sci. 281, 20132440
(2014).
77. King, S. R., Davis, A. R. & Wehner, T. C. Classical genetics and traditional breeding. In Genetics, Genomics, and Breeding of Cucurbits
(eds. Wang, Y.-H. et al.) 61–92 (CRC Press, 2012).
78. Kronenberg, H. G. Poor fruit setting in strawberries. I. Euphytica 8, 47–57 (1959).
79. Kronenberg, H. G., Braak, J. & Zeilinga, A. Poor fruit setting in strawberries. II. Euphytica 8, 245–251 (1959).
80. Robinson, R. W. & Decker-Walters, D. S. Cucurbits (CAB Intl., New York, 1997).
81. R: A Language and Environment for Statistical Computing (R Foundation for Statistical Computing, Vienna, Austria, 2019).
82. Magnusson, A. et al. Package ‘glmmTMB’. R Package Version 0.2. 0 (2017).
83. Bates, D., Sarkar, D., Bates, M. D. & Matrix, L. The lme4 package. R Package Version 2, 74 (2007).
84. Lenth, R., Singmann, H., Love, J., Buerkner, P. & Herve, M. Emmeans: Estimated marginal means, aka least-squares means. R
Package Version 1, 3 (2018).
85. Wien, H., Stapleton, S., Maynard, D., McClurg, C. & Riggs, D. Flowering, sex expression, and fruiting of pumpkin (Cucurbita sp.)
cultivars under various temperatures in greenhouse and distant field trials. HortScience 39, 239–242 (2004).
Acknowledgements
We would like to thank the collaborating farms. Bob Glennon and Velva Groover helped establish wildflower
strips; Roy Flanagan, Jane Lassiter, and Michael Sigrist helped locate collaborating farms; Jayesh Samtani pro-
vided strawberry plants; Erica Head, Monique Ayers, Sarah Head, and Courtney Floyd assisted with field work;
and Sam Droege provided bee species determinations. Lisa Horth and Heather Grab provided insightful com-
ments on the manuscript. Funds were provided by a NIFA Agroecosystem Management award to M. O’Rourke
number 2015-67019-23215. The United States Department of Agriculture is an equal opportunity provider and
employer. The use of trade names or commercial products in this publication is to provide information for the
and does not imply recommendation or endorsement by the USDA. We have no conflicts of interest to report.
Author contributions
Study conceived and designed by M.O. and G.A.; data acquired by C.M. and G.A.; data analyzed by G.A.; manu-
script drafting led by G.A.; all authors contributed critically to the drafts and gave final approval for publication.
Competing interests
The authors declare no competing interests.
Additional information
Supplementary Information The online version contains supplementary material available at https://doi.
org/10.1038/s41598-021-81967-1.
Correspondence and requests for materials should be addressed to G.M.A.
Reprints and permissions information is available at www.nature.com/reprints.
Publisher’s note Springer Nature remains neutral with regard to jurisdictional claims in published maps and
institutional affiliations.
Scientific Reports | (2021) 11:3202 | https://doi.org/10.1038/s41598-021-81967-1 11
Vol.:(0123456789)www.nature.com/scientificreports/
Open Access This article is licensed under a Creative Commons Attribution 4.0 International
License, which permits use, sharing, adaptation, distribution and reproduction in any medium or
format, as long as you give appropriate credit to the original author(s) and the source, provide a link to the
Creative Commons licence, and indicate if changes were made. The images or other third party material in this
article are included in the article’s Creative Commons licence, unless indicated otherwise in a credit line to the
material. If material is not included in the article’s Creative Commons licence and your intended use is not
permitted by statutory regulation or exceeds the permitted use, you will need to obtain permission directly from
the copyright holder. To view a copy of this licence, visit http://creativecommons.org/licenses/by/4.0/.
© The Author(s) 2021
Scientific Reports | (2021) 11:3202 | https://doi.org/10.1038/s41598-021-81967-1 12
Vol:.(1234567890)You can also read