Host Phylogenetic Relatedness and Soil Nutrients Shape Ectomycorrhizal Community Composition in Native and Exotic Pine Plantations - MDPI
←
→
Page content transcription
If your browser does not render page correctly, please read the page content below
Article
Host Phylogenetic Relatedness and Soil Nutrients
Shape Ectomycorrhizal Community Composition in
Native and Exotic Pine Plantations
Chen Ning 1,2,3, *, Gregory M. Mueller 2,3 , Louise M. Egerton-Warburton 2,3 , Wenhua Xiang 1
and Wende Yan 1
 1    Faculty of Life Science and Technology, Central South University of Forestry and Technology,
      Changsha 410004, China; xiangwh2005@163.com (W.X.); csfuywd@hotmail.com (W.Y.)
 2    Program in Plant Biology and Conservation, Northwestern University, Evanston, IL 60208, USA;
      gmueller@chicagobotanic.org (G.M.M.); legerton@chicagobotanic.org (L.M.E.-W.)
 3    Chicago Botanic Garden, Glencoe, IL 60022, USA
 *    Correspondence: ningchen0059@163.com; Tel.: +86-138-111-88990

 Received: 1 March 2019; Accepted: 12 March 2019; Published: 15 March 2019

 Abstract: Exotic non-native Pinus species have been widely planted or become naturalized in
 many parts of the world. Pines rely on ectomycorrhizal (ECM) fungi mutualisms to overcome
 barriers to establishment, yet the degree to which host specificity and edaphic preferences influence
 ECM community composition remains poorly understood. In this study, we used high-throughput
 sequencing coupled with soil analyses to investigate the effect of host plant identity, spatial distance
 and edaphic factors on ECM community composition in young (30-year-old) native (Pinus massoniana
 Lamb.) and exotic (Pinus elliottii Engelm.) pine plantations in China. The ECM fungal communities
 comprised 43 species with the majority belonging to the Thelephoraceae and Russulaceae. Most
 species were found associated with both host trees while certain native ECM taxa (Suillus) showed
 host specificity to the native P. massoniana. ECM fungi that are known to occur exclusively with
 Pinus (e.g., Rhizopogon) were uncommon. We found no significant effect of host identity on ECM
 communities, i.e., phylogenetically related pines shared similar ECM fungal communities. Instead,
 ECM fungal community composition was strongly influenced by site-specific abiotic factors and
 dispersal. These findings reinforce the idea that taxonomic relatedness might be a factor promoting
 ECM colonization in exotic pines but that shifts in ECM communities may also be context-dependent.

 Keywords: ectomycorrhizal fungi; host origin; host specificity; Pinus massoniana; Pinus elliottii

1. Introduction
     Plantation forestry has been widely used to accelerate reforestation, offset greenhouse gas
emissions, and relieve timber demands from native forests [1]. Fast-growing and high-yielding
exotic tree species such as Pinus and Eucalyptus are intensively planted in monocultures and frequently
introduced outside their natural range. However, a tree species planted outside its native range
can have dramatic and long-lasting impacts on biogeochemical cycling (carbon, nitrogen), water
and nutrient availability, and mycorrhizal communities [2,3]. Here, we focus on ectomycorrhizal
(ECM) fungi, the ubiquitous symbiont of many forest trees, and Pinus (pine), the most widely planted
plantation tree [4].
     Pines are obligately dependent on symbioses with ECM fungi for nutrient uptake, growth and
plant survival, and ECM are therefore important components of forest management. More than
200 species of ECM fungi representing 54 genera have been intentionally introduced in the roots of pine
seedlings during the development of large-scale plantations [5]. This co-introduction has facilitated

Forests 2019, 10, 263; doi:10.3390/f10030263                                   www.mdpi.com/journal/forests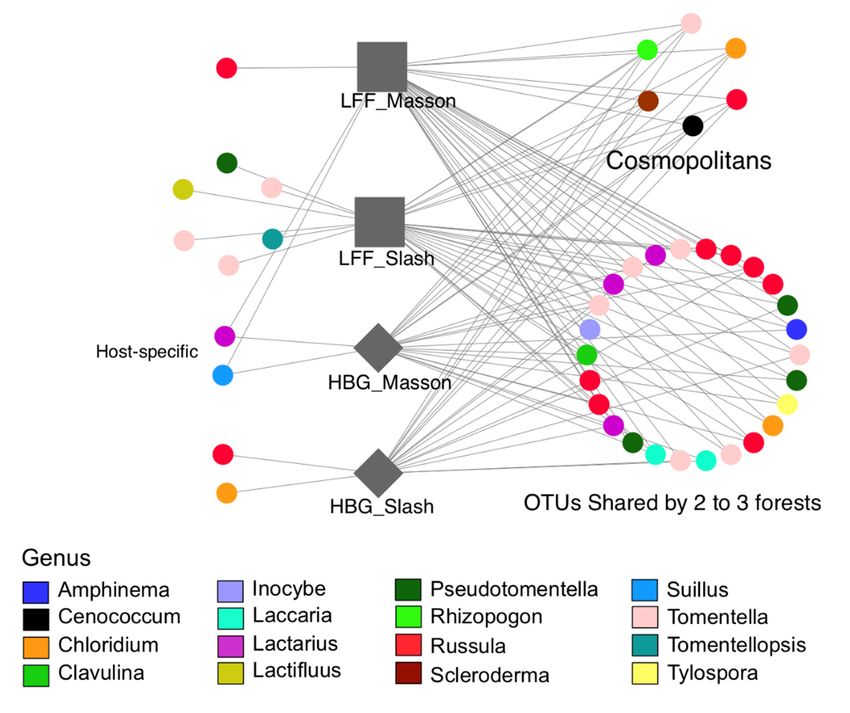
Forests 2019, 10, 263                                                                                2 of 18

a massive range expansion of the ECM–Pinus mutualism, a situation that is widely compared to
co-invasion (or ‘enemy escape’ [4,6–9]). Exotic pines may also form novel symbioses with native
ECM fungi or cosmopolitan mutualists [10]. Nevertheless, plants may be limited by the availability of
compatible ECM fungal inoculum. Exotic pine ECM communities are remarkable for their low species
richness (10 km) may limit the stochastic dispersal of
fungal propagules from one location (native forest) to another (plantation) whereas deterministic traits
such as dispersal via spores [14,18] versus mycorrhizal root tips and hyphal networks may operate at
finer scales [19–22]. In addition, biotic (e.g., host nutrient demands, seed dispersal) and abiotic factors
(e.g., soil chemistry) may facilitate ECM fungal species with physiological and ecological adaptations
depending on the environmental context [23].
      Recent evidence has demonstrated that phylogenetic distance between exotic and native hosts
might explain their (dis)similarities in ECM community composition and richness [24,25]. For example,
studies have shown that co-occurring exotic pine and native trees host similar ECM fungal communities
and share the same dominant ECM fungal species [8,10,26–28]. Most ECM fungal species were also
host generalists and, as a result, species-specific ECM taxa were rare [29,30]. Conversely, other studies
show that hosts in different subgenera (e.g., hard pines vs. soft pines) better explained the covariation
between exotic and native pines and their ECM communities [10,25]. Thus, a major challenge is to
disentangle the effects of host phylogeny from environmental covariation on ECM-host interactions.
      Here, we examined the influence of phylogenetic relatedness, distance, and environmental factors
on ECM communities in plantations of exotic slash pine (Pinus elliottii Engelm.) adjacent to native
Pinus massoniana Lamb. (masson pine) at two sites. Our study sites were selected to represent forests
with inherent differences in soil N and P fertility. Both plantations were located in southern China.
Plantations comprise ~69 million hectares of forest in China, or ~36% of the total forest area [31].
Masson pine is a slow-growing, dominant native species in native forests in subtropical China. Slash
pine was introduced from the southeastern U.S. during reforestation efforts in the 1920s [32], and is
now one of the most popular plantation timber species due to its high-quality timber, fast growth, and
resistance to insect damage [33]. The standardized forestry practices (e.g., thinning) used across both
study sites makes this a model system in which to examine the effects of native versus exotic pines on
ECM communities. We used high-throughput sequencing analyses of ECM communities coupled with
analyses of soil physicochemical properties to address two questions:

(1)    Do closely related exotic and native host species support similar ECM communities?
(2)    To what extent do neutral (dispersal) versus niche (abiotic factors) shape ECM assemblages in
       exotic and native pines?

2. Materials and Methods

2.1. Study Sites
     The study was carried out at two forest areas of south China, Longli Forest Farm, Guizhou
Province (LFF, 26◦ 450 N, 106◦ 450 E), and Hunan Botanic Garden, Hunan Province (HBG, 28◦ 600 N,
113◦ 200 E) (Figure S1). LFF has a subtropical humid climate characterized by abundant precipitation
and mild temperatures; mean annual precipitation is 1077 mm and average temperatures is 15 ◦ C.
The soil is a well-drained sandy-loam yellow soil developed from quartz sandstone parent rock,
classified as Hapli-Udic Ferrosols according to the Chinese Soil Taxonomic Classification System
(CSTC [34]). In HBG, the climate is typical mid-range subtropical monsoonal with mean annual
precipitation of 1422 mm and annual air temperature of 17.2 ◦ C. The soil is a well-drained clay-loam
red soil developed from slate parent rock, classified as Alliti-Udic Ferrosols by the CSTC. Both masson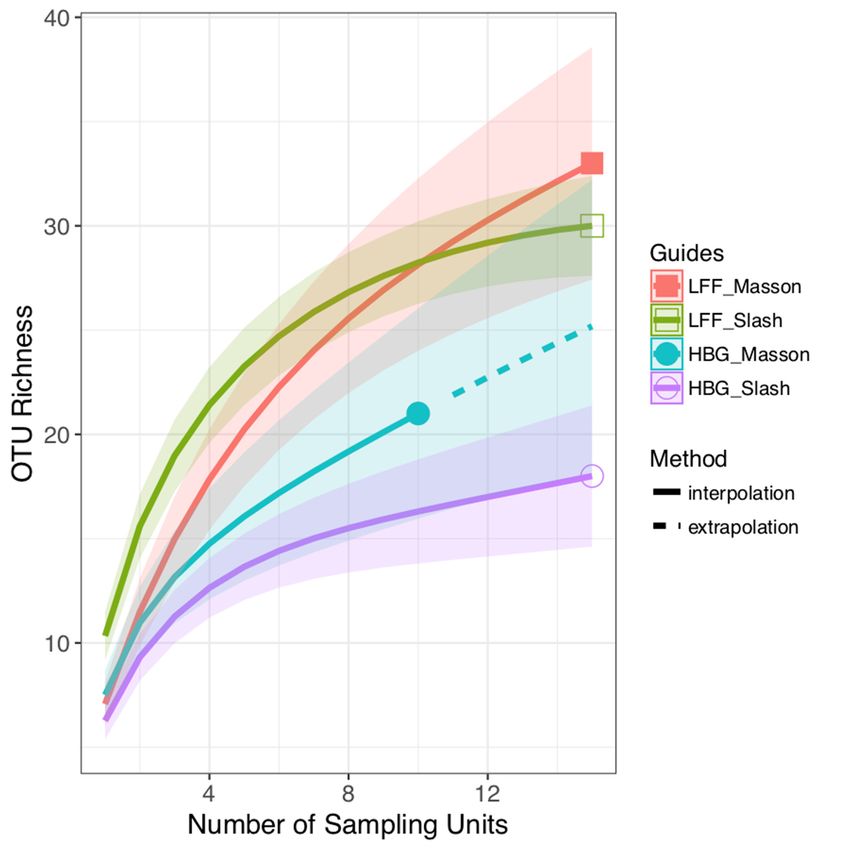
Forests 2019, 10, 263                                                                                  3 of 18

pines and slash pine plantations were planted in 1988 as monocultures after clear-cutting of mixed
evergreen broadleaved (Fagaceae)-conifer mixed forests (masson pines).
      In each site and forest type, two (HBG) or three (MA) 20 × 20 m plots were established at least
50 m apart; the small stand size in HBG limited the number of plots possible (Figure S1). Within each
plot, five randomly selected mature pine trees (DBH 15–20 cm) separated by at least 4 m were selected
as ‘island’ trees.

2.2. Sampling Methods
     We sampled the ECM community in each site and tree species using a combination of sporocarp
surveys (collected monthly since August 2015) and hyphal in-growth bags. In-growth bags were made
of anti-static polyester fabric with 50 µm diameter pores and filled with sand (0.6~1.8 mm) that had
been washed with 5% (v/v) HCl and 10% (v/v) H2 O2 , thoroughly rinsed with deionized water, and
dried. Such bags allow for efficient, well-replicated community sampling of active ECM fungi hyphae
growing in soil [35,36]. In July 2016, we planted three 5 × 5 cm mesh bags under each island tree.
Bags were buried 45 cm from the base of the tree along one of the four cardinal directions, and 5 cm
below the soil surface (A horizon). Additional bags containing sand were stored in the laboratory as
negative controls. All bags were harvested in October 2016 and transported to the laboratory over
ice. At harvest, soil cores (5 cm diameter × 10 cm deep) were collected next to each buried bag. Soil
cores were homogenized and pooled by each ‘island’ tree, sieved to 2-mm to remove gravel and coarse
organic matter, and used for soil physical and chemical analyses.

2.3. Soil Physicochemical Analysis
      Soil pH was determined in a soil suspension with soil: water ratio of 1:2.5 (w/v) using a Delta
320 pH-meter (Melter-Toledo Instruments Co., Shanghai, China). Soil texture was determined by
the hydrometer method for estimating particle size. Soil ammonium (NH4 -N), nitrate (NO3 -N),
and phosphate (PO4 ) were extracted with 2M KCl and measured using a continuous flow analyzer
(SAN++, Skakar, Breda, Holland). Available potassium (K) was determined on ammonium acetate
extraction by flame photometry (Model FP6410; Jingke Ltd. Co. Shanghai, China). Total N was
measured using Semi-micro-Kjedahl digestion with a mixture of H2 SO4 , K2 SO4 , CuSO4 and Se.
Additional soil samples were digested with HNO3 : HCl (1:3), and analyzed for total P using a
molybdenum colorimetric method and macro- or micronutrients (Ca, Mg, Fe, Cu, Pb, Zn, Mn) using
atomic absorption spectrophotometry (Mode AA-7000; Shimadzu Corp. Nakagyo-ku, Kyoto, Japan).
Soil samples for organic matter analysis were oven-dried at 105 ◦ C, milled and sieved through 0.25 mm
mesh and analyzed by wet combustion method (Walkley-Black procedure) with potassium dichromate.

2.4. Molecular Identification of Ectomycorrhizal Fungal Community
      Fungal hyphae were obtained from the mesh bag following [36]. Briefly, each bag was emptied
into a sterile 50 mL centrifuge tube, 10 mL of sterile deionized water was added and each tube was
vortexed for 2 min. After a 5 min settling period, the top 2 mL of suspension was transferred to a new,
sterile 2 mL centrifuge tube and the contents pelleted via centrifugation. Hyphal pellets were pooled
by ‘island tree’, which yielded 55 samples from forest types across both the LFF and HBG sites. We also
extracted DNA from 18 different ECM sporocarps that had been collected opportunistically from both
sites. These extracts were only used to create a positive control (or mock ECM community) comprising
equimolar aliquots of genomic DNA from each fungal species (Table S2). We did not include these
fungi in analyses of masson and slash pine ECM communities because sporocarp sampling was
infrequent, and local farmers collect edible ECM sporocarps (e.g., Lactarius) in pine plantations.
      DNA from sample mesh bags and negative controls (bags stored in the laboratory) was extracted
using Mobio PowerSoil kit (Hercules, CA, USA) following the manufacturer’s instructions for
maximum DNA yield. The ITS1 region of the fungal rDNA subunit was amplified by polymerase
chain reaction (PCR) (95 ◦ C for 2 min, followed by 25 cycles at 95 ◦ C for 30 s, 55 ◦ C for 30 s, and 72 ◦ C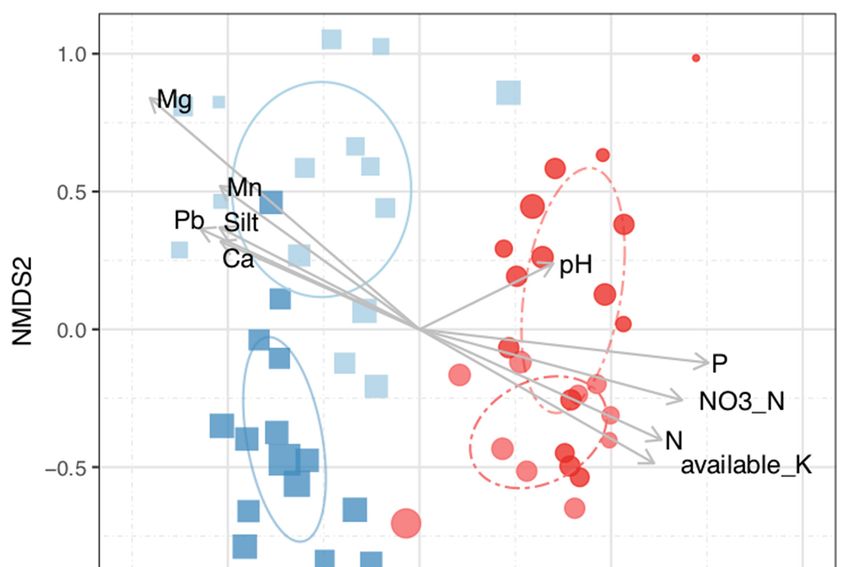
Forests 2019, 10, 263                                                                             4 of 18

for 30 s and a final extension at 72 ◦ C for 5 min) using primers ITS1F and ITS2 [37]. PCR reactions
were performed in triplicate—20 µL mixture containing 4 µL of 5 × FastPfu Buffer, 2 µL of 2.5 mM
dNTPs, 0.8 µL of each primer (5 µM), 0.4 µL of FastPfu Polymerase, and 10 ng of template DNA.
Amplicons were extracted from 2% agarose gels and purified using the AxyPrep DNA Gel Extraction
Kit (Axygen Biosciences, Union City, CA, USA) according to the manufacturer’s instructions and
quantified using QuantiFluor™-ST (Promega, Fitchburg, WI, USA). Purified amplicons were pooled
in equimolar concentrations and paired-end sequenced (2 × 250 bp) on an Illumina MiSeq platform
according to the standard protocols at Majorbio Technic Group Laboratory, Shanghai, China.
     Raw Illumina fastq files were demultiplexed and quality-filtered using QIIME v1.17 [38] with
the following criteria: reads were truncated at any site receiving an average quality score of  0.05; pairwise
Wilcoxon rank-sum tests). We used this value as a conservative threshold for taxon inclusion in the
species richness analysis.
     DNA sequences in this study have been deposited in Sequence Read Archive of the NCBI database
under accession number SRP113701.

2.5. Statistical Analyses
     All statistical analyses were conducted in R v3.3.2 (R Foundation for Statistical Computing;
available at http://www.R-project.org) with indicated packages.
     Prior to all tests, read abundances were normalized using the ‘metagenomeSeq’ package [49],
since rarefaction may reduce the sensitivity of analyses [50,51]. Soil properties were standardized
using scale transformation (function ‘scale’ in R). Data sets were then checked for multi-collinearity
among variables using the variation inflation factor (VIF) function of the ‘FMSB’ package, and highly
correlated variables removed (variation inflation factor scores >5: C, K, Cu, Fe, % sand and clay).
     We calculated ECM species richness (S), evenness (Shannon–Wiener index), estimated species
richness (Chao1 richness), and species accumulation curves (Mao Tau) for each sample. Differences
in species richness and evenness between host tree species and sites were analyzed using two-way
analysis of variance (ANOVA) with post-hoc Tukey Honestly Significant Difference (HSD) tests for
significant variables. Indicator species analysis was used to identify OTUs unique to each host species
and site (‘indicspecies’ [52]). This analysis was based on presence-absence of each ECM fungal OTU
in each ‘focal’ tree. The indicator values were group-equalized and their statistical significance was
tested by a randomization procedure with 999 permutations. Heat maps and network-based analyses
(Cytoscape 3.7.0 [53]) were used to visualize the number of ECM species that were cosmopolitan
Forests 2019, 10, 263 5 of 18
(present in all forest types), specific to a host species or site (i.e., only detected in one forest type) or
broadly dispersed (found in two or three sites).
Next, an ECM community distance matrix (Bray–Curtis dissimilarity, OTU abundances) and
environmental matrix (Euclidean dissimilarity, spatial distance and soil properties) were constructed.
We tested for differences in ECM community and soil properties between sampling sites and host
species using permutational multivariate analysis of variance (PERMANOVA; adonis function in
vegan, 999 permutations), and multivariate homogeneity of group dispersions (betadisper function in
vegan). Patterns of ECM community dissimilarity were visualized using non-metric multidimensional
scaling (NMDS). Differences in community structure were compared visually using centroids and 95%
confidence intervals associated with a χ2 -distribution around the standard error of the centroid.
To disentangle the relative importance of soil factors controlling ECM community composition,
we identified and fitted significant environmental vectors to the NMDS (envfit function in vegan;
999 permutations). Mantel tests were used to directly compare geographic distances with community
composition differences (mantel.rtest in ade4 package) and to determine differences in spatial scaling
between sites (mgram in ecodist package). These analyses were run using both abundance-based and
presence–absence ECM community data. Both analyses showed similar results (data not shown), and
only the abundance-based data are presented.
3. Results
Our initial dataset included a total of 2,921,761 raw sequence reads. After quality filtering, there
were 1,992,789 sequences for downstream analysis, with an average of 37,060 (±12,664 standard error
(SE)) reads per sample. These sequences clustered to 403 OTUs. Eighty-percent of the sequences
(1,593,614) were identified as putative ECM fungal species.
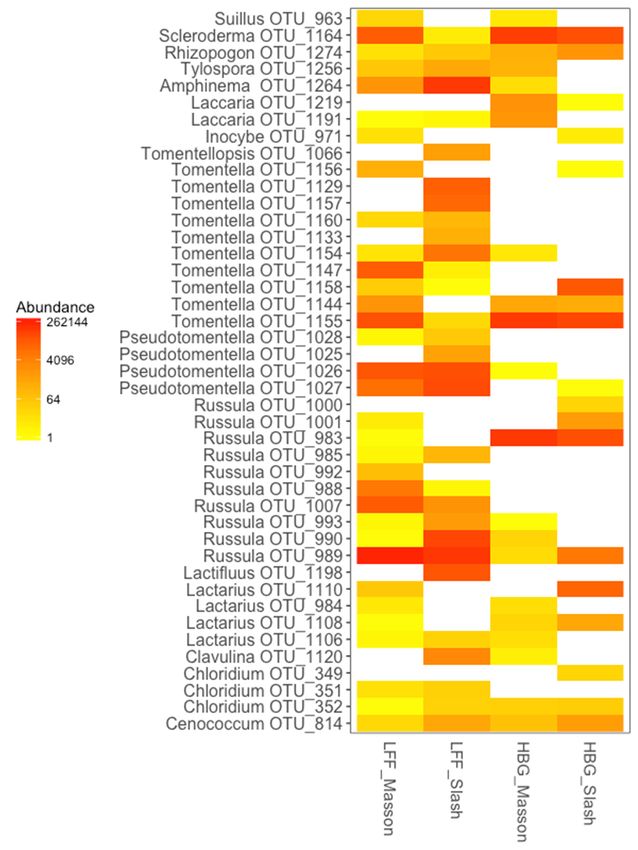
The ECM community comprised a broad range of phylogenetic lineages. A total of 43 ECM fungal
species were assigned to 16 genera, many of which were native to China. The most abundant taxa were
Russula and Tomentella with 10 OTUs each (Table 1; Figure 1). The majority of ECM species were either
cosmopolitan (14%) and found in all sites with both tree species (e.g., Cenococcum) or broadly dispersed
across sites and/or species (63%; e.g., Tylospora, Clavulina; Table 1; Figures 1 and 2). In contrast, Suillus
OTU_963 and Lactarius OTU_984 were specific to masson pine in both LFF and HBG while ECM
specific to slash pine were site dependent, e.g., Lactifluus in LFF and Chloridium OTU_349 in HBG.
Further, fewer fungal taxa were indicator species in masson pine than slash pine (IndVal; Table 1).
Analyses showed that ECM fungi of other native pines (e.g., P. yunnanensis) were indicator species
of masson pine. In contrast, a variety of ECM were indicator species in slash pine, including taxa
that were best matched to pines in North America (Clavulina) and Eastern Europe (Pseudotomentella;
Table 1). We also found significant differences in ECM community between sites (Figures 1 and 2),
whereby 44% of ECM fungal species were specific to HBG or LFF. Of the 43 ECM species identified in
the study, 16 were recovered only in LFF, most of which were species of Pseudotomentella (2 species),
Tomentella (6 species), or Russula (5 species). Conversely, only three ECM were restricted to HBG:
Laccaria OTU_1219, Chloridium OTU_349, and Russula OTU_1000.Forests 2019, 10, 263 6 of 18
Forests 2019, 10, x FOR PEER REVIEW 6 of 18
Figure 1. Ectomycorrhizal fungal operational units (OTUs) showing sequence read abundance across
Figure 1. Ectomycorrhizal fungal operational units (OTUs) showing sequence read abundance across
sites for each pine host. LFF—Longli Forest Farm; HBG—Hunan Botanic Garden.
sites for each pine host. LFF—Longli Forest Farm; HBG—Hunan Botanic Garden.Forests 2019,10,
Forests2019, 10,263
x FOR PEER REVIEW 77 of
of 18
18
Figure 2. A network map showing the interactions of the OTUs among all the samples from different
hosts
Figureat 2.
each site. Each
A network point
map represents
showing one independent
the interactions of the fungal OTU (43allOTUs
OTUs among in total).from
the samples OTUs in the
different
left
hosts at each site. Each point represents one independent fungal OTU (43 OTUs in total). OTUs types.
column were unique to one forest type, while those in the right belonged to multiple forest in the
LFF—Longli Forest
left column were Farm;toHBG—Hunan
unique Botanic
one forest type, whileGarden.
those in the right belonged to multiple forest types.
LFF—Longli Forest Farm; HBG—Hunan Botanic Garden.
Rarefaction curves showed that the number of ECM fungal species was higher in LFF than HBG.
However, species richness did not reach saturation, suggesting that additional ECM species could
Rarefaction curves showed that the number of ECM fungal species was higher in LFF than
be added with further sampling (Figure 3). Host × Site interactions influenced both observed and
HBG. However, species richness did not reach saturation, suggesting that additional ECM species
estimated ECM fungal richness (Table 2). Species richness was significantly higher in slash than
could be added with further sampling (Figure 3). Host × Site interactions influenced both observed
masson pine at LFF whereas there was no significant difference in richness between pine species at
and estimated ECM fungal richness (Table 2). Species richness was significantly higher in slash than
HBG. Species evenness was significantly higher in slash than masson pines (Table 2).
masson pine at LFF whereas there was no significant difference in richness between pine species at
HBG. Species evenness was significantly higher in slash than masson pines (Table 2).Forests 2019, 10, 263 8 of 18
Table 1. Indicator species analyses. The table shows the number of ectomycorrhizal (ECM) fungal molecular taxa (OTU) significantly associated with each habitat
type, their indicator species value [52] and associated probability. Based on species hypotheses, the distribution area and possible host species was assigned by closest
similar representative sequence data in UNITE. MA-masson pine, SL-slash pine.
Closest BLAST Closest UNITE
Site Species Name OTU No. Indicate Value p-Value Match in Species Hypothesis Distribution 1 Host of Pinus
Genbank Match
Longli Forest Farm, LFF
MA Russula virescens OTU_988 0.683 0.003 KU552087 (100) SH179772.07FU China not indicated
Russula violeipes OTU_1007 0.619 0.012 LT201954 (100) SH191296.07FU Yunnan (China) P. yunnanensis
Russula.sp1 OTU_992 0.447 0.05 LT602950 (97) SH218430.07FU Yunnan (China) P. yunnanensis
SL Amphiema.sp OTU_1264 0.961 0.001 LC176645 (100) SH193510.07FU China P. massoniana
Tomentella stuposa OTU_1154 0.856 0.001 UDB024437 (100) SH529807.07FU Laos not indicated
Clavulina corralloides OTU_1120 0.816 0.001 KF359593 (94) SH220215.07FU North America P. banksiana
Russula sp.2 OTU_990 0.774 0.001 AB636419 (93) SH218466.07FU Korea P. koraiensis
Russula sp.3 OTU_993 0.682 0.001 AB211253 (95) SH186553.07FU Japan P. densiflora
Tomentella sp.1 OTU_1157 0.632 0.001 UDB018462 (97) SH010050.07FU China not indicated
Tomentella sp.2 OTU_1129 0.632 0.002 UDB018462 (99) SH010050.07FU China not indicated
Pseudotomentella sp1 OTU_1027 0.628 0.011 AB839386 (100) SH223400.07FU East Europe P. sylvestris
Pseudotomentella sp2 OTU_1025 0.577 0.011 AB587791 (100) SH189639.07FU China P. massoniana
Tomentella.sp.3 OTU_1133 0.516 0.011 AB587791 (100) SH189639.07FU Japan, Korea P. thunbergii
Site Russula sp.4 OTU_989 0.941 0.001 AB211253 (99) SH186553.07FU Japan not indicated
Pseudotomentella sp.3 OTU_1026 0.913 0.001 AB839386 (100) SH223400.07FU East Europe P. sylvestris
Hunan Botanic Garden, HBG
MA Russula sp.5 OTU_983 0.785 0.001 AB839393 (100) SH201481.07FU South China P. massoniana
Laccaria amethystina OTU_1219 0.548 0.015 KF692988 (100) SH220964.07FU China, Japan P. densiflora
Laccaria aurantia OTU_1191 0.547 0.03 KU685645 (99) SH179274.07FU Yunnan (China) P. yunnanensis
SL Russula sp.6 OTU_1000 0.577 0.001 UDB032527 (100) SH189355.07FU Laos not indicated
Tomentella.sp.4 OTU_1158 0.577 0.044 AB587783 (100) SH189355.07FU a.w. multiple
Russula sp.7 OTU_1001 0.576 0.006 KP866130 (99) SH199912.07FU Hunan (China) P. elliottii
Site Tomentella sp.5 OTU_1155 0.891 0.003 JX556209 (100) SH189353.07FU South China not indicated
Scleroderma sp.1 OTU_1164 0.772 0.006 KP866131 (100) SH189277.07FU Hunan (China) P. elliottii
1 a.w.-reprehensive sequences have wild distribution all over the world.Forests 2019, 10, 263 9 of 18
Table 2. Single-sample based observed operational taxonomic unit (OTU) richness, Chao1, and Shannon-Wiener indices for ECM fungal communities from all forest
types across the sites. Different letters indicate significant differences among forest types based on Tukey Honestly Significant Difference (HSD) post-hoc test (p < 0.05).
Mean (Standard Error) of Index
Longli Forest Farm (LFF) Hunan Botanic Garden (HBG)
Analysis of Variance (ANOVA) Test
Masson Pine Slash Pine Masson Pine Slash Pine
(n = 15) (n = 15) (n = 10) (n = 15)
F P
Host 2.11 0.152
Observed Richness 7.07 10.33 7.50 6.27
Site 7.95 0.007
(0.62) b (0.8) a (1) ab (0.53) b
Interaction 9.31 0.004
F P
Host 0.43 0.513
Chao1 8.13 11.32 8.85 6.77
Site 5.36 0.025
(0.88) ab (0.8) a (1.6) ab (0.71) b
Interaction 7.51 0.008
F P
Host 5.49 0.023 0.47 0.72 0.30 0.58
Shannon
Site 2.93 0.174 (0.09) b (0.1) a (0.09) b (0.12) a
Interaction 0.02 0.899Forests 2019, 10, 263 10 of 18
Forests 2019, 10, x FOR PEER REVIEW 10 of 18
Figure 3. Sample-size-based species accumulation rarefaction (solid line segment) and extrapolation
Figure 3. Sample-size-based species accumulation rarefaction (solid line segment) and extrapolation
(dotted line segments) sampling curves with 95% confidence intervals (shaded areas) for estimated total
(dotted line segments) sampling curves with 95% confidence intervals (shaded areas) for estimated
ectomycorrhizal OTU richness across different host/sites. LFF—Longli Forest Farm; HBG—Hunan
total ectomycorrhizal OTU richness across different host/sites. LFF—Longli Forest Farm;
Botanic Garden.
HBG—Hunan Botanic Garden.
NMDS ordination coupled with PERMANOVA analyses (Table 3) showed that ECM communities
NMDS ordination coupled with PERMANOVA analyses (Table 3) showed that ECM
differed significantly between Site and Host (Figure 4). This distribution was nonrandom (PERMDISP;
communities differed significantly between Site and Host (Figure 4). This distribution was
Table 3), and best explained by site (R2 = 0.151, p = 0.001) rather than 2host plant (R2 = 0.057, p < 0.02;
nonrandom (PERMDISP; Table 3), and best explained by site (R = 0.151, p = 0.001) rather than host
Table 3). NMDS also showed strong influence of local soil factors on ECM community. Although soil
plant (R2 = 0.057, p < 0.02; Table 3). NMDS also showed strong influence of local soil factors on ECM
factors varied significantly between Site and Host (Table 3; see supplementary Table S1), the largest
community. Although soil factors varied significantly between Site and Host (Table 3; see
effects were detected between sites (R2 = 0.929, p = 0.001). In particular, levels of soil2 N (including N as
supplementary Table S1), the largest effects were detected between sites (R = 0.929, p = 0.001). In
NO3 ), P, and K were higher in HBG than LFF whereas macronutrients (Ca, Mg, Mn) and silt levels
particular, levels of soil N (including N as NO3), P, and K were higher in HBG than LFF whereas
were higher in LFF than HBG (Table S1). Within each site cluster, HBG ECM communities were more
macronutrients (Ca, Mg, Mn) and silt levels were higher in LFF than HBG (Table S1). Within each
homogeneous than those in LFF (PERMDISP; Table 3).
site cluster, HBG ECM communities were more homogeneous than those in LFF (PERMDISP; Table
3).Forests 2019, 10, 263 11 of 18
Table 3. PERMANOVA analyses performed to test the differences in ECM fungal community and
soil properties among forest types. Post hoc PERMDISP pair-wise analysis tests were applied to data
from all forest types across the sites. Values represent the site mean with standard error in parentheses.
Different letters indicate significant differences among forest types based on Tukey HSD post-hoc test
(p < 0.05).
PERMANOVA Test PERMDISP Pair-Wise Test
Longli Forest Farm Hunan Botanic
(LFF) Garden (HBG)
Masson Slash Masson Slash
Pine Pine Pine Pine
F P R2
Host 3.89 0.002 0.057
ECM fungal 0.42 0.57 0.51 0.64
Site 10.26 0.001 0.151
community (0.05) c (0.03) b (0.03) ab (0.01) a
Interaction 2.94 0.004 0.043
F P R2
Soil nutrient Host 9.66 0.007 0.012
0.04 0.05 0.08 0.04
status Site 828.02 0.001 0.929
(0.01) (0.01) (0.02) (0.01)
Interaction 2.5 0.101 0.003
Forests 2019, 10, x FOR PEER REVIEW 11 of 18
Figure 4. Non-metric multidimensional scaling (NMDS) of ectomycorrhizal fungal community
composition.
FigurePoint size reflectsmultidimensional
4. Non-metric the richness of each sample.
scaling Significant
(NMDS) abiotic variables
of ectomycorrhizal (p < 0.05)
fungal were
community
fitted ascomposition.
vectors ontoPoint
the NMDS graph. LFF—Longli Forest Farm; HBG—Hunan Botanic Garden.
size reflects the richness of each sample. Significant abiotic variables (p < 0.05)
were fitted as vectors onto the NMDS graph. LFF—Longli Forest Farm; HBG—Hunan Botanic
ECM communities
Garden.
scaled very differently between sites. In LFF, ECM communities were more
similar than expected by chance within ~10 m (Figure 5). In HBG, ECM communities were also more
similar thanTable
expected at ~10 m and
3. PERMANOVA 350 mperformed
analyses but moretodissimilar than expected
test the differences in ECMat spatial
fungal scales ranging
community and
from ~80 msoil toproperties
400 m (Figure 5). Within
among forest eachhoc
types. Post site, however,
PERMDISP host effects
pair-wise analysison ECM
tests werecommunity and
applied to data
soil propertyfrom all forest
scaling weretypes across the sites.
not correlated (LFFValues
Mantelrepresent −0.0675,
test: r =the site mean
p =with
0.63;standard error intest:
HBG Mantel
r = 0.0196, pparentheses. Different letters indicate significant differences among forest types based on Tukey
= 0.73, respectively).
HSD post-hoc test (p < 0.05).
PERMANOVA Test PERMDISP Pair-Wise Test
Longli Forest Farm Hunan Botanic
(LFF) Garden (HBG)
Masson Slash Masson Slash
Pine Pine Pine PineForests 2019, 10, x FOR PEER REVIEW 12 of 18
Forests 2019, 10, 263 12 of 18
0.2
0.10
0.1
0.05
Mantel r
Mantel r
0.0
0.00
−0.1
−0.05
−0.2
100 200 300 400 500 100 200 300 400
Distance(m) Distance(m)
(a) (b)
Figure 5. Mantel correlogram showing the strength of the correlation between spatial proximity and
ectomycorrhizae for forsamples
sampleswithin
within different
different distance
distance species
species composition
composition classes
classes in (a) in (a) Longli
Longli Forest
Forest
Farm andFarm
(b) and
Hunan(b) Botanic
Hunan Garden.
Botanic Points
Garden.arePoints
plotted areat plotted at the of
the midpoint midpoint of each
each distance distance
class. Solid
class.
circlesSolid circles
represent representcorrelations
significant significant correlations (p 0.05).
> 0.05).
4. Discussion
4. Discussion
In this study, we systematically investigated the effect of host plant identity, distance and edaphic
In this study, we systematically investigated the effect of host plant identity, distance and
factors on ECM community composition in native and exotic pine plantations using hyphal ingrowth
edaphic factors on ECM community composition in native and exotic pine plantations using hyphal
bags and high
ingrowth bagsthroughput sequencing.sequencing.
and high throughput Although the hyphal ingrowth
Although the hyphal bagingrowth
approachbag has approach
its limitations has
(see [54]), we found no significant effect of plant identity on ECM communities,
its limitations (see [54]), we found no significant effect of plant identity on ECM communities, i.e., i.e., phylogenetically
related exotic and related
phylogenetically native pinesexoticshared
and similar
native ECMpinescommunities
shared similar (Q1).ECMIn thecommunities
absence of a phylogenetic
(Q1). In the
effect, weoffound
absence that ECM community
a phylogenetic effect, we foundcomposition
that ECM was community
influenced by site-specificwas
composition abiotic factors and
influenced by
dispersal (Q2).
site-specific abiotic factors and dispersal (Q2).
The few
The few differences
differences in in ECM
ECM community
community between between slash
slash andand masson
masson pine pine (both
(both subgenus
subgenus Pinus)Pinus)
reinforces the idea that taxonomic relatedness might be a factor
reinforces the idea that taxonomic relatedness might be a factor influencing ECM fungal influencing ECM fungal colonization
in exotic pines.
colonization Plant–ECM
in exotic interactionsinteractions
pines. Plant–ECM are also believed
are also tobelieved
be conserved at the family
to be conserved level
at the [55].
family
Analogous results have
level [55]. Analogous been noted
results have beenin previous
noted in studies of ECM
previous in native
studies of ECM and
in exotic
nativepines [8,10,24,26].
and exotic pines
However, other studies have found that ECM host specialization
[8,10,24,26]. However, other studies have found that ECM host specialization contributes contributes significantly to the
composition of
significantly to ECM communitiesof[25,56].
the composition ECM Although
communities the reason(s) for these opposing
[25,56]. Although the reason(s) responses are
for these
not clear, they
opposing may reflect
responses are notdifferences
clear, theyin themayevolutionary co-adaptation
reflect differences in thebetween ECM fungi
evolutionary and their
co-adaptation
host [25,30], or differences in host range [57].
between ECM fungi and their host [25,30], or differences in host range [57].
We found
We found thatthat exotic
exotic slash
slash pine
pine readily
readily developed
developed ECM ECM withwith native
native fungi.
fungi. Overall,
Overall, the the ECM
ECM
community in exotic pine plantations was composed of a subset
community in exotic pine plantations was composed of a subset of the ECM fungi usually of the ECM fungi usually associated
with nativewith
associated pines in their
native pinesnative ranges.
in their nativeOther
ranges.studies
Otherhave similarly
studies shown a shown
have similarly restricted suite of
a restricted
ECM of
suite species
ECMin exotic in
species pine species
exotic pine(e.g., [12]).
species However,
(e.g., masson and
[12]). However, slash and
masson pinesslash exhibited
pines very little
exhibited
systematic differences in ECM community composition and relative
very little systematic differences in ECM community composition and relative abundance of ECM abundance of ECM species. Most
of the recorded
species. Most of ECM fungi areECM
the recorded considered
fungi are cosmopolitan with the result
considered cosmopolitan thatthe
with outresult
of 43that
ECM outfungal
of 43
taxa identified,
ECM fungal taxa 40 were associated
identified, 40 were withassociated
non-nativewith slashnon-native
pine (vs 35slash in masson).
pine (vsCompositionally,
35 in masson).
members of the Thelephoraceae
Compositionally, members of (e.g., Tomentella) emerged
the Thelephoraceae (e.g.,as Tomentella)
the most species-rich,
emerged as frequent
the most and
abundant genera
species-rich, frequenton bothandpine species genera
abundant and sites.onThese
both taxa
pinetypically
species and dominate
sites. ECMThesecommunities
taxa typically in
many systems [58], form ECM with a wide range of plant host
dominate ECM communities in many systems [58], form ECM with a wide range of plant host species, and exhibit broad ecological
profiles
species, [59,60].
and exhibitAlongbroad with Inocybe
ecological Laccaria, [59,60].
and profiles these taxaAlongalso with
form relatively
Inocybe and long-lived
Laccaria,spore
thesebankstaxa
that have the capacity to rapidly colonize roots of new plants [16]. This
also form relatively long-lived spore banks that have the capacity to rapidly colonize roots of newis important because it indicates
that in [16].
plants plantations
This isthere is an ECM
important becausecommunity thatthat
it indicates can immediately
in plantationsassist therewith
is an reforestation.
ECM community
Only a small number of ECM
that can immediately assist with reforestation. species displayed host specificity. Inspection of ECM communities
shows that certain ECM fungi were specific to masson or slash pine. Clavulina corralloides (OTU_1120)Forests 2019, 10, 263 13 of 18
and Pseudotomentella (OTU_1025) were only found with slash pine. Sequence similarity shows that
they are best matched with species of known North American (Clavulina) and Eastern Europe origin
(Pseudotomentella). These species were likely co-introduced with slash pine. Suillus OTU_963- masson
pine was an example of strict host specificity in both sites. Based on sequence similarity, this species is
part of a distinct Asian Suillus clade [61], and its high masson pine- ECM specificity is consistent with
patterns reported in other Suillus- pine associations [62]. The low abundance of Rhizopogon and Suillus
in both pine species, however, was unexpected. These ECM genera are considered pine-specific [63]
and abundant in pine roots in other ECM surveys (e.g., [20]). Yet, neither taxa were indicator species
in masson or slash pine. These conflicting results may be due to the fact that Rhizopogon and Suillus are
early successional taxa, and ECM fungal communities in 30 year-old plantation trees are not reflective
of seedling ECM communities [64]. That Rhizopogon was equally abundant in both pine species and
sites, however, supports the wide ecological amplitude of this taxon [65] and suggests that Rhizopogon
has dispersed to these sites in the past and formed soil reservoirs of resistant spores that remain
dormant in the soil for long periods [66].
We found that edaphic factors best explained the differences in ECM community composition
between sites, not host specialization. Initially, we had expected ECM communities primarily to
be structured by host plant identity. However, they were structured by differences in soil pH and
nutrient levels between sites. Specifically, ECM communities in HBG were shaped by soil pH and
macronutrient (N, P, K) levels whereas those in LFF were influenced by silt, Mn and base cations
(Mg, Ca). These differences suggest that ECM fungi are limited by niche requirements (or abiotic
tolerances) and that different ECM fungi may be available to plants depending on soil chemistry. This
strong edaphic segregation is similar to previous large-scale ECM studies [14,67–69]. In addition, the
correlation between soil N and P (and pH) and ECM community composition in HBG is consistent
with previous work in forest systems showing a strong role for soil fertility (primarily N) in driving
ECM community composition and richness (e.g., [70–74]).
More interestingly, the ECM community composition in LFF was correlated with soil Ca,
Mg and Mn, and silt. In addition, many ECM species were detected in LFF but not HBG (e.g.,
Tomentella, Russula), which suggests that there are underlying physiological differences in ECM species
that influence ECM community composition. Soil Mn levels are known to influence ECM fungi
differentially [75]. Calcium and Mg are important plant macronutrients but have not been found to
influence ECM community composition or favor certain ECM species in other studies [76]. The specific
mechanism(s) driving this response is beyond the scope of this study. However, there are several
possible processes that could generate this pattern: Soil Mn, Ca, and Mg availability is linked to soil
pH, so that the response of ECM communities to these cations signals the effects of soil pH [77]. Plant
morphology also varies with soil fertility meaning that major differences in root traits (root length, fine
root density) could indirectly alter the ECM community [78]. Alternatively, the abiotic correlates of
LFF and HBG ECM communities may simply reflect the idiosyncrasies in soil types that developed
from two different parent materials.
We found consistent and strong spatial structuring of ECM populations in both study sites.
Within each site, the highest spatial autocorrelation occurred at small scales (Forests 2019, 10, 263 14 of 18
exploratory hyphae (e.g., Tomentella, Tylospora) might compete over larger distances so that there is
open space for colonization by second and subsequent ECM species with contact- or short-range
hyphae (Russula). Distinguishing between these possibilities is beyond the scope of this study but
merits further investigation.
5. Conclusions
Our data sets provide important insights for separating the impact of host phylogenetic
relatedness from abiotic and spatial factors on ECM community composition. Our results revealed
that phylogenetic relatedness between pine trees resulted in a similar ECM community composition
in both sites, and slash and masson pine were not limited by the availability of compatible ECM
fungal inoculum. Instead, both dispersal and soil factors were stronger drivers of differences in ECM
community composition between sites, meaning that ECM fungal communities in exotic pines are
variable and context-dependent. In managed forests, improved productivity is reliant on belowground
resource availability, uptake, and use efficiency, all of which are driven by ECM. Given the importance
of soil and spatial factors in our study, there is now a need to better understand and align soil conditions
with ECM fungi across a range of spatial scales, and identify how differences in ECM community
functioning might feed back to influence host tree growth and productivity.
Supplementary Materials: The following are available online at http://www.mdpi.com/1999-4907/10/3/263/s1,
Figure S1: Map of sampling regime and sampling locations across the continental China. Circles represent
individual sampling locations mapped on Google Map images. (A) Individual sampling plots are shown on a map
of south China. (B) Individual plots 20 × 20 m within a sampling site are shown in Longli Forest Farm, Guizhou.
(C) Individual plots 20 × 20 m within a sampling site are shown in Hunan Botanic Garden, Hunan. lat, latitude;
lon, longitude, Table S1: Soil physico-chemical characteristics among different habitats, Table S2: Comparison of
sequence abundances and operational taxomomic unit (OTU) counts in a mock community of 18 Basidiomycota
species collected in local area.
Author Contributions: Conceptualization, C.N., G.M.M. and L.M.E.-W.; methodology, C.N.; software, C.N.;
validation, C.N.; formal analysis, C.N.; investigation, C.N.; resources, C.N.; data curation, C.N.; writing—original
draft preparation, C.N., L.M.E.-W., and G.M.M.; writing—review and editing, L.M.E.-W., G.M.M., W.X., and W.Y.;
visualization, C.N.; supervision, G.M.M.; funding acquisition, C.N., W.X., and W.Y.
Funding: This research was funded by National Science Foundation of China (31570447), program of National
Key (cultivating) Disciplines in Central South University of Forestry and Technology, combination program of
Plant Biology and Conservation in Northwestern University and Chicago Botanic Garden, and China Scholarship
Council (CSC201408430072, awarded to C.N.).
Acknowledgments: Specially thank Peter Avis for his comments on an earlier version of the paper. We thank the
assistance of Xiaowei Ni, Xinghao Huang, Zhizhou Liu, Yi Chen, and Qian Wu in the field and laboratory. We also
thank Forest Administration of Hunan and Forest Station of Longli for the permission to use sites.
Conflicts of Interest: The authors declare no conflict of interest.
References
1. Richardson, D.M.; Higgins, S.I. Ecology and biogeography of Pinus. In Pines as Invaders in the Southern
Hemisphere; Richardson, D.M., Ed.; Cambridge University Press: Cambridge, UK, 1998; pp. 243–266.
2. Wardle, D.A. Communities and Ecosystems: Linking the Aboveground and Belowground Components; Princeton
University Press: Princeton, NJ, USA, 2002.
3. Van der Putten, W.H.; Klironomos, J.N.; Wardle, D.A. Microbial ecology of biological invasions. ISME J. 2007,
1, 28–37. [CrossRef] [PubMed]
4. Nuñez, M.A.; Horton, T.R.; Simberloff, D. Lack of below- ground mutualisms hinders Pinaceae invasions.
Ecology 2009, 90, 2352–2359. [CrossRef] [PubMed]
5. Vellinga, E.C.; Wolfe, B.E.; Pringle, A. Global patterns of ectomycorrhizal introductions. New Phytol. 2009,
181, 960–973. [CrossRef] [PubMed]
6. Mikola, P. Mycorrhizal inoculation in afforestation. Int. Rev. For. Res. 1970, 3, 123–196.
7. Richardson, D.M.; Allsopp, N.; D’Antonio, C.M.; Milton, S.J.; Rejmanek, M. Plant invasions—The role
ofmutualisms. Biol. Rev. 2000, 75, 65–93. [CrossRef] [PubMed]Forests 2019, 10, 263 15 of 18
8. Trocha, L.K.; Kalucka, I.; Stasińska, M.; Nowak, W.; Dabert, M.; Leski, T.; Rudawska, M.; Oleksyn, J.
Ectomycorrhizal fungal communities of native and non-native Pinus and Quercus species in a common
garden of 35-year-old trees. Mycorrhiza 2012, 22, 121–134. [CrossRef] [PubMed]
9. Dickie, I.A.; Bolstridge, N.; Cooper, J.A.; Pelzer, D.A. Co-invasion by Pinus and its mycorrhizal fungi.
New Phytol. 2010, 187, 475–484. [CrossRef] [PubMed]
10. Kohout, P.; Sykorova, Z.; Bahram, M.; Hadincova, V.; Alberchtova, J.; Tedersoo, L.; Vohnik, M. Ericaceous
dwarf shrub affect ectomycorrhizal fungal community of the invasive Pinus strobus and native Pinus sylvestris
in a pot experiment. Mycorrhiza 2011, 21, 403–412. [CrossRef] [PubMed]
11. Hayward, J.; Horton, T.R.; Pauchard, A.; Nuñez, M.A. A single ectomycorrhizal fungal species can enable a
Pinus invasion. Ecology 2015, 96, 497–506. [CrossRef]
12. Hynson, N.A.; Merckx, V.S.F.T.; Perry, B.A.; Tresder, K.K. Identities and distributions of the co-invading
ectomycorrhizal fungal symbionts of exotic pines in the Hawaiian Islands Nicole. Biol. Invasions 2013, 15,
2373–2385. [CrossRef]
13. Nuñez, M.A.; Dickie, I.A. Invasive belowground mutualists of woody plants. Biol. Invasions 2014, 16, 645–661.
[CrossRef]
14. Bahram, M.; Köljalg, U.; Courty, P.E.; Diedhiou, A.G.; Kjøller, R.; Põlme, S.; Ryberg, M.; Veldre, V.; Tedersoo, L.
The distance decay of similarity in communities of ectomycorrhizal fungi in different ecosystems and scales.
J. Ecol. 2013, 101, 1335–1344. [CrossRef]
15. Talbot, J.M.; Bruns, T.D.; Taylor, J.W.; Smith, D.P.; Branco, S.; Glassman, S.I.; Erlandson, S.; Vigalys, R.;
Liao, H.L.; Smith, M.E.; et al. Endemism and functional convergence across the North American soil
mycobiome. Proc. Natl. Acad. Sci. USA 2014, 111, 6341–6346. [CrossRef] [PubMed]
16. Glassman, S.I.; Peay, K.G.; Talbot, J.M.; Smith, D.P.; Chung, J.A.; Taylor, J.W.; Vigalys, R.; Bruns, T.D.
A continental view of pine-associated ectomycorrhizal fungal spore banks: A quiescent functional guild
with a strong biogeographic pattern. New Phytol. 2015, 205, 1619–1631. [CrossRef] [PubMed]
17. Matsuoka, S.; Mori, A.S.; Kawaguchi, E.; Hobara, S.; Osono, T. Disentangling the relative importance of host
tree community, abiotic environment and spatial factors on ectomycorrhizal fungal assemblages along an
elevation gradient. FEMS Microbiol. Ecol. 2016, 92, fiw044. [CrossRef] [PubMed]
18. Nara, K. Spores of ectomycorrhizal fungi: Ecological strategies for germination and dormancy. New Phytol.
2009, 181, 245–248. [CrossRef] [PubMed]
19. Beiler, K.J.; Durall, D.M.; Simard, S.W.; Maxwell, S.A.; Kretzer, A.M. Architecture of the wood-wide web:
Rhizopogon spp. genets link multiple Douglas-fir cohorts. New Phytol. 2010, 185, 543–553. [CrossRef]
[PubMed]
20. Pickles, B.J.; Genney, D.R.; Potts, J.M.; Lennon, J.J.; Anderson, I.C.; Alexander, I.J. Spatial and temporal
ecology of scots pine ectomycorrhizas. New Phytol. 2010, 186, 755–768. [CrossRef] [PubMed]
21. Lang, C.; Finkeldey, R.; Polle, A. Spatial patterns of ectomycorrhizal assemblages in a monospecific forest in
relation to host tree genotype. Front. Plant Sci. 2013, 4, 103. [CrossRef] [PubMed]
22. Boeraeve, M.; Honnay, O.; Mullens, N.; Vandekerkhove, K.; Keersmaeker, L.D.; Thomaes, A.; Jacquemyn, H.
The impact of spatial isolation and local habitat conditions on colonization of recent forest stands by
ectomycorrhizal fungi. For. Ecol. Manag. 2018, 429, 84–92. [CrossRef]
23. Cavender-Bares, J.; Izzo, A.; Robinson, R. Changes in ectomycorrhizal community structure on two
containerized oak hosts across an experimental hydrologic gradient. Mycorrhiza 2009, 19, 133–142. [CrossRef]
[PubMed]
24. Roy-Bolduc, A.; Laliberté, E.; Hijri, M. High richness of ectomycorrhizal fungi and low host specificity in a
coastal sand dune ecosystem revealed by network analysis. Ecol. Evol. 2016, 6, 349–362. [CrossRef] [PubMed]
25. Nguyen, N.H.; Williams, L.J.; Vincent, J.B.; Stefanskyi, A.; Cavender-Bares, J.; Messier, C.; Paquette, A.;
Gravel, D.; Reich, P.B.; Kennedy, P.G. Ectomycorrhizal fungal diversity and saprotrophic fungal diversity are
linked to different tree community attributes in a field-based tree experiment. Mol. Ecol. 2016, 25, 4032–4066.
[CrossRef] [PubMed]
26. Garcia, M.O.; Smith, J.E.; Luoma, D.L.; Jones, M.D. Ectomycorrhizal communities of ponderosa pine and
lodgepole pine in the south-central Oregon pumice zone. Mycorrhiza 2016, 26, 275–286. [CrossRef] [PubMed]
27. O’Hanlon, R.; Harrington, T.J. Diversity and distribution of mushroom forming fungi (Agaricomycetes) in
Ireland. Biol. Environ. 2011, 111B, 117–133. [CrossRef]Forests 2019, 10, 263 16 of 18
28. O’Hanlon, R.; Harrington, T.J. Similar taxonomic richness but different communities of ectomycorrhizas in
native forests and non-native plantation forests. Mycorrhiza 2012, 22, 371–382. [CrossRef] [PubMed]
29. Cullings, K.W.; Vogler, D.R.; Parker, V.T.; Finley, S.K. Ectomycorrhizal specificity patterns in a mixed Pinus
contorta and Picea engelmannii forest in Yellowstone National Park. Appl. Environ. Microbiol. 2000, 66,
4988–4991. [CrossRef] [PubMed]
30. Bahram, M.; Köljalg, U.; Kohout, P.; Mirshahvaladi, S.; Tedersoo, L. Ectomycorrhizal fungi of exotic pine
plantations in relation to native host trees in Iran: Evidence of host range expansion by local symbionts to
distantly related host taxa. Mycorrhiza 2013, 23, 11–19. [CrossRef] [PubMed]
31. SFA (State Forestry Administration P.R. China). National Forest Resources Statistics (2009–2013), NFI 8th;
State Forestry Administration: Beijing, China, 2014.
32. Chen, Q.J.; Shu, Z.Z.; Pan, W.; Long, Y.Z.; Wei, B.S. The cultivation zoning and base layout of slash pine in
China. For. Sci. Technol. Guangdong Prov. 1995, 11, 1–6, (In Chinese with English Abstract).
33. Zhao, T.; Zhao, W.; Gao, R.; Zhang, Q.; Li, G.; Liu, X. Induced outbreaks of indigenous insect species by
exotic tree species. Acta Ecol. Sin. 2007, 50, 826–833, (In Chinese with English Abstract).
34. Huang, P.M.; Li, Y.C.; Summer, M.E. Handbook of Soil Sciences: Properties and Processes, 2nd ed.; CRC Press:
Boca Raton, FL, USA, 2011.
35. Wallander, H.; Nilsson, L.O.; Hagerberg, D.; Baath, E. Estimation of the biomass and seasonal growth of
external mycelium of ectomycorrhizal fungi in the field. New Phytol. 2001, 151, 753–760. [CrossRef]
36. Branco, S.; Bruns, T.D.; Singleton, I. Fungi at a small scale: Spatial zonation of fungal assemblages around
single trees. PLoS ONE 2013, 8, e78295. [CrossRef] [PubMed]
37. Smith, D.P.; Peay, K.G. Sequence depth, not PCR replication, improves ecological inference from next
generation DNA sequencing. PLoS ONE 2014, 9, e90234. [CrossRef] [PubMed]
38. Caporaso, J.G.; Kuczynski, J.; Stombaugh, J.; Bittinger, K.; Bushman, F.D.; Costello, E.K.; Fierer, N.; Peña, A.G.;
Goodrich, J.K.; Gordon, J.I.; et al. QIIME allows analysis of high-throughput community sequencing data.
Nat. Methods 2010, 7, 335–336. [CrossRef] [PubMed]
39. Nilsson, R.H.; Veldre, V.; Hartmann, M.; Unterseher, M.; Amend, A.; Bergsten, J.; Kristiansson, E.; Ryberg, M.;
Jumpponen, A.; Abarenkov, K. An open source software package for automated extraction of ITS1 and ITS2
from fungal ITS sequences for use in high-throughput community assays and molecular ecology. Fungal Ecol.
2010, 3, 284–287. [CrossRef]
40. Edgar, R.C. Search and clustering orders of magnitude faster than BLAST. Bioinformatics 2010, 26, 2460–2461.
[CrossRef] [PubMed]
41. Kõljalg, U.; Nilsson, R.H.; Abarenkov, K.; Tedersoo, L.; Taylor, A.F.S.; Bahram, M.; Bates, S.T.; Bruns, T.D.;
Bengtsson-Palme, J.; Callaghan, T.M.; et al. Towards a unified paradigm for sequence-based identification of
fungi. Mol. Ecol. 2013, 22, 5271–5277. [CrossRef] [PubMed]
42. Tedersoo, L.; Nilsson, R.H.; Abarenkov, K.; Jairus, T.; Sadam, A.; Saar, I.; Bahram, M.; Bechem, E.; Chuyong, G.;
Kõljalg, U. 454 pyrosequencing and Sanger sequencing of tropical mycorrhizal fungi provide similar results
but reveal substantial methodological biases. New Phytol. 2010, 188, 291–301. [CrossRef] [PubMed]
43. Ihrmark, K.; Bödeker, I.T.M.; Cruz-Martinez, K.; Friberg, H.; Kubatova, A.; Schenck, J.; Strid, Y.;
Stenlid, J.; Brandström-Durling, M.; Clemmensen, C.E.; et al. New primers to amplify the fungal ITS2
region—Evaluation by 454-sequencing of artificial and natural communities. FEMS Microbiol. Ecol. 2012, 82,
666–677. [CrossRef] [PubMed]
44. Altschul, S.F.; Gish, W.; Miller, W.; Myers, E.W.; Lipman, D.J. Basic local alignment search tool. J. Mol. Biol.
1990, 215, 403–410. [CrossRef]
45. Nguyen, N.H.; Song, Z.; Bates, S.T.; Branco, S.; Tedersoo, L.; Menke, J.; Schilling, J.S.; Kennedy, P.G. FUNGuild:
An open annotation tool for parsing fungal community datasets by ecological guild. Fungal Ecol. 2015, 24,
241–248. [CrossRef]
46. Tedersoo, L.; Smith, M.E. Lineages of ectomycorrhizal fungi revisited: Foraging strategies and novel lineages
revealed by sequences from belowground. Fungal Biol. Rev. 2013, 27, 83–99. [CrossRef]
47. Nguyen, N.H.; Smith, D.; Peay, K.G.; Kennedy, P.G. Parsing ecological signal from noise in next generation
amplicon sequencing. New Phytol. 2015, 205, 1389–1393. [CrossRef] [PubMed]
48. Lindahl, D.B.; Nilsson, R.H.; Tedersoo, L.; Abarenkov, K.; Carlsen, T.; Kjøller, R.; Kõljalg, U.; Pennanen, T.;
Rosendahl, S.; Stenlid, J.; et al. Fungal community analysis by high-throughput sequencing of amplified
markers—A user’s guide. New Phytol. 2013, 199, 288–299. [CrossRef] [PubMed]Forests 2019, 10, 263 17 of 18
49. Paulson, J.N.; Stine, O.C.; Bravo, H.C.; Pop, M. Differential abundance analysis for microbial marker-gene
surveys. Nat. Methods 2013, 10, 1200–1202. [CrossRef] [PubMed]
50. McMurdie, P.J.; Holmes, S. Waste not, want not: Why rarefying microbiome data is inadmissable.
PLoS Comput. Biol. 2014, 10, e1003531. [CrossRef] [PubMed]
51. Weiss, S.; Xu, Z.Z.; Peddada, S.; Amir, A.; Bittinger, K.; Gonzalez, A.; Lozupone, C.; Zaneveld, J.R.;
Vazquer-Baeza, Y.; Birminghan, A.; et al. Normalization and microbial differential abundance strategies
depend upon data characteristics. Microbiome 2017, 5, 27. [CrossRef] [PubMed]
52. De Caceres, M.; Legendre, P. Associations between species and groups of sites: Indices and statistical
inference. Ecology 2009, 90, 3566–3574. [CrossRef] [PubMed]
53. Cline, M.S.; Smoot, M.; Cerami, E.; Kuchinsky, A.; Landys, N.; Workman, C.; Christmas, R.; Avila-Campilo, I.;
Creech, M.; Gross, B.; et al. Integration of biological networks and gene expression data using Cytoscape.
Nat. Protoc. 2007, 2, 2366–2382. [CrossRef] [PubMed]
54. Wallander, H.; Ekblad, A.; Godbold, D.L.; Johnson, D.; Bahr, A.; Baldrian, P.; Bjork, R.G.; Kieliszewska-Rokicka, B.;
Kjoller, R.; Kraigher, H.; et al. Evaluation of methods to estimate production, biomass and turnover of
ectomycorrhizal mycelium in forests soils—A review. Soil Biol. Biochem. 2013, 57, 1034–1047. [CrossRef]
55. Tedersoo, L.; Mett, M.; Ishida, T.A.; Bahram, M. Phylogenetic relationships among host plants explain
differences in fungal species richness and community composition in ectomycorrhizal symbiosis. New Phytol.
2013, 199, 822–831. [CrossRef] [PubMed]
56. Ishida, T.A.; Nara, K.; Hogestu, T. Host effects on ectomycorrhizal fungal communities: Insight from eight
host species in mixed conifer-broadleaf forests. New Phytol. 2007, 174, 430–440. [CrossRef] [PubMed]
57. Karst, J.; Burns, C.; Cale, J.A.; Antunes, P.M.; Woods, M.; Lamit, L.J.; Hoeksema, J.D.; Zabinski, C.;
Gehring, C.A.; La Flèche, M.; et al. Tree species with limited geographical ranges show extreme responses to
ectomycorrhizas. Glob. Ecol. Biogeogr. 2018, 27, 839–848. [CrossRef]
58. Tedersoo, L.; Nara, K. General latitudinal gradient of biodiversity is reversed in ectomycorrhizal fungi.
New Phytol. 2010, 185, 351–354. [CrossRef] [PubMed]
59. Bruns, T.D.; Bidartondo, M.I.; Taylor, D.L. Host specificity in ectomycorrhizal communities: What do the
exceptions tell us? Integr. Comp. Biol. 2002, 42, 352–359. [CrossRef] [PubMed]
60. Kennedy, P.G.; Izzo, A.D.; Bruns, T.D. There is high potential for the formation of common mycorrhizal
networks between understory and canopy trees in a mixed evergreen forest. J. Ecol. 2003, 91, 1071–1080.
[CrossRef]
61. Motiejūnatie, J.; Kačergius, A.; Kasparavičius, J. Preliminary studies on genetic diversity of ectomycorrhizal
fungus Suillus bovinus Lithuania. Botnaica Lithuanica 2013, 19, 91–98. [CrossRef]
62. Kretzer, A.; Li, Y.; Szaro, T.; Bruns, T.D. Internal transcribed spacer sequences from 38 recognized species of
Suillus sensu lato: Phylogenetic and taxonomic implications. Mycologia 1996, 88, 776–785. [CrossRef]
63. Molina, R.; Massicotte, H.; Trappe, J.M. Specificity phenomena in mycorrhizal symbioses:
Community-ecological consequences and practical implications. In Mycorrhizal Functioning; Allen, M.F., Ed.;
Chapman and Hall: New York, NY, USA, 1992; pp. 357–423.
64. Nara, K.; Nakaya, H.; Wu, B.; Zhou, Z.; Hogetsu, T. Underground primary succession of ectomycorrhizal
fungi in a volcanic desert on Mount Fuji. New Phytol. 2003, 159, 743–756. [CrossRef]
65. Rusca, T.A.; Kennedy, P.G.; Bruns, T.D. The effect of different pine hosts on the sampling of Rhizopogon spore
banks in five Eastern Sierra Nevada forests. New Phytol. 2006, 170, 551–560. [CrossRef] [PubMed]
66. Nguyen, N.H.; Hynson, N.A.; Bruns, T.D. Stayin’ alive: Survival of mycorrhizal fungal propagules from a
6-yr-old forest soil. Fungal Ecol. 2012, 5, 741–746. [CrossRef]
67. Peay, K.G.; Garbelotto, M.; Bruns, T.D. Evidence of dispersal limitation in soil microorganisms: Isolation
reduces species richness on mycorrhizal tree islands. Ecology 2010, 91, 3631–3640. [CrossRef] [PubMed]
68. Bahram, M.; Põlme, S.; Kõljalg, U.; Zarre, S.; Tedersoo, L. Regional and local patterns of ectomycorrhizal
fungal diversity and community structure along an altitudinal gradient in the Hyrcanian forests of northern
Iran. New Phytol. 2012, 193, 465–473. [CrossRef] [PubMed]
69. Tedersoo, L.; Bahram, M.; Põlme, S.; Kõljalg, U.; Yorou, N.S.; Wijesundera, R.; Ruiz, L.V.; Vasco-Palacios, A.M.;
Thu, P.Q.; Sujia, A.; et al. Global diversity and geography of soil fungi. Science 2014, 346, 1256688. [CrossRef]
[PubMed]
70. Avis, P.G.; Mueller, G.M.; Lussenhop, J. Ectomycorrhizal fungal communities in two North American oak
forests respond to nitrogen addition. New Phytol. 2008, 179, 472–483. [CrossRef] [PubMed]You can also read