Specialised for the Swamp, Catered for in Captivity? A Cross-Institutional Evaluation of Captive Husbandry for Two Species of Lechwe - MDPI
←
→
Page content transcription
If your browser does not render page correctly, please read the page content below
animals
Article
Specialised for the Swamp, Catered for in Captivity?
A Cross-Institutional Evaluation of Captive
Husbandry for Two Species of Lechwe
Paul E. Rose 1,2, *      and Lewis J. Rowden 3
 1   Centre for Research in Animal Behaviour, College of Life & Environmental Sciences,
     Washington Singer Labs, University of Exeter, Perry Road, Exeter, Devon EX4 4QG, UK
 2   WWT, Slimbridge Wetlands Centre, Gloucestershire GL2 7BT, UK
 3   Zoological Society of London, Outer Circle, Regent’s Park, London NW1 4RY, UK; lewis.rowden@zsl.org
 *   Correspondence: p.rose@exeter.ac.uk

 Received: 15 September 2020; Accepted: 10 October 2020; Published: 14 October 2020

 Simple Summary: Lechwe are social antelope adapted to wetland environments that can perform a
 ritualised courtship display. Although commonly housed in zoos, there is little published information
 available to guide their management. This study aimed to understand current husbandry practice for
 southern and Nile lechwe housed in North American and European institutions. A survey was sent
 to holders of these species, with questions addressing group demographics, enclosure characteristics,
 diet, enrichment, and occurrence of abnormal behaviours. Results showed that captive lechwe herds
 consisted of a similar ratio of male to females compared to wild herds, but there may be a limit to the
 number of male animals available to females at any one time. Lechwe enclosures typically featured
 wetland areas but these were rarely managed and there were often limited areas of vegetation for
 cover. The diets provided to lechwe differed when compared to existing husbandry guidelines
 but did not significantly differ between sampled zoos (in terms of ingredients commonly used).
 Abnormal behaviours were reported at several zoos but no specific causal factor was identified.
 This research provides a starting point for further study of the husbandry requirements of these
 specialised ungulates and considers the role of ecological information to the management of captive
 wild animals.

 Abstract: Lechwe are specialised wetland antelope that can have a strict social hierarchy or perform
 lekking during breeding. The southern lechwe (Kobus leche) and the Nile lechwe (K. megaceros)
 are both found in zoos globally, but little research is available to support husbandry decisions.
 The aim of this research was to investigate current housing and husbandry used for these lechwe
 across North American and European zoos. A survey was distributed to holders in 2018 and
 information on 33 herds (18 Nile and 15 southern) was collected. The survey focussed on population
 demographics, enclosure size, biologically relevant exhibit features, mixed-species holdings, nutrition,
 use of environmental enrichment and performance of abnormal repetitive behaviours. Results showed
 that lechwe were housed in herds with similar sex ratios to wild counterparts but with a potential
 lack of opportunity to lek. Many zoos provided wetland, but this was rarely actively managed,
 and not all zoos provided cover for hiding and retreat. Current feeding practice differed significantly
 compared to available antelope husbandry guidelines. No consistency in amounts of pellet, forage or
 produce provided to lechwe across institutions was found. Abnormal repetitive behaviour was noted
 by several zoos, but no significant predictor of such behaviour could be identified. Despite some
 identifiable recognition of ecology informing lechwe management, it is important that evidence-based
 husbandry decisions are made based on a species’ evolutionary pathway and ecological needs and
 some fundamental features of lechwe husbandry do not always correlate with the adaptive traits of a
 specialised wetland ungulate.

Animals 2020, 10, 1874; doi:10.3390/ani10101874                                www.mdpi.com/journal/animals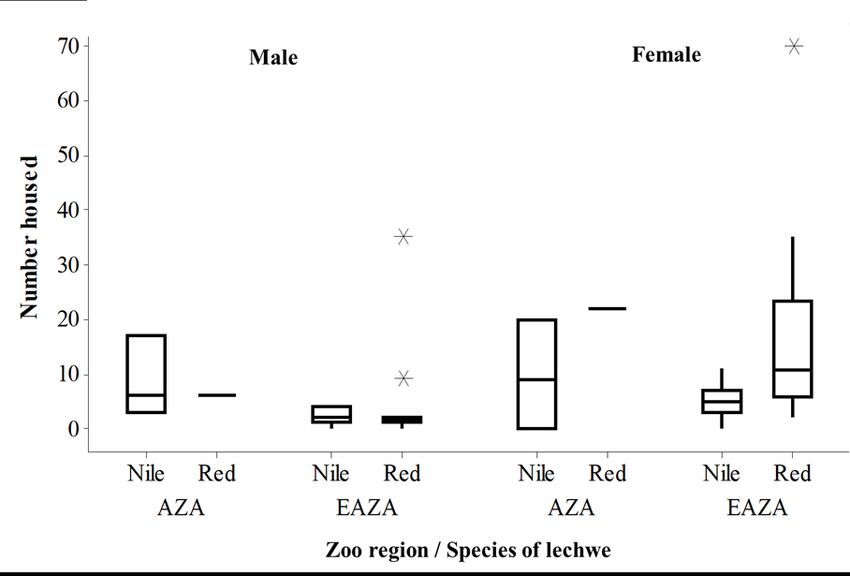
Animals 2020, 10, 1874                                                                              2 of 20

 Keywords: Kobus leche; Kobus megaceros; evidence-based practice; zoo husbandry; antelope

1. Introduction
      For many species of wild animal housed in captivity, information on their basic care and how
it compares between institutions can be lacking. Evaluation of commonly occurring practices is
required before improvements or alterations can be made, based on the species’ natural history and
ecological needs. Analysing what zoos do, and why, is a key foundation for the development of
best practice guidelines that should promote a good quality of life in captivity for specific species.
Approximately 150,000 even-toed ungulates are held in captivity across all 863 species360 © (https:
//www.species360.org/) member zoos (as of August 2020). Research into optimum management practices
for exotic ungulates is a growing area of zoo science [1–4] and, given the diversity of populations
held, and the multiple ways of exhibiting ungulates in zoos, the growth of ungulate-focussed research
is useful to the development of good practice. However, not all commonly housed species are
well understood.
      Past research that focusses on ungulates is apparent in the literature, demonstrating how directed
research into the natural history of specific species and evaluation of provision across facilities can
advance husbandry and welfare standards [5]. A cross-institutional survey of common hippopotamus
(Hippopotamus amphibious) identified numerous areas of husbandry practice and enclosure features that
were not based on ecological or natural history evidence [6]; these authors noted the importance of
integration of ecological knowledge into management practice to ensure that animals can experience
optimal welfare conditions. The flexibility of species’ responses to environmental change also needs
to be considered in zoo management practice [7]; the variation shown in responses to prevailing
environmental conditions (in the wild state) provides zoos with an indication of a species behavioural
flexibility and how they can adapt to the novelty presented by zoo environments.
      Global husbandry surveys for specific ungulate species can identify key areas of good practice
as well as deviation from any published husbandry standards [8]. Such research approaches can
also form the foundation for development of husbandry guidelines, using information collected
from the zoos that have been surveyed [1] to fill knowledge gaps that may be a barrier to the
implementation of ecologically-sound management regimes. The focus of this research are two
species of highly adapted wetland antelope; the southern lechwe (Kobus leche) and the Nile lechwe
(K. megaceros). Lechwe taxonomy is contested between two or three species, including the recently
described (and Critically Endangered) Upemba lechwe, K.l. anselli [9]. The nominate subspecies of the
southern lechwe, the red lechwe (K.l. leche) and the Kafue Flats subspecies (K.l. kafuensis) occur with
relative regularity in captivity. The Nile lechwe does not subspeciate. Key ecological information for
these antelope, helpful to any evaluation of captive care regimes and to provide evidence for husbandry
standards, is provided in Table 1.
      The populations of both southern and Nile lechwe are decreasing in the wild [10,11]; the IUCN
Red List states that the southern lechwe is currently Near Threatened [10] and the Nile lechwe is
Endangered [11]. As such, captive populations are relevant to population sustainability aims and
potential integration into a One Plan Approach to conservation [12] would see benefits to both
zoo-housed and free-living lechwe herds (in terms of population management potential). For captive
lechwe herds to remain a viable conservation tool, evidence-based husbandry is required to ensure
that captive care meets the ecological and evolutionary traits of the species. Such an evidence-based
approach upholds the educational roles of the zoo as the animals on display are more likely to be
displaying natural behaviour patterns that demonstrate their wild-type activities to the visitor.
      The restricted range and small population size of the Nile lechwe [11] has led to published research
on ex situ population viability to ensure long-term survival in zoos [13–15]. These authors note that
zoos should give greater consideration to the lechwe’s ecological and behavioural adaptations when
Animals 2020, 10, 1874 3 of 20
refining management style particularly breeding behaviour of lechwe, i.e., their lekking activities or
hierarchical social structure during breeding for choosing a mate [16–19], when attempting to increase
the genetic variability of captive populations [13] and to prevent high levels of inbreeding (that manifest
in heightened infant mortality) that are caused by a lack of movement of males between captive groups
of females [15]. A lek is a defined patch of ground defended by a mature male in breeding condition
for the purposes of attracting females that visit these display grounds [20]. Finally, as female Nile
lechwe age they are more likely to produce sons rather than daughters and the production of male
calves negatively influences the future survival of the breeding female [14] due to the size of the calf
at birth, and physiological and energetic costs imposed on the mother by the production of male
offspring. The complex social structure of lechwe and the physiological influences on breeding success
are worthy of further investigation within managed ex situ populations.
Southern and Nile lechwe are obligate floodplain grazers [21] and display the most advanced traits
for a semi-aquatic existence of all species in their Order [22]. These antelopes occur in wet grasslands,
being commonly found along the edges of swamps and areas of deeper water [23]. Lechwe prefer
wetlands where the water depth is less than 1 m but animals will swim, leap or wade through and
across deeper water to access foraging areas [10]. Zoo enclosures should consider these adaptations
and habitat preferences in their design and layout. However, no species-specific guidelines for lechwe
husbandry currently exist, aside from the population study conducted on Nile lechwe in 1993 [13] and
information on their captive care included in an older antelope husbandry manual [24], to provide
zoos with a framework to evaluate enclosure style and management regime against.
Table 1. Summary of the population ecology of red and Nile lechwe [10,11,25–27].
Species Subspecies Range Habitat Preference Home Range Size
Angola Floodplain grasslands, shallow
Botswana water meadows (around
Red lechwe DR of Congo permanently inundated swamps)
No data
(K. l. leche) Namibia and light woodland and
Zambia grasslands around the edge
Zimbabwe of wetlands.
Southern
lechwe Floodplain grasslands, shallow Up to 1000 animals
Kafue Flats
Zambia (middle water meadows and light per km2
lechwe (K. l.
Kafue River system) woodland and grassland 3.5 km range
kafuensis)
around wetlands. diameter (9.6 km2 )
Black lechwe (K. l. Zambia (Bangweulu
As above No data
smithemani) in the north)
DR of Congo Flooded grasslands and wetland
Upemba lechwe
(Kamalondo Depression, margins, light woodland No data
(K. l. anselli)
Upemba wetlands) around wetlands.
Ethiopia
South Sudan Seasonally flooded grasslands and 0.06 animals per
Nile
None (Sudd and swamps, around the periphery of km2 in the dry
lechwe
Machar-Gambella deeper swamps. season.
wetlands)
The aim of this paper is to provide information on current husbandry practices used for the two
species of lechwe most frequently exhibited in European Association of Zoos and Aquaria (EAZA)
and (North America) Association of Zoos and Aquariums (AZA) zoos, to enable such husbandry
evidence to be used in the development of future best practice guidelines for these antelope. To date,
captive husbandry has never been reviewed and published for the southern lechwe and a husbandry
and population review for the Nile lechwe dates from the early 1990s [13]; therefore this survey hopes
to build on older information as well as presenting a more current view to highlight the need for future
research and investigation to advance evidence-based approaches.Animals 2020, 10, 1874 4 of 20
2. Materials and Methods
A survey was provided to all EAZA and AZA holders of southern (red and Kafue flats) and Nile
lechwe in 2018 after contact with population managers in these zoo regions. Surveys were distributed
by the population managers for the species of lechwe focussed upon for this research to be filled in by a
member of zoo personnel with direct responsibility for lechwe care. Twenty-six zoos provided details on
33 groups of animals (12 herds of Kafue Flats; three herds of red; and 18 herds of Nile lechwe), see Table 2
for population information. Therefore, data were acquired on 19% of global Species360-registered
holders [28] for southern lechwe including subspecies (n = 81) and 44% for Nile lechwe (n = 39)
as of December 2018. The survey required respondents to document number of animals housed,
sizes of enclosures (including the size of indoor and outdoor areas, and details on the furnishings
of the exhibits for their lechwe). Focus was given to wetland areas and the provision of ecologically
relevant features within a lechwe’s exhibit. Questions within the survey were mixed; some aspects for
specific counts or measurements, others were closed questions, and some were open-ended questions
to enable description of specific aspects of animal husbandry to be provided. An example of counts
or measurements would be respondents detailing the number of animals held (including sexes and
ages), total population and intended population, as well as providing measurements of enclosures
(housing, hardstanding and outdoor paddocks). Closed questions related to “yes/no” aspect of lechwe
management; e.g., have “you observed aggression between your lechwe and other species, yes/no”
with the option for the respondent to provide further detail if needed. Open-ended questions related
to providing information on diet, enclosure features, enrichment provided and mixed species housing.
Completed surveys were either returned by the postal service or via email to the second author.
Table 2. Population details for the zoos that were sampled (correct as of 31 December 2018).
Lechwe & Population No. of Calves Population Age
Region Years Held
Number of Herds (Male:Female:Unknown) (1–5 years old
AZA 18 Nile (1) 6:9:0 1 1 year to 15 years
EAZA 3 Nile (1) 1:7:0 0 >1–5 years old
13 Nile (1) 3:9:0 3 1 year to 15 years
Nile (1) 3:7:0 0 >1 year to 15 years
EAZA 30
Kafue Flats (1) 35:70:0 12 20 years
EAZA 39 Nile (1) 0:3:0 0 11–15 years old
EAZA 40 Nile (1) 2:5:0 2Animals 2020, 10, 1874 5 of 20
Table 2. Cont.
Lechwe & Population No. of Calves Population Age
Region Years Held
Number of Herds (Male:Female:Unknown) (1–15 years old
EAZA 10 Kafue Flats (1) 1:5:0 0 >1–15 years old
EAZA 29 Kafue Flats (1) 1:6:0 0 >1–10 years old
EAZA 12 Kafue Flats (1) 1:2:0 0 6–15 years old
EAZA 45 Kafue Flats (1) 2:9:0 1 1–10 years old
EAZA 13 Nile (1) 2:5:0 0 6–15 years old
Questions related to:
• Style of enclosure (e.g., viewed on foot or drive-through).
• The substrates (hardstanding, sand, dirt, wood shavings, straw, concrete) and features (rocks,
branches, trees, pools, marshy areas and bushes) within the enclosure.
• Availability of wetland areas and how these were managed.
• The percentage of open to covered areas of the enclosure (i.e., due to cover and shelter provided
by trees).
• Variety of other animal species housed with the lechwe.
• Description of the behaviour of the lechwe in different enclosure areas. Respondents were asked
to record “yes or no” for four specific types of behaviour and then provide details on where they
had ever seen these behaviour occurring in the enclosure. Respondents reported where they had
seen their lechwe (pool/wetland, paddock, under cover) performing key state (long-duration)
behaviours (rumination, feeding, socialising, resting/lying down).
• Descriptions of any negative social interactions (e.g., chasing, fighting, overt aggression and
dominance) with the lechwe and other animal species (if applicable). Again, these were self-reported
by each individual zoo.
• Description of any reported abnormal repetitive behaviour, ARBs, (“stereotypic behaviour”) in
the current lechwe herd at the respondent’s zoo. Respondents were given instructions that ARB
related to any repetitive, invariant, stereotypic behaviour; for example, pacing, head-rolling,
oral tongue-playing behaviours.
Respondents were also asked to provide details on the diet fed to the lechwe, including amounts
and brands fed, as well as the number of feeds per day and the ratio of concentrate pellets, forage and
fresh produce that made up a daily diet (on a herd or individual basis). Questions on supplements
given, use of browse and seasonality of feeding style were also included.
Finally, respondents were questioned on the use of environmental enrichment for the lechwe,
the social environment provided for the lechwe at the respondent’s institution and whether the herd of
antelope was considered as an enrichment factor for management.
For the purposes of analysis, the subspecies of southern lechwe housed in this sample of zoos
(K.l. leche and K.l. kafuensis) have been combined due to their ecological similarity (O’Shaughnessy 2010;
Schuster 1976). Again, due to similar ecological overlap [18,29], habitat preferences and behaviour [30]
published guidelines on diets for zoo housed kob (K. kob) were used as a baseline for analysis with
southern lechwe diet [24] as no lechwe-specific information could be found. Evaluation of the diet
information provided by this sample of zoos for their Nile lechwe could be directly compared to the
published guidelines [24].Animals 2020, 10, 1874 6 of 20
2.1. Data Analysis
Data were analysed in R v3.6.1 (R Foundation for Statistical Computing, Vienna, Austria) [31] using
R studio v. 1.2.1335 (R Foundation for Statistical Computing, Vienna, Austria) [32]. Anderson–Darling
tests were used to determine the normal distribution for specific subsets of data from within all data
from all surveys. For all regression or fitted models, the “plot(name of model)” function was used in
RStudio to check the distribution of residuals and predicted values to see how randomly distributed
points are, and the normal Q-Q plot to see how much error deviates from normality. No transformation
of data occurred to create normally distributed data points.
2.1.1. Housing and Enclosure Features
Areas of lechwe paddocks, hardstanding and indoor housing provided in survey responses
were not all normally distributed and Spearman’s rho correlations were applied to determine any
relationship between measurements. To identify any significant predictors of paddock size provided
to the lechwe in this sample, that might be suggestive of standardised enclosure design across zoos,
a general linear model was run in RStudio and the output presented from the “anova (name of model)”
function as well individual variable estimates, t values and p values tabulated. The output variable
was the size (area) of the outdoor paddock and the predictor variables were: the lechwe species,
the number of years kept, the association that the zoo was in (EAZA or AZA), the total herd size,
the intended herd size, whether the enclosure was drive-through or not, the degree of cover provided
in the enclosure, the presence of a wetland, whether the institution was breeding the lechwe or not,
and whether the enclosure was mixed-species. Where no information was provided on the intended
population, the total population currently housed was used as the inferred intended population.
Post-hoc testing of categorical predictors that approached significance were investigated using the
“lsmeans” [33] and “pbkrtest” [34] packages in RStudio, for continuous predictors, model estimates
were evaluated to determine the direction of any effect. For continuous predictors that approached
significance, scatterplots were drawn to visually assess the trend between output and predictor
variables. Confidence intervals, calculated from least squares means post hoc testing, are quoted for
categorical variables.
2.1.2. Nutrition
Data on forage percentage and pellet percentage per captive diet were tested for normality and
found to be normally distributed. To evaluate any difference between the proportion of lechwe diet made
up of pellet and of forage compared to the 1999 AZA published guidelines for Reduncinae antelopes [24],
a one-sample t-test was run and corresponding intervals plots are presented. A one-way ANOVA was
run on the proportion of pellet and of forage provided at each zoo to compare between species.
Nine lechwe herds (five southern, four Nile) were provided with produce as part of their daily
ration. For these nine herds, produce ration was also normally distributed and so a two-sampled t-test
was run to see if there was any difference in amount of produce provided to each species.
2.1.3. Behaviour, Environmental Enrichment and Ecologically Relevant Resources
For those institutions that provided a wetland (to ensure that fair representation of occurrence of
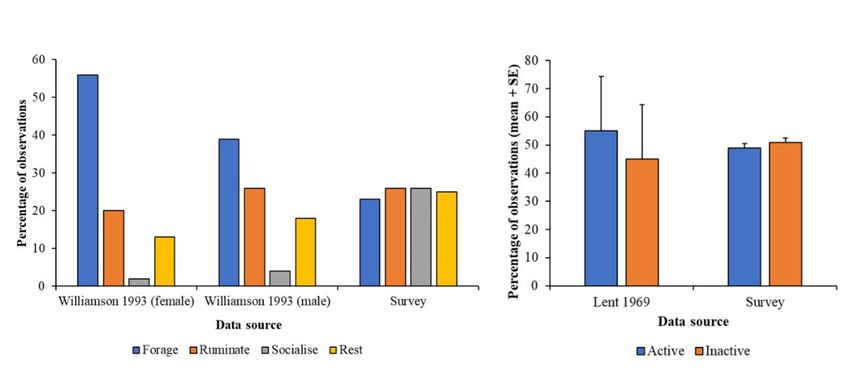
behaviour would be included), a basic time-activity budget was created by counting the self-reported
occurrences of state behaviours (rumination, foraging, resting and socialising) of lechwe from each
responding institution and dividing by the total counts of all behaviour noted across respondents.
These data were then compared to published time-activity budgets for male and female red lechwe
by Williamson [35] and by Lent [36], who counted occurrences of active and inactive animals in the
Okavango during December and January. Percentage occurrence of active animals was averaged from
Lent’s daytime data (from 09:00 to 17:00) based on when zookeepers would be around to determine
activity patterns of the animals sampled in this survey. A record of where lechwe were reported asAnimals 2020, 10, 1874 7 of 20
performing key state behaviours were taken from each survey with pool and swamp features combined
together. A cross tabulation and Chi-squared test was run on the percentage of observations of active
(foraging, moving, socialising) and inactive (resting and ruminating) lechwe in the survey and in
published information on wild animals to see if there was any difference in frequency of activity in
captive herds.
Data on reported behaviours and where they were seen were counts and therefore a Poisson
regression was run on the records of behaviour (social, forage, rest and rumination) from each survey
for three “habitat types” (grassland, wetland, cover) to determine any difference in the observation of
behaviour in each of these “habitats”.
As wild lechwe are documented to rest near water [37], and to analyse any influence of husbandry
and environmental predictors of observation (yes or no) of resting and of rumination in wetland
areas (pool and swamp combined), a binomial regression [using the glm function in RStudio,
family = binomial (link = ”logit”)] was run. The size of the wetland was categorised (based on
the number of responses and the range of areas detailed) into small (30 to 199 m2 ), medium (200 to
450 m2 ), large (500 m2 +) and unknown. Predictors included in the model were: herd size, wetland size,
paddock size, space per animal and lechwe species.
The same binomial GLM with logistic link function was used to understand any predictors of
observation of stereotypic behaviour (yes or no); with occurrence of stereotypic behaviour as the
outcome variable and paddock size, house size, hardstand size, provision of browse, number of
feeds per day, whether a drive-through enclosure or not, presence of a wetland, intended herd size,
number of females in the herd, species of lechwe, how open the enclosure was (as a percentage) and
whether the enclosure was a mixed-species exhibit were included as predictors. The “rsq” package
was used to generate r2 values to check the amount of variation captured by these binomial GLMs,
and (for all models) the “plot (model name)” function was used to check residuals and normal Q-Q
values for model fit.
Three zoos reported that no area of the paddock was covered yet all three reported the presence
of living trees in the enclosure, which would provide cover. Consequently, Google Maps (Google LLC,
Mountain View, CA, USA) was used to estimate the degree of tree cover of the paddock for these zoos.
3. Results
3.1. Housing and Enclosure Features
Key information on the size of the enclosure provided and the number of animals housed within,
as well as the provision of wetland for the lechwe is summarised, for each institution, in Table 3.
Table 3. Enclosure sizes and wetland features provided to the lechwe in the sample population.
Number Intended Future House Paddock Hardstand Wetland Provided?/Active Wetland
Region Species
Held Population (m2 ) (m2 ) (m2 ) Wetland Management? (m2 )
EAZA Kafue 9 11 216 5670 216 Yes/No No data
EAZA Nile 6 11 216 5670 216 Yes/No No data
EAZA Nile 9 10 54 5000 27 Yes/No 5000
EAZA Kafue 7 11 27 38,767 14,038 Yes/No No data
EAZA Nile 4 No data 27 38,767 14,038 Yes/No No data
EAZA Nile 12 No data 24 30,000 2070 Yes/No 300
EAZA Nile 4 8 No house 50,000 3000 Yes/No 300
EAZA Nile 4 6 No house 15,000 None No wetland None
EAZA Kafue 35 16 94 150,000 94 Yes/No 1000
EAZA Nile 11 9 70 13,500 70 No wetland None
AZA Nile 3 3 46 50 3480 Yes/No 37
EAZA Nile 5 9 30 11,400 120 Yes/No 300
AZA Nile 15 20 70 16,000 3000 Yes/No 3000Animals 2020, 10, 1874 8 of 20
Table 3. Cont.
Number Intended Future House Paddock Hardstand Wetland Provided?/Active Wetland
Region Species
Held Population (m2 ) (m2 ) (m2 ) Wetland Management? (m2 )
EAZA Nile 4 No data 55 2500 None No wetland None
EAZA Nile 8 8 120 7500 120 No wetland None
EAZA Kafue 13 0 25 16,500 108 Yes/No 50
EAZA Nile 12 13 47 1300 108 No wetland None
AZA Nile 37 29 1486 194,249 None Yes/No 8000
AZA Red 28 No data 84 20,234 None Yes/No 446
EAZA Kafue 105 No data No house 138,000 None Yes/No 12,426
EAZA Nile 10 No data No house 29,149 None Yes/No 6348
EAZA Nile 3 0 150 16,187 170 Yes/No 70
EAZA Nile 7 10 50 100 1000 Yes/No No data
EAZA Red 22 22 24 101,100 72 Yes/Yes 232
EAZA Kafue 25 18 60 2940 None No wetland None
EAZA Kafue 11 No data 230 2000 300 No wetland None
EAZA Kafue 5 5 80 800 20 No wetland None
EAZA Kafue 7 10 16 5000 None No wetland None
EAZA Kafue 3 4 14 4000 None Yes/No 20
EAZA Kafue 11 15 34 5490 35 Yes/No data No data
EAZA Kafue 26 26 48 24,300 None Yes/No 160
EAZA Red 23 23 24 36,422 None Yes/No 4046
EAZA Nile 7 7 38 8190 75 No wetland None
Southern lechwe were more commonly reported on from the EAZA region compared to from the
AZA region, but across all institutions, more female animals are housed compared to the number of
males (Figure 1). A bias in European holding of southern lechwe (and a small number of males to
females) is reflected
Animals in current
2020, 10, x FOR data that show 926 southern lechwe in the European region
PEER REVIEW 9 of 21and 89 in
the North American region [28].
Figure 1. Comparison of number of male and female individuals in herds across EAZA and AZA
Figure 1. Comparison of number of male and female individuals in herds across EAZA and AZA
regions for both Nile and southern (“red”) lechwe. Boxplot showing the median and interquartile
regions for both Nile and southern (“red”) lechwe. Boxplot showing the median and interquartile
ranges,ranges,
as well as outliers (marked as asterisks).
as well as outliers (marked as asterisks).
The maximum amount of wetland per animal was 635 m2 per animal (paddock size 29,149 m2,
herd size 10 animals) and the smallest (of those zoos that provided wetland) was 4 m2 per animal
(16,500 m2, herd size 13 animals). The median amount of wetland per animal (n = 17) was 28.6 m2 per
animal.
Spearman’s rho (rs) correlations show no relationship between house area and paddock area (rs
= −0.26, p = 0.152), paddock area and hardstand area (rs = −0.03; p = 0.867) or for hardstand area andAnimals 2020, 10, 1874 9 of 20
The maximum amount of wetland per animal was 635 m2 per animal (paddock size 29,149 m2 ,
herd size 10 animals) and the smallest (of those zoos that provided wetland) was 4 m2 per animal
(16,500 m2 , herd size 13 animals). The median amount of wetland per animal (n = 17) was 28.6 m2
per animal.
Spearman’s rho (rs) correlations show no relationship between house area and paddock area
(rs = −0.26, p = 0.152), paddock area and hardstand area (rs = −0.03; p = 0.867) or for hardstand area
and house area (rs = 0.16; p = 0.374). When modelling relevant potential predictors of paddock size,
there are significant predictors of area provided to lechwe from this dataset, F10,22 = 6.382; r2 = 63%;
p < 0.001, with model output provided in Table 4. p values have been compared to a corrected alpha
level of 0.01 [38] and significant Q values highlighted using * and in italics.
Table 4. Predictors of lechwe paddock size from responses provided to the survey.
Variable Estimate Standard Error (SE) T Value p Value Q Value
Species −15,044.8 12,920.8 −1.164 0.258 0.03
Years kept 479.52 417.11 1.150 0.263 0.035
Region −16,055.24 17,146.7 −0.936 0.360 0.045
Total in herd 4269.1 1151.7 3.707 0.0012 0.005 *
Wetland present (yes/no) 4.253 3.358 1.267 0.218 0.025
Intended herd size −3398.0 1138.4 −2.985 0.007 0.01 *
Drive-through enclosure (yes/no) 13,917.1 12,566.1 1.108 0.280 0.04
How open is the paddock (%) 531.6 286.3 1.857 0.08 0.015
Mixed-species exhibit (yes/no) −6403.4 17,581.4 −0.364 0.720 0.05
Active breeding of the lechwe −22,495.7 12,673.0 −1.775 0.09 0.02
There is a highly significant relationship between an increasing number of lechwe housed and
a greater area of outdoor paddock (Q = 0.005) as well as a significant effect of overall intended
herd size on the area of the animal’s outside paddock (Q = 0.01). There is a non-significant trend
(Q = 0.015) for larger paddocks to contain less cover. The area of an outdoor paddock provided to
a non-breeding group of lechwe was larger (Confidence Intervals, CI (16,662, 90,142)) compared to
that provided to a breeding group (CI (7087, 54,725)) although this relationship only approached
significance (Q = 0.02). For lechwe in drive-through enclosures, paddock area was generally larger
(CI (16,658, 81,568)) compared to enclosures that were not drive-through (CI (5936, 64,455)) but this
relationship was not significant (Q = 0.04). No significant difference is apparent for paddock size
provided to southern (CI (4067, 65,197)) or Nile (CI (18,034, 81,319)) lechwe (Q = 0.03).
Mixed-Species Exhibit (MSE) Details
Twenty-seven (82%) of the 33 lechwe herds surveyed were housed in mixed species exhibits; 16 (89%)
of Nile lechwe herds and 11 (73%) of southern lechwe herds. For all lechwe in mixed species exhibits,
other species were always Artiodactyla (e.g., giraffe, Giraffa camelopardalis), Perissodactyla (e.g., zebra,
Quagga sp.) or birds (e.g., ostrich, Struthio camelus). A summary of these species mixes is shown in Table A1
of Appendix A. Of those lechwe housed in MSE, 50% of Nile and 55% of southern lechwe (52% across both
species overall) herds reported instances of interspecific aggression, e.g., chasing, fighting, displays of
dominance and all of these aggressive interactions were performed by male lechwe (for both lechwe
species). Aggressive interactions between lechwe and other named species are detailed in Table A2.
3.2. Nutrition
For southern lechwe, there was a significant difference between the amount of forage, e.g., hay or
similar, provided by these sample zoos (t = 5.63; µ = 72.8%; n = 12; p < 0.001) and the amount of forage
recommended for kob (50%) in the 1999 AZA published guidelines. The same significant differenceAnimals 2020, 10, 1874 10 of 20
was noted from these sample zoos (t = 6.16; µ = 78.1%; n = 11; p < 0.001) and for recommended forage
(43%) for Nile lechwe. There was a significant difference for pellet (57%) proportion too (t = −8.96;
µ = 15.27; n = 11; p < 0.001) for the Nile lechwe. Likewise, for southern lechwe there was a significant
difference between the suggested proportion of pellet (50%) in 1999 AZA published guidelines and the
amount provided in these sample zoos (t = −7.93; µ = 21.5%; n = 12; p < 0.001).
Figure 2 compared the average across forage, pellet and produce in the diets for these surveyed
Nile and southern lechwe against the recommended guidelines of forage and pellet from the 1999 AZA
guidelines [24]. Across all sampled zoos, there was no significant difference in the amount of forage
(F = 0.58; df = 1, 21; p = 0.455) or pellet (F = 1.14; df = 1, 21; p = 0.297) provided to either southern or
Nile lechwe. For the nine herds of lechwe provided with produce there was no significant difference in
the amount of produce given to either species (t = 0.557; Nile µ = 18.3; red µ = 13.6; n = 9; p = 0.595)
even though Nile lechwe are provided with more produce in their diet compared to southern lechwe.
Thirteen zoos (16 herds) provided some form of seasonality to dietary provision, and this may include
Animals 2020, 10, x FOR PEER REVIEW 11 of 21
seasonal variation in use of browse for nutritional enrichment (see Section 3.3).
Figure 2. The average (mean plus standard error) for all data on proportion of forage (black),
Figure 2. The average
pellets (white) (mean
and produce plusfor
(grey) standard error)
Nile (left) andfor all data(right)
southern on proportion
lechwe in of
theforage (black),
surveyed pellets
population
(white)
compared andto produce (grey)proportion
the suggested for Nile (left) and southern
of forage and pellets(right) lechwe
for Kobus in thespecies
antelope surveyed population
available in the
1999 AZA published
compared guidelines.
to the suggested proportion of forage and pellets for Kobus antelope species available in
the 1999 AZA published guidelines.
3.3. Natural Behaviour, Environmental Enrichment and Ecologically Relevant Resources
3.3. Natural Behaviour,
Of the total Environmental
33 herds of lechwe, 23Enrichment
herds fromand
18 Ecologically
institutions Relevant Resources
were provided with a wetland within
theirOf
enclosure.
the totalActive
33 herdsmanagement
of lechwe, of23aherds
wetlandfromwithin the enclosure
18 institutions were was only conducted
provided by one
with a wetland
institution,
within theirsuggesting that themanagement
enclosure. Active wetlands within these lechwe
of a wetland withinenclosures werewas
the enclosure naturally occurringby
only conducted or
areas of the exhibit prone to flooding. Of these 23 herds, data on wetland size was provided
one institution, suggesting that the wetlands within these lechwe enclosures were naturally occurring for 17 herds
(14areas
or institutions). Eleven
of the exhibit prone herds of southern
to flooding. lechwe
Of these were provided
23 herds, with a size
data on wetland wetland (for thosefor
was provided with
17
data, 86.45 m 2 /animal) and 12 herds of Nile lechwe (for those with data, 113.3 m2 /animal). For these
herds (14 institutions). Eleven herds of southern lechwe were provided with a wetland (for those
17 herds,
with data,100%
86.45 were mixed and
m2/animal) species exhibits
12 herds and lechwe
of Nile 58% were(forbreeding
those with herds,
data,and 71%
113.3 m2displayed no
/animal). For
stereotypic
these behaviour.
17 herds, 100% were mixed species exhibits and 58% were breeding herds, and 71% displayed
Twenty-four zoos provided details on where their animals performed key state behaviours,
no stereotypic behaviour.
whichTwenty-four zoos information
in turn provided provided detailson theonbehaviour patterns
where their of 31 performed
animals lechwe herds key(15state
red and 16 Nile).
behaviours,
Out of these
which in turnrecords, all lechwe
provided herds were
information noted
on the as socialising
behaviour patternsin open
of 31grassland and all
lechwe herds but
(15 oneand
red herds
16
were noted as foraging, resting and ruminating in grassland areas too (Figure 3). Further
Nile). Out of these records, all lechwe herds were noted as socialising in open grassland and all but evaluation of
theseherds
one behavioural data as
were noted was undertaken
foraging, for the
resting andsubsample
ruminating of in
16 grassland
zoos (21 herds,
areas11toosouthern
(Figureand 10 Nile)
3). Further
that were provided with all specific enclosure zones noted in the survey (wetland,
evaluation of these behavioural data was undertaken for the subsample of 16 zoos (21 herds, grassland and cover).
11
southern and 10 Nile) that were provided with all specific enclosure zones noted in the survey
(wetland, grassland and cover).Animals2020,
Animals 10,x1874
2020,10, FOR PEER REVIEW 11of
12 of21
20
Figure 3. Self-reported observation of key state behaviours performed per enclosure zone from all
surveys3.that
Figure noted lechwe
Self-reported behaviour.ofPercentages
observation are calculated
key state behaviours from records
performed of behaviour
per enclosure zonefrom those
from all
zoos that stated their lechwe were provided with that enclosure zone.
surveys that noted lechwe behaviour. Percentages are calculated from records of behaviour from
those zoos that stated their lechwe were provided with that enclosure zone.
Data on records of behaviour in each enclosure zone were normally distributed (p = 0.177).
Counts of each behaviour from Figure 3 were inputted into a Poisson regression in RStudio with
Data on records of behaviour in each enclosure zone were normally distributed (p = 0.177).
“habitat” (i.e., enclosure zone) and behaviour as the predictor variables. Post-hoc testing found no
Counts of each behaviour from Figure 3 were inputted into a Poisson regression in RStudio with
significant difference between records of each behaviour but did find significantly more records of
“habitat” (i.e., enclosure zone) and behaviour as the predictor variables. Post-hoc testing found no
behaviour noted in grassland, compared to wetland (estimate = 0.412, SE = 0.174, Z ratio = 2.367,
significant difference between records of each behaviour but did find significantly more records of
p = 0.047). The r2 for this model was 90%.
behaviour noted in grassland, compared to wetland (estimate = 0.412, SE = 0.174, Z ratio = 2.367, p =
For the 21 herds provided with a wetland, a logistic regression was run to identify whether resting
0.047). The r2 for this model was 90%.
and rumination occurred preferentially in wetland areas. There are no significant predictors of wetland
For the 21 herds provided with a wetland, a logistic regression was run to identify whether
usage for either behaviour (Table 5), the r2 value for the rumination model is 55% and for the resting
resting and rumination occurred preferentially in wetland areas. There are no significant predictors
model, r2 = 41%.
of wetland usage for either behaviour (Table 5), the r2 value for the rumination model is 55% and for
the resting model, r2 = 41%.
Table 5. Binomial GLM with logistic link output for predicting whether lechwe are seen resting or
ruminating in wetland areas of their enclosure.
Table 5. Binomial GLM with logistic link output for predicting whether lechwe are seen resting or
ruminating inCoefficient
wetland areas of their enclosure.
Estimate (±SE) Z Value p Value
CoefficientSpecies Rumination −0.521
Estimate (± SE) (1.66) −0.314
Z Value 0.753p Value
Resting −0.0703 (1.43) −0.049 0.961
Rumination −0.521 (1.66) −0.314 0.753
Species Rumination −0.606 (2.05) −0.296−0.049 0.767 0.961
Wetland (medium) Resting −0.0703 (1.43)
Resting 0.371 (1.70) 0.219 0.827
Wetland Rumination −0.606 (2.05) −0.296 0.767
Rumination −2.63 (2.35) −1.12 0.264
(medium)
Wetland (small) Resting 0.371 (1.70) 0.219 0.827
Resting −1.02 (1.74) −0.586 0.558
Rumination −2.63 (2.35) −1.12 0.264
Wetland (small) Rumination −21.6 (4168.34) −0.005 0.996
Wetland (unknown) Resting −1.02 (1.74) −0.586 0.558
Resting −19.90 (4291.41) −0.005 0.996
Wetland Rumination −21.6 (4168.34) −0.005 0.996
Rumination −0.013 (0.076) −0.176 0.860
(unknown) Herd size Resting −19.90 (4291.41)
Resting −0.0082 (0.061) −0.134−0.005 0.894 0.996
Rumination −0.013 (0.076) −0.176 0.860
Herd size
Paddock size
Rumination 0.000015 (0.000036) 0.420 0.674
Resting
Resting−0.0082
0.000019(0.061)
(0.000029) 0.656 −0.134 0.512 0.894
Rumination 0.000015 (0.000036) 0.420 0.674
Paddock sizeper animal Rumination −0.00098 (0.0011) −0.894 0.371
Space Resting 0.000019 (0.000029)
Resting −0.0007 (0.00082) −0.9040.656 0.366 0.512
Rumination −0.00098 (0.0011) −0.894 0.371
Space per animal
Resting −0.0007 (0.00082) −0.904 0.366Rumination frequency from the survey data is similar to that observed in wild animals but
socialising is much lower in the wild compared to that noted in surveys (Figure 4). There is no
difference between records of activity or inactivity for captive and wild lechwe. Cross tabulation Chi-
squared testing identifies no significant difference between inactive and active observations on
Animals 2020, 10, 1874 12 of 20
captive or wild lechwe (χ2 = 0.721; df = 1; p = 0.396).
Across all surveys, 24% of respondents documented ARB performance in their animals. All
reported ARBs were
Rumination pacing behaviours,
frequency with specific
from the survey details relating
data is similar to pacing in
to that observed along
wilda fence
animals linebut
in
female lechwe immediately before parturition. A binomial GLM with logistic link
socialising is much lower in the wild compared to that noted in surveys (Figure 4). There is no (Table 6) shows
there to be between
difference no significant predictor
records of occurrence
of activity (yes/no)
or inactivity of stereotypic
for captive and wildbehaviour in this tabulation
lechwe. Cross sample of
lechwe. The r2 value for this model was 47%.
Chi-squared testing identifies no significant difference between inactive and active observations on
captive or wild lechwe (χ2 = 0.721; df = 1; p = 0.396).
Figure 4. Comparative activity budgets of survey data (records of behaviour noted in each herd)
Figure 4. Comparative
compared activity
to (i) published budgets
behaviour of survey
of lechwe databy(records
herds of behaviour
Williamson 1993 (left)noted in each
and (ii) herd)
number of
compared to (i) published
animals inactive behaviourtoof
or active compared lechwe
Lent 1969 herds
(right).by Williamson 1993 (left) and (ii) number of
animals inactive or active compared to Lent 1969 (right).
Across all surveys, 24% of respondents documented ARB performance in their animals.
All reported
Table 6. ARBs
BinomialwereGLMpacing behaviours,
output withofspecific
for predictors details
stereotypic relating
behaviour to pacingfrom
performed alongallareturned
fence line in
female lechwe immediately before parturition. A binomial GLM with logistic link (Table 6) shows
surveys.
there to be no significant predictor of occurrence (yes/no) of stereotypic behaviour in this sample of
Variable Estimate (±SE) Z Value p Value
lechwe. The r2 value for this model was 47%.
Browse provided (yes/no) 0.31 (2.1) 0.146 0.884
Table 6.Mixed-species enclosure
Binomial GLM output −2.95behaviour
for predictors of stereotypic (2.5) −1.191
performed 0.234
from all returned surveys.
Number of feeds per day −1.02 (1.73) −0.617 0.537
Variable Estimate (±SE) Z Value p Value
How open is the paddock (%) −0.008 (0.04) −0.214 0.831
Browse provided (yes/no)
Drive-through enclosure (yes/no) 0.31 (2.1)
−0.47 (1.71) 0.146
−0.278 0.884
0.781
Mixed-species
Wetland presentenclosure −2.95 (0.001)
0.001 (2.5) −1.191
1.109 0.234
0.267
Size of house (m )
Number of feeds per2 day 0.004 (0.012)
−1.02 (1.73) 0.326
−0.617 0.744
0.537
How Size of paddock
open (m2) (%)
is the paddock −0.0001 (0.0001)
−0.008 (0.04) −0.647
−0.214 0.518
0.831
Size of hardstanding (m
Drive-through enclosure (yes/no)
2) 0.0005 (0.001)
−0.47 (1.71) 0.790
−0.278 0.430
0.781
Intended size of herd 0.33 (0.283) 1.159 0.246
Wetland present 0.001 (0.001) 1.109 0.267
Total number of females in herd 0.374 (0.442) 0.844 0.398
Size of house (m2 ) 0.004 (0.012) 0.326 0.744
Total herd size −0.353 (0.405) −0.872 0.383
Size of paddock
Species (m2 )
of lechwe −0.0001
−3.85(0.0001)
(3.02) −0.647
−1.276 0.518
0.202
Size of hardstanding (m2 ) 0.0005 (0.001) 0.790 0.430
Twenty-seven responses
Intended considered the overall
size of herd 0.33 herd
(0.283)as a form of social
1.159 environment
0.246 (21 zoos),
and nine responses (8 zoos) stated they
Total number of females in herd
provided extra enrichment
0.374 (0.442)
to their
0.844
animals. Twelve
0.398
zoos (15
herds) stated they provided extra browse to their lechwe, excluding that which may be naturally
Total herd size −0.353 (0.405) −0.872 0.383
growing within the enclosure. Thirty herds had access to living trees in their enclosure and 16 herds
were provided withSpecies of lechwe
bushes −3.85
and shrubs within the (3.02) too. Only
enclosure −1.276 0.202
two zoos responded saying
that lechwe had no grass in their outside paddock, being maintained solely on a sand paddock, and
Twenty-seven responses considered the overall herd as a form of social environment (21 zoos),
and nine responses (8 zoos) stated they provided extra enrichment to their animals. Twelve zoos
(15 herds) stated they provided extra browse to their lechwe, excluding that which may be naturally
growing within the enclosure. Thirty herds had access to living trees in their enclosure and 16 herdsAnimals 2020, 10, 1874 13 of 20
were provided with bushes and shrubs within the enclosure too. Only two zoos responded saying that
lechwe had no grass in their outside paddock, being maintained solely on a sand paddock, and 14 herds
(11 zoos) were provided with areas of long grass within their enclosure. Thirty herds (23 zoos) were
provided with soil substrate outside and 26 herds (20 zoos) had a sanded area as part of their outdoor
paddock too.
4. Discussion
This husbandry survey provides useful information on the management practices experienced by
33 herds of lechwe (18 Nile and 15 southern, 3 red and 12 Kafue Flats). Overall, our findings highlight
variation across EAZA and AZA institutions in the style of management utilised for these antelopes.
Some standardised management practices were identified. These included: grassland within outdoor
paddocks, diets formed of forage and concentrate pellet, and social housing in mixed sex groups with
more females to males, which mimics data on wild social structure [39]. Inconsistent practice was noted
for enclosure size and space, as well as the features provided within the enclosure, see Table 3, and for
the amounts of components of each diet fed to herds at each institution. Space provided to lechwe
in zoos was significantly influenced by the zoo’s current herd size as well as the projected herd size.
This is to be commended, particularly in the case of the Nile lechwe where the aggressive behaviour of
males towards one another to establish a social hierarchy and the reclusive behaviour of pre-parturient
females [13,19], is suggestive of a need for as much space as can be provided (i.e., larger spaces are
better for natural social structures and hence for lechwe welfare).
Whether the zoo is breeding the lechwe and the degree of cover (from vegetation) provided also
shows a general trend with outdoor paddock area, suggesting that as enclosures get larger, they can
become more uniform, suggesting that quantity of space is considered more in the enclosure design
for these antelopes than habitat features or structure. Whilst not significant, lechwe behaviour shows
variation between different habitat features provided within an enclosure (Figure 3) and as a proportion
of observations, variation of observed behaviour was highest in wetlands and in areas of cover with a
more uniform observation of key activities noted in grassland. This may reflect the predominance
of grassland in lechwe areas for these sampled zoos or the removal of predation risk in zoo-housed
environments, which encourages the antelope to graze more out in the open. The crude way of
assessing animal behaviour from these survey questions does not provide information on how long
animals spend on each behaviour in each zone, nor does it tell us where all individuals perform
important state behaviours that link to positive welfare, i.e., rumination. However, Figure 3 provides
important information for guiding future research; assessment of time-activity patterns within specific
zones to determine how behavioural diversity in the zoo compares to published information from the
wild. This would further provide support for our basic evaluation of how naturalistic the activity of
these lechwe are (Figure 4) and could provide the basis for welfare assessment that used degree of
inactivity as an animal-based welfare score.
Increasing the size of wetland spaces and cover may be beneficial; 85% of zoos reported socialisation
occurred in wetlands for example (Figure 3) and this figure may be higher if all zoos in the sample
either: (i) provided information on the size of their wetland; or (ii) provided a wetland to their lechwe.
Due to the simplicity of its collection, behavioural data gathered by this survey may be lacking in its
ability to pinpoint the overall importance of wetland areas to the physical and psychological health
of these lechwe. We encourage further research into space use and performance of key behavioural
indicators of welfare in captive lechwe, as has been demonstrated by research on captive sitatunga
(Tragelaphus spekii) [40] and specific methods of defining resources within an enclosure and assessing
their value to the animal are available in the literature [41,42]. Such an approach would help build
on the foundation of “what lechwe are seen to do and where” that are presented here to further
inform species-specific best practice guidelines that have been shown to be relevant to enhanced
species management in other specialised ungulates, such as Eld’s deer (Panolia eldii) and lesser kudu
(T. imberbis) [43].Animals 2020, 10, 1874 14 of 20
Zoos should also consider expanding on the wetland areas of their lechwe exhibits to promote
the performance of behaviours that would naturally occur in such areas, which would be beneficial
to animal welfare and to visitor education. Male lechwe can be 145% of an average adult female
weight [44] and this sexual dimorphism is important for territorial display and courtship behaviour.
Ecological separation of male and female lechwe in foraging patches may also be due to this size
difference [37] and small individuals can be pushed out of profitable feeding areas. This marked size
difference should be considered by zoos when designing lechwe enclosures so that any ritualised
chasing or display between males can be performed without harassment or disturbance to females and
young, which is noted as occurring in wild herds [25].
For both species of lechwe studied, formulation of each zoo’s lechwe diet did not match, for either
species, the amounts recommended in the Kendall and Rieches [24] husbandry manual (Figure 2).
The differences in real-world feeding practice may be explained by the age of the guidelines and
the evolution of zoo dietary knowledge, where more forage is beneficial to captive ungulate health
alongside of a restricted, measured amount of concentrate pellets [45,46]. A review of zoo health
records to assess condition of animals on different types of diet (different proportions of forage to
pellet, with and without produce) would provide evidence for the most suitable diet formulation for
lechwe in different zoo regions (considering climate and weather variables on animal metabolism and
homeostatic demand).
Wild lechwe are noted to be seasonal in their diet selection and select for a wide range of different
types of vegetation across a large area [44]. This variation in feeding ecology should guide zoo
feeding practice via the increased use of browse as well as access to grazing in all cases. Hofmann [47]
categorises close relatives of the lechwe, the kob and the waterbuck (Kobus ellipsiprymnus) as grazers
rather than intermediate feeders or browsers, so whilst only 12 zoos provided browse to their lechwe,
this may well be a relatively high proportion when compared to the ecological need for browse in this
species. However, as a form of enrichment and to promote foraging and rumination, we recommend
all lechwe holders consider browse as a forage option. Thirteen zoos attempted some form of seasonal
variation in how diet and browse was provided, which aligns with the natural ecology of lechwe
showing seasonal choice in selection of vegetation when grazing. Further assessment of intake of
captive diets on an individual animal basis, as well as proximate analysis of diet content would help
evaluate the standard of feeding for captive lechwe. Data on wild plant selectivity is available [44,48]
and hence information on natural feeding patterns could be incorporated into zoo diet formulation.
Degree of foraging within an enclosure, which would augment individual daily intake, is difficult to
measure accurately, but how much ad hoc feeding is conducted by lechwe in naturalistic enclosures
compared to those managed on sand yards (with restricted browsing and grazing opportunities) could
be assessed alongside physical condition (e.g., coat, tooth and hoof health) as well as general activity to
evaluate the effect of feeding regime on animal welfare.
The institutions sampled in this survey mixed their lechwe herds with a wide range of
species, with most popular mixes with other mammals being giraffe (16 records), zebra (11 records),
kudu (10 records) and eland (9 records). The most common non-mammal housed with lechwe was
ostrich (8 records). These mixes show ecological overlap that could naturally occur for wild southern
lechwe herds and the populations of these other species, but may not be as ecologically relevant for Nile
lechwe. Further investigation of how Nile lechwe utilise an enclosure when housed with other species
in captivity is needed to provide evidence for the most appropriate mixes of different species. Such an
approach has worked for sitatunga, another wetland specialist, and individual animal observation
provides useful data on the importance of aquatic resources within zoo environments [40].
Wild lechwe clearly show a preference for shallow water foraging and are specifically adapted
for the consumption of wetland grasses [49]. Whilst complete replication of such a habitat could
be logistically challenging in captivity, zoos should move away from completely sanded outdoor
paddocks, which may offer little in the way of environmental enrichment, towards the creation of more
heterogenous environments that mimic key facets of the lechwe’s ecosystem. Housing lechwe in mixedAnimals 2020, 10, 1874 15 of 20
species enclosures with other ungulate species that come from drier grasslands may be limiting the
degree of swamp-like features in their zoo exhibits. Further investigation into any health impacts of
maintaining lechwe on homogenous, dry paddocks should be carried out to supplement investigations
on a behavioural basis.
Zoos may need to consider the size of lechwe enclosures to enable leks to form, if multiple males
are kept. Based on the life history strategy of these species, multiple males should be kept to enable
genetic diversity to be maintained (and males need to be moved around groups accordingly). Size of
leks corresponds to the number of breeding males in an area, i.e., the higher the number of males,
the higher the likelihood of leks being formed [26]. Red lechwe and its subspecies congregate in herds
of single sexes outside of the breeding season [16] and future zoo enclosure design could consider this
seasonal social structure in terms of facilities (e.g., holding areas and paddock separation) for captive
lechwe herds. Integration of mate choice can help improve conservation breeding outcomes [50] and
given the importance of mate choice to lechwe reproduction, more investigation into multi-male,
multi-female groups and the interactions between animals could be useful to the development of
species-specific management guidelines.
Wetland areas are important to adult lechwe activity patterns, with research showing that, in the
dry season, female lechwe will spend 42.3% of their time in water, adult males 28%, and subadults 2%
of their time [51]. Nile lechwe are recorded as spending almost all of their time in shallow water [48].
Therefore, zoos that do not provide wetland may be depriving individual lechwe of a key ecological
requirement and this should be reconsidered in light of animal welfare needs and species-appropriate
husbandry. Further study that investigates the time spent in specific enclosure areas (e.g., wetland)
and the diversity of behaviours performed in such enclosure areas would provide valuable evidence
for the importance of access to water for captive lechwe.
Male lechwe rest during the daytime for longer periods of time compared to females [52];
high records of inactivity noted in the survey responses (Figure 4) may be indicative of keepers
being most knowledgeable of their animals’ behaviour during normal daytime working hours.
Nocturnal activity needs to be investigated as grazing occurs at night [36] even though overnight
behaviour is poorly documented [30], and hence the welfare of zoo-housed individuals may be
compromised if forage is not accessible in overnight housing. The large proportion of behaviours
observed in the grassland maybe self-evident because grassland is the largest area of the outdoor space
provided to these lechwe herds at these facilities. Further research that analyses zone size compared
to the other areas that might be more ecologically useful (e.g., wetland) would help determine the
lechwe’s preferences for enclosure occupancy.
Eleven of these sampled zoos provided areas of long grass for their lechwe. We encourage all zoos
to consider planting and grassland management techniques to provide such habitat features within the
enclosures of all lechwe. Wild lechwe change their reliance on water based on physiological state and
life stage. Female lechwe with young are more likely to remain near to water as they are warier of
their surroundings, and both sexes of lechwe retreat into long grass and thick reeds when disturbed
by predators, but females with calves are more likely to venture into thick vegetation compared
to males [36]. Measurement of lechwe welfare in captivity could be based on wetland usage and
around performance of seasonal variation in time-activity patterns, which is well documented for
wild animals [35,36,51]. Degree of time spent standing and lying “idle” is recorded for wild herds of
different sexes and ages [35]; consequently if wild lechwe are known to spend a proportion of their
day in a general inactive state, measurement of time spent inactive in zoo housed specimens could
be compared against zoo enclosure features (i.e., a lack of suitable areas for socialising or foraging),
herd structure and feeding regime to assess naturalistic behaviour patterns. Heightened levels of
inactivity could be used as evidence of a need to alter enclosure style or animal care practice.
Both species of lechwe included in this project are of conservation concern [10,11] and some note
that the future population survival of the Nile lechwe to be “precarious” in some parts of its range [48]
due to anthropogenic threats. Consequently, the captive population of lechwe is of conservationYou can also read