Developing Species-Age Cohorts from Forest Inventory and Analysis Data to Parameterize a Forest Landscape Model - Hindawi.com
←
→
Page content transcription
If your browser does not render page correctly, please read the page content below
Hindawi
International Journal of Forestry Research
Volume 2021, Article ID 6650821, 16 pages
https://doi.org/10.1155/2021/6650821

Research Article
Developing Species-Age Cohorts from Forest Inventory and
Analysis Data to Parameterize a Forest Landscape Model

           Richard H. Odom1 and W. Mark Ford                        2

           1
             Geospatial and Environmental Analysis Program, 106 Cheatham Hall, Virginia Polytechnic Institute and State University,
             Blacksburg, VA 24061, USA
           2
             U.S. Geological Survey, Virginia Cooperative Fish and Wildlife Research Unit, 106 Cheatham Hall, Blacksburg, VA 24061, USA

           Correspondence should be addressed to W. Mark Ford; wmford@vt.edu

           Received 5 November 2020; Revised 8 February 2021; Accepted 21 February 2021; Published 4 March 2021

           Academic Editor: Thomas Campagnaro

           Copyright © 2021 Richard H. Odom and W. Mark Ford. This is an open access article distributed under the Creative Commons
           Attribution License, which permits unrestricted use, distribution, and reproduction in any medium, provided the original work is
           properly cited.
           Simulating long-term, landscape level changes in forest composition requires estimates of stand age to initialize succession
           models. Detailed stand ages are rarely available, and even general information on stand history often is lacking. We used data from
           USDA Forest Service Forest Inventory and Analysis (FIA) database to estimate broad age classes for a forested landscape to
           simulate changes in landscape composition and structure relative to climate change at Fort Drum, a 43,000 ha U.S. Army
           installation in northwestern New York. Using simple linear regression, we developed relationships between tree diameter and age
           for FIA site trees from the host and adjacent ecoregions and applied those relationships to forest stands at Fort Drum. We
           observed that approximately half of the variation in age was explained by diameter breast height (DBH) across all species studied
           (r2 � 0.42 for sugar maple Acer saccharum to 0.63 for white ash Fraxinus americana). We then used age-diameter relationships
           from published research on northern hardwood species to calibrate results from the FIA-based analysis. With predicted stand age,
           we used tree species life histories and environmental conditions represented by ecological site types to parameterize a stochastic
           forest landscape model (LANDIS-II) to spatially and temporally model successional changes in forest communities at Fort Drum.
           Forest stands modeled over 100 years without significant disturbance appeared to reflect expected patterns of increasing
           dominance by shade-tolerant mesophytic tree species such as sugar maple, red maple (Acer rubrum), and eastern hemlock (Tsuga
           canadensis) where soil moisture was sufficient. On drier sandy soils, eastern white pine (Pinus strobus), red pine (P. resinosa),
           northern red oak (Quercus rubra), and white oak (Q. alba) continued to be important components throughout the modeling
           period with no net loss at the landscape scale. Our results suggest that despite abundant precipitation and relatively low
           evapotranspiration rates for the region, low soil water holding capacity and fertility may be limiting factors for the spread of
           mesophytic species on excessively drained soils in the region. Increasing atmospheric temperatures projected for the region could
           alter moisture regimes for many coarse-textured soils providing a possible mechanism for expansion of xerophytic tree species.

1. Introduction                                                          to characterize future distributions. These projections either
                                                                         implicitly or explicitly assumed that the current distributions
Over the past twenty years, a number of studies have                     of tree species approximate the range of environmental
documented the potential impacts of climate change on                    tolerances the species have adapted to over thousands of
forest biomes, broad forest cover types, and the ranges of               years and that absence of a species or community suggests
individual tree species in eastern North America [1–4]. Most             the presence of bioclimatic conditions unsuitable for sus-
of this research was based on correlations between current               tained regeneration and growth. A number of authors have
bioclimatic conditions and current distributions of forest               noted limitations of the “climatic envelope” approach as the
types or tree species, which were then extrapolated into the             basis for species distribution models (SDM), including re-
future using outputs from global or regional climate models              liance on temporally and spatially limited climate data,
2                                                                                    International Journal of Forestry Research

incomplete information on the distribution of tree species,       past disturbances and silvicultural treatments can make it
and lack of detailed information on adaptations to wide           difficult to establish reliable age-diameter relationships.
ranging biophysical conditions [5–8]. Often, species dis-         However, several studies have shown that a significant
tribution models are based on a few observed or modeled           proportion of the variation in tree age can be explained by
climate variables from the past 100–150 years that do not         stem diameters for some important northern hardwood
encompass the complete range of climatic conditions,              species. Tubbs [24] analyzed a mature northern hardwood
whereby species evolved during the Holocene. Moreover,            stand dominated by sugar maple (Acer saccharum) in the
complicating our current perspective on tree distributions,       Upper Peninsula of Michigan after 50 years of selection
this recent period widely is recognized as warmer and wetter      cutting and found that diameter measured from cut stumps
in comparison to long-term climatic variation in North            explained 88% of the variation in tree age. A similar study
America.                                                          based on 60 sugar maples trees harvested from a managed
     A number of different approaches and tools are available      forest in Wisconsin indicated that 64% of variation in age
to model changes in forest structure and function over time       was explained by diameter [25]. Leak [26] developed re-
and space including tree and stand-level models (e.g., tra-       gression equations based on basal diameters for several
ditional growth and yield models [9], Climate-Forest Veg-         northern hardwood and conifer species at two old-growth
etation Simulator [10], species-specific niche models [11],        sites in New Hampshire that explained 47%, 79%, and 86%
process models [12], and dynamic global vegetation models         of the variation in age based on diameter measured at breast
(MC1) [13]. Trade-offs inherent in these different ap-              height (DBH) for sugar maple, yellow birch (Betula alle-
proaches have been well summarized using characteristics          ghaniensis), and American beech (Fagus grandifolia), re-
such as application scale, spatial versus nonspatial ap-          spectively. Kenefic and Nyland [27] reported an r2 of 0.81 for
proaches, complexity in constructing parameters, avail-           age-DBH relationships in a managed, uneven-aged stand of
ability of adequate input data, applicability across different     96 sugar maple trees in central New York. Collectively, these
ecoregions, statistical approach, and interpretation of model     studies provide reasonable evidence that age can be ap-
outputs [6, 7, 14, 15]. LANDIS-II (landscape disturbance and      proximated from stem diameters for sugar maple-domi-
succession) is a stochastic forest landscape simulator that       nated stands with differing stand histories and site
can incorporate site adaptations and biological interactions      conditions, albeit with unexplained variation in predicted
such as competition for light, reproductive strategies, and       ages ranging from 12% to as much as 53%.
disturbance from fire, wind, and timber harvesting within a            Northern red oak (Quercus rubra) is less shade tolerant
spatially explicit context to model change in forest com-         and generally faster growing than sugar maple that largely
munities over time [16–18]. Species-age cohorts and site          overlaps in range with northern red oak [28–31]. As with
types that define limitations on establishment and growth          sugar maple, several studies have developed age-diameter
are specified for each cell in a raster data structure, and life   relationships for northern red oak in the northeastern U.S.
history attributes for each species of interest are used to       and southern Canada. Rentch [32] studied five old-growth
model change in species composition and biomass over              stands on the Allegheny Plateau of Ohio, Pennsylvania, and
time. Cohorts of trees age and senesce compete for light and      West Virginia, but tree ages derived from increment cores
reproduce based on life history attributes such as species        were not strongly correlated with DBH (r2 � 0.34). Con-
longevity, shade tolerance, age when seed is produced, and        versely, data derived from a managed, northern red oak
seed dispersal strategies. Unless killed by a disturbance such    stand in Connecticut showed a very high degree of corre-
as timber harvesting or fire, an age-dependent mortality           lation between age and DBH (r2 � 0.93, [33]). Analysis of
function is used to remove cohorts from the model. Raster         data from northern red oak stands in southeastern New York
maps and associated attribute files are produced that allow        [34] and southern Quebec [35] resulted in age-DBH cor-
visualization and analysis of model results. LANDIS-II has        relations of r2 � 0.42 and r2 � 0.49, respectively. Best fit lines
been shown to be a flexible and accurate tool for modeling         from an old-growth stand in North Carolina [36] and
changes in species composition and distribution over time as      managed stands in West Virginia [37] illustrated similar age-
a function of climate change by accounting for a variety of       diameter relationships. As with sugar maple, age predictions
natural and anthropogenic disturbances [19, 20].                  from published age-diameter relationships for northern red
     An important input to initialize and model succession in     oak are highly variable, but approximately half of the var-
LANDIS-II is the spatial distribution and structure of            iation in age can be explained by stem diameter across a large
species-age cohorts across the landscape. However, the age        portion of the range of northern red oak in the northeastern
of individual trees or forest stands may be lacking for many      U.S. Additionally, variability in age predictions might be
forest landscapes, and determining age from increment             reduced if predictions are limited to dominant and co-
cores requires a substantial amount of fieldwork and lab-          dominant trees and not applied to shade-tolerant species in
oratory analysis of tree growth rings [21]. Equations to          the understory that may be of similar age but have signif-
predict tree age from diameter are not abundant in the            icantly smaller diameters.
literature, and it is uncertain whether age can be accurately         Forest resource managers on military installations in the
predicted from tree diameters in mixed species stands with        United States need tools and approaches that can provide
different developmental histories and site characteristics         installation-specific context from global and regional climate
[22, 23]. Differences in shade tolerances and growth rates         change assessments. Our challenge in this study was to
between tree species in mixed stands as well as the effects of     develop preliminary forest succession models using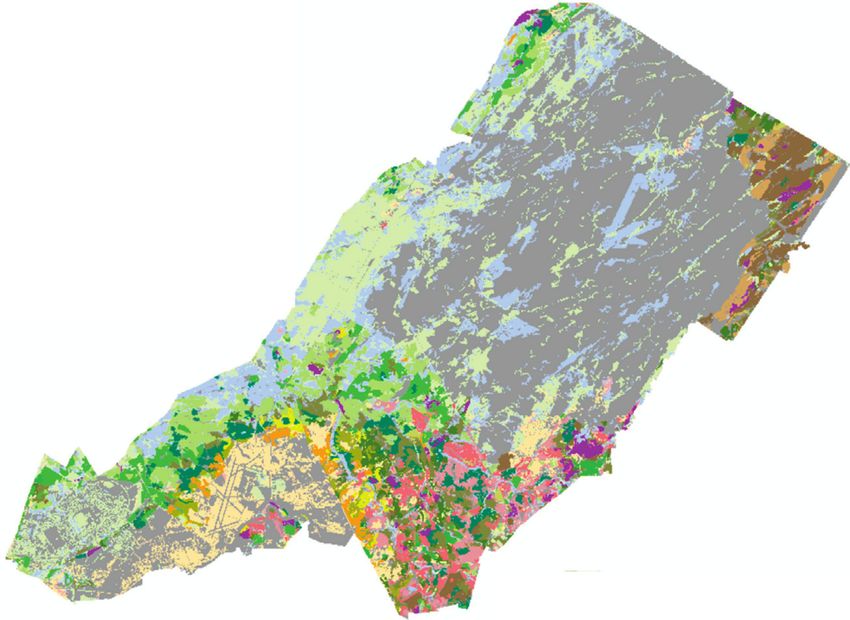
International Journal of Forestry Research 3
LANDIS-II to evaluate if available information resources Prior to European settlement in the 18th century, the
were adequate to inform simulations and therefore produce area was covered by mixed pine-eastern hemlock (Tsuga
credible models of successional patterns over the next 100 canadensis) and northern hardwood forests typical of cool
years as a prerequisite for subsequent modeling of potential temperate regions in northeastern North America [43, 44].
climate change impacts. Given the general lack of infor- Beginning in the late 1700s, much of the land in the St.
mation on tree and stand age at many military installations, Lawrence River Valley, including the Fort Drum area, was
we chose to derive age-diameter relationships from site tree converted to agriculture with forests remaining in relatively
records in the USDA Forest Inventory and Analysis database isolated patches on soils either too wet or too rocky to farm
[38] and integrate these relationships with available forest [45]. The U.S. Army began acquiring land in the early 1900s
stand data to parameterize the LANDIS-II model. and expanded the installation to over 35,000 ha during
World War II. Fort Drum reached its current extent in the
2. Methods 1980s. Concurrent with the growth of Fort Drum, agri-
cultural acreage in the region in general declined substan-
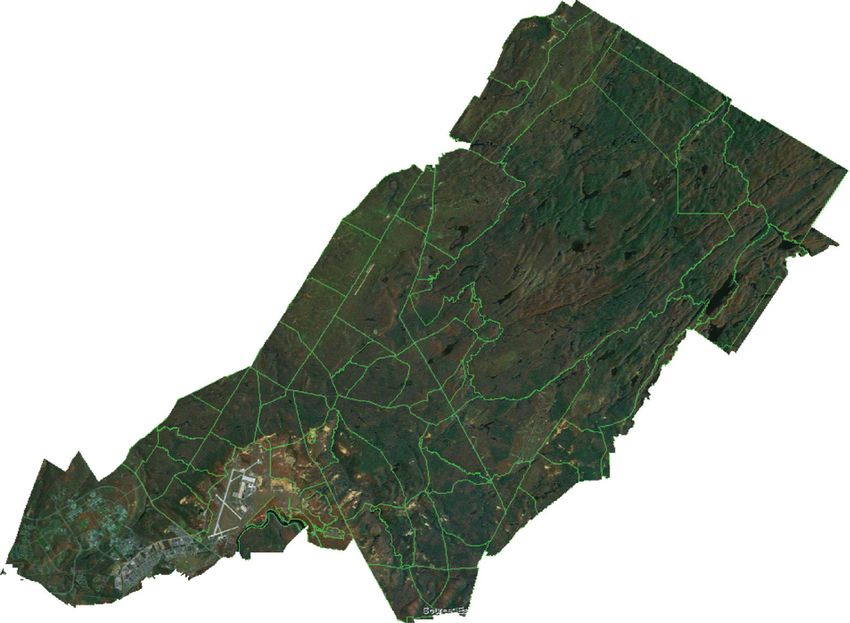
2.1. Study Area. Fort Drum is a U.S. Army installation tially during the latter half of 20th century [46]. These lands
covering over 43,000 ha near Watertown, New York, USA, have largely reverted to old field, shrub, and early succes-
approximately 25 km east of Lake Ontario (latitude 44.10°N, sional forest communities that characterize much of the local
longitude 75.65°W; Figure 1). The installation lies primarily landscape.
in the Saint Lawrence Glacial Lake Plain physiographic Approximately 30% of the undeveloped lowland land-
region [39] with elevations ranging from 126 m to 280 m. scapes at Fort Drum remains in open old field-woody shrub
The region has a humid, cool temperate climate with an cover types that developed following abandonment or dis-
average annual temperature of 7.9°C and mean annual placement of agricultural activities over the past 50–100
precipitation of 1100 mm. Average monthly precipitation is years. Grass (Schizachyrium scoparium, and Avenella flex-
highest in the late fall (114 mm in November) and lowest in uosa) and sedge (Carex pensylvanica, C. rugosperma, and
mid-winter (70 mm in February), but it is distributed evenly C. lucorum) communities with scattered stands of eastern
throughout the growing season. A substantial amount of white pine (Pinus strobus) and red pine (Pinus resinosa) as
precipitation falls as snow during the winter months aver- well as northern red oak and white oak (Quercus alba)
aging 2847 mm per year over the past 35 years. The average dominate dry sand plains [47]. In addition to occurring on
frost-free growing season runs from May 15 through Sep- the most xeric sites at Fort Drum, these communities are
tember 25 [40]. maintained in an open, early successional state through
Three physiographic units characterize the majority of the mowing and occasional ground fires that occur because of
installation: relatively flat, low elevation plains derived from military training exercises. On more mesic old field sites with
fine-textured glacial lacustrine deposits (28% of total area), fine-textured soils, early successional grass-sedge-herb and
slightly more elevated and coarse-textured sand terraces and woody shrub communities are common with species
plains derived from glacial outwash and wind-blown deposits composition varying depending on time since abandon-
(25% of total area), and bedrock-controlled uplands covered by ment, type of disturbance, and soil drainage [47]. Common
coarse glacial till in the northeastern third of the installation species include bluegrasses (Poa pratensis and P. compressa),
(27% of total area, [41]). Topography is a general level to gentle several introduced grass species (e.g., Elymus repens, Bromus
rolling, and both alluvial and depressional wetlands are inermis, and Dactylis glomerata), sedges (Carex spp.), and a
common throughout the installation. Soils in the western and diverse herb layer comprised of goldenrods (Solidago
southern portions of the base formed from postglacial, fine- altissima, S. nemoralis, and S. rugosa), New England aster
textured lacustrine deposits and sandy outwash plains un- (Sympyotrichum novae-angliae), evening primrose (Oeno-
derlain by sandstone and limestone bedrock. Mesic to wet, thera biennis), Queen Anne’s lace (Daucus carota), ragweed
circumneutral soils are common on lowland plains, while (Ambrosia artemisiifolia), and common chickweed (Ceras-
excessively drained soils predominate on higher sand plains tium arvense). Woody shrub cover ranges from 10% to 50%
and terraces. Intermediate to the above are relatively narrow and includes species such as speckled alder (Alnus incana),
terraces of mesic, loamy fine sands. There are significant areas shrub dogwoods (Cornus amomum and C. racemosa), su-
of calcareous glacial till covering lower elevation landscapes macs (Rhus glabra and R. typhina), and raspberries (Rubus
that have given rise to soils with relatively high base saturation spp.) along with shrubby red maple (Acer rubrum), green ash
and pH. The northeastern upland portion of the installation is (Fraxinus pensylvanica), and willow (Salix spp.). Other
dominated by acidic, coarse-textured soils derived from glacial relatively open cover types at Fort Drum include recently
till underlain by bedrock comprised of gneiss, schist, and harvested tracts dominated by early successional tree species
granite. Most upland soils are mesic, relatively shallow to such as trembling aspen (Populus tremuloides), big-tooth
bedrock, and have a frigid temperature regime (mean annual aspen (P. grandidentata), gray birch (Betula populifolia),
temperature 6°C, [42]). Organic soils associated with Broadleaved deciduous forests cover approximately 33%
bogs and alluvial wetlands cover approximately 6% of the of Fort Drum and are comprised of two primary northern
installation and are especially common in the northeastern hardwood types: beech-maple forest and maple-basswood
uplands as a result of glacial erosion of underlying bedrock (Tilia americana) rich mesic forest [43, 47]. Beech-maple
during the latter stages of the Pleistocene [41]. forests occur on upland sites with relatively shallow, coarse-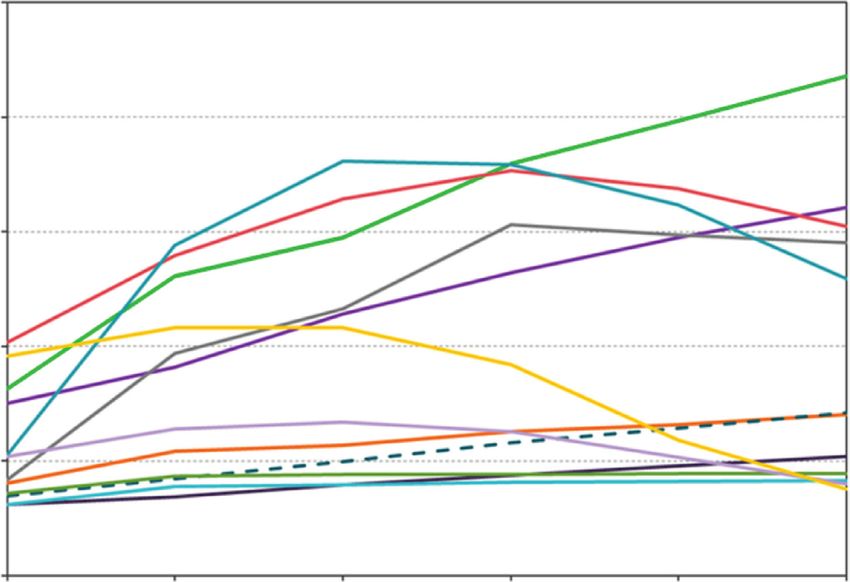
4                                                                                            International Journal of Forestry Research

                                          75oW

                       45oN

                                                        45oN
                                                                                     Impact zone
                                          75oW

                                                                                                        N
                                                     Airfield

                                Developed area
                                                                                         0     2.5      5         10

                                                                                                     Kilometers

Figure 1: Study site location (inset) and location of military infrastructure (training areas shown in green outline) at Fort Drum, New York,
USA. Training areas are comprised of over 1,500 forest stands managed to support military training requirements, timber and fiber
production, game and nongame wildlife management programs, and ecosystem sustainability. The “Impact Zone” and developed areas were
excluded from the study.

textured, and frigid soils derived from acidic glacial till.             marginalis), and a rich herb layer [47]. Red maple, black ash
Common associates include yellow birch, white ash,                       (Fraxinus nigra), green ash, and cottonwood (Populus del-
American hophornbeam (Ostrya virginiana), and red maple.                 toides) increase in frequency on poorly drained floodplains,
Depending on the level of disturbance, understories are                  stream terraces, and depressions within the maple-basswood
comprised of seedlings from the above species along with                 type (red maple-hardwood swamp forest and floodplain
striped maple (Acer pennsylvanicum), American hornbeam                   forest types [47]). Dutch elm disease (Ophiostoma spp.) has
(Carpinus caroliniana), viburnums (Viburnum lantanoides                  killed most mature American elm trees at Fort Drum, but
and V. acerifolium), and eastern hemlock. Extensive di-                  elm regeneration remains abundant on mesic, fine-textured
ameter-limit timber harvests have occurred in the upland                 soils throughout the installation.
forests at Fort Drum over the past 10 to 20 years, which has                  Evergreen coniferous forests and evergreen-deciduous
apparently resulted in a much higher component of red                    mixtures occur on approximately 25% of Fort Drum. Eastern
maple, black cherry, white ash, and northern red oak than                white pine and eastern hemlock form mixed stands with
might be expected for typical northern hardwood stands at                northern hardwoods on both upland and lowland sites (pine-
this latitude. In addition, beech bark disease (fungal path-             northern hardwood and hemlock-northern hardwood forests,
ogens Neonectria faginata and N. ditissima) has reduced the              [47]). Eastern hemlock is significantly more common on
prevalence of American beech at Fort Drum [13]. Maple-                   lowland soils derived from coarse loamy glaciofluvial deposits
basswood forests occur at lower elevations and on fine-                   and in forested wetlands where it forms dense stands with
textured mesic soils derived from glacial lacustrine deposits            northern white cedar (Thuja occidentalis), red maple, and
and till derived from limestone bedrock. Dominant tree                   yellow birch (hemlock-hardwood swamp forest, [47]). Pine
species include sugar maple, red maple, American basswood,               plantations (eastern white pine, red pine, jack pine Pinus
and white ash, but American elm (Ulmus americana), bit-                  banksiana, and Scotch pine Pinus sylvestris) predominate on
ternut hickory (Carya cordiformis), and black cherry are also            excessively drained sand plains. Overall, eastern white pine,
common associates. Understory vegetation is generally more               eastern hemlock, red maple, sugar maple, and black cherry
diverse than upland forests due to base-rich soils, abundant             comprise more than 70% of the total basal area and are among
soil moisture, and warmer temperatures and includes woody                the most abundant species on the installation. In conjunction
species such as American hophornbeam (Ostrya virginiana),                with the species listed, trembling aspen, gray birch, American
alternate-leaved dogwood (Cornus alternifolia), mountain                 elm, white ash, and northern red oak comprise the top ten
maple (Acer spicatum) and witch hazel (Hamamelis vir-                    species in terms of relative abundance (84%) and relative
giniana), ferns (Athyrium filix-femina and Dryopteris                     frequency at Fort Drum (Table 1).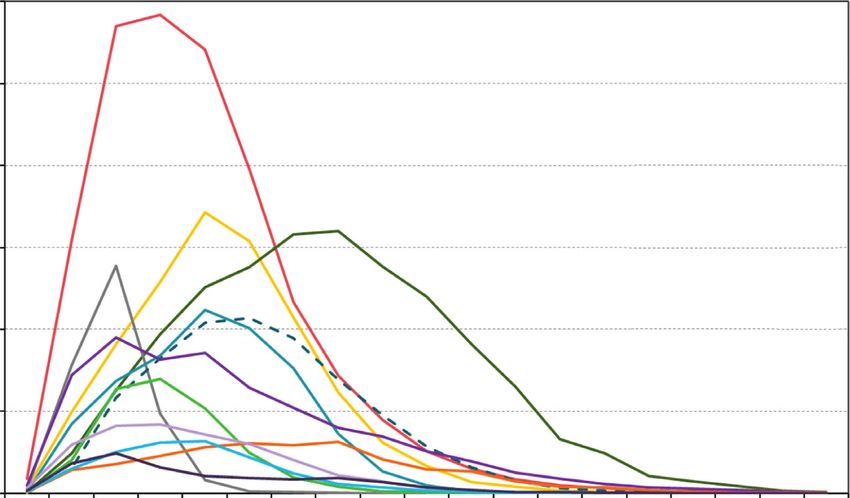
International Journal of Forestry Research                                                                                        5

      Table 1: Relative frequency, density, and abundance of the 22 most common tree species at Fort Drum, New York, USA.
Species                    Number of plots where present          Relative frequency     Relative basal area    Relative abundance
Acer rubrum                           3734                               55.8                   13.7                    20.0
Prunus serotina                       2983                               44.6                    8.9                    11.0
Pinus strobus                         2385                               35.6                   31.4                    16.7
Populus tremuloides                   1702                               25.4                    5.0                     7.2
Acer saccharum                        1624                               24.3                    9.2                     8.2
Ulmus americana                       1168                               17.4                    1.4                     3.3
Fraxinus americana                    1080                               16.1                    1.9                     3.0
Betula populifolia                    1057                               15.8                    0.6                     3.7
Tsuga canadensis                      1018                               15.2                    9.2                     8.2
Quercus rubra                          754                               11.3                    5.2                     3.2
Betula alleghaniensis                  691                               10.3                    1.2                    1.9
Fagus grandifolia                      583                                8.7                    1.2                    1.5
Tilia americana                        505                                7.5                    1.6                    2.0
Populus grandidentata                  433                                6.5                    1.7                    1.9
Ostrya virginiana                      345                                5.2                    0.1                    0.9
Quercus alba                           332                                5.0                    1.0                    0.8
Amelanchier laevis                     279                                4.2                    0.1                    0.7
Fraxinus nigra                         273                                4.1                    0.3                    1.0
Pinus resinosa                         229                                3.4                    1.7                    1.2
Betula papyrifera                      194                                2.9                    0.2                    0.5
Thuja occidentalis                     163                                2.4                    0.6                    1.2
Carya cordiformis                      117                                1.7                    0.3                    0.4

2.2. Developing Species-Age Cohorts. Detailed stand histo-           the majority of the overstory in their respective stands, then
ries were not available for Fort Drum, but a systematic,             age-diameter relationships derived from these trees should
variable-plot timber inventory completed in 2009–2011                approximate the mean age of stands at Fort Drum when
provided basic information on species composition,                   applied to the dominant species in each stand as defined by
abundance, DBH, and basal area distributions for 1,450               the relative basal area. It is important to note that the goal
stands covering approximately 25% of the installation.               in developing age-diameter relationships was not to de-
However, the Fort Drum inventory was largely designed to             termine the precise ages of individual trees with a high
produce a one-time estimate of commercial forest product             degree of accuracy but to develop generalized age-diameter
volume and did not contain data on total tree height or site         relationships that would support assignment of broad age
index that could be used to estimate stand ages from site            classes to stands at Fort Drum in order to parameterize the
index curves. Accordingly, we extracted age and DBH for              LANDIS-II base succession model. Insufficient data were
site trees from regional USDA Forest Service Forest In-              available for two overstory tree species at Fort Drum,
ventory and Analysis (FIA) program plots (2002–2012)                 American beech and white oak, so we excluded these
from the host and adjacent level IV ecoregions in New York           species from the analysis. All plots had a forested condition
[39, 48] for 13 species characteristic of major forest types at      class and elevation less than 500 m; the latter excluded trees
Fort Drum [38]. Each standard FIA plot is comprised of               located in higher elevations of the Adirondack Mountains
four circular subplots covering 0.4 hectares on which at-            and Tug Hill Plateau to the northwest and west, respec-
tributes are collected or computed for all trees greater than        tively, that were less likely to reflect site conditions at Fort
5 inches in diameter. A standard FIA plot represents ap-             Drum. We initially limited the FIA plot section to those
proximately 2,429 hectares (6,000 acres), and 15–20% of              located in counties containing the installation to approx-
each state is assessed annually. Aggregate statewide reports         imate site conditions as much as possible. However, in
are produced every 5 years that summarize key findings and            order to obtain minimal samples sizes to support devel-
compare trends over time [38]. Statistical details about the         opment of regression equations, we obtained data from
sampling framework, attributes collected at each plot, data          additional nearby counties for three species, eastern
processing procedures, and accuracy of FIA data are re-              hemlock, black cherry, and northern red oak, and a
ported by Bechtold and Patterson [49]. Site trees are                statewide sample was required for two species, American
dominant or codominant trees located on FIA subplots that            basswood and American elm. We filtered all site tree
are used to estimate site index and stand age. The age of site       records to remove duplicate records from multiple in-
trees is determined by counting growth rings on increment            ventory years. Tree age (years) and DBH (mm) were an-
cores extracted at 1.37 m above the ground, and each tree is         alyzed using simple linear regression (SAS JMP 13.1.0, SAS
assigned a weighting factor that approximates the pro-               Institute 2016); diameter distributions for all species or
portion of overstory trees represented by each site tree [50].       species groups were not significantly different from normal
If FIA site trees are representatives of the diameters and           based on the Shapiro–Wilk W test (W < 0.05), and all
ages of dominant and codominant species that comprise                outliers were retained in the analysis.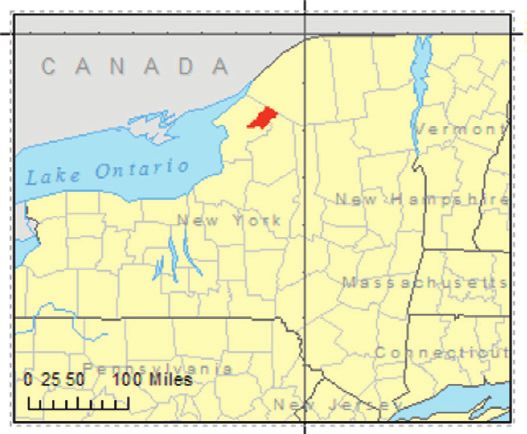
6                                                                                  International Journal of Forestry Research

    We then applied age-diameter regression equations to             We derived vegetation types for areas on the installation
forest stands on Fort Drum by using the mean DBH for the         not covered by the forest inventory using a land cover
most dominant species in each stand as the explanatory           dataset developed from 1 meter resolution aerial photog-
variable. Because the diameter distribution for all trees was    raphy in 2006 provided by the natural resources staff at Fort
negatively skewed (Figure 2(c)) and over 80% of the stands       Drum and county soil surveys [42]. These cover types were
had a mean DBH less than 218.4 mm (8.6 in), we assumed           primarily abandoned agricultural fields comprised of early
that mean DBH might provide a more meaningful basis for          successional grass-forb and woody shrub species and open
estimating stand ages than median DBH by reducing the            grass fields maintained for military training activities.
influence of large numbers of smaller diameter stems.             Species were not defined for grass-forb cover types, and
Smaller trees are less likely to be members of dominant and      subtypes were classified as mesic or xeric based on soil
codominant crown classes and would therefore be less             texture and drainage. Shrub cover types were combined into
comparable with site trees on FIA plots. Beginning with the      a single class comprised of woody deciduous shrub species
species with the highest relative basal area (RBA) in a stand,   such as speckled alder and willow and early successional
we used mean DBH and a species-specific regression                hardwoods of American elm, gray birch, red maple, and
equation to calculate age and rounded values to the next         trembling aspen with mesic and xeric subtypes defined by
highest 20-year class (e.g., ages 1–19 assigned to the 20-year   soil texture and drainage. We assigned open fields age class
age class and ages 21–39 assigned to the 40-year age class).     20 and shrub types contained age classes 20 and 40. Once the
As established by Twery et al. [51], we applied the following    stand attribute table was fully coded by type and age classes,
general rules for the number of species (SPP) used to es-        we converted stand features (polygons) to a raster format
timate age and forest type for each stand:                       with the 30 meter cell size using an integer value to represent
                                                                 each age-type condition.
    (1) Stands where SPP1RBA ≥ 70%, mean DBH for SPP1 is
        used to calculate age classes and SPP1RBA is used to
        determine forest type                                    2.3. Model Parameterization. The LANDIS-II Age-Only
    (2) Stands where SPP1RBA ≥ 50% and
International Journal of Forestry Research 7
Fort drum FIA
relative relative
Tree species basal area basal area
(percent) (percent) 3500
Pinus strobus 31.4 15.4 Mean 188.9
3000 Std Dev 103.0
Acer rubrum
Count
13.7 13.6 2500 Std Err Mean 0.89
Tsuga canadensis 9.2 9.6 Range 1137.9
2000
Interquartile Range 104.1
Acer saccharum 9.2 7.8 1500 n 13327
Prunus serotina 8.9 5.3
1000
Quercus rubra 5.2 1.9
500
Populus tremuloides 5.0 3.7
Fraxinus americana 1.9 4.3 0 100 200 300 400 500 600 700 800 900 1000
Populus grandidentata 1.7 1.3 Dbh (mm)
Pinus resinosa 1.7 2.0
Tilia americana 1.6 2.0
Ulmus americana 1.4 4.4
Fagus grandifolia 1.2 2.3
Betula alleghaniensis 1.2 1.6
Quercus alba 1.0 0.2
Thuja occidentalis 0.6 6.4
Betula populifolia 0.6 1.1
Salix spp. 0.4 0.9
Fraxinus nigra 0.3 1.8
Carya cordiformis 0.3 1.0
(a) (b)
10000
Mean 292.6
8000 Std dev 173.0
Count
Std err mean 0.62
6000 Range 1196.3
Interquartile range 226.1
4000 n 78946
2000
0 100 200 300 400 500 600 700 800 900 1000
Dbh (mm)
(c)
Figure 2: Relative basal area for the twenty most frequent trees at Fort Drum and for the same species on-site tree plots extracted from the
New York FIA database (a). Overall, species composition and relative density are similar, but significant differences are highlighted for
several species (bold type and gray shading). Diameter distributions (DBH) are shown for all trees for FIA site tree plots (b) and the Fort
Drum forest inventory plots (c).
datasets exhibiting an inverse J-shaped distribution, al- relationships were all statistically significant (p < 0.05) with
though there was a larger proportion of smaller diameter r2 values ranging from 0.42 for sugar maple to 0.63 for white
trees (DBH8 International Journal of Forestry Research
Table 2: Life history traits for species and cover types included in the LANDIS-II Age-Only Succession model.
Effective Max Min Max
Sexual Shade Fire Probability
Longevity seeding seeding sprout sprout Fire
Species/cover type maturity tolerance tolerance of sprouting
distance distance age age strategy
(yr) (yr) (1–5) (1–5) (m) (m) (0–1) (yr) (yr)
Mesic meadow/early
40 1 1 2 100 1000 0.5 0 40 None
successional shrub1
Xeric meadow/early
40 1 1 4 200 1000 0.5 0 40 None
successional shrub2
Abies balsamea 200 25 5 1 30 160 0 0 0 None
Acer rubrum 150 10 4 1 100 200 0.75 0 100 None
Acer saccharum 300 40 5 1 100 200 0.1 10 60 None
Alnus incana 40 10 1 1 100 500 0.9 0 40 None
Betula alleghaniensis 300 40 3 2 100 400 0.1 10 180 None
Betula populifolia 100 30 2 2 200 5000 0.5 10 70 None
Carya cordiformis 300 30 3 3 30 100 0.75 10 100 None
Fagus grandifolia 300 40 5 1 30 100 0.75 0 100 None
Fraxinus americana 150 20 3 1 100 200 0.75 10 100 None
Fraxinus nigra 150 20 3 1 100 200 0.75 10 100 None
Ostrya virginiana 100 25 5 1 100 500 0.7 0 40 None
Pinus banksiana 100 15 1 3 30 100 0 0 0 Serotiny
Pinus resinosa 200 35 2 4 30 275 0 0 0 None
Pinus strobus 400 40 3 3 60 210 0 0 0 None
Populus deltoides 100 20 1 1 1000 5000 0.9 10 100 None
Populus tremuloides 100 20 1 1 1000 5000 0.9 10 100 None
Populus
100 20 1 1 1000 5000 0.9 10 100 None
grandidentata
Prunus serotina 150 20 1 1 30 100 0.75 0 100 None
Quercus alba 300 25 3 2 30 1000 0.75 20 100 None
Quercus rubra 250 25 3 2 30 1000 0.75 20 100 None
Salix spp. 150 20 1 1 200 5000 0.75 10 70 None
Thuja occidentalis 400 20 3 1 30 60 0.1 10 100 None
Tilia americana 250 30 4 1 30 120 0.1 10 200 None
Tsuga canadensis 450 30 5 2 30 100 0 0 0 None
Ulmus americana 200 40 3 1 100 400 0.75 0 100 None
1
Grass (Poa pratensis and P. compressa), sedges (Carex spp.), and herbs (Solidago altissima, S. nemoralis, S. rugosa, Sympyotrichum novae-angliae, Oenothera
biennis, Daucus carota, Ambrosia artemisiifolia, and Cerastium arvense) communities with scattered clumps of woody shrubs (Alnus incana, Cornus
amomum, C. racemosa, Rhus glabra, R. typhina, and Rubus spp.). 2Grass (Schizachyrium scoparium and Avenella flexuosa) and sedge (Carex spp.)
communities with scattered pine (Pinus strobus and P. resinosa) and oak (Quercus rubra and Q. alba) regeneration.
Table 3: Establishment probabilities for species included in the LANDIS-II Age-Only Succession model listed by ecological site type.
1 2 3 4 5 6 7
Hydric Subhydric Mesic Mesic Xeric
Species Mesic, acidic Mesic, basic
depressional alluvial glaciolacustrine glaciofluvial sand
glacial till glacial till
wetland deposit plain sand terrace plain
Mesic meadow/early
0.9 0.9 0.7 0.3 0.2 0.1 0.3
successional shrub
Xeric meadow/early
0.1 0.4 0.3 0.3 0.3 0.9 0.5
successional shrub
Abies balsamea 0.9 0.7 0.2 0.1 0.1 0 0.1
Acer rubrum 0.7 0.8 0.9 0.9 0.9 0.5 0.7
Acer saccharum 0.2 0.3 0.9 0.5 0.9 0.5 0.9
Alnus incana 0.9 0.9 0.5 0.1 0.1 0.1 0.1
Betula alleghaniensis 0.9 0.7 0.5 0.7 0.9 0.2 0.5
Betula populifolia 0.3 0.7 0.9 0.3 0.5 0.5 0.5
Carya cordiformis 0.1 0.7 0.6 0.2 0.2 0.1 0.9
Fagus grandifolia 0.3 0.5 0.5 0.6 0.9 0.3 0.4
Fraxinus americana 0.3 0.7 0.9 0.3 0.9 0.3 0.7
Fraxinus nigra 0.9 0.9 0.5 0.2 0.1 0.1 0.1
Ostrya virginiana 0.2 0.5 0.5 0.4 0.8 0.1 0.4
Pinus banksiana 0.1 0.1 0.2 0.3 0.3 0.9 0.2
Pinus resinosa 0.1 0.1 0.2 0.3 0.5 0.9 0.3
Pinus strobus 0.4 0.7 0.5 0.7 0.9 0.9 0.5International Journal of Forestry Research 9
Table 3: Continued.
1 2 3 4 5 6 7
Hydric Subhydric Mesic Mesic Xeric
Species Mesic, acidic Mesic, basic
depressional alluvial glaciolacustrine glaciofluvial sand
glacial till glacial till
wetland deposit plain sand terrace plain
Populus deltoides 0.3 0.9 0.5 0.2 0.1 0.1 0.4
Populus tremuloides 0.3 0.9 0.9 0.5 0.5 0.5 0.5
Populus grandidentata 0.3 0.7 0.8 0.5 0.7 0.5 0.5
Prunus serotina 0.3 0.9 0.9 0.5 0.9 0.5 0.7
Quercus alba 0.1 0.2 0.4 0.4 0.3 0.8 0.5
Quercus rubra 0.1 0.2 0.5 0.5 0.5 0.9 0.5
Salix spp. 0.9 0.9 0.5 0.1 0.1 0.1 0.1
Thuja occidentalis 0.9 0.5 0.3 0.2 0.1 0.1 0.1
Tilia americana 0.3 0.5 0.9 0.4 0.5 0.2 0.9
Tsuga canadensis 0.9 0.9 0.9 0.9 0.7 0.5 0.4
Ulmus americana 0.3 0.7 0.9 0.2 0.4 0.2 0.7
Table 4: Age-diameter relationships developed from site trees (n � 395) extracted from the New York FIA database.
Dbh (mm) Age (yrs) Linear regression model
Species 2
N x(SE) x(SE) Range r RMSE P Equation
Fraxinus americana 35 249.7 (12.2) 47.7 (3.9) 21–118 0.63 14.110 International Journal of Forestry Research
3000
2500
2000
Frequency
1500
1000
500
0
0 10 20 30 40 50 60 70 80 90 100 110 120 130 140 150 160 170 180
Age (yr)
Red maple Eastern hemlock N.red oak
Black cherry Quaking aspen White ash
Eastern white pine Sugar maple Yellow birch
American beech
Gray birch American elm
Figure 3: Age distributions for the 12 most common tree species at Fort Drum, New York, USA, based on age-diameter equations developed
from FIA site trees: red maple (Acer rubrum), black cherry (Prunus serotina), eastern white pine (Pinus strobus), gray birch (Betula
populifolia), eastern hemlock (Tsuga canadensis), quaking aspen (Populus tremuloides), sugar maple (Acer saccharum), American elm
(Ulmus americana), northern red oak (Quercus rubra), white ash (Fraxinus americana), yellow birch (Betula alleghaniensis), and American
beech (Fagus grandifolia).
200
MI (r2 = 0.88)
180
160
WI (r2 = 0.64)
140
NH (r2 = 0.47)
120
Tree age (yrs)
FIA (r2 = 0.48)
100
80
60 NY (r2 = 0.81)
40
20
0
50 100 150 200 250 300 350 400 450 500 550 600 650
Dbh∗ (mm)
Figure 4: Age-diameter relationships for sugar maple (Acer saccharum) derived from previous studies and analysis of FIA site trees in North
America: Michigan (MI), managed stand with several selection harvests ([24], Table 1); Wisconsin (WI), managed stands, selectively
harvested ([25], Figure 1, ∗ diameter measured from top of cut stump); New Hampshire (NH), old-growth stand ([26], Table 1, ∗ diameter
measured at top of root swell); FIA, site trees from New York FIA database (this study); New York (NY), uneven-aged managed stand,
Allegheny Plateau ([27], Figure 2).International Journal of Forestry Research 11
180
QU (r2 = 0.49) NC
160
NY (r2 = 0.42)
140 OH (r2 = 0.39)
WV
120
Tree age (yrs)
100 CT (r2 = 0.94)
FIA (r2 = 0.48)
80
60
40
20
0
50 100 150 200 250 300 350 400 450 500 550 600 650
Dbh (mm)
Figure 5: Age-diameter relationships for northern red oak (Quercus rubra) derived from previous studies and analysis of FIA site trees in
North America: Quebec (QU), based on mean radial growth averages for 12 stands in southern Canada ([35], Table 2); North Carolina (NC),
old-growth stand, southern Appalachian Mountains ([36], Figure 3); New York (NY), Black Rock Forest ([34], Ohio (OH), old-growth
stands (5), Allegheny Plateau ([32], Figure 4.7); West Virginia (WV), average for 16, 55, and 80 year old managed stands, Monongahela
National Forest ([37], Table 5); Connecticut (CT), average diameter and age for 7 managed stands ([33], Table 1); FIA, site trees from New
York FIA database (this study).
0.25
0.20
Proportion of landscape
0.15
0.10
0.05
0.00
0 20 40 60 80 100
Simulation year
American elm Quaking aspen White pine
Sugar maple N.red oak Yellow birch
Red maple Eastern hemlock White ash
Black cherry
Gray birch American beech
Figure 6: Landscape level change in the 12 most common overstory tree species at Fort Drum, New York, USA, over a 100-year simulation
of forest succession under a no disturbance scenario: American elm (Ulmus americana), sugar maple (Acer saccharum), red maple (Acer
rubrum), gray birch (Betula populifolia), quaking aspen (Populus tremuloides), northern red oak (Quercus rubra), eastern hemlock (Tsuga
canadensis), American beech (Fagus grandifolia), eastern white pine (Pinus strobus), yellow birch (Betula alleghaniensis), white ash
(Fraxinus americana), and black cherry (Prunus serotina).12 International Journal of Forestry Research
N
Kilometers
0 2.5 5 10
Inactive OAK-pine
Mesic field YNG pine
Xeric field Pine
Mesic shrub YNG northern hardwood
Xeric shrub Northern hardwood
Wet forest YNG mixed pine-HWD
YNG maple-ELM Mixed PINE-HWD
Maple-ELM Hemlock-HWD
OAK woodland YNG maple-ASPEN-cherry
Maple-OAK Maple-ASPEN-cherry
(a)
N
Kilometers
0 2.5 5 10
Inactive OAK-pine
Mesic field YNG pine
Xeric field Pine
Mesic shrub YNG northern hardwood
Xeric shrub Northern hardwood
Wet forest YNG mixed pine-HWD
YNG maple-ELM Mixed PINE-HWD
Maple-ELM Hemlock-HWD
OAK woodland YNG maple-ASPEN-cherry
Maple-OAK Maple-ASPEN-cherry
(b)
Figure 7: Current (a) and simulated (b) community type-age cohorts at Fort Drum, New York, USA. Maple-dominated stands in maple-elm
(bright green) and northern hardwood (dark brown) types increased substantially over the 100-year simulation, while open grass-forb
communities, oak woodlands (orange), and mixed pine (dark olive) stands declined. Forest stand data were not available for “INACTIVE”
(gray) areas. In the map legend, “YNG” denotes stands less than 40 years of age and “HWD” denotes northern hardwood species. (a) 2015.
(b) 2115.International Journal of Forestry Research 13
4. Discussion tended to shift towards hardwood dominance as shade-
tolerant deciduous species, primarily sugar maple and red
Simulation of forest succession over 100 years on a landscape maple, increased in abundance. Young pine and mixed pine-
in northern New York State produced results largely con- hardwood types decreased by 83% and 74%, respectively,
sistent with our general understanding of how tree species during the 100-year simulation. Oak woodlands that occur
composition changes over time in this ecoregion [52, 56–58]. almost exclusively on excessively drained, coarse-textured
In the absence of major disturbances and/or a full ac- soils declined almost 99%. Establishment probabilities for
counting for potential future forest pathogen impact, i.e., the various maple species were almost half of those for oak
balsam wooly adelgid (Adelges tsugae), emerald ash borer and pine species on these sites, but high relative abundance,
(Agrilus planipennis), and beech-bark disease (Neonectria greater regeneration potential, and shade tolerance appar-
spp.), shade-tolerant mesophytic broadleaved species such ently combined to overcome any potential adaptions to
as sugar maple, red maple, and American beech increased in relatively low soil fertility and moisture. It may be that
importance in established forest stands. Sugar maple and red despite the low stand densities (mean basal area14 International Journal of Forestry Research
from other works. In addition, site conditions in any single disturbances are introduced to models to simulate more
stand should be less variable than the range of conditions in realistic future landscape conditions, especially over shorter
hundreds of northern hardwood stands at Fort Drum, which time periods, the accuracy of cohort ages would appear to be
may mean that growth rates (and therefore age-diameter a significant issue because response to various disturbances
relationships) may be applicable to some stands, but not can be highly age-dependent. Therefore, it would seem
others. Overall, age-diameter curves for sugar maple and additional assessments of tree or stand ages for landscapes
northern red oak showed a high degree of variability across being modeled, including sensitivity analysis to more ac-
the studies reviewed with diameter explaining as little as 39% curately assess how inaccuracies in cohort ages might in-
to as much as 94% of the variation in age. Age-diameter fluence model results are needed. As managers go forward,
relationships based on published studies may be more these kinds of data will be critical for understanding po-
representative of older northern hardwood stands on upland tential outcomes relative to climate change or changes in
sites at Fort Drum but may not reflect growth rates for lower forest utilization.
elevation species on mesic (maple-basswood type) and xeric
(pine and pine-oak types) sites at Fort Drum. Data Availability
Although the accuracy of age classes developed for forest
stands at Fort Drum was not quantified, ages represented by The datasets used and/or analyzed during the current study
20-year classes should account for some level of variation in are available from the corresponding author upon request.
age-diameter relationships and have been used elsewhere to
model successional trajectories at a landscape scale. Zhang Disclosure
et al. [62] used FIA site trees to develop age-diameter
equations and species-age cohorts for oak (Quercus spp.) The use of any trade, product, or firm names does not imply
and hickory (Carya spp.) forests in the Missouri Ozarks. endorsement by the U.S. government.
Details of their regression analyses were not presented, but r2
for age-diameter correlations was fairly low, ranging from Conflicts of Interest
0.15 (red maple) to 0.35 for white oak. Duveneck et al. [52]
calculated tree ages using FIA plot data and site index curves The authors declare that they have no conflicts of interest.
to develop 5-year age classes to parameterize a LANDIS-II
model for a landscape in Michigan. Other research has Authors’ Contributions
referenced FIA data as the source of species-age cohorts used
to parameterize LANDIS-II models [63–65], but these RHO and WMF conceived the study. WMF obtained
studies often do not clearly describe how age data were funding and provided study oversight. RHO performed the
derived, do not provide an accuracy assessment of age cohort analyses. RHO and WMF interpreted the data. RHO pre-
estimates, nor include sensitivity analyses that might help to pared the manuscript. WMF edited and prepared the
understand how variability in age cohorts might affect manuscript for submission.
modeling results. Indeed, if only a few trees on FIA plots are
used to assign stand ages within the FIA database, estimates Acknowledgments
of stand age would be subject to a high degree of variation
since each FIA plot represents approximately 2,362 ha of Special thanks to C. Dobony and R. Voss and from the Fort
forest [38], which could contain hundreds of stands with Drum Natural Resources Management staff for logistical
varying histories, species compositions, and site conditions. assistance and data access and N. Beane, L. Resler, and
S. Prisley for providing helpful comments on an earlier draft
5. Conclusions of this manuscript. This work was supported by the U.S.
Army AERTA 6.1 program through the U.S. Army Engi-
Developing broad age cohorts from species-specific age- neering Research and Development Center, Environmental
diameter equations derived from FIA site trees is a relatively Lab to Virginia Polytechnic Institute and State University.
straightforward process and provides a means of minimizing
site variability to some degree by selecting FIA plots and site References
trees from similar ecoregions as those being modeled.
However, unknown stand histories and variability in growth [1] C. D. Canham and R. Q. Thomas, “Frequency, not relative
rates, both within a species at different life stages and among abundance, of temperate tree species varies along climate
species with different shade tolerances in mixed northern gradients in eastern North America,” Ecology, vol. 91, no. 12,
hardwood stands, create a substantial level of uncertainty pp. 3433–3440, 2010.
concerning the accuracy of FIA-based age cohorts used in [2] L. Iverson, A. Prasad, and S. Matthews, “Modeling potential
climate change impacts on the trees of the northeastern
LANDIS-II simulations. Over long simulation timeframes
United States,” Mitigation and Adaptation Strategies for
(>100 years), inaccuracies in cohort ages may become Global Change, vol. 13, no. 5-6, pp. 487–516, 2008.
somewhat unimportant since, in lieu of major disturbance, [3] D. W. McKenney, J. H. Pedlar, K. Lawrence, K. Campbell, and
shade-tolerant species should eventually dominate most M. F. Hutchinson, “Potential impacts of climate change on the
northern hardwood stands regardless of whether stand distribution of north American trees,” BioScience, vol. 57,
simulations begin at age 20 or 40. However, as exogenous no. 11, pp. 939–948, 2007.International Journal of Forestry Research 15
[4] C. W. Woodall, C. M. Oswalt, J. A. Westfall, C. H. Perry, [19] H. S. He, D. J. Mladenoff, and T. R. Crow, “Linking an
M. D. Nelson, and A. O. Finley, “An indicator of tree mi- ecosystem model and a landscape model to study forest
gration in forests of the eastern United States,” Forest Ecology species response to climate warming,” Ecological Modelling,
and Management, vol. 257, no. 5, pp. 1434–1444, 2009. vol. 114, no. 2-3, pp. 213–233, 1999.
[5] C. Loehle and D. Leblanc, “Model-based assessments of cli- [20] D. J. Mladenoff, “LANDIS and forest landscape models,”
mate change effects on forests: a critical review,” Ecological Ecological Modelling, vol. 180, no. 1, pp. 7–19, 2004.
Modelling, vol. 90, no. 1, pp. 1–31, 1996. [21] M. Maltamo, H. Kinnunen, A. Kangas, and L. Korhonen,
[6] R. G. Pearson and T. P. Dawson, “Predicting the impacts of “Predicting stand age in managed forests using National
climate change on the distribution of species: are bioclimate Forest Inventory field data and airborne laser scanning,”
envelope models useful?” Global Ecology and Biogeography, Forest Ecosystems, vol. 7, no. 1, p. 44, 2020.
vol. 12, no. 5, pp. 361–371, 2003. [22] C. V. Cogbill: Commentary on “Age/Diameter Relation-
[7] W. Thuiller, “Patterns and uncertainties of species’ range ships,” 2003, http://www.nativetreesociety.org/oldgrowth/
shifts under climate change,” Global Change Biology, vol. 10, age_determinations.htm.
no. 12, pp. 2020–2027, 2004. [23] C. B. Gibbs, Tree Diameter a Poor Indicator of Age in West
[8] J. A. Wiens, D. Stralberg, D. Jongsomjit, C. A. Howell, and Virginia hardwoods, p. 4, U.S. Department of Agriculture,
M. A. Snyder, “Niches, models, and climate change: assessing Forest Service, Northeastern Forest Experiment Station,
the assumptions and uncertainties,” Proceedings of the Na- Upper Darby, PA, USA, 1963.
tional Academy of Sciences, vol. 106, no. Supplement_2, [24] C. H. Tubbs, “Age and structure of a northern hardwood
pp. 19729–19736, 2009. selection forest, 1929-1976,” Journal of Forest, vol. 75, no. 1,
[9] A. R. Weiskittel, D. W. Hann, J. A. Kershaw Jr., and p. 1977, 1977.
J. K. Vanclay, Forest Growth and Yield Modeling, John Wiley [25] D. C. Dey, J. Dwyer, and J. Wiedenbeck, “Relationship be-
& Sons Ltd, West Sussex UK, First edition, 2011. tween tree value, diameter, and age in high-quality sugar
[10] N. L. Crookston, G. E. Rehfeldt, G. E. Dixon, and maple (Acer saccharum) on the Menominee Reservation,
A. R. Weiskittel, “Addressing climate change in the forest Wisconsin,” Journal of Forestry, vol. 115, no. 5, pp. 397–405,
vegetation simulator to assess impacts on landscape forest 2017.
dynamics,” Forest Ecology and Management, vol. 260, no. 7, [26] W. B. Leak, Relationships of Tree Age to Diameter in Old-
pp. 1198–1211, 2010. Growth Northern Hardwood and Spruce-Fir, p. 4, U.S. Dept. of
[11] S. N. Matthews, L. R. Iverson, A. M. Prasad, M. P. Peters, and Agriculture, Forest Service, Northeastern Forest Experiment
P. G. Rodewald, “Modifying climate change habitat models Station, Philadelphia, PA, USA, 1985.
using tree species-specific assessments of model uncertainty [27] L. S. Kenefic and R. D. Nyland, “Sugar maple height-diameter
and life history-factors,” Forest Ecology and Management, and age-diameter relationships in an uneven-aged northern
vol. 262, no. 8, pp. 1460–1472, 2011. hardwood stand,” Northern Journal of Applied Forestry,
[12] C. Loehle, “Forest ecotone response to climate change: sen- vol. 16, no. 1, pp. 43–47, 1999.
sitivity to temperature response functional forms,” Canadian [28] R. M. Burns and B. H. Honkala, “Silvics of North America: 1.
Journal of Forest Research, vol. 30, no. 10, pp. 1632–1645, 2000. Conifers; 2. Hardwoods,” in Agriculture Handbook 654, U.S.
[13] X. Morin and W. Thuiller, “Comparing niche- and process- Department of Agriculture, Forest Service, Washington, DC,
based models to reduce prediction uncertainty in species USA, 1990.
range shifts under climate change,” Ecology, vol. 90, no. 5, [29] E. L. Little Jr., Atlas of United States Trees, Volume 1, Conifers
pp. 1301–1313, 2009. and Important Hardwoods: MISC, p. 9, U.S. Department of
[14] A. Guisan and N. E. Zimmermann, “Predictive habitat dis- Agriculture, Washington, DC, USA, 1971.
tribution models in ecology,” Ecological Modelling, vol. 135, [30] S. R. Shifley, A Generalized System of Models Forecasting
no. 2-3, pp. 147–186, 2000. Central States Tree growth, p. 10, U.S. Department of Agri-
[15] E. J. Gustafson, “When relationships estimated in the past culture, Forest Service, North Central Forest Experiment
cannot be used to predict the future: using mechanistic Station, St. Paul, MN, USA, 1987.
models to predict landscape ecological dynamics in a [31] R. M. Teck and D. E. Hilt, Individual Tree-Diameter Growth
changing world,” Landscape Ecology, vol. 28, no. 8, Model for the Northeastern United States, p. 11, U.S. De-
pp. 1429–1437, 2013. partment of Agriculture, Forest Service, Northeastern Forest
[16] A. de Bruijn, E. J. Gustafson, B. R. Sturtevant et al., “Toward Experiment Station, Radnor, PA, USA, 1991.
more robust projections of forest landscape dynamics under [32] J. S. Rentch, “Stand dynamics and disturbance history of five
novel environmental conditions: embedding PnET within oak-dominated old-growth stands in the unglaciated appa-
LANDIS-II,” Ecological Modelling, vol. 287, no. 10, pp. 44–57, lachian plateau,” Ph.D. Thesis, p. 227, West Virginia Uni-
2014. versity, Morgantown, WV, USA, 2001.
[17] D. J. Mladenoff and H. S. He, “Design, behavior and appli- [33] C. D. Oliver, “The development of northern red oak (Quercus
cations of LANDIS, an object-oriented model of forest rubra L.) in mixed species,” Even-Aged Stands in Central New
landscape disturbance and succession,” in Spatial modeling of England, Ph.D. Thesis, p. 223, Yale University, New Haven,
Forest Landscape Change, D. J. Mladenoff and W. L. Baker, CT, USA, 1975.
Eds., pp. 125–162, Cambridge University Press, Cambridge, [34] Black Rock Forest, Long Term Plot Data from the Calvin Whitney
UK, 1999. Stillman Research Archive, Black Rock Forest, Orange, NY, USA,
[18] R. M. Scheller, J. B. Domingo, B. R. Sturtevant et al., “Design, 2017, http://blackrockforest.org/environmental-data/forest-legacy-
development, and application of LANDIS-II, a spatial land- data/long-term-plot-data.
scape simulation model with flexible temporal and spatial [35] J. C. Tardif, F. Conciatori, P. Nantel, and D. Gagnon, “Radial
resolution,” Ecological Modelling, vol. 201, no. 3-4, growth and climate responses of white oak (Quercus alba) and
pp. 409–419, 2007. northern red oak (Quercus rubra) at the northern distribution16 International Journal of Forestry Research
limit of white oak in Quebec, Canada,” Journal of Biogeog- Northern Research Station, Newtown Square, PA, USA,
raphy, vol. 33, no. 9, pp. 1657–1669, 2006. 2011.
[36] S. L. Van de Gevel, J. L. Hart, M. D. Spond, P. B. White, [52] M. J. Duveneck, R. M. Scheller, M. A. White et al., “Climate
M. N. Sutton, and H. D. Grissino-Mayer, “American chestnut change effects on northern Great Lake (USA) forests: a case
(Castanea dentata) to northern red oak (Quercus rubra): for preserving diversity,” Ecosphere, vol. 5, no. 2, p. 23, 2014.
forest dynamics of an old-growth forest in the Blue Ridge [53] J. R. Thompson, D. R. Foster, R. Scheller, and D. Kittredge,
Mountains, USA,” Botany, vol. 90, no. 12, pp. 1263–1276, “The influence of land use and climate change on forest
2012. biomass and composition in Massachusetts, USA,” Ecological
[37] G. W. Miller, Effect of Crown Growing Space and Age on the Applications, vol. 21, no. 7, pp. 2425–2444, 2011.
Growth of Northern Red Oak, pp. 140–159, University of [54] C. Ferree and M. G. Anderson, A Map of Terrestrial Habitats
Freiburg, Freiburg, Germany, 1997. of the Northeastern United States: Methods and Approach,
[38] B. M. O’Connell, The Forest Inventory and Analysis Database: The Nature Conservancy, Eastern Conservation Science,
Database Description and User Guide Version 6.0.1 for Phase 2, Eastern Regional Office, Boston, MA, USA, 2013, http://
p. 748, U.S. Department of Agriculture, Forest Service, easterndivision.s3.amazonaws.com/Terrestrial/CanadaHabitat/
Washington, DC, USA, 2014. HABITAT_neUS_eCANADA.zip.
[39] R. G. Bailey, P. E. Avers, T. King, and W. H. McNab, Ecor- [55] R. H. Odom, “Simulated effects of climate change on soil
egions and Subregions of the United States (map), USDA moisture deficits, species distributions and biomass in a
northern hardwood forest,” Ph.D. Thesis, p. 189, Virginia
Forest Service, Washington, DC, USA, 1994.
Polytechnic Institute and State University, Blacksburg, VA,
[40] A. Arguez, I. Durre, S. Applequist et al., “NOAA’s 1981-2010
USA, 2018.
U.S. climate normals: an overview,” Bulletin of the American
[56] F. H. Bormann and G. E. Likens, Pattern and Process of a
Meteorological Society, vol. 93, no. 11, pp. 1687–1697, 2012.
Forested System, p. 253, Springer-Verlag, New York, NY,
[41] L. McDowell, Soil Survey of Jefferson County, p. 210, USDA
USA, 1979.
Soil Conservation Service, New York, NY, USA, 1989.
[57] C. A. Copenheaver, “Old-field succession in western New
[42] Natural Resources Conservation Service, Soil Taxonomy: A
York: the progression of forbs and woody species from
Basic System of Soil Classification for Making and Interpreting abandonment to mature forest,” Rhodora, vol. 110, no. 942,
Soil Surveys, p. 886, 2nd edition, Natural Resources Con- pp. 157–170, 2008.
servation Service, U.S. Department of Agriculture Handbook [58] J. R. Thompson, D. N. Carpenter, C. V. Cogbill, and
436, Washington, DC, USA, 1999. D. R. Foster, “Four centuries of change in Northeastern
[43] E. L. Braun, Deciduous Forests of Eastern North America, United States forests,” PLoS One, vol. 8, no. 9, Article ID
p. 596, Blackburn Press, Blackpool, UK, 1950. e72540, 2013.
[44] C. V. Cogbill, J. Burk, and G. Motzkin, “The forests of pre- [59] M. J. Twery and W. A. Patterson III, “Variations in beech bark
settlement New England, USA: spatial and compositional disease and its effects on species composition and structure of
patterns based on town proprietor surveys,” Journal of Bio- northern hardwood stands in central New England,” Cana-
geography, vol. 29, no. 10-11, pp. 1279–1304, 2002. dian Journal of Forest Research, vol. 14, no. 4, pp. 565–574,
[45] W. Cronon, Changes in the Land: Indians, Colonists and the 1984.
Ecology of New England, p. 257, Hill and Wang, New York, [60] P. R. Hannah, “Regeneration methods for oaks,” Northern
NY, USA, 1983. Journal of Applied Forestry, vol. 4, no. 2, pp. 97–101, 1987.
[46] B. F. Stanton and N. L. Bills, The Return of Agricultural Lands [61] P. S. Johnson, S. R. Shifley, and R. Rogers, The Ecology and
to Forest: Changing Land Use in the Twentieth Century, p. 140, Silviculture of Oaks, p. 580, 2nd edition, CABI Publishing,
Cornell University Department Agriculture Resource and CAB International, Wallingford, UK, 2009.
Managerial Economics, Ithaca, NY, USA, 1996. [62] Y. Zhang, H. S. He, W. D. Dijak, J. Yang, S. R. Shifley, and
[47] G. J. Edinger, D. J. Evans, S. Gebauer et al., Ecological B. J. Palik, “Integration of satellite imagery and forest in-
Communities of New York State, p. 173, 2nd edition, New York ventory in mapping dominant and associated species at a
State Department of Environmental Conservation, Albany, regional scale,” Environmental Management, vol. 44, no. 2,
NY, USA, 2014. pp. 312–323, 2009.
[48] J. M. Omernik, “Ecoregions of the conterminous United [63] C. D. Rittenhouse, W. D. Dijak, F. R. Thompson, and
States,” Annals of the Association of American Geographers, J. J. Millspaugh, “Development of landscape-level habitat
vol. 77, no. 1, pp. 118–125, 1987. suitability models for ten wildlife species in the central
[49] W. A. Bechtold and P. L. Patterson, “The enhanced forest hardwoods region,” General Technical Reports NRS-4, p. 47,
inventory and analysis program - national sampling design U.S. Department of Agriculture, Forest Service, Northern
and estimation procedures,” General Technical Reports SRS- Research Station, Philadelphia, PA, USA, 2007.
80, p. 85, U.S. Department of Agriculture, Forest Service, [64] S. R. Shifley, F. R. Thompson, W. D. Dijak, M. A. Larson, and
Southern Forest Experiment Station, Asheville, NC, USA, J. J. Millspaugh, “Simulated effects of forest management
2005. alternatives on landscape structure and habitat suitability in
[50] C. W. Woodall, B. L. Conkling, M. C. Amacher et al., “The the Midwestern United States,” Forest Ecology and Manage-
forest inventory and analysis database version 4.0: database ment, vol. 229, no. 1-3, pp. 361–377, 2006.
description and users’ manual for phase 3,” General Technical [65] J. Yang, H. S. He, S. R. Shifley, F. R. Thompson, and Y. Zhang,
“An innovative computer design for modeling forest land-
Report NRS-61, p. 180, U.S. Department of Agriculture, Forest
scape change in very large spatial extents with fine resolu-
Service, Northern Research Station, Newtown Square, PA,
tions,” Ecological Modelling, vol. 222, no. 15, pp. 2623–2630,
USA, 2010.
2011.
[51] M. J. Twery, P. D. Knopp, S. A. Thomasma, and D. E. Nute,
“NED-2 user’s guide,” General Technical Report NRS-85,
p. 193, U.S. Department of Agriculture, Forest Service,You can also read