COUNTRY ANALYSES 2019 EDITION - EUMOFA
←
→
Page content transcription
If your browser does not render page correctly, please read the page content below
COUNTRY ANALYSES
                         2019 EDITION

                          LAST UPDATE: JANUARY 2020

                                 WWW.EUMOFA.EU

Maritime Affairs
and Fisheries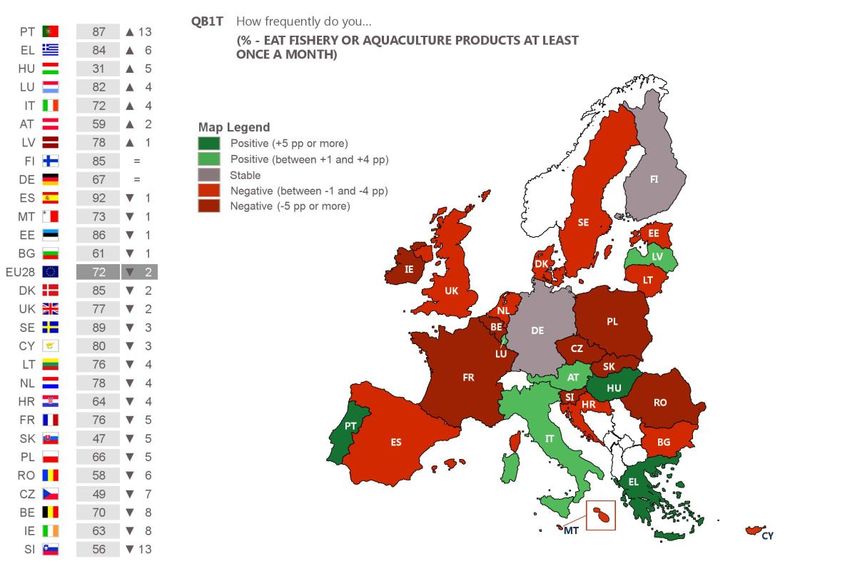
Manuscript completed in January 2020
Neither the European Commission nor any person acting on behalf of the
Commission is responsible for the use that might be made of the following
information.
Luxembourg: Publications Office of the European Union, 2020
© European Union, 2020
Reuse is authorised provided the source is acknowledged.
The reuse policy of European Commission documents is regulated by
Decision 2011/833/EU (OJ L 330, 14.12.2011, p. 39).
For any use or reproduction of photos or other material that is not under
the EU copyright, permission must be sought directly from the copyright
holders.
PDF        ISBN 978-92-76-15312-2            doi:10.2771/079202
FOR MORE INFORMATION AND COMMENTS:
Directorate-General for Maritime Affairs and Fisheries
B-1049 Brussels
Tel: +32 229-50101
E-mail: contact-us@eumofa.eu
Contents
1   Fisheries and aquaculture in Argentina .......................................................... 1
2   EU consumer habits regarding fishery and aquaculture products .................... 8
3   The EU fish processing industry .................................................................. 13
4   The Irish seafood sector ............................................................................. 20
5   Fisheries and aquaculture in Morocco .......................................................... 28
6   Fisheries and aquaculture in Russia ............................................................. 33
7   Fisheries and aquaculture in the United States ............................................ 40

European Market Observatory
                                                                        FISHERIES AND AQUACULTURE IN ARGENTINA
for Fisheries and Aquaculture Products

1                     Fisheries and aquaculture in Argentina
Argentina is the second largest country in South America by area after
Brazil. The country has a maritime coastline of more than 5.000 km
along the Southwestern Atlantic Ocean. The land area is 2,78 million
km2 and holds a human population of 44,7 million (2018), 13 million of
whom live in the capital Buenos Aires1.

The extensive coastline provides access to substantial fisheries
resources in the southern Atlantic, the 23 rd largest fishery in the world
in terms of volume, reaching 792.000 tonnes in 2018. Aquaculture
production is growing but is still at a low level, reaching 3.568 tonnes in
2017. Almost all fish landed are destined for human consumption, but
only 10% of resultant seafood products are consumed domestically2.
The sector is therefore reliant on the export market3. In 2018, the annual
domestic consumption of fish was 7,9 kg per capita4.

Most of the fisheries and aquaculture activities take place in the
Patagonia region, and the marine and inland fisheries represent 97% of
national seafood production5. It was estimated that the sector directly
employed 20.000 people in 20176. In 2018, exports of seafood Source: Worldatlas.
amounted to 455.000 tonnes valued at EUR 1,76 billion. Annual export volumes varied between 426.000 to 480.000 tonnes
between 2013 and 2018.

                    Fisheries
                                                                         Argentine fishing is based primarily on cold-water
    Figure 1.              TOTAL FISHERY LANDINGS IN ARGENTINA IN THE    demersal species, including hake and shrimp. At the
                           PERIOD 1990-2018                              end of the 1990s, Argentine fishing was characterised
                                                                         by the decrease in hake landings. At their highest
                   1.600                                                 point (1996), hake landings exceeded 600.000 tonnes
                                                                         and constituted 47% of total volume of landed fish.
                   1.400
                                                                         Total fishery landings fell gradually from their
                   1.200                                                 maximum levels of nearly 1,4 million tonnes in 1997
                                                                         to 792.000 tonnes in 2018.
                   1.000
     1000 tonnes

                    800
                    600
                    400
                    200
                      0
                           1992

                           2006

                           2012
                           1990

                           1994
                           1996
                           1998
                           2000
                           2002
                           2004

                           2008
                           2010

                           2014
                           2016
                           2018

                            Total Argentina          Argentine hake
    Source: FAO, https://www.agroindustria.gob.ar.

1
  www.fn.no
2
  https://seafood-tip.com/sourcing-intelligence/countries/argentina/
3
  See footnote 2.
4
  https://www.cronista.com/apertura-negocio/empresas/Cayo-un-48-el-consumo-per-capita-de-pescado-en-2018-20190204-0010.html
5
  See footnote 2.
6
  See footnote 2.
                                                                                                                                 1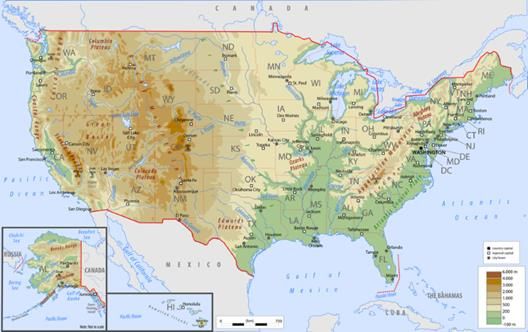
European Market Observatory
                                                                               FISHERIES AND AQUACULTURE IN ARGENTINA
for Fisheries and Aquaculture Products

Commercial Argentine fishing is based on about 50 species of bony fish, five species of crustacean and three species of
mollusc7. The 11 most significant species in terms of volume account for around 90% of total catch. In 2017, total catch
volumes were 835.000 tonnes, a 10% increase from 2016. Three species – Argentine hake, red shrimp and squid – dominate
Argentine fishery landings, and account for 75% of total landings in 2017.

Argentine hake landings have been stable over the past 8 years, with annual landings between 250.000–290.000 tonnes.
In 2017, hake fisheries landed above 282.000 tonnes, close to the volume recorded the year before. Argentine red shrimp,
the second largest catch species, has shown a strong volume growth every year since 2013. From 2013 to 2017, red shrimp
catches increased by 140% to above 243.000 tonnes. In 2013, red shrimp catches accounted for 12% of total fisheries and
in 2017 29% of total Argentine fisheries. Argentine shortfin squid landings have varied between 59.000 and 191.000
tonnes in the last 7 years. In 2017, squid landing volume was above 99.000 tonnes, a 40% increase from 2016.

Table 1.        MAIN SPECIES IN ARGENTINE FISHERIES (volume in tonnes)

    Species                       2010      2011      2012             2013            2014               2015      2016        2017
    Argentine hake                281.757   287.780   257.983          275.059         259.202            266.274   282.874     282.175
    Argentine red shrimp          72.085    82.922    79.927           101.105         127.250            143.315   178.444     243.268
    Argentine shortfin squid      85.989    76.598    94.984           191.741         168.727            126.671   59.891      99.170
    Patagonian scallop            50.870    47.844    36.820           42.202          33.583             31.627    35.536      39.297
    Patagonian grenadier          82.665    70.903    59.595           55.973          58.384             50.469    34.946      21.930
    Whitemouth croaker            15.843    24.679    37.868           45.637          38.591             31.359    31.965      19.801
    Prochilodus nei               13.999    15.164    12.148           11.986          14.181             17.417    17.191      19.008
    Rays, stingrays, mantas nei   20.326    20.426    15.168           15.195          15.739             19.010    17.696      17.422
    Southern blue whiting         11.636    3.518     8.379            7.887           9.050              13.831    13.236      15.897
    Stripped weakfish             12.772    13.710    15.214           16.388          14.399             16.898    9.887       11.898
    Argentine anchovy             26.323    21.084    15.434           18.081          13.955             14.411    8.713       10.546
    Other                         137.484   128.680   104.540          89.451          76.874             83.018    64.847      54.649
    Total                         811.749   793.308   738.060          870.705         829.935            814.300   755.226     835.061
Source: FAO.

    In 2018, Argentine fisheries amounted to about
    792.000 tonnes. Of this, 53% was composed of              Figure 2.      ARGENTINE FISHERIES IN 2018 BY COMMODITY GROUP
    demersal finfish species including hake, 33% was
    composed of crustaceans including red shrimp
    and 14% was composed of molluscs.

                                                                               14%                                   Demersal fishes

                                                                                                                     Crustaceans
                                                                                                            53%
                                                                    33%

                                                                                                                     Molluscs

                                                              Source: https://www.agroindustria.gob.ar.

7
    https://www.agroindustria.gob.ar/sitio/areas/pesca_maritima/desembarques/
                                                                                                                                          2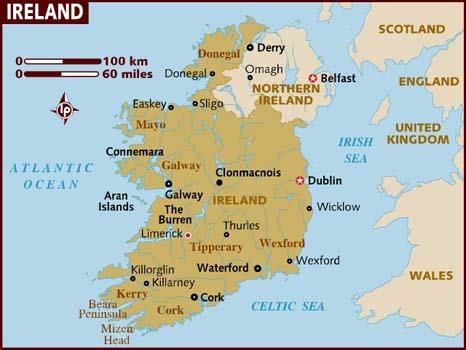
European Market Observatory
                                                                           FISHERIES AND AQUACULTURE IN ARGENTINA
for Fisheries and Aquaculture Products

              Aquaculture
Commercial aquaculture activity began in Argentina in the 1990s with rainbow trout, and there has been slight but steady
growth in the industry ever since8. Rainbow trout (Oncorhynchus mykiss) is now the second largest aquaculture species,
reaching 1.367 tonnes in volume and valued at USD 11,2 million. In 2017, the country’s main aquaculture species was pacu
(Piaractus mesopotamicus), reaching 1.885 tonnes in volume and EUR 14,1 million in value. This was 53% of total
aquaculture volume and 51% of total value. In the period from 2010 till 2017, pacu production increased 200% and was
the fastest growing aquaculture species. Together, pacu and rainbow trout constituted 91% of the Argentine aquaculture
volume and value in 2017.

In the period from 2010 to 2017, aquaculture production in Argentina increased 34% in terms of volume.

Employment in aquaculture is low, and businesses are generally small single-family or family-run businesses. Recently,
Argentina has approved a new aquaculture act, which is expected to allow the industry access to financing and international
markets and could also raise the value of Argentine seafood 9.

Table 2.           AQUACULTURE PRODUCTION IN ARGENTINA (value in EUR 1000)

    Species          2010         2011            2012            2013       2014     2015      2016          2017

    Pacu             5.805        8.301           9.526           17.182     15.659   17.334    13.861        14.125

    Rainbow trout 12.310          9.232           11.424          15.264     17.553   15.727    9.533         11.177

    Sorubims nei     264          11              369             1.437      1.094    891       617           913

    Tilapias nei     110          190             191             252        538      440       303           345

    Cyprinids nei    535          562             220             589        492      725       336           311

    Grass carp       0            225             220             519        350      378       209           228

    Other            1.482        2.440           1.172           2.446      1.270    1.774     535           586

    Total            20.506       20.961          23.122          37.690     36.957   37.270    25.395        27.685
Source: FAO.

Table 3.           AQUACULTURE PRODUCTION IN ARGENTINA (volume in tonnes)

    Species          2010          2011           2012            2013       2014     2015       2016         2017
    Pacu             626           1.227          1.345           2.017      2.119    1.804      1.947        1.885

    Rainbow trout 1.651            1.365          1.260           1.255      1.425    1.455      1.413        1.367

    Sorubims nei     23            1              54              174        95       62         75           89

    Cyprinids nei    90            114            52              76         100      93         69           57

    Tilapias nei     19            40             45              35         73       56         62           56

    Grass carp       0             46             52              67         71       48         43           42

    Other            245           400            150             201        120      145        64           72

    Total            2.654         3.193          2.958           3.825      4.003    3.663      3.673        3.568
Source: FAO.

8
    http://www.fao.org/fishery/countrysector/naso_argentina/en
9
    https://seafood-tip.com/sourcing-intelligence/countries/argentina/
                                                                                                                         3
European Market Observatory
FISHERIES AND AQUACULTURE IN ARGENTINA
for Fisheries and Aquaculture Products
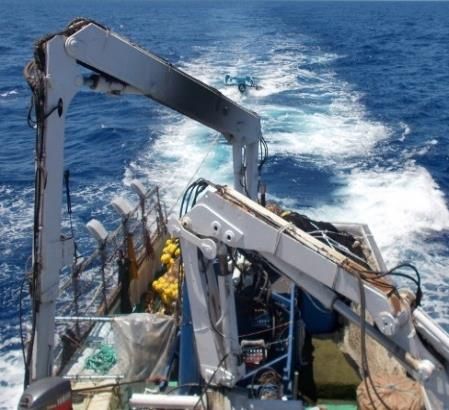
Processing industry, fleet and employment
The Argentine fish processing sector is a combination of on-board processing and land-based industry.
In the fisheries sector, there are 940 vessels with permits to operate in the Argentine Sea, of which 571 are nationals. The
national fishing fleet is composed of two classes: fresqueros, which have 361 actively licenced vessels (working with fresh
products), and freezers, which have on-board freezing capacity.
The fresqueros branch comprises 286 companies, while the freezers branch comprises 96 companies. In total, according to
data from the Undersecretaries of Fisheries and Aquaculture, there are about 10.000 people employed at sea.
In addition, there is what is called 'labour on land'. Fish processing takes place in 138 plants, which, together, employ 9.838
people. The province of Buenos Aires, with 93 establishments, has the highest concentration of workers with 4.890
employees. Chubut is second, with 2.568 workers in 25 plants, followed by Tierra del Fuego with 1.983 employees in three
industries, Santa Cruz with 340 workers in 13 plants and Río Negro with 57 employees in four sites 10.
Export
Argentina exports a significant amount of its seafood to the EU markets, mainly driven by demand from Spain, Italy and
France, in addition to China and the United States. Access to the European market is expected to improve since a South
American trade bloc, including Argentina, has signed a trade agreement with the EU (The EU-Mercosur trade agreement)11.
An elimination or reduction of tariffs will be positive for shrimp and hake fisheries as the EU market is one of the most
important destinations of these two products. In 2018, Argentine exports to EU accounted for 32% in terms of volume and
38% in value.
During the past 5 years, Argentine exports of seafood have varied between 426.000 and 480.000 tonnes a year. In 2018,
exports totalled 455.000 tonnes valued at EUR 1,76 billion, a 0,3% increase in volume and a 2% increase in value from
2017.
In the period from 2013 to 2018, export value increased 59%, but much of this is likely due to the current high inflation
rate in Argentina.
As international demand for Argentine shrimp continues to grow, shrimp has become the top seafood species, amounting
to 178.000 tonnes valued at EUR 1,06 billion in 2018, a 3% decrease in volume and 2% increase in value from 2017.
Shrimp accounted for 39% of the total volume and 61% of the total value of seafood exports in 2018. Exports of hake, the
second largest export species, totalled 81.000 tonnes in 2018, valued at EUR 189 million – a 16% decrease in volume and
a 9% decrease in value from 2017.
In 2018, exports to the largest market, Spain, amounted to 89.700 tonnes valued at EUR 412 million, and remained stable
from 2017. China, ranked as the second largest export market, showed a 51% growth in export volume and a 58% growth
in value. Exports to Italy, the third largest market, increased by 11% in volume and 30% in value.
Table 4. EXPORTS FROM ARGENTINA BY MAIN SPECIES (volume in tonnes, value in 1000 EUR)
2013 2014 2015 2016 2017 2018
Main
commercial Volume Value Volume Value Volume Value Volume Value Volume Value Volume Value
species
Shrimp,
91.048 459.436 107.298 579.447 120.787 687.066 159.880 907.395 183.291 1.047.202 178.184 1.063.200
miscellaneous
Hake 115.525 210.614 113.358 214.955 95.436 213.522 102.134 213.412 96.122 208.696 81.001 189.057
Molluscs and
aquatic
130.331 176.352 117.415 119.070 94.535 94.546 45.918 84.238 76.788 168.977 88.123 185.749
invertebrates,
other
‘Other marine
92.036 115.140 84.519 106.301 74.851 105.563 70.052 107.892 62.492 93.006 49.567 73.958
fish’
Other 50.985 143.518 52.224 160.065 54.051 190.786 48.773 206.410 38.326 210.098 58.653 243.652
Total 479.925 1.105.060 474.815 1.179.838 439.660 1.291.483 426.756 1.519.347 457.019 1.727.978 455.528 1.755.615
Source: EUMOFA Bilateral trade.
10
https://www.lanacion.com.ar/economia/adios-al-pais-del-asado-la-pesca-se-consolida-como-un-mayor-generador-de-divisas-que-la-
carne-nid1988712
11
https://www.undercurrentnews.com/2019/07/01/argentinas-seafood-sector-receives-boost-as-eu-approves-mercosur-trade-deal/
4
European Market Observatory
                                                                                                       FISHERIES AND AQUACULTURE IN ARGENTINA
                for Fisheries and Aquaculture Products

                Table 5.     EXPORTS FROM ARGENTINA BY TRADE PARTNER (volume in tonnes, value in 1000 EUR)

                   2013                              2014                        2015                        2016                    2017                     2018
    Trade
                   Volume            Value           Volume      Value           Volume      Value           Volume      Value       Volume     Value         Volume        Value
    partner
    Spain          99.175            315.785         104.769     345.531         91.487      355.796         99.269      433.721     89.655     412.895       89.707        412.421
    China          65.645            101.427         60.194      101.296         74.336      185.103         65.677      242.811     66.550     252.778       100.822       400.625
    Italy          26.205            91.520          24.428      95.495          22.165      90.160          26.011      122.611     25.998     119.445       28.926        155.411
    United
                   22.115            81.211          23.190      99.910          23.534      120.632         21.345      132.769     21.999     152.666       19.488        121.944
    States
    Japan          28.446            105.209         22.162      68.364          26.487      94.725          20.978      91.653      28.236     129.749       21.110        89.110
    Brazil         37.841            83.528          38.543      87.199          28.518      77.944          27.645      68.783      38.312     93.850        30.734        77.622

    Thailand       8.576             15.161          14.918      20.412          8.046       17.612          5.863       30.653      10.883     50.515        11.444        55.099

    Peru           941               1.522           2.011       5.219           2.794       12.344          2.337       13.672      6.692      37.875        9.965         52.910
    Russia         5.956             15.437          8.803       23.437          7.114       15.987          13.225      25.810      16.911     46.180        15.342        50.565
    Korea, South 11.531              18.432          15.823      24.295          17.960      31.300          13.425      31.461      14.807     39.761        14.402        42.650
    France         6.704             26.052          6.773       30.038          6.144       27.867          4.047       17.189      6.496      51.321        6.560         42.001
    Vietnam        6.646             14.039          7.509       38.242          6.438       32.038          14.740      52.371      12.688     77.027        9.243         41.302
    Other          160.144           235.736         145.691     240.400         124.637     229.975         112.193     255.843     117.793    263.916       97.750        213.892
    Total          479.925           1.105.060       474.815     1.179.838       439.660     1.291.483       426.756     1.519.347   457.019    1.727.978     455.495       1.755.552
   Source: EUMOFA Bilateral trade.

                          EU imports from Argentina
                The volume of EU imports of main commercial species from Argentina has decreased in the past five years. In 2018, import
                volume was 134.185 tonnes, a 5% decrease from 2017 and a 15% decrease from 2013. In terms of value, imports
                decreased 3% from 2017 and increased 18% from 2013.

                The three main species imported into the EU from Argentina are shrimp, hake and squid. Together they constituted 93% of
                the volumes and values in 2018. Imports of shrimp increased 42% in terms of volume and 57% in terms of value from
                2013 to 2018. Hake imports decreased 28% in volume and 25% in value during the same period, and squid decreased 56%
                in volume and 26% in value from 2013 to 2018.

                In 2018, 98% of seafood imports from Argentina were frozen products.

                Table 6.     EU IMPORTS OF MAIN COMMERCIAL SPECIES FROM ARGENTINA (volume in tonnes, value in EUR 1000)
                  2013                         2014                        2015                        2016                        2017                     2018
Main
commercial        Volume       Value           Volume         Value        Volume         Value        Volume          Value       Volume      Value        Volume      Value
species
Shrimp,
                  56.974       320.582         64.432         380.832      70.959         433.189      78.311          463.755     80.503      482.362      81.169      503.344
miscellaneous
Hake              36.569       90.090          33.971         81.174       30.142         86.309       33.454          90.856      28.862      75.318       26.177      67.926

Squid             39.325       78.195          32.282         48.153       26.372         38.818       18.397          45.267      19.793      63.809       17.243      57.673

Scallop           3.274        22.755          3.042          24.344       3.056          32.833       3.486           37.432      3.083       41.958       1.938       22.554
Other
                  5.945        13.678          4.658          10.309       4.251          10.553       4.063           8.743       3.817       9.408        2.443       6.854
groundfish
Anchovy           4.286        9.494           3.201          7.448        3.956          13.061       2.705           8.650       1.998       6.496        2.442       6.757
Other
                  4.654        12.988          2.562          6.861        1.805          4.677        1.980           5.095       2.041       5.603        1.901       4.557
marine fish
Cusk-eel          575          2.131           459            1.709        550            2.151        351             1.305       376         1.333        222         824

Other             5.966        19.906          2.630          12.324       874            3.229        907             2.895       1.249       4.577        650         2.379

Total             157.568      569.820         147.236        573.154      141.965        624.819      143.655         663.999     141.720     690.863      134.185     672.867
 Source: EUMOFA.

                                                                                                                                                                        5
European Market Observatory
                                                                                                 FISHERIES AND AQUACULTURE IN ARGENTINA
            for Fisheries and Aquaculture Products

            Table 7.          IMPORTS BY PRESERVATION STATE (volume in tonnes, value in EUR 1000)

                        2013                     2014                       2015                          2016                   2017                   2018

 Preservation           Volume    Value          Volume         Value       Volume      Value             Volume      Value      Volume    Value        Volume    Value

 Frozen                 147.390   531.292        140.714        539.197     808.308     3.466.004         137.215     616.703    139.072   680.429      131.443   664.336

 Salted                 3.370     7.297          3.062          7.192       21.734      70.670            2.700       8.639      1.906     5.841        2.223     5.651

 Prepared               475       1.828          117            422         1.307       6.452             38          294        122       911          286       1.779

 Unspecified            6.038     27.532         3.246          25.864      19.170      200.714           3.655       38.165     517       3.129        211       997

 Other                  296       1.871          97             479         179         641               47          199        104       552          23        104

 Total                  157.568   569.820        147.236        573.154     850.698     3.744.481         143.655     663.999    141.720   690.863      134.185   672.867
Source: EUMOFA.

                         Import prices
                                                                                                      The average price of frozen hake imported into the EU
             Figure 3.          EU IMPORT PRICE OF FROZEN HAKE FROM
                                                                                                      from Argentina in 2018 was 2,07 EUR/kg. This was a
                                ARGENTINA
                                                                                                      slight decrease from 2017 (-1%). During January–
                        3,5                                                                           April 2019 average import price was 3% greater than
                                                                                                      the same period of the previous year.
                        3,0

                        2,5
               EUR/kg

                        2,0

                        1,5

                        1,0

                                          2017           2018            2019

             Source: EUMOFA.

             The average price of frozen shrimp imported into the
             EU from Argentina in 2018 was 6,61 EUR/kg. This was                      Figure 4.         EU IMPORT PRICE OF FROZEN SHRIMP FROM
             a 1% increase from 2017. During January–April 2019                                         ARGENTINA
             average import price was 9% greater, at 6,88 EUR/kg,
             than the same period of the previous year.                                         8,5

                                                                                                8,0

                                                                                                7,5
                                                                                       EUR/kg

                                                                                                7,0

                                                                                                6,5

                                                                                                6,0

                                                                                                5,5

                                                                                                5,0

                                                                                                               2017             2018             2019
                                                                                      Source: EUMOFA.

                                                                                                                                                                  6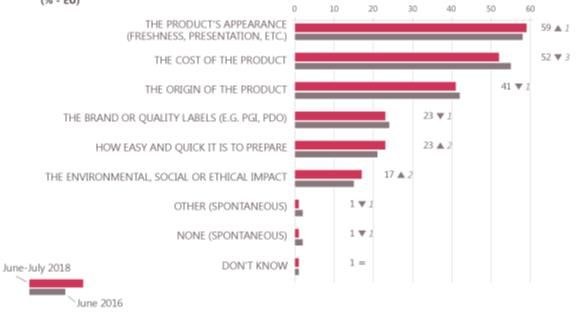
European Market Observatory
                                                                                     FISHERIES AND AQUACULTURE IN ARGENTINA
            for Fisheries and Aquaculture Products

                                                                                      The price of frozen squid imported into the EU from
              Figure 5.          EU IMPORT PRICE OF FROZEN SQUID FROM                 Argentina in 2018 was 2,91 EUR/kg, the same as the
                                 ARGENTINA                                            year before. During January–April 2019, the average
                                                                                      import price was 31% greater, reaching 3,27 EUR/kg,
                          5,0                                                         than the same period of the previous year.
                          4,5
                          4,0
                          3,5
                 EUR/kg

                          3,0
                          2,5
                          2,0
                          1,5
                          1,0

                                    2017      2018         2019
              Source: EUMOFA
              .
            On June 28, 2019, the EU and Mercosur (a trade bloc comprising Argentina, Brazil, Paraguay and Uruguay) reached a free
            trade agreement (FTA). The agreement has not yet entered into force and consequently, details involving seafood have not
            yet been revealed. Even though Argentine hake and Argentine shrimp are species implemented in the EU Autonomous Tariff
            Quotas (ATQ), the FTA most probably will have short-term impact on Argentine exports to the EU, as exports to the EU
            exceed by far the tariff free quotes in the ATQ set for 2019 and 2020.

                           Consumption
            In 2018, the per capita consumption of seafood in Argentina was 7,9 kg, down from 8,4 kg in 201712. The fisheries sector
            in Argentina is reliant on international trade, as only 10% of their seafood is consumed domestically 13. The Argentinian
            government started a campaign in 2018 to increase domestic consumption of seafood. The campaign aims to increase
            awareness of both the importance of the fisheries industry and the health benefits of eating seafood 14. The most popular
            species for consumption are hake and squid, and the consumption of trout from aquaculture is increasing 15. From 2013 to
            2018, Argentine seafood imports varied from 27.000 to nearly 48.000 tonnes a year. In 2018, imports amounted to 47.495
            tonnes valued at EUR 184 million. Tuna is the most significant import species, amounting to 18.155 tonnes valued at EUR
            78 million in 2018. This mainly comprised canned tuna products from Ecuador and Thailand. Salmon is the second most
            imported species in terms of value, amounting to 7.883 tonnes valued at EUR 48 million in 2018. This is mainly fresh salmon
            from Chile. 'Other marine fish' consists of different prepared and preserved fish products, mainly from Thailand and Ecuador

            Table 8.            ARGENTINE IMPORTS OF FISHERY AND AQUACULTURE PRODUCTS (volume in tonnes, value in EUR 1000)

                    2013                    2014                  2015               2016                2017                 2018
 Main
 commercial         Volume         Value    Volume   Value        Volume   Value     Volume    Value     Volume    Value      Volume    Value
 species
 Tuna,
                    13.091         58.301   11.009   42.128       15.279   57.173    15.447    58.634    16.536    70.141     18.155    78.207
 miscellaneous
 Salmon             6.726          34.887   6.636    35.270       8.413    44.327    7.528     49.535    8.265     58.021     7.883     48.510
 Other marine
                    13.191         29.520   10.511   20.589       141      744       14.465    25.408    14.473    28.986     13.453    29.298
 fish
 Shrimp,
                    654            4.056    533      3.515        228      1.522     864       5.990     816       5.761      1.151     7.413
 miscellaneous
 Other
                    554            832      341      705          358      806       518       1.475     765       2.629      1.166     4.076
 cephalopods
 Octopus            458            2.494    408      2.109        476      2.781     581       3.433     469       3.669      391       3.531
 Other              4.705          12.409   4.314    10.742       2.507    6.727     6.379     18.159    6.370     19.039     5.296     13.811
 Total            39.380        142.499     33.752   115.057      27.403   114.079   45.781    162.633   47.693    188.245    47.495    184.845
Source: EUMOFA Bilateral trade.

            12
               https://www.cronista.com/apertura-negocio/empresas/Cayo-un-48-el-consumo-per-capita-de-pescado-en-2018-20190204-0010.html
            13
               https://seafood-tip.com/sourcing-intelligence/countries/argentina
            14
               https://www.infobae.com/campo/2018/08/01/al-menos-una-vez-al-mes-la-iniciativa-para-que-los-argentinos-coman-mas-pescado
            15
               https://www.cronista.com/negocios/Como-los-noquis-el-pescado-tendra-su-dia-pero-sera-el-19-de-cada-mes-20180719-0103.html
                                                                                                                                            7
European Market Observatory EU CONSUMER HABITS REGARDING
for Fisheries and Aquaculture Products FISHERY AND AQUACULTURE PRODUCTS
2 EU consumer habits regarding fishery and aquaculture products
The latest Eurobarometer survey on EU consumer choices regarding fishery and aquaculture products16 (FAPs) shows that
more than four out of ten Europeans eat seafood at least once a week at home. Price is the main barrier to increased
consumption. Regional, national and EU products in general benefit from a very strong consumer preference.
This survey was carried out for the European Commission between 23 rd of June and 6th of July 2018. A total of 27.734 EU
citizens from the 28 Member States, from different social and demographic backgrounds, were interviewed face-to-face at
home and in their native language. This special Eurobarometer survey is the second on this topic, repeating questions first
asked in a survey conducted in June 2016. It aims to improve understanding of the EU internal market for FAPs.
Frequency of consumption
One of the main findings of the Eurobarometer survey is that the majority of Europeans eat FAPs at least once a month:
the majority at home (70%) and fewer in restaurants (32%).
Moreover, the comparison to the 2016 survey, shows only minor changes in the proportion of respondents in the majority
of countries who say they eat FAPs at least once a month (–2 percentage points in total).
Figure 1. HOW FREQUENTLY RESPONDENTS EAT FISHERIES OR AQUACULTURE PRODUCTS AT LEAST ONCE A MONTH
(%) – EVOLUTION COMPARED TO THE 2016 SURVEY
Source: Eurobarometer.
Analysis at country level shows that in 23 out of 28 Member States, an absolute majority of respondents buy FAPs at least
once a month. Overall, respondents from countries surrounded by water and by more numerous and diversified places of
sale, are more likely to eat FAPs at least once a month, compared with those from land-locked countries. For example,
respondents in Hungary (28%) are much less likely than those in Spain (92%) to eat these products at least once a month.
16
http://ec.europa.eu/commfrontoffice/publicopinion/index.cfm/survey/getsurveydetail/instruments/special/surveyky/2206
8European Market Observatory EU CONSUMER HABITS REGARDING
for Fisheries and Aquaculture Products FISHERY AND AQUACULTURE PRODUCTS
Figure 2. HOW FREQUENTLY RESPONDENTS BUY FISHERIES AND AQUACULTURE PRODUCTS (%)
Source: Eurobarometer.
At country level, the correlation between the share of respondents eating FAPs at least once a week and the annual
consumption per capita is relatively obvious. We can see that very few differences exist between the yearly average
consumption per capita ranking (top five including Portugal, Spain, Luxembourg, Malta, and France) and the share of
respondents eating FAPs at least once a week.
Figure 3. RELATIONSHIP BETWEEN ANNUAL PER CAPITA CONSUMPTION (2016) AND SHARE OF REGULAR BUYERS
(AT LEAST ONCE A WEEK)
90%
Share of respondents eating FAPs at least
80% ES
70% SE
UK PT
60% FI DK
EE ELNL FR LU
once a week
50% CY MT
IE LV
40%
DE LT BE IT
30% PL HR
RO
BG SI AT
20% SK
CZ
10% HU
0%
0 10 20 30 40 50 60
Annual consumption of FAPs per capita (kg)
Source: EUMOFA elaboration from Eurobarometer data.
However, the share of non-consumer is not clearly related with the level of consumption per capita. Specifically, in the UK,
Ireland and Malta, the share of respondents declaring they never eat FAPs is very high compared to the average level and
frequency of consumption. This highlights significant heterogeneity in consumption of FAPs among consumers in these
countries.
9European Market Observatory EU CONSUMER HABITS REGARDING
for Fisheries and Aquaculture Products FISHERY AND AQUACULTURE PRODUCTS
Figure 4. SHARES OF REGULAR CONSUMERS AND SHARE OF NON-CONSUMERS BY MEMBER STATE
80
60
Share of respondents (%)
40
20
0
-20
-40
At least once a week Never
Source: EUMOFA elaboration from Eurobarometer data. Countries are ranked in descending order according to the share of respondents saying they never eat
FAPs.
Moreover, the Eurobarometer study highlights several findings in terms of socio-demographic trends among respondents
Women are slightly more likely than men to buy FAPs at least once a month (67% vs. 63%).
People aged 15–24 are less likely than older people to buy FAPs at least once a month (43% vs.
64%–70%).
Respondents with higher levels of education are more likely to buy FAPs on a regular basis than those who finished
their education at an earlier age.
Households of two members are more likely to buy FAPs at least once a month compared to larger or smaller
households (69% vs. 64%).
Place of purchase and types of products
According to the Eurobarometer survey, grocery store, supermarket or hypermarket are the most common place for buying
FAPs (77% of respondents). Then comes fishmonger or specialist shop (42%), and to a lesser extent street markets (14%),
and directly from the producer (8%).
In addition, the analysis of the relationship between
Figure 5. RELATIONSHIP BETWEEN PLACE OF PURCHASE age of the consumers and their place of purchase for
(MULTIPLE CHOICE QUESTION) AND AGE OF fish products shows that:
CONSUMERS Respondents aged 55-74 are more likely to
buy their fish products at a street market or
100% directly from the producer than younger
respondents.
80% Respondents aged 35-44 and those aged
60%
65-74 are more likely to go to the
fishmonger to buy fish products than other
40% age groups, especially younger age groups.
The youngest consumers (aged 15-34) are
20% more likely to buy their fish products at
supermarkets or grocery stores than older
0%
15-24 25-34 35-44 45-54 55-64 65-74 75+ consumers.
At a street market
At a fishmonger, a fishmonger’s stall in a market hall or a specialist store
At the grocery store, supermarket or hypermarket
At a fish farm or at the fish harbour/ fish auction or from the fisherman
Source: EUMOFA elaboration from Eurobarometer data.
Preferences in terms of type of product and presentation are stable compared to the 2016 survey.
10European Market Observatory EU CONSUMER HABITS REGARDING
for Fisheries and Aquaculture Products FISHERY AND AQUACULTURE PRODUCTS
Concerning preferences in terms of preservation state, more than two thirds of respondents buy frozen (68%) or fresh
products (67%), and over six in ten buy canned products (64%) ‘at least from time to time’, whilst a smaller proportion say
they buy smoked, salted, dried or in brine products (51%) 'at least from time to time'. The majority of respondents (58%)
say they rarely or never buy breaded products or ready-to-eat meals based on FAPs.
In terms of relationship between place of purchase and preservation state of products, respondents who buy frozen products
are more likely to do so at a grocery store, supermarket or hypermarket (73%), or an online shop (72%), while those who
buy fresh products are more likely to do so at a fish farm or at the fish harbour/ fish auction or from a fisherman (83%), at
a fishmonger or a specialist store (81%) or at a street market (79%).
Concerning presentation state, more than two thirds of respondents say they buy loose products (68%) and pre-packed
products (66%) ‘at least from time to time’. Half of respondents prefer filleted products (50%) and four in ten prefer
products that have been cleaned (40%), while more than a quarter prefer whole products (27%).
In terms of relationship between place of purchase and presentation state, respondents who buy whole products are more
likely than those who buy cleaned products or fillets to buy at the fishmonger or specialist store (55% vs. 47% and 39%,
respectively), and less likely to buy at the grocery store, supermarket or hypermarket (68% vs. 78% and 83%). In four
countries – Greece, Romania, Croatia, and Cyprus – ‘whole products’ is the most popular response.
It is interesting to analyse this relationship by country, looking at the correlation between the share of respondents buying
their fish at fishmongers and the share of consumers buying fresh/live fish products. The correlation is relatively obvious,
with “Mediterranean/Southern” countries with a high preference for fresh products and fishmongers (Greece, Spain, Malta,
Portugal, Cyprus) and landlocked/Central and Eastern countries (except RO) with low share of consumers going to the
fishmonger and buying fresh products (Slovakia, Czech Republic, Austria, Poland, Germany).
Figure 6. RELATIONSHIP BETWEEN SHARE OF RESPONDENTS BUYING THEIR FISH AT FISHMONGERS AND SHARE OF
CONSUMERS BUYING FRESH/LIVE PRODUCTS
80% MT
Share of respondents buying their fish at
70% IT EL
ES
BG HR
60% NL
LV DK
PT
50% LTHU
fihmongers
EU28
EE
40% DE PL BE
SI FR
RO IE
CY
AT SE
LU
30%
CZ UK FI
20% SK
10%
0%
0% 10% 20% 30% 40% 50% 60% 70% 80%
Share of consumers buying fresh/live products
Source: EUMOFA elaboration from Eurobarometer data.
11European Market Observatory EU CONSUMER HABITS REGARDING
for Fisheries and Aquaculture Products FISHERY AND AQUACULTURE PRODUCTS
Consumption drivers and non-consumption factors
According to the Eurobarometer survey, the reason EU consumers buy or eat FAPs is because they are healthy and taste
good.
A majority of respondents who buy or eat FAPs say they buy these products because ‘they are healthy’ (74%)
and ‘they taste good’ (59%). These are the two most important reasons in all EU countries.
The main reason given for not eating FAPs by those who never eat them is that they do not like their taste,
smell or appearance (49%). This is the reason most frequently mentioned in most EU countries.
When purchasing FAPs, products’ appearance and price are the most important criteria.
The two main aspects mentioned by the majority of respondents as the most important when buying FAPs
are the product’s appearance (59%) and the cost of the product (52%). The origin of the product is the third
most frequently mentioned aspect (41%).
Figure 7. MOST IMPORTANT ASPECTS WHEN RESPONDENTS BUY FISHERIES AND AQUACULTURE PRODUCTS (MAX. 3
ANSWERS) (% - EU)
Source: Eurobarometer.
The main barrier for EU consumers to increase their consumption of FAPs in the price.
70% respondents who buy or eat FAPs agree they would buy or eat more seafood if the price was not so
high.
Over half of these respondents (53%) say they would buy or eat more seafood if the choice and points of
sale were more diversified.
A relative majority of Europeans prefer wild to farmed products, and sea to freshwater products.
More than a third of the respondents who buy or eat FAPs prefer wild products (35%) while less than one in
ten (9%) say they prefer farmed products. Nearly a third (32%) say they have no preference.
Products coming from the sea are preferred by just over four in ten (42%), compared with less than one in
ten who prefer freshwater products (8%). Again, there is a large proportion of respondents who do not have
a preference for either sea or freshwater products (33%).
Most EU consumers prefer products from their own country or region.
Over a third of respondents who buy or eat FAPs prefer products from their own country (37%), followed by
products from their own region (28%), and products from the EU (16%).
Only a quarter of respondents (24%) say they don’t really have a preference as to where the products are
from.
12European Market Observatory
THE EU FISH PROCESSING INDUSTRY
for Fisheries and Aquaculture Products
3 The EU fish processing industry
This case study focuses on the importance of micro and small companies in the EU fish processing industry and is based
on the Joint Research Centre’s (JRC) report on “The Economic Performance of the EU fish processing sector 2017” 17.
For the purpose of this case study, micro enterprises are enterprises with less than 10 persons employed, small enterprises
with 10 to 49 persons employed, medium-sized enterprises with 50 to 249 persons employed, large enterprises with 250
or more persons employed. Small and medium-sized enterprises (SMEs) are enterprises having less than 250 persons
employed.
Micro and small enterprises represent 86% of the total number of fish and seafood processing companies in the EU. They
provide 28% of the total number of jobs and of the total income generated by the sector.
Number of companies
The total number of enterprises in the EU fish
Figure 1. NUMBER OF ENTERPRISES IN THE EU FISH PROCESSING processing industry was 3.601 in 2015 (3.827
SECTOR IN 2015 including landlocked countries18), of which 86% are
micro companies and small companies. Over the
period 2008–2015, the number of micro-
enterprises has increased by 13%, being the only
≤ 10 employees size category showing a growth.
10-49
employees
50-249
employees
≥ 250
employees
Source: JRC.
Table 1. EVOLUTION OF THE NUMBER OF ENTERPRISES BETWEEN 2008–2015
Trend
Size category 2008 2009 2010 2011 2012 2013 2014 2015
2008–2015
Micro
1.829 1.807 1.854 1.858 1.891 2.102 1.970 2.064 + 13%
≤ 10 employees
Small
11-49 1.146 1.186 1.162 1.087 1.114 1.124 1.106 1.033 - 10%
employees
Medium
50-249 475 435 432 440 451 438 443 427 - 10%
employees
Large
≥ 250 80 75 76 76 78 77 81 77 - 4%
employees
Total enterprises 3.530 3.503 3.524 3.461 3.534 3.741 3.600 3.601 + 2%
Source: JRC.
Large companies exist in only nine Member States, with four of them (France, the UK, Poland and Spain) accounting for 69%
of the total number of large enterprises. In three Member States (Cyprus, Finland, and Malta) only micro and small companies
are present.
17
https://stecf.jrc.ec.europa.eu/reports/economic/-
/asset_publisher/d7Ie/document/id/2108729?inheritRedirect=false&redirect=https%3A%2F%2Fstecf.jrc.ec.europa.eu%3A443%2Freport
s%2Feconomic%3Fp_p_id%3D101_INSTANCE_d7Ie%26p_p_lifecycle%3D0%26p_p_state%3Dnormal%26p_p_mode%3Dview%26p_p
_col_id%3Dcolumn-2%26p_p_col_pos%3D1%26p_p_col_count%3D2
18
Landlocked countries are Austria, Czechia, Hungary and Slovakia.
13European Market Observatory
THE EU FISH PROCESSING INDUSTRY
for Fisheries and Aquaculture Products
Table 2. NUMBER OF ENTERPRISES BY MEMBER STATE IN 2015
Medium
Small companies
Micro companies companies Large companies
Country/Size category 11-49 Total enterprises
≤ 10 employees 50-249 ≥ 250 employees
employees
employees
Belgium 37 26 3 0 66
Bulgaria 11 24 10 0 45
Croatia 18 3 13 1 35
Cyprus 2 0 0 0 2
Denmark 54 31 23 0 108
Estonia 31 23 10 0 64
Finland 113 23 0 0 136
France 111 127 36 17 291
Germany 164 54 22 8 248
Greece 112 29 4 0 145
Ireland 92 47 22 0 161
Italy 447 112 18 0 577
Latvia 59 36 15 4 114
Lithuania 20 12 12 7 51
Malta 3 2 0 0 5
Netherlands 0 66 15 0 81
Poland 52 68 53 12 185
Portugal 63 51 39 4 157
Romania 1 4 3 0 8
Slovenia 7 3 2 0 12
Spain 320 196 71 11 598
Sweden 183 33 8 0 224
UK 166 129 63 13 371
Total enterprises 2.066 1.099 442 77 3.684
Source: JRC.
Employment
The total number of employees in the EU fish processing sector was 126.413 or 20% fewer than direct employment created
by the EU fleet in the same year. This includes the number of employees in countries for which data by size category is not
available (i.e. Estonia, France, Germany, and the Netherlands) 19.
Employment was relatively stable between 2008 and 2015, while the average wage increased by 22%. Over the same
period, labour productivity, measured as gross value added (GVA) per FTE20, decreased by 8%, in relation with the decrease
of the GVA, which can be partly explained by the significant increase (+28%) of the cost for purchase of fish and other raw
materials.
Micro and small companies provide 28% of the total number of jobs, while medium and large enterprises provide 41% and
31% of jobs, respectively. The countries, for which data by size category are not available, are not included in this calculation
(table below).
19
The JRC report is based on data collected under the Data Collection Framework (DCF) of the EU.
The Member States were requested to provide economic data by size category. They delivered these data for the period 2008-2015,
with the following exceptions: Cyprus, Estonia, Germany did not provide data segmented by size category. France delivered data by size
category from 2008 to 2013, but not for 2014 and 2015.The Netherlands did not deliver data for 2015.
20
Full time equivalent.
14European Market Observatory
THE EU FISH PROCESSING INDUSTRY
for Fisheries and Aquaculture Products
Table 3. NUMBER OF EMPLOYEES BY MEMBER STATES IN 2015
Medium
Micro Small companies
companies Large companies
Country/Size category companies 11-49 Total employees
50-249 ≥ 250 employees
≤ 10 employees employees
employees
Belgium 160 744 625 0 1.529
Bulgaria 75 722 1.110 0 1.907
Croatia 73 49 1.358 320 1.800
Cyprus 14 0 0 0 14
Denmark 173 822 2.619 0 3.614
Finland 229 775 0 0 1.004
Greece 561 749 752 0 2.062
Ireland 483 1.352 1.962 0 3.797
Italy 1.769 2.240 1.917 0 5.926
Latvia 138 934 1.847 1.250 4.169
Lithuania 48 337 1.557 3.431 5.373
Malta 30 52 0 0 82
Poland 254 1.468 6.846 9.175 17.743
Portugal 182 1.776 2.868 2.322 7.148
Romania 4 87 392 0 483
Slovenia 24 37 148 0 209
Spain 886 4.931 7.542 5.674 19.033
Sweden 346 685 1.140 0 2.171
UK 931 3.013 7.589 8.579 20.112
Total
6.380 20.773 40.272 30.751 98.176
number of employees
Source: JRC.
*Data are for Member States which provided data by size category.
The Member States where the percentage of
employees working in micro and small companies Figure 2. NUMBER OF EMPLOYEES IN 2015
is clearly below the EU average (27,7%) are
Croatia, Latvia, Lithuania, Poland, Romania and
the UK.
7%
Three Member States have employees only in the ≤ 10 employees
two smallest size categories (Cyprus, Finland, 31%
Malta). Concerning the Member States with higher 11-49
21%
level of activity, Italy and Greece have the highest employees
ratio of employees in micro and small enterprises
(68% and 64% of the total number of employees 50-249
in the country, respectively). employees
≥ 250
41% employees
Source: JRC.
15European Market Observatory
THE EU FISH PROCESSING INDUSTRY
for Fisheries and Aquaculture Products
The average annual wage was equal to EUR 30.133 per FTE21 in 2015, i.e. significantly more than the average wage in the
manufacture of food products (25.455 EUR/FTE according to Eurostat/SBS 22) and markedly less than the average wage in
the manufacturing sector in general (33.828 EUR/FTE).
In the countries for which data on size categories are available (covering 97.841 employees), the annual average wage
amounts to EUR 26.995 per employee and EUR 29.784 per FTE. The highest wages are paid in the intermediate size
categories, i.e. small and medium companies (27.040 and 26.571 EUR/FTE respectively), while the lowest wages are paid
at each end of the size category spectrum, in the micro (EUR 19.317) and large (EUR 21.835) companies.
Wages vary considerably from one MS to the other; the maximum wage, paid in Denmark (65.306 EUR/FTE), is 16 times
higher than the lowest one (3.974 EUR/FTE), paid in Romania. These divergences are not specific to the sector, they reflect
the general trend at EU level. Geographic situation influences much more wage disparity than companies’ sizes.
Income
The income generated by the EU fish processing industry amounted to EUR 30,3 billion in 2015, of which EUR 22,2 billion
in the Member States for which detailed data are available (table below).
The highest incomes are generated by the UK and Spanish industries.
Table 4. INCOME BY MEMBER STATE IN 2015 (value in EUR million)
Medium
Micro companies Small companies
companies Large companies
Country/Size category ≤ 10 11-49 All employees
50-249 ≥ 250 employees
employees employees
employees
UK 86,7 886,5 2.384,0 1.978,7 5.335,9
Spain 171,5 1.052,9 1.917,6 1.842,9 4.984,9
Denmark 99,4 533,4 1.934,3 0,0 2.567,1
Poland 26,8 199,7 728,9 1.578,0 2.533,4
Italy 371,0 873,2 1.021,1 0,0 2.265,3
Portugal 30,5 297,4 480,4 388,9 1.197,2
Ireland 34,1 281,4 445,3 0,0 760,8
Belgium 128,7 271,1 323,8 0,0 723,6
Lithuania 1,9 14,7 134,9 370,6 522,1
Sweden 84,4 194,8 238,2 0,0 517,4
Finland 28,7 273,1 0,0 0,0 301,8
Greece 39,3 94,6 107,0 0,0 240,9
Latvia 3,9 49,9 86,2 39,8 179,8
Bulgaria 16,6 38,0 37,2 0,0 91,8
Slovenia 2,2 4,1 19,7 0,0 26,0
Romania 0,1 1,8 22,3 0,0 24,2
Malta 8,8 13,9 0,0 0,0 22,7
Cyprus 0,4 0,0 0,0 0,0 0,4
Total Income 1.135,0 5.080,5 9.880,9 6.198,9 22.295,3
Source: JRC.
21
Full time equivalent.
22
Structural Business Statistics.
16European Market Observatory
THE EU FISH PROCESSING INDUSTRY
for Fisheries and Aquaculture Products
Micro and small companies generate 28% of the
Figure 3. EU FISH PROCESSING SECTOR INCOME IN 2015 total income.
Among the countries whose fish processing
industry generates more than EUR 500 million of
5% income, three draw more than half of their fish
≤ 10 employees processing income from micro and small
28% companies: Sweden (53,9%), Italy (54,9%) and
23% 11-49 Belgium (55,3%).
employees
50-249
employees
≥ 250
44% employees
Source: JRC
Production costs
The major cost item in fish processing is “the
purchase of fish and other raw materials”, which Figure 4. VALUE SHARE OF THE COST FOR PURCHASING FISH AND
represented 67,1% of the total costs in 2015. RAW MATERIALS OF THE TOTAL INCOME IN 2015
Wages and salaries represent 12,1% and other
operational costs and energy 17,6% and 2,7% 69,0
respectively.
67,0
An analysis made on the Member States, for
which detailed data by size category are available, 65,0
shows that the share of the raw materials cost in 63,0
the total income is slightly increasing when the
size of the company increases: it is 66,5% in the 61,0
micro and small enterprises, and rises to 67,0% in
59,0
the medium-sized companies and 67,6% in the
large companies. Due to the high variations in 57,0
wages between MS, it is difficult to draw
conclusions from the slight differences observed. 55,0
Two elements may anyhow partly explain these ≤ 10 employees 11-49 employees
differences: 50-249 employees ≥ 250 employees
- it is likely that large companies make use of Source: JRC.
more efficient processing equipment and that
processing is more automatized reducing the
share of labour costs;
- as indicated above, the level of salaries is
substantially lower in large companies.
Micro and small companies accounted for 28% of
all purchases of fish and other raw materials
made by the EU fish processing industry in 2015,
while medium and large-sized companies
accounted for 44% and 28%, respectively.
17European Market Observatory
THE EU FISH PROCESSING INDUSTRY
for Fisheries and Aquaculture Products
Economic performance and productivity
The UK fish processing industry generated the
Figure 5. EU FISH PROCESSING SECTOR TOTAL GROSS VALUE highest gross added value (GVA) in absolute terms
ADDED (GVA) IN 2015 in 2015, followed by France (not shown in the table
below, as no detailed data by size category are
available) and Spain.
7% The UK is also at the first rank for large companies
≤ 10 employees
(preceding Spain and Portugal) and for medium
companies (preceding Spain and Denmark), but only
30% 11-49 at the second rank behind Spain for small
20%
employees companies and at the fourth rank for micro
companies (behind Belgium, Italy and Spain).
50-249
Among the countries for which data could be
employees
calculated, the UK industry generated the highest
43% ≥ 250 net profit in absolute terms in 2015 (36,3% of the
employees estimated total), followed by the French (19,4%)
and Belgian (9,5%). The productivity (value added
Source: JRC. per employee) is the highest in the medium-sized
category (EUR 47.903 in 2015), followed by micro
enterprises (EUR 45.965), small enterprises (EUR
42.144) and large companies (EUR 41.845).
Table 5. GROSS VALUE ADDED BY MEMBER STATE AND BY SIZE CATEGORY in 2015 (value in EUR million)
Medium
Micro companies Small companies
companies Large companies
Country/Size category ≤ 10 11-49 All employees
50-249 ≥ 250 employees
employees employees
employees
UK 27,3 159,2 468,5 628,3 1.283,3
Spain 27,7 197,0 418,7 233,9 877,3
Portugal 10,6 102,9 166,3 134,6 414,4
Poland 5,0 30,3 114,5 215,3 365,1
Denmark 11,1 65,2 280,4 0,0 356,7
Italy 52,6 101,7 145,0 0,0 299,3
Belgium 114,0 52,6 40,6 0,0 207,2
Ireland 2,5 47,8 70,3 0,0 120,6
Lithuania 0,4 3,8 32,8 50,3 87,3
Sweden 17,0 31,9 34,9 0,0 83,8
Greece 7,3 12,4 31,6 0,0 51,3
Finland 6,3 38,1 0,0 0,0 44,4
Bulgaria 5,9 17,3 19,3 0,0 42,5
Latvia 0,8 11,4 18,7 11,0 41,9
Romania 0,0 0,6 21,0 0,0 21,6
Slovenia 0,6 0,4 1,5 0,0 2,5
Malta 0,4 0,8 0,0 0,0 1,2
Cyprus 0,4 0,0 0,0 0,0 0,4
Total GVA 289,9 873,4 1.864,1 1.273,4 4.300,8
Source: JRC.
18European Market Observatory
THE EU FISH PROCESSING INDUSTRY
for Fisheries and Aquaculture Products
Outlook
SMEs are often referred to as the backbone of the European economy, providing a potential source for jobs and economic
growth.
This is also the case in the EU fish processing industry, where micro and small companies (enterprises with less than 50
people employed) generated an income of EUR 8,5 billion and a gross value added of EUR 1,65 billion, providing 35.000
jobs in 201523.
The incompleteness of the collection of data disaggregated by size categories under the EU Data Collection Framework
precludes the drawing of robust and targeted conclusions. However, geographical distribution and size of the country appear
to be influencing factors, more important than size of the companies.
In addition to some of the less populated Member States (Cyprus, Finland, Malta), which have only micro and small
companies in the fish processing sector, a few other Member States draw the biggest part of their income through micro
and small companies, e.g. Belgium, Bulgaria, Greece, Italy, and Sweden.
Micro and small companies’ share in the income and GVA generated by the sector has decreased over the period 2008–
2015, but the number of micro enterprises has increased by 13%, being the only size category showing growth. Micro and
small enterprises retain a crucial role in the fish processing economy in most Member States.
23
To achieve these results, we applied the ratios to the entire EU fish processing sector calculated for the Member States for which data
by size category were available (and representing 78% of the sector in terms of jobs).
19European Market Observatory
THE IRISH SEAFOOD SECTOR
for Fisheries and Aquaculture Products
4 The Irish seafood sector
Introduction
Ireland is part of an island in the North Atlantic which belongs
geographically to Western Europe. The island’s governance is
divided between Ireland and Northern Ireland (the United
Kingdom). Ireland accounts for roughly five-sixths of the island or
70.280 km2 with a coastline of 1.448 km24 and territorial seas of
12 nm and EEZ 200 nm. Approximately 4,85 million people live in
Ireland today25.
The country’s long coastline close to some of the most productive
fishing grounds in the EU gives Ireland a natural advantage in the
development of the seafood industry. Consequently, the seafood
industry plays a vital role in the economy and has shown growth
over the past few years.
Source: Lonely Planet.
In 2017, the seafood industry contributed EUR 1,15 billion to the Irish economy, a 6,4% increase from 2016 26. The growth
has mainly been driven by increased export values and increased aquaculture production 27.
In 2017, the total value of landings and aquaculture production increased by 12% to EUR 609 million relative to 2016.
Volume size increased by a similar margin, growing by 11% to 361.000 tonnes 28 compared to 2016. The growth was linked
to a 14% volume and a 35% value increase in aquaculture production. On the other hand, fisheries landing volume and
value decreased by 1% and 27% respectively. Wild-caught fish constituted 66% in value (EUR 401 million) and 87% in
volume (314.000 tonnes) of total fisheries and aquaculture production29. Killybegs port recorded the highest value of
landings, with 192.000 tonnes valued at EUR 125 million, with Castletownbere as number two with 30.500 tonnes, valued
at EUR 108 million30.
Of the 4,8 million citizens in Ireland, around 9.300 are directly employed in the seafood sector. Of these, 3.360 are employed
in fisheries, 1.900 in aquaculture and close to 4.000 people in the processing industry 31.
24
https://webgate.ec.europa.eu/fpfis/cms/farnet2/on-the-ground/country-factsheets/irish-clld-programme_en#group-factsheet-content
25
https://www.worldometers.info/world-population/ireland-population/
26
BIM-Business-of-Seafood-2017.
27
BIM-Business-of-Seafood-2017.
28
BIM-Business-of-Seafood-2017.
29
BIM-Business-of-Seafood-2017.
30
BIM-Business-of-Seafood-2017.
31
BIM-Business-of-Seafood-2017.
20European Market Observatory
THE IRISH SEAFOOD SECTOR
for Fisheries and Aquaculture Products
Fisheries
Since 2012, fisheries landings in Ireland has varied
Figure 1. FISHERIES LANDINGS IN IRELAND (volume in 1000 between 229.000 tonnes (2013) and 341.000 tonnes
tonnes, value in million EUR) (2012). The values of fisheries landings have
fluctuated from EUR 299 million (2013) to EUR 508
400 600 million (2014). In 2013, Ireland’s share of landed
volumes was 96%. Since then the Irish share has
350 decreased due to higher landings from UK and French
500
300 vessels. In 2016, the Irish share of EU landings
400 constituted 6% of total volumes and 7% of overall
250 values32.
million EUR
1.000 tonnes
200 300
150
200
100
100
50
0 0
Volume Value
Source: The Sea-FIsheries Protection Authority (SFPA).
In 2017, landings in Ireland decreased compared with 2016, totalling to 264.000 tonnes (–1%) worth EUR 353 million (–
27%).
The main reason behind the fall in landing value was overall fall unit values. The fall in unit values was caused by both
higher landing volumes and landing share of low value species (blue whiting and boarfish) and drop in unit values for top
landed species like blue whiting, horse mackerel and Atlantic herring.
Of all fish landed in Ireland, 68% or 179.000 tonnes were caught by Irish vessels, contributing to 52% of total value. The
value of fisheries products landed by the national fleet halved compared with 2016, totalling EUR 184 million. The top-
three landed species in terms of value by the Irish fleet were Atlantic mackerel, prawn and brown crab. Of the non-Irish
landings, 29% of the value originated from the UK fleet and 8% from the French fleet.
Atlantic mackerel is the most important fish species for
Figure 2. MAIN SPECIES CAUGHT BY IRISH VESSELS (volume the Irish fleet both in terms of volume and value. Over
in 1000 tonnes) the past four years catches have varied between 76.000
tonnes to nearly 90.000 tonnes annually. Blue whiting
250 catches increased every year since 2015 and reached
nearly 48.000 tonnes in 2018.
200 In 2018, the top three species in terms of volume
Atlantic mackerel, blue whiting and horse mackerel
constituted 75% of the total volumes landed by the Irish
1000 tonnes
150
fleet33.
100
50
0
2015 2016 2017 2018
Mackerel Blue whiting Horse mackerel
Boarfish Herring Norway lobster
Whiting Other
Source: https://www.gov.uk/government.
32
EUROSTAT, http://appsso.eurostat.ec.europa.eu/nui/show.do
33
https://www.gov.uk/government.
21European Market Observatory
THE IRISH SEAFOOD SECTOR
for Fisheries and Aquaculture Products
Table 1. LANDINGS OF FISHERIES PRODUCTS IN IRELAND BY VESSEL STATE (volume in 1000 tonnes, value in EUR million)
2012 2013 2014 2015 2016 2017e34
Landing
Volume Value Volume Value Volume Value Volume Value Volume Value Volume Value
nation
Ireland 234 299 221 283 242 444 205 214 196 370 179 184
United
20 23 4 10 7 12 13 16 21 27 51 102
Kingdom
France 11 27 1 1 8 27 14 47 19 50 14 28
Spain 6 14 1 2 7 21 8 28 12 31 11 21
Denmark 0 0 0 0 0 0 0 0 11 6 9 17
Germany 0 0 0 0 0 0 0 0 0 1 0 0
Other 69 33 3 2 7 4 4 3 7 2 0 0
Total 341 397 229 299 271 508 244 309 265 486 264 353
Source: EUROSTAT.
Aquaculture
Finfish (salmon and trout) and shellfish (mussels and oysters) dominate Irish aquaculture production. Ireland is the largest
producer of organic farmed salmon in the EU and the sector provides around 1.900 full and part-time jobs and consists of
284 production units (2017)35.
In 2010, Irish aquaculture production reached nearly 46.200 tonnes mainly due to the production volumes of salmon and
mussels. Production volumes decreased in the following years and ended at their lowest in 2014 (29 327 tonnes). Volumes
and values have showed a growth every year since 2014.
In 2016, Irish aquaculture production increased by 10% in terms of volume to 41.279 tonnes and 13% in terms of value to
EUR 154 million. The main driver was volume and value growth in the salmon and oyster industry. Production of salmon
increased by 24% to 16.300 tonnes constituting 39% of total volume and value increased by 16% to EUR 104 million
constituting 68% of total aquaculture value. Oyster production ended right above 8 000 tonnes in 2016 at a value of EUR
35 million. This represents increases volume and value of 7% and 15%, respectively, from 2015.
Table 2. AQUACULTURE PRODUCTION IN IRELAND (volume in tonnes, value in EUR million)
2010 2011 2012 2013 2014 2015 2016
Main commercial
Volume Value Volume Value Volume Value Volume Value Volume Value Volume Value Volume Value
species
Salmon 15.691 71 12.196 73 12.440 76 9.125 56 9.368 58 13.116 90 16.300 104
Oyster 7.162 21 7.937 30 7.560 37 8.640 40 7.569 35 7.478 31 8.016 35
Mussel 21.934 16 0 0 15.228 11 15.361 15 11.374 10 16.015 13 16.156 12
Trout 1.102 4 1.201 4 781 2 908 3 808 3 803 2 705 2
Scallop 59 0 50 0 43 0 37 0 26 0 50 0 33 0
Other freshwater
24 0 16 0 10 0 80 1 78 1 45 0 15 0
fish
Other molluscs and
aquatic 0 0 0 0 0 0 3 0 4 0 4 0 4 0
invertebrates
Other 217 1 22.890 18 80 1 83 0 100 0 70 0 50 0
Total 46.189 113 44.290 125 36.142 127 34.237 114 29.327 106 37.581 136 41.279 154
Source: EUMOFA.
In 2017, the aquaculture industry produced approximately 47.000 tonnes of seafood (a 14% increase from 2016). Value
reached EUR 208 million, a 35% increase from 201636. Like 2016, the fastest growing elements of the sector, both in terms
of volume and value, were the oyster and salmon farms. Low prices on the global market negatively affected the farmed
rope mussel industry, resulting in a 13% loss in harvest volume and a 18% decrease in value37.
In 2017, the volume of farmed salmon increased by 23% and the value climbed by 41% relative to 2016. The increase in
value was driven by strong demand for organic and non-organic salmon, and stability of volumes produced in Europe since
34
EUROSTAT, national estimates.
35
BIM-Business-of-Seafood-2017.
36
Ireland’s Seafood Development Agency.
37
http://www.bim.ie/media/bim/content/7097-BIM-Business-of-Seafood-2017.pdf
22You can also read