American Samoa Economic Forecast 2019
←
→
Page content transcription
If your browser does not render page correctly, please read the page content below
American Samoa
                         Economic Forecast
                               2019
       Average Annual Wage vs. Unemployment Rate

                                 Features

         Baseline and Alternative Forecasts for 2018 – 2022
FRBSF Article: Nonmanufacturing as an Engine of Growth by Huiyu Li

Lolo Matalasi Moliga, Governor              Keniseli Lafaele, Director
 American Samoa Government       American Samoa Department of Commerce
This page left blank intentionally
American Samoa
                        Economic
                         Forecast
                        2018-2022

          Territory of American Samoa
        LOLO MATALASI MOLIGA, Governor
    LEMANU PALEPOI SIALEGA MAUGA, Lieutenant Governor
      KENISELI LAFAELE, Director, Department of Commerce
     VAI FILIGA, Chief of Statistics, Department of Commerce
NATHANIEL CLAYVILLE, Senior Economist, Department of Commerce
Table of Contents Introduction ........................................................................................................................... 1 Executive Summary ................................................................................................................ 3 Pacific Region Economic Forecast Analysis .............................................................................. 6 Pacific Region Economic Summary .......................................................................................................... 6 Pacific Region Economic Forecast Tables............................................................................................... 11 United States of America Economic Forecast Analysis ........................................................... 13 US Economic Summary .......................................................................................................................... 13 US Economic Forecast Tables................................................................................................................. 19 American Samoa Economic Forecast Analysis ....................................................................... 21 American Samoa Economic Summary ................................................................................................... 21 American Samoa Economic Forecast Tables .......................................................................................... 28 Alternative Forecasts ............................................................................................................ 32 Low Economic Growth and High Oil Price Scenario ............................................................................... 32 High Economic Growth and Low Oil Price Scenario ............................................................................... 37 Feature Article: Nonmanufacturing as an Engine of Growth by Huiyu Li ................................ 42 ASEM: The American Samoa Economic Model ...................................................................... 48
Figures and Tables

Figures:

Figure I: Samoa Real GDP and Inflation Forecast ........................................................................... 7
Figure II: Tonga Real GDP and Inflation Forecast ........................................................................... 8
Figure III: Fiji Real GDP and Inflation Forecast................................................................................ 9
Figure IV: New Zealand Real GDP and Inflation Forecast ............................................................... 9
Figure V: Australia Real GDP and Inflation Forecast ..................................................................... 10
Figure VI: US Employment and Unemployment ........................................................................... 14
Figure VII: US Inflation .................................................................................................................. 15
Figure VIII: US Real Consumer Spending ...................................................................................... 16
Figure IX: US Real Government Spending..................................................................................... 17
Figure XI: Real US Imports ............................................................................................................ 18
Figure X: Real US Exports.............................................................................................................. 18
Figure XII: American Samoa Employment and Unemployment ................................................... 22
Figure XIII: American Samoa Wages and Income ......................................................................... 23
Figure XIV: American Samoa Inflation .......................................................................................... 24
Figure XV: American Samoa Consumer Spending ........................................................................ 25
Figure XVI: American Samoa Business Investment ...................................................................... 26
Figure XVII: American Samoa Government Spending .................................................................. 26
Figure XVIII: American Samoa Gross Domestic Product ............................................................... 27

Tables:

Table 1: American Samoa Economic Forecast Executive Summary Details ................................... 4
Table 2: US Economic Forecast Executive Summary Details .......................................................... 5
Table 3: Pacific Region Countries Real GDP Forecast ................................................................... 11
Table 4: Pacific Region Countries Inflation Forecast .................................................................... 12
Table 5: US Economic Forecast Details ......................................................................................... 19
Table 6: Other Economic Indicators Forecast Details ................................................................... 20
Table 7: American Samoa Economic Forecast Summary Details .................................................. 28
Table 8: American Samoa Nominal GDP Forecast Details ............................................................ 29
Table 9: American Samoa Real GDP Forecast Details ................................................................... 30
Table 10: American Samoa Employment Characteristics Forecast Details .................................. 31
Table 11: American Samoa Low Economic Growth Scenario Details ........................................... 33
Table 12: US Low Economic Growth Scenario Details .................................................................. 34
Table 13: American Samoa Low Economic Growth Scenario versus Baseline Scenario Details ... 35
Table 14: US Low Economic Growth Scenario versus Baseline Scenario Details .......................... 36
Table 15: American Samoa High Economic Growth Scenario Details .......................................... 38
Table 16: US High Economic Growth Scenario Details ................................................................. 39
Table 17: American Samoa High Economic Growth Scenario versus Baseline Scenario Details .. 40
Table 18: US High Economic Growth Scenario versus Baseline Scenario Details ......................... 41

ii
List of Acronyms and Abbreviations

AEO – Annual Energy Outlook
ASCA – American Samoa Code Annotated
ASEF – American Samoa Economic Forecast
ASEM – American Samoa Economic Model
BEA – US Bureau of Economic Analysis
CBO – US Congressional Budget Office
CPI – Consumer Price Index
EIA – Energy Information Administration
FEMA – US Federal Emergency Management Agency
GDP – Nominal Gross Domestic Product (Current Values)
IMF – International Monetary Fund
NIPA - National Income and Product Accounts
OLS – Ordinary Least Squares Statistical Method
OMB – US White House Office of Management and Budget
PICs – Pacific Island Countries
PPI – Producer Price Index
Real GDP – Real Gross Domestic Product (Inflation-adjusted Values)
STP – Samoa Tuna Processors
US – United States

iii
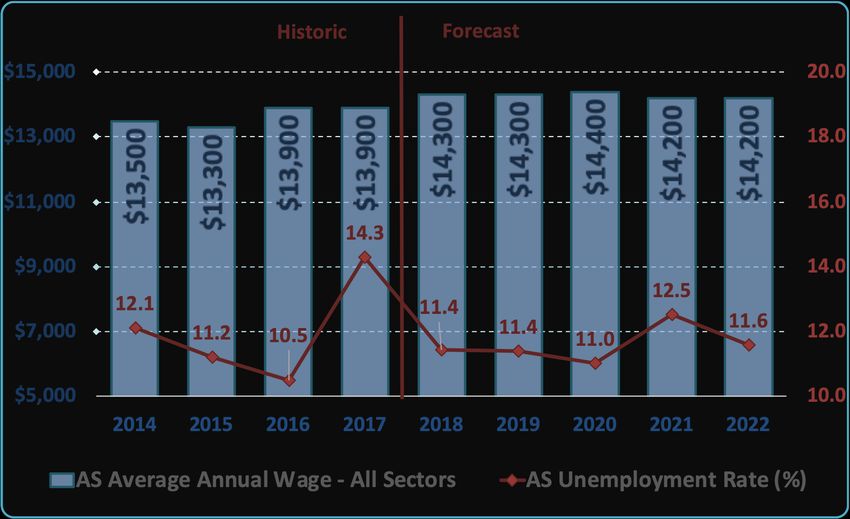
Introduction
The national forecast presented in this publication is from the Annual Energy Outlook 2019
reference case forecast of the US economy and of select energy prices, produced by the US
Energy Information Administration (EIA)1.

Forecast

Projections in the 2019 American Samoa Economic Forecast (ASEF) are not predictions of future
events, but rather modeled estimates of what may occur, based on historic observations and
certain assumptions. ASEF is developed using the American Samoa Economic Model (ASEM), a
series of simultaneous multilinear regression equations that represent the statistical
relationships between territorial, regional, national, and international economic variables.
Whenever feasible, these statistical constructs were based upon the latest National Income and
Product Accounts (NIPA) data and approved methodology, as outlined in the Bureau of
Economic Analysis (BEA) 2017 NIPA Handbook2 and as prescribed in the American Samoa
Statistical Act of 2003 (A.S.C.A. § 13.2104).
For more information about ASEM, see the section of this publication titled “ASEM: The
American Samoa Economic Model”.

Cover

The cover graph shows the average annual wage in American Samoa and the calculated
unemployment rate for the territory. These two variables are implicitly related and tend to
drive consumption, which accounts for approximately 70% of Nominal Gross Domestic Product
in the territory. When the unemployment rate is low, employers have to increase wages to
compete for qualified workers. If wages rise too quickly, some employers may invest more in
equipment and software, shifting some costs from labor to capital, leading to higher
unemployment. An elevated unemployment rate gives employees and job-seekers less power
to bargain and can lead to lower wages.
The average annual wage in American Samoa is expected to increase over the next few years,
largely due to higher government spending on disaster relief and the 2020 decennial census.
Once the census is complete, there will be a reduction in Census Bureau employment, which is
predicted to result in higher unemployment and lower wages in the two years that follow.

1
  United States, Department of Energy, Energy Information Administration. “Annual Energy Outlook 2019”.
www.eia.gov/outlooks/aeo/.
2
  United States, Bureau of Economic Analysis. “Concepts and Methods of the U.S. National Income and Product
Accounts.”, Nov. 2017. www.bea.gov/sites/default/files/methodologies/nipa-handbook-all-chapters.pdf.

1
Feature

The feature article chosen for this publication comes from Huiyu Li, an economist in the
Economic Research Department of the Federal Reserve Bank of San Francisco.
In official statistics, manufacturing is the top contributor to U.S. productivity growth despite its
shrinking share of nonfarm employment. However, official numbers tend to understate growth
among new producers that improve on existing producers, which is more prevalent outside of
manufacturing. Accounting for such missing productivity growth shows that it plays a larger role
in sectors such as retail trade and services.
Manufacturing employment is also an ever-shrinking portion of total employment in American
Samoa, yet overall output per worker has remained strong. Spending on services has increased
at an average annual rate of 2.8% since 2008, making it the fastest growing consumption
category in the territory. The findings in the article suggest that nonmanufacturing may be an
increasingly important engine of US growth. It will likely be an essential player in American
Samoa’s economic future, as well.

Scaling on Figures

Please note that the chart figures contained in this publication have axes that feature custom
scaling, which may appear to over-emphasize fluctuations in the underlying data. This data
visualization method was utilized to highlight the annual changes that are described in
accompanying analysis sections. Readers should also evaluate fluctuations in presented data
sets in proportion to the total values of the individual data points.

Updates and Changes

The latest available data was utilized in the estimates contained in this publication.
Readers with any questions should contact Nathaniel Clayville and nathaniel.clayville@doc.as.

American Samoa Department of Commerce                Statistics Division
Keniseli Lafaele, Director                           Vai Filiga, Chief of Statistics
Executive Office Building                            Nathaniel Clayville, Senior Economist
Utulei, American Samoa 96799                         (684) 633-5155
                                                     nathaniel.clayville@doc.as

2
Executive Summary A deceleration in global economic growth has occurred over the past two years, and the Asia- Pacific region has been no exception to this trend. A series of destructive natural disasters have left many Pacific Island Countries and Territories with hundreds of millions of dollars in damages, some of which have unlocked levels of disaster aid and private capital investment funds rarely seen in small, insular countries. American Samoa is a prime example of this trend. The territory experienced a modest economic expansion in 2014 and 2015, which was spurred, in part, by a large capital investment by Tri Marine International for the purchase and construction of facilities for the processing and packaging of locally harvested tuna. The facility opened early in 2016, but regional competition forced the company to permanently halt operations by the end of that same year. Nominal GDP in American Samoa fell by 0.2% in 2016, although the contraction was closer to 2.5%, when adjusted for inflation. The cannery closure contributed to a spike in the territory’s unemployment rate in 2017, from 10.5% to 14.3%. Both private and public sector consumption languished that year, and the economy contracted by an estimated 3.7%. The territory is expected to have experienced modest deflation in the same year. As a result, Real Gross Domestic Product (Real GDP) is projected to have contracted by a more subdued rate of 1.9% in 2017. This contraction may have extended into 2018, if not for a devastating tropical storm that impacted much of American Samoa in February of that year. By some estimates, Tropical Storm Gita caused as much as $186 million in direct and indirect damages across the territory. Federal disaster agencies and international relief organizations poured millions of dollars into the local economy in the weeks and months after the tropical storm, which helped to lift employment, income, and spending throughout the first half of the year. American Samoa also benefited from recent strength in the broader US economy in 2018, driven primarily by strength in labor markets. With relatively low domestic unemployment rates and consumer inflation, wage growth seems to have finally taken hold in the US during 2018, which appears to have translated to accelerated spending by both households and private businesses. Real government consumption grew by its fastest rate in nearly a decade in 2018, even though nominal federal government receipts were hampered by a series of tax cuts. US real GDP increased by an estimated 2.8% in 2018 and is predicted to continue to grow in each year of the forecast period, through 2022. Ongoing disaster relief funding is expected to contribute to modest consumer and government spending increases in American Samoa in 2018. The GDP growth in the territory was calculated at 3.9% in 2018, or 0.7% when adjusted for inflation. Once the immediate fiscal effects of the tropical storm have diminished, so will much of the economic stimulus. Accordingly, real GDP is forecast to decrease by 3.5% in 2019, 1.0% in 2020, 2.3% in 2021, an 2.0% in 2022. This anticipated multi-year contraction is partially driven by higher inflation and is best viewed as a return to a more sustainable long-term trend, following multiple years of energy price decreases and stronger-than-usual capital investments. 3
American Samoa Economic Forecast 2019 Executive Summary Tables

TABLE 1: AMERICAN SAMOA ECONOMIC FORECAST EXECUTIVE SUMMARY DETAILS

                                                American Samoa Economic Forecast
                                                    American Samoa Economic Forecast Summary
                    Category                                        History                                     Forecast
                      Year                             2014      2015         2016    2017     2018     2019        2020      2021      2022
AS Nominal Gross Domestic Product ($ Million)         643.0     661.0        653.0   634.0    658.5    639.0       646.2     639.3     641.1
                                Annual Growth (%)        0.3       2.8         -1.2    -2.9     3.9      -3.0         1.1      -1.1       0.3
AS Real Gross Domestic Product (2009$ Million)        641.0     649.0        632.0   598.0    602.0    581.0       575.2     561.9     550.8
                                Annual Growth (%)        0.9       1.2         -2.6    -5.4     0.7      -3.5        -1.0      -2.3      -2.0
AS Average Annual Wage ($/yr)                        13,474    13,348       13,850  13,929   14,282   14,329      14,360    14,249    14,158
                                Annual Growth (%)        0.8      -0.9          3.8     0.6     2.5       0.3         0.2      -0.8      -0.6
AS Personal Income ($ Million)                        341.7     335.9        354.7   354.9    364.9    379.4       384.3     370.3     372.9
                                Annual Growth (%)        6.9      -1.7          5.6     0.0     2.8       4.0         1.3      -3.7       0.7
ASG Revenues ($ Million)                               98.9      98.0         90.9    87.9     93.5     95.6        97.2      96.6      96.3
                                Annual Growth (%)        7.8      -1.0         -7.2    -3.3     6.4       2.2         1.7      -0.6      -0.3
Population                                           61,811    60,863       60,200  60,300   60,599   61,068      60,891    60,547    59,856
                                Annual Growth (%)       -1.3      -1.5         -1.1     0.2     0.5       0.8        -0.3      -0.6      -1.1
AS Consumer Price Index                                98.5      97.7         98.7   101.9    105.4    107.3       109.1     110.3     110.5
                                Annual Growth (%)        0.0      -0.8          1.0     3.2     3.5       1.8         1.6       1.1       0.2
AS GDP Deflator                                       100.3     101.8        103.4   106.1    109.4    110.0       112.4     113.8     116.4
                                Annual Growth (%)       -0.7       1.5          1.6     2.6     3.1       0.5         2.2       1.3       2.3
AS Government Revenues ($Million)                      98.9      98.0         90.9    87.9     93.5     95.6        97.2      96.6      96.3
                                Annual Growth (%)        7.8      -1.0         -7.2    -3.3     6.4       2.2         1.7      -0.6      -0.3

4
TABLE 2: US ECONOMIC FORECAST EXECUTIVE SUMMARY DETAILS
American Samoa Economic Forecast
US Economic Forecast Summary
Category History Forecast
Year 2014 2015 2016 2017 2018 2019 2020 2021 2022
Real US Gross Domestic Product (2009$ Million) 16,013.3 16,471.5 16,716.2 17,096.2 17,581.6 18,098.7 18,486.9 18,791.9 19,102.1
Annual Growth (%) 2.6 2.9 1.5 2.3 2.8 2.9 2.1 1.6 1.7
Real US Consumption (2009$ Million) 10,868.4 11,264.3 11,572.1 11,890.7 12,179.5 12,461.8 12,755.6 13,036.5 13,295.1
Annual Growth (%) 2.9 3.6 2.7 2.8 2.4 2.3 2.4 2.2 2.0
Real US Business Spending (2009$ Million) 2,762 2,905 2,210 2,314 2,450 2,615 2,754 2,835 2,884
Annual Growth (%) 5.5 5.2 -23.9 4.7 5.9 6.7 5.3 3.0 1.7
Real US Government Spending (2009$ Million) 2,839.1 2,878.5 2,900.1 2,903.3 2,958.3 3,028.2 3,056.6 3,065.9 3,069.4
Annual Growth (%) -0.6 1.4 0.8 0.1 1.9 2.4 0.9 0.3 0.1
Real US Net Exports (2009$ Million) -427.7 -545.3 -586.3 -621.8 -663.5 -707.5 -795.8 -846.0 -858.1
Annual Growth (%) -5.6 -27.5 -7.5 -6.1 -6.7 -6.6 -12.5 -6.3 -1.4
US Employment, Nonfarm (Millions) 138.9 141.8 144.3 146.5 148.8 150.3 151.7 152.5 153.2
Annual Growth (%) 1.9 2.1 1.8 1.5 1.6 1.0 0.9 0.5 0.4
US Unemployment Rate (percent) 6.2 5.3 4.9 4.4 3.9 3.5 3.7 3.9 4.1
Annual Growth (%) -16.1 -14.7 -7.6 -10.6 -11.0 -9.6 4.4 5.8 6.0
US Real GDP per Capita (2009$) 50,221.5 51,277.3 51,661.4 52,455.8 53,542.8 54,727.7 55,507.4 56,030.0 56,563.3
Annual Growth (%) 1.8 2.1 0.7 1.5 2.1 2.2 1.4 0.9 1.0
5Pacific Region Economic Forecast Analysis Pacific Region Economic Summary A deceleration in global economic growth has occurred over the past few years, and the Pacific region has been no exception to this trend. According to the International Monetary Fund (IMF), economic expansion became less homogeneous across countries in 2018, with most emerging markets growing at a faster rate while many advanced economies showed moderate deceleration. One notable exception was China, with Real GDP growth of 6.9% in 2017. It is estimated that China’s economy continued to expand at a similar pace throughout the first half of 2018 but is now also beginning to show signs of slowing. Many of the developed countries in the Pacific region, specifically New Zealand and Australia, have managed to find sustained economic growth through exports to many Asian markets, and through profitable industries, such as mining. Both countries maintain robust aid programs that funnel money into many of the developing Pacific Island Countries (PICs). Foreign aid programs in these countries don’t appear to be at risk in the near-term, especially considering New Zealand’s recently-announced “Pacific Reset” plan, in which the Kiwi government has funded a broad-based set of initiatives to lead the region in identity, security, and prosperity. Meanwhile, the last two years have been a mixed basket for other nations in the Pacific, with a series of destructive cyclones and typhoons wreaking havoc on many PICs, along with historic levels of tourism from developed countries in Asia, Oceania, and North America. In some emerging markets, the storms have worked against other drivers of economic expansion, as was observed in the years after Cyclone Pam clashed with Tuvalu in 2015. Tonga experienced similar constraints following damages from Tropical Storm Gita in early-2018. In some instances, foreign aid from developed countries has provided essential liquidity to affected PICs, supporting efforts to repair or construct critical infrastructure, allowing many island nations that depend on tourism to begin attracting visitors again. Moving forward, it is likely that the region will experience some additional hindrances to unbridled economic growth, such as indirect impacts of global trade feuds or the offshoring of manufacturing operations, which may lead to the erosion of key industries in some countries. Samoa experienced this in 2017, when the country’s largest private employer closed, relocating operations offshore and displacing nearly 700 workers. Notwithstanding downside risks, the Pacific region’s economy is still relatively well positioned to grow over the coming year. IMF estimates that real GDP in the region increased by 1.4% in 2018, which is high in comparison to IMF’s forecast for world-wide economic growth of -2.3% over the same period. Regional Real GDP is anticipated to expand by 4.1% in 2019, versus 0.2%, globally3. 3 October 2018 Regional Economic Outlook: Asia Pacific . October 2018 Regional Economic Outlook: Asia Pacific , www.imf.org/en/Publications/REO/APAC/Issues/2018/10/05/areo1012. 6
Samoa

Coming off of several consecutive
years of relatively strong
economic growth, Samoa is                                          Samoa
expected to report a more               2,500.0            Historical   Forecast                 4.0
subdued Real GDP increase of                                                                     3.0
                                        2,000.0
only 1.8% in 2018, down from
2.5% in 2017. The slowdown was                                                                   2.0
                                        1,500.0

                                                                                                                                   2,173.0
primarily due to the lingering

                                                                                                                         2,126.0
                                                                                                               2,080.0
                                                                                                 1.0

                                                                                                     1,982.0
                                                                                           1,921.0
                                                                                 1,887.0
                                                                       1,841.0
                                                   1,691.0

                                                             1,719.0
effects of the closure of the           1,000.0
                                                                                                 0.0
Yazaki Samoa factory4, the                500.0
country’s largest private                                                                        -1.0
employer which had produced                 0.0                                                  -2.0
automotive parts in the country                   2014 2015 2016 2017 2018 2019 2020 2021 2022
for 25 years before closing their                    Samoa Real GDP (Tala Million)
doors in late-2017. The closure
                                                     Samoa Consumer Inflation Annual Growth (%)
left as many as 700 workers
without jobs. Further                  FIGURE I: SAMOA REAL GDP AND INFLATION FORECAST
exacerbating the loss of the
country’s largest durable goods manufacturer was the damage caused by Tropical Storm Gita in
February of 2018. The combined impact of these events led to a reduction in output in sectors
such as fishing, financial services, and agriculture. Following the tropical storm, there was also a
notable increase in prices of petroleum products, which led to elevated prices on other goods
and services throughout the country. By mid-2018, the headline inflation rate was as high as
3.7%, ultimately settling at 3.4% for the year. IMF estimates that consumer price inflation will
level off and ease to 3.0% in 2019. IMF is also forecasting that Samoa’s Real GDP will grow by
3.2% in 20195, driven by strength in remittances and visitor receipts.

4
  September Quarterly Bulletin 2018. September Quarterly Bulletin 2018,
www.cbs.gov.ws/index.php/dmsdocument/6748.
5
  “Samoa.” International Monetary Fund, Countries, www.imf.org/en/Countries/WSM.

7
Tonga
The Kingdom of Tonga, which is comprised of 169 islands spread over 270,000 square miles, is
especially susceptible to shocks from natural disasters, climate change, and commodity prices.
With a relatively large portion of the Kingdom’s population dependent on subsistence
agriculture, Tonga is heavily reliant on external support, mainly through foreign aid, direct
foreign investment, and tourism. The Kingdom has been plagued by a series of inflationary
spikes over the last few decades,
Tonga with consumer inflation growth
calculated at 7.4% in 2017, 5.2% in
1,200.0 Historical Forecast 8.0 2018, and is forecast to be 5.3% in
1,000.0 6.0 2019. After sustaining extensive
800.0 damage during Tropical Storm Gita
4.0 in early-2018, a flood of foreign
1,056.0
1,026.0
600.0
989.0
aid eclipsed a falloff in tourism. As
945.0
895.0
870.0
849.0
2.0
815.0
788.0
400.0 a result, real GDP grew by an
200.0 0.0 estimated 2.9%. A projected
0.0 -2.0 increase in tourism from Australia
2014 2015 2016 2017 2018 2019 2020 2021 2022 and New Zealand in the coming
years, along with a steady stream
Tonga Real GDP (Pa'anga Million)
of foreign aid during the ongoing
Tonga Consumer Inflation Annual Growth (%) efforts to rebuild, is likely to
FIGURE II: TONGA REAL GDP AND INFLATION FORECAST contribute to real GDP growth of
5.6% in 20196.
Fiji
Fiji is home to one of the largest and most diversified PIC economies, supporting several goods
producing and service sectors. According to the Reserve Bank of Fiji’s December 2018 Economic
Review7, robust domestic consumption, along with strong public and private investment
spending, has kept the domestic economy in positive territory since the height of the global
financial recession in 2009. One of the country’s largest manufacturing sectors, sugar
production, lagged in late-2018, due to low quality of domestically harvested sugar cane. As a
result, industrial production declined by 1.2% that same year. Excluding sugar, industrial
production increase at an annual rate of 2.5% over the same period. Domestic consumption
also remained firm during 2018, with double-digit annualized growth in categories such as
6
“Tonga.” International Monetary Fund, Countries, www.imf.org/en/Countries/TON.
7
Economic Review - Month Ended December 2018. Economic Review - Month Ended December 2018,
www.rbf.gov.fj/getattachment/86333b1f-d47b-45d2-9546-9766ff4282bb/Economic-Review-December-2018-
(1).pdf?lang=en-US.
8lending and vehicle registrations.
As might be expected, strength in Fiji
household spending has been 10,000.0 Historical Forecast 5.0
accompanied by a rise in 8,000.0 4.0
consumer prices, with the headline
price level indicator growing at a 6,000.0 3.0
8,146.0
7,893.0
7,641.0
7,397.0
7,154.0
5.2% annualized rate of inflation in
6,932.0
6,684.0
6,728.0
6,437.0
4,000.0 2.0
late-2018. IMF has predicted an
2,000.0 1.0
easing of inflationary pressures in
Fiji over the coming year, with an 0.0 0.0
anticipated increase in overall 2014 2015 2016 2017 2018 2019 2020 2021 2022
consumer prices of 3.9% in 2019. Fiji Real GDP (FJD Million)
IMF calculated Real GDP growth of Fiji Consumer Inflation Annual Growth (%)
3.2% in 2018, which is forecast to
FIGURE III: FIJI REAL GDP AND INFLATION FORECAST
rise to a rate of 3.4% in 2019.8
New Zealand
As one of the largest contributors to foreign aid in the Pacific, and a major trade partner to
many PICs, the state of New Zealand’s economy is often an important driver of economic
fluctuations for the entire region. The economy of New Zealand has been growing consistently
since 2008, bolstered by strong domestic demand, a favorable exchange rate, and high levels of
government spending. Real GDP
New Zealand exceeded 4.0% in 2016—the highest
annual increase since before the
300.0 Historical Forecast 2.5
global financial crisis. The country’s
250.0 2.0 economy has since moderated to
200.0 annualized real GDP growth of just
1.5
over 3.0%. Like many other
279.8
272.6
150.0
264.5
256.4
248.9
241.5
234.3
225.0
developed economies, New Zealand
216.0
1.0
100.0
is near, or has possibly already
50.0 0.5
surpassed, the point of full
0.0 0.0 employment. According to the
2014 2015 2016 2017 2018 2019 2020 2021 2022 Reserve Bank of New Zealand’s
New Zealand Real GDP (NZD Billion) November 2018 Monetary Policy
New Zealand Consumer Inflation Annual Growth (%) Statement9, employment at or
above this maximum sustainable
FIGURE IV: NEW ZEALAND REAL GDP AND INFLATION FORECAST level will likely lead to increases to
input costs for firms, which is likely
8
“Fiji.” International Monetary Fund, Countries, www.imf.org/en/Countries/FJI.
9
Monetary Policy Statement November 2018. Monetary Policy Statement November 2018, www.rbnz.govt.nz/-
/media/ReserveBank/Files/Publications/Monetary%20policy%20statements/2018/mpsnov2018.pdf.
9to put moderate upward pressure on consumer prices. IMF estimates that headline inflation
growth rate, which has been contained below 2.0% since 2012, was 1.4% in 2018, and is
forecast to increase to 1.7% in 2019. 2018 real GDP expanded by a calculated 3.1% in 2018 and
is expected to grow by an additional 3.0% in 2019.10
Australia
Australia is another major contributor to foreign aid and capital improvement projects in the
Pacific. This country has maintained year-over-year real economic growth since the early 1990s,
including throughout the global economic recession and the decade since. According to the
Reserve Bank of Australia’s November 2018 Statement on Monetary Policy11, the Australian
economy has drawn strength from low interest rates, a strong global economy, and high levels
of spending on public infrastructure projects. Australia also benefitted from strong exports to
China and a mining boom that began sometime around 2003, and never fully exhausted itself.
These comparative benefits have helped to maintain moderate, yet broad-based increases in
domestic consumer spending, even in spite of the relatively slow growth in household income,
implying the possibility that spare capacity may still exist in the Australian labor market. There
is some evidence to suggest that Australia’s surging housing market is near its peak, with
private residential building
approvals showing signs of waning Australia
in the second half of 2018. 2,500.0 Historical Forecast 3.0
Consumer prices have been quite
2,000.0 2.5
stable, holding between 1.0% and
2.5% over the last five years. This 2.0
1,500.0
trend is anticipated to continue 1.5
1,967.5
1,917.5
1,868.5
1,819.9
1,771.0
1,715.4
1,678.1
1,635.5
1,595.8
into the foreseeable future, with 1,000.0
1.0
the headline inflation rate 500.0 0.5
calculated at 2.2% in 2019, and
2.3% in 2019. Real GDP is 0.0 0.0
2014 2015 2016 2017 2018 2019 2020 2021 2022
estimated to have grown by 3.2%
in 2018, which is forecast to Australia Real GDP (AUD Billion)
decelerate to 2.8% in 2019, Australia Consumer Inflation Annual Growth (%)
potentially as a result of the
sluggishness in the housing FIGURE V: AUSTRALIA REAL GDP AND INFLATION FORECAST
market. 12
Additional details can be found in the following data tables.
10
“New Zealand.” International Monetary Fund, Countries, www.imf.org/en/Countries/NZL.
11
Statement on Monetary Policy November 2018. Statement on Monetary Policy November 2018,
www.rba.gov.au/publications/smp/2018/nov/pdf/statement-on-monetary-policy-2018-11.pdf.
12
“Australia.” International Monetary Fund, Countries, www.imf.org/en/Countries/AUS.
10Pacific Region Economic Forecast Tables
TABLE 3: PACIFIC REGION COUNTRIES REAL GDP FORECAST
American Samoa Economic Forecast - Regional Economic Forecast
Real GDP
Category History Forecast
Year 2014 2015 2016 2017 2018 2019 2020 2021 2022
Samoa Real GDP (Tala Million) 1,691.0 1,719.0 1,841.0 1,887.0 1,921.0 1,982.0 2,080.0 2,126.0 2,173.0
Annual Growth (%) 1.2 1.7 7.1 2.5 1.8 3.2 4.9 2.2 2.2
Tonga Real GDP (Pa'anga Million) 788.0 815.0 849.0 870.0 895.0 945.0 989.0 1,026.0 1,056.0
Annual Growth (%) 3.0 3.4 4.2 2.5 2.9 5.6 4.7 3.7 2.9
Fiji Real GDP (FJD Million) 6,437.0 6,684.0 6,728.0 6,932.0 7,154.0 7,397.0 7,641.0 7,893.0 8,146.0
Annual Growth (%) 5.6 3.8 0.7 3.0 3.2 3.4 3.3 3.3 3.2
New Zealand Real GDP (NZD Billion) 216.0 225.0 234.3 241.5 248.9 256.4 264.5 272.6 279.8
Annual Growth (%) 3.2 4.2 4.1 3.0 3.1 3.0 3.1 3.1 2.6
Australia Real GDP (AUD Billion) 1,595.8 1,635.5 1,678.1 1,715.4 1,771.0 1,819.9 1,868.5 1,917.5 1,967.5
Annual Growth (%) -2.6 -2.5 -2.6 -2.2 -3.2 -2.8 -2.7 -2.6 -2.6
11TABLE 4: PACIFIC REGION COUNTRIES INFLATION FORECAST
American Samoa Economic Forecast - Regional Economic Forecast
Consumer Inflation
Category History Forecast
Year 2014 2015 2016 2017 2018 2019 2020 2021 2022
Samoa Consumer Inflation Annual Growth (%) -1.2 1.9 0.1 1.3 3.4 3.0 2.9 2.8 3.0
Tonga Consumer Inflation Annual Growth (%) 1.2 -1.1 2.6 7.4 5.2 5.3 1.9 2.5 2.6
Fiji Consumer Inflation Annual Growth (%) 0.5 1.4 3.9 3.4 3.9 3.2 3.0 3.0 3.0
New Zealand Consumer Inflation Annual Growth (%) 1.2 0.3 0.6 1.9 1.4 1.7 1.9 2.0 2.0
Australia Consumer Inflation Annual Growth (%) 2.5 1.5 1.3 2.0 2.2 2.3 2.5 2.5 2.5
12United States of America Economic Forecast Analysis US Economic Summary The US economy expanded for the 9th consecutive year in 2018, driven primarily by strength in the labor markets. With relatively low unemployment rates and inflation, wage growth seems to have finally taken hold in the US during 2018, which seems to have translated to increased spending by both households and private businesses. Real government spending grew by its fastest pace in nearly a decade in 2018, even though nominal federal government receipts were hampered by a series of tax cuts. US real GDP increased by an estimated 2.8% in 2018 and is expected to continue to grow in each year of the forecast period, through 2022. The US labor markets saw some of the lowest unemployment rates in recent history in 2018. Total nonfarm payrolls increased by an average of 254,000 per month during the fourth quarter of 2018 and the seasonally adjusted unemployment rate ended the year at 3.9%. US nominal disposable personal income grew at an average annual pace of 3.7% from 2014 through 2017 before expansion slowed to 1.2% in 2018. EIA’s 2019 Annual Energy Outlook estimates that this income growth will average 2.7% over the remainder of the forecast period. This more modest rate suggests the possibility that the US is at or near the level of full employment. Between 2014 and 2018 consumer spending grew at an average yearly rate of 2.9%, driven in part by falling oil prices and the associated timid inflation. With employment approaching the natural rate of unemployment, wage growth is anticipated to level off, which should bring household spending back to a more sustainable level. Specifically, real US personal consumption is projected to increase by 2.3% in 2019, 2.4% in 2020, 2.2% in 2021, and 2.0% in 2022. Capital investments by private businesses on residential and nonresidential structures, equipment, intellectual property products, and other business inputs have been growing since 2016. Real business investments fell by 23.9% in 2016, which was primarily a result of falling oil prices disincentivizing spending on new energy structures and associated equipment. Spending in this category bounced back in 2017, increasing by 4.7% that year and 5.9% the following year. Real business investments are expected to grow by 6.7% in 2019, 5.3% in 2020, 3.0% in 2021, and 1.7% in 2022. Recent news about government spending has primarily focused on the effects of the federal government shutdown that started on December 22, 2018 and ended on January 25, 2019. The Congressional Budget Office (CBO) estimated that the five-week shutdown led to a delay in federal discretionary spending of approximately $1.8 billion, reduced fourth quarter 2018 real GDP by $3 billion, and decreased first quarter 2019 real GDP by $8 billion (versus what it was forecast to be without the effects of the shutdown). Federal government outlays were calculated to have grown by 4.8% in 2018, while tax receipts rose by a relatively sluggish 0.7%, primarily due to the lower corporate tax rate and higher standard deductions that were 13
enacted in the Tax Cuts and Jobs Act of 2017. The act was passed and signed into law in late-
2017, with many of the provisions taking effect in 2018. Adjusted for inflation, 2018 US
government spending was estimated to have climbed at a rate of 1.9% in 2018, and is forecast
to grow by 2.4% in 2019, 0.9% in 2020, 0.3% in 2021, and 0.1% in 2022.
2018 was a volatile year for US trade as the trade-weighted value of the US dollar fell for the
second consecutive year after the US imposed new tariffs on approximately 12% of all goods
imported into the country. In response, US trade partners retaliated, collectively, with new
tariffs on around 9% of all goods exported by the US. According to the CBO, the impact of the
new tariffs is expected to reduce real US GDP by an average of 0.1% through 2029. The most
recent BEA monthly trade report showed an 11.4% increase in the year-to-date deficit, versus
the same period in 2017. Adjusted for inflation, net exports are projected to be -$663 billion in
2018, -$708 billion in 2019, -$796 billion in 2020, -$846 in 2021, and -$858 in 2022.
Continued momentum in the leading consumption categories is anticipated to continue the
trend of real GDP growth through 2022. Specifically, inflation-adjusted GDP is estimated to
have increased by 2.8% in 2018, and is forecast to expand by 2.9% in 2019, 2.1% in 2020, 1.6%
in 2021, and 1.7% in 2022.
Additional analysis on specific US economic indicators can be found in the following sections.

US Labor Markets

The US labor markets saw                                 History        Forecast
                                      $160.0                                                    10.0%
some of the lowest
                                      $155.0
unemployment rates in recent                                                                    8.0%
history in 2018. Total nonfarm        $150.0
payrolls increased by an              $145.0                                                    6.0%
average of 254,000 per month          $140.0
during the fourth quarter of          $135.0                                                    4.0%
2018 and the seasonally               $130.0
adjusted unemployment rate                                                                      2.0%
                                      $125.0
ended the year at 3.9%.13
Wage growth had been                  $120.0                                                    0.0%
anemic from 2010, following                                                                               the
                                             14
                                             15
                                             16
                                             17
                                             18
                                             19
                                             20
                                             21
                                             22
                                           20
                                           20
                                           20
                                           20
                                           20
                                           20
                                           20
                                           20
                                           20

global economic recession,                                                                                and
remained subdued through                        US Employment, Nonfarm (Millions)
mid-2014, during which time
                                                US Unemployment Rate (percent)
annualized wage increases
                                     FIGURE VI: US EMPLOYMENT AND UNEMPLOYMENT

13
  United States, Department of Labor, Bureau of Labor Statistics. “The Employment Situation - December 2018.”
The Employment Situation - December 2018. www.bls.gov/news.release/pdf/empsit.pdf.

14
never exceeded 2.5%.14 US wages broke that threshold in September of 2016, and have grown
at an annualized rate of at least 2.8% in each month since, with the most recent data suggesting
that wages are currently rising at a 3.9% annualized pace. US nominal disposable personal
income grew at an average rate of 3.7% from 2014 through 2017 before slowing to 1.2% in
2018. EIA’s 2019 Annual Energy Outlook estimates that this rate will average 2.7% through
2022, suggesting the possibility that the US is at or near the level of full employment. Total
nonfarm payrolls in the US increased by 1.6% in 2018, from 146 million to 149 million, and are
expected to grow to approximately 153 million nonfarm workers in the US by 2022. The flagship
unemployment rate averaged 3.9% in 2018 and is forecast to be 3.5% in 2019, 3.7% in 2020,
3.9% in 2021, and 4.1% in 2022.
US Inflation
US inflation has been subdued since the Great Recession, when the Consumer Price Index (CPI)
surpassed an annualized growth rate of 5% for a handful of months in 2008. Tepid aggregate
demand kept pressure on prices through 2014. It was that year in which personal consumption
in the US surged, yet most inflation indicators increased only moderately, and the CPI even fell
into deflationary territory for the first two months of 2015. The reason for this counterintuitive
inflationary response to higher aggregate demand was an erosion in the price of crude oil,
which helped to stimulate the economy by decreasing freight and transportation costs. By the
time oil prices had begun to rise more rapidly in 2016, many supply chain systems in the US had
established economies of scale and were able to absorb a certain amount of growth in freight
costs. Prices began to rise, but slower than anticipated, given the increase in oil prices.
Consumer price growth nearly reached
3.0% History Forecast 3% by the beginning of 2017, and then
again in mid-2018, before oil prices
2.5% began to fall again. The Producer Price
2.0%
Index (PPI), which measures the prices
that domestic producers pay for input
1.5% goods and services, is typically a
leading indicator of movements in
1.0% consumer prices, increased by 4.3% in
0.5% 2018, and is forecast to grow by 2.2%
in 2019, 2.7% in 2020, and 1.6% in
0.0% both 2021 and 2022. The CPI for all
urban consumers in the US rose by
14
15
16
17
18
19
20
21
22
2.4% in 2018 and is projected to
20
20
20
20
20
20
20
20
20
US CPI All Items (% Growth) increase by 2.1% in 2019, 2.6% in
2020, and 2.4% in both 2021 and 2022.
FIGURE VII: US INFLATION
14
The Federal Reserve Bank of Atlanta, Wage Growth Tracker, www.frbatlanta.org/chcs/wage-growth-
tracker.aspx.
15US Consumer Spending
Personal consumption
expenditures account for $13,280 History Forecast
approximately 70% of US GDP,
$12,780
and includes household
spending on durable goods, $12,280
nondurable goods, and
$11,780
services. Real consumer
spending in the US declined in $11,280
the years leading up to the
$10,780
prior recession, but has been
on the rise ever since, growing $10,280
at an average annual rate of
$9,780
2.4% from 2009 through 2018.
Spending was lackluster in the
14
15
16
17
18
19
20
21
22
20
20
20
20
20
20
20
20
20
years immediately following
the recession, increasing at an US Real Consumption (2009 CW $ Billion)
average annual pace of only
1.8% from 2009 to 2013. It FIGURE VIII: US REAL CONSUMER SPENDING
wasn’t until 2014 that US
households finally began to believe that the economic recovery could be sustained. Between
2014 and 2018 consumer spending rose at an average yearly rate of 2.9%, driven in part by
falling oil prices and the associated timid inflation. By 2015, wage growth was beginning to pick
up again and year-over-year inflation-adjusted consumer expenditures rose by 3.6%, followed
by 2.7% in 2016, 2.8% in 2017, and 2.4% in 2018. With employment approaching the natural
rate of unemployment, wage growth is expected to level off, which should bring household
spending back in line with a more sustainable, long-term trend. Specifically, real US personal
consumption is forecast to increase by 2.3% in 2019, 2.4% in 2020, 2.2% in 2021, and 2.0% in
2022.
US Private Fixed Investment
Capital investments by private businesses on residential and nonresidential structures,
equipment, intellectual property products, and other business inputs have been growing since
2016. Real business investments fell by 23.9% in 2016, which was primarily a result of falling oil
prices disincentivizing spending on new energy structures and associated equipment. Spending
in this category bounced back in 2017, increasing at a rate of 4.7% that year, followed by 5.9%
in the following year. Real business investments are projected to grow by 6.7% in 2019, 5.3% in
2020, 3.0% in 2021, and 1.7% in 2022.
16US Government Spending
Federal government spending has increased at an average rate of 3.9% each year from 2013. It
was that year that Congress approved a budget deal raising taxes and postponing automatic
spending cuts, known as “sequestration”, and avoiding the so-called “fiscal cliff”. As a result,
total tax receipts grew by 13.3% that year and total outlays shrunk by 2.3%. Each year since
then, both receipts and spending have grown by 3.8% and 3.9%, respectively15. More recently,
government spending news has revolved around the federal government shutdown that
started on December 22, 2018 and ended on January 25, 2019. The Congressional Budget Office
(CBO) estimated that the five-week shutdown led to a delay in federal discretionary spending of
approximately $1.8 billion, reduced fourth quarter 2018 real GDP by $3 billion, and decreased
first quarter 2019 real GDP by $8 billion (versus what it was expected to be without the effects
of the shutdown)16. Federal
$3,070 History Forecast
government outlays were estimated to
have grown by 4.8% in 2018, while tax
$2,970
receipts increased by a relatively
$2,870 sluggish 0.7%, primarily due to the
$2,770 lower corporate tax rate and higher
$2,670 standard deductions that were
enacted in the Tax Cuts and Jobs Act of
$2,570
2017. The act was passed and signed
$2,470 into law in late-2017, with many of the
$2,370 provisions taking effect in 2018.
$2,270 Adjusted for inflation, 2018 US
government spending was calculated
14
15
16
17
18
19
20
21
22
to have increased by 1.9% in 2018, and
20
20
20
20
20
20
20
20
20
US Real Government Spending (2009 CW $ Billion) is forecast to grow by 2.4% in 2019,
0.9% in 2020, 0.3% in 2021, and 0.1%
FIGURE IX: US REAL GOVERNMENT SPENDING in 2022.
15
United States, White House Office of Management and Budget. “Table 1.1—Summary of Receipts, Outlays, and
Surpluses or Deficits (-): 1789–2023.” Table 1.1—Summary of Receipts, Outlays, and Surpluses or Deficits (-): 1789–
2023. www.whitehouse.gov/wp-content/uploads/2018/02/hist01z1-fy2019.xlsx.
16
United States, Congress, Congressional Budget Office. “The Effects of the Partial Shutdown Ending in January
2019.” The Effects of the Partial Shutdown Ending in January 2019. www.cbo.gov/system/files?file=2019-
01/54937-PartialShutdownEffects.pdf.
17US Net Exports
2018 was a volatile year for US trade as the
trade-weighted value of the US dollar fell $3,630 History Forecast
for the second consecutive year after the US $3,430
imposed new tariffs on approximately 12% $3,230
of all goods imported into the country. $3,030
Some of these new tariffs were broadly $2,830
applied to certain products from all US $2,630
trade partners, including the tariffs on $2,430
washing machines, solar panels, and steel $2,230
and aluminum products, while others were
$2,030
targeted at specific countries (namely,
China). In response, US trade partners
14
15
16
17
18
19
20
21
22
20
20
20
20
20
20
20
20
20
retaliated, collectively, with new tariffs on US Real Imports (2009 CW $ Billion)
around 9% of all goods exported by the US.
The immediate impact of the tariffs was a FIGURE X: REAL US IMPORTS
surge in trade activity, boosting real
annualized GDP growth to 4.5% in the second quarter of 2018 international buyers placed large
orders that would fill before the new tariff schedule took effect. However, the surge in exports
is widely anticipated to have been a one-time phenomenon. According to the CBO, the impact
of the new tariffs is expected to reduce real US GDP by an average of 0.1% through 202917. The
most recent data shows that the seasonally-adjusted goods and services US trade deficit
widened over the last half of 2018. The
History Forecast
most recent BEA monthly trade report
$2,690
showed an 11.4% increase in the year-to-
$2,490 date deficit, versus the same period in
201718. Still, real US exports are estimated
$2,290
to have grown by 5.4% in 2018 and are
$2,090 projected to rise at an average annual rate
of 5.2% through 2022. Real US imports
$1,890
climbed by an estimated 5.7% in 2018 and
$1,690 are expected to grow at an average annual
rate of 5.6% over the same period. Adjusted
14
15
16
17
18
19
20
21
22
for inflation, net exports are forecast to by -
20
20
20
20
20
20
20
20
20
US Real Exports (2009 CW $ Billion) $663 billion in 2018, -$708 billion in 2019, -
$796 billion in 2020, -$846 in 2021, and -
FIGURE XI: REAL US EXPORTS $858 in 2022.
17
United States, Congress, Congressional Budget Office. “The Budget and Economic Outlook: 2019 to 2029.” The
Budget and Economic Outlook: 2019 to 2029. www.cbo.gov/system/files?file=2019-01/54918-Outlook.pdf.
18
United States, Congress, Bureau of Economic Analysis. “U.S. International Trade in Goods and Services, October
2018.” U.S. International Trade in Goods and Services, October 2018. www.bea.gov/system/files/2018-
12/trad1018.pdf.
18US Economic Forecast Tables
TABLE 5: US ECONOMIC FORECAST DETAILS
American Samoa Economic Forecast
US Economic Forecast Summary
Category History Forecast
Year 2014 2015 2016 2017 2018 2019 2020 2021 2022
Real US Gross Domestic Product (2009$ Million) 16,013.3 16,471.5 16,716.2 17,096.2 17,581.6 18,098.7 18,486.9 18,791.9 19,102.1
Annual Growth (%) 2.6 2.9 1.5 2.3 2.8 2.9 2.1 1.6 1.7
Real US Consumption (2009$ Million) 10,868.4 11,264.3 11,572.1 11,890.7 12,179.5 12,461.8 12,755.6 13,036.5 13,295.1
Annual Growth (%) 2.9 3.6 2.7 2.8 2.4 2.3 2.4 2.2 2.0
Real US Business Spending (2009$ Million) 2,762 2,905 2,210 2,314 2,450 2,615 2,754 2,835 2,884
Annual Growth (%) 5.5 5.2 -23.9 4.7 5.9 6.7 5.3 3.0 1.7
Real US Government Spending (2009$ Million) 2,839.1 2,878.5 2,900.1 2,903.3 2,958.3 3,028.2 3,056.6 3,065.9 3,069.4
Annual Growth (%) -0.6 1.4 0.8 0.1 1.9 2.4 0.9 0.3 0.1
Real US Net Exports (2009$ Million) -427.7 -545.3 -586.3 -621.8 -663.5 -707.5 -795.8 -846.0 -858.1
Annual Growth (%) -5.6 -27.5 -7.5 -6.1 -6.7 -6.6 -12.5 -6.3 -1.4
US Employment, Nonfarm (Millions) 138.9 141.8 144.3 146.5 148.8 150.3 151.7 152.5 153.2
Annual Growth (%) 1.9 2.1 1.8 1.5 1.6 1.0 0.9 0.5 0.4
US Unemployment Rate (percent) 6.2 5.3 4.9 4.4 3.9 3.5 3.7 3.9 4.1
Annual Growth (%) -16.1 -14.7 -7.6 -10.6 -11.0 -9.6 4.4 5.8 6.0
US Real GDP per Capita (2009$) 50,221.5 51,277.3 51,661.4 52,455.8 53,542.8 54,727.7 55,507.4 56,030.0 56,563.3
Annual Growth (%) 1.8 2.1 0.7 1.5 2.1 2.2 1.4 0.9 1.0
19TABLE 6: OTHER ECONOMIC INDICATORS FORECAST DETAILS
American Samoa Economic Forecast
Other Economic Indicators Summary
Category History Forecast
Year 2014 2015 2016 2017 2018 2019 2020 2021 2022
US CPI All Items (Index, 1982-84=100) 236.7 237.0 240.0 245.1 251.3 256.6 263.4 269.7 276.1
Annual Growth (%) 1.6 0.1 1.3 2.1 2.5 2.1 2.6 2.4 2.4
US PPI All Items (Index, 1982=100) 205.3 190.4 185.4 193.6 202.3 206.8 212.5 215.8 219.4
Annual Growth (%) 0.9 -7.2 -2.7 4.4 4.5 2.2 2.7 1.6 1.6
US GDP Deflator (Index, 2009=100) 108.8 110.0 111.4 113.4 115.7 118.5 121.8 125.0 128.2
Annual Growth (%) 1.8 1.1 1.3 1.8 2.0 2.5 2.8 2.7 2.5
US Federal Funds Rate (Average %) 0.1 0.1 0.4 1.0 1.8 2.8 3.4 3.5 3.5
Annual Growth (%) -17.1 48.6 198.1 153.6 82.9 54.9 19.7 1.9 0.3
US 10yr Treasury Note (Average %) 2.3 2.9 2.9 2.3 3.1 3.6 3.7 3.8 3.7
Annual Growth (%) 15.9 -23.8 -0.3 18.8 -32.0 -16.1 -5.0 -0.9 1.3
US Industrial Production (Index 2007=100) 105.2 104.1 102.1 103.7 107.8 111.3 113.6 115.2 115.2
Annual Growth (%) 3.1 -1.0 -1.9 1.6 3.9 3.3 2.1 1.5 0.0
Broad Trade Weighted Dollar Index 87.2 97.5 107.0 105.8 102.2 101.7 102.9 103.8 110.2
Annual Growth (%) 2.1 11.8 9.7 -1.1 -3.4 -0.4 1.2 0.9 6.1
Brent Crude Oil Average Nominal Price (USD) 99.0 52.3 43.7 55.2 74.4 73.3 73.3 74.4 74.4
Annual Growth (%) -8.8 -47.1 -16.4 26.2 34.8 -1.6 0.0 1.6 0.0
20American Samoa Economic Forecast Analysis American Samoa Economic Summary The economy of American Samoa has been in a state of flux over the last few years. The territory experienced modest economic growth in 2014 and 2015, which was spurred, in part, by a large capital investment by Tri Marine International on the purchase and construction of facilities for processing and packaging locally harvested tuna. The cannery opened early in 2016, under the name Samoa Tuna Processors (STP). Competition from Asian-based canneries immediately put the company in a precarious position and processing operations permanently halted in late-2016. Nominal GDP in American Samoa fell by 0.2% that year, although the inflation-adjusted contraction was closer to 2.5%. STP laid off at least 400 employees during the closure, which led to hundreds of additional job losses in related and support industries over the following year. Starkist Samoa Co., American Samoa’s last remaining tuna processor, also faced setbacks in 2017. Availability of landed fish, along with a number of federally-mandated equipment upgrades, forced the company to temporarily halt operations for five weeks in the fourth quarter of 2017. The shutdown left thousands of employees without salaries to cover basic expenses and cost the local government more than half-a-million dollars in income tax revenues. The combined impact of the cannery closures contributed to a spike in the unemployment rate in the territory in 2017, from 10.5% in 2016 to 14.3%, and led to stagnant spending in both the private and public sectors. The economy contracted by 3.7% in 2017. The territory also experienced modest inflation in the same year and Real GDP contracted by 5.3%. The recession may have extended into the following year, if not for a devastating storm that impacted much of American Samoa in February of 2018. By some estimates, Tropical Storm Gita caused as much as $125 million in direct and indirect damages across the territory.19 At least 50% of all individuals in the territory were faced with significant damage to real and/or personal property during the storm. Food, water, and other basic necessities were in high demand throughout the days and weeks that followed. During that time, automated teller machines were persistently low on cash supplies as the people of the territory scrambled to draw enough to cover immediate repair and replacement costs. Additionally, international relief agencies distributed pre-loaded gift cards to families and individuals that were most affected by the storm. Disaster relief funding is expected to contribute to consumer and government spending in 2018. Specifically, real GDP in American Samoa is forecast to have grown by 0.7% in 2018. Once the immediate effects of the tropical storm have diminished, so will many of the economic stimulus benefits. Real GDP is predicted to decrease by 3.5% in 2019, 1.0% in 2020, 2.3% in 19 Clayville, Nathaniel. “Impact of Cyclone Gita on the Economy of American Samoa.” American Samoa, Pago Pago, 12 Apr. 2018. 21
2021, and 2.0% in 2022. This anticipated multi-year contraction is partially driven by higher
inflation and is best viewed as a return to a more sustainable long-term trend, following
multiple years of energy price decreases and stronger-than-usual capital investment.
Additional analysis on specific American Samoa economic indicators can be found in the
following sections.

Employment

The economy of American
Samoa benefitted from a                            History        Forecast                 20.0%
number of government and         18,100
                                                                                           18.0%
private capital investment       17,600
                                                                                           16.0%
projects for most of the         17,100
years since 2009, including 16,600                                                         14.0%
a $60 million investment in                                                                12.0%
the STP tuna cannery and         16,100                                                    10.0%
more than $100 million in        15,600                                                    8.0%
combined funds from              15,100                                                    6.0%
Federal Emergency                14,600                                                    4.0%
Management Agency
                                 14,100                                                    2.0%
(FEMA), from US
Department of Labor, and         13,600                                                    0.0%
from grants awarded
                                       14

                                       15

                                       16

                                       17

                                       18

                                       19

                                       20

                                       21

                                       22
through the American
                                     20

                                     20

                                     20

                                     20

                                     20

                                     20

                                     20

                                     20

Recovery and Reinvestment            20            AS Employed Forecast
Act of 2009 (ARRA). As a                           AS Unemployment Rate Forecast
result, total nonfarm
payrolls in the territory had FIGURE XII: AMERICAN SAMOA EMPLOYMENT AND UNEMPLOYMENT
grown to more than 18,000
by 2016. Following the closure of the STP cannery in late-2016, cannery employment in the
territory fell by 400 in 2017. The impact to the rest of the economy led to an additional loss of
approximately 500 workers from other private sectors in the territory, and 100 government
employees. Subsequently, the unemployment rate in the territory rose from 10.5% in 2016 to
an estimated 14.3% in 2017.
This trend was temporarily bucked in early-2018, when Tropical Storm Gita impacted many of
the islands of American Samoa. The storm left hundreds of millions of dollars of damage to
public and private structures, property, and infrastructure. There was an immediate response
from the federal government, and a wave of disaster relief funds from FEMA and international
relief organizations soon followed. Initial support from FEMA funded emergency management
operations, helping to bankroll the expensive tasks of debris removal and restoration of public
utilities, while the Red Cross injected as much as a million dollars into the local economy

22
through direct donations to affected households. The flood of new consumer and government
spending contributed to a calculated 3.1% increase in total nonfarm payrolls in 2018, from
around 17,200 to over 17,700, and reduced the unemployment rate from 14.3% to 11.4%.
The majority of the employment impacts from the tropical storm were contained in the six
months immediately following the disaster. As such, federal and territorial government payroll
impacts have likely already occurred and are forecast to remain near 7,900 through 2019
before swelling to more than 8,100 in 2020, when the decennial census survey is carried out.
Following the completion of the 2020 Census, the Census workforce will be reduced and
government payrolls in American Samoa are anticipated to decrease to approximately 7,500 in
2021, and 7,600 in 2022.
Private nonfarm payrolls are likely to follow a similar trajectory. However, the post-census dip
in the outer years of the forecast period will likely be cushioned by modest growth in cannery
employment, as Starkist Samoa Co. is expected to increase production of pouch tuna products.
Total nonfarm payrolls are projected to rise by 1.9% (18,100) in 2019, and 0.9% (18,200) in
2020, before contracting by 6.7% (17,000) in 2021, and then growing by 0.8% (17,100) in 2022.
Accordingly, the unemployment rate is forecast to be 11.4% in 2019, 11.0% in 2020, 12.5% in
2021, and 11.6% in 2022.
Wages and Income
Strong government and business spending in the territory since the 2009 tsunami has
contributed to average annualized wage growth of 2.8% over the last decade. Personal income,
which is the sum of all wages and incomes earned in American Samoa, climbed by 5.4% in 2016,
which was the final year of
History Forecast construction on the STP cannery.
$5,740 Disposable personal income,
$14,000 which excludes tax and debt
$5,540
payments and essentially
$5,340
$13,500 represents household buying
$5,140 power, rose by 5.1% in the same
$4,940 year. In 2017, after the cannery
$13,000
closure, personal income and
$4,740
disposable personal income
$4,540 $12,500 growth slowed to 0.1% and
$4,340 0.7%, respectively. Each of these
$4,140 $12,000 income variables would have
contracted that year, if not for a
14
16
18
20
22
steep increase in transfer
20
20
20
20
20
payments from government
AS Disposable Personal Income per Capita (USD) Forecast
AS Average Annual Wage - All Sectors
entities to individuals, namely
pension distributions, social
FIGURE XIII: AMERICAN SAMOA WAGES AND INCOME security benefits, and
23You can also read