The Miyawaki method - Data & concepts - Urban Forests
←
→
Page content transcription
If your browser does not render page correctly, please read the page content below
URBAN FORESTS COMPANY - 2020

        The Miyawaki method – Data &
                 concepts
        Multiple Miyawaki forests projects have been documented across the world since 1980.
This document aims at gathering and highlighting scientific data through the compilation of
existing Miyawaki forests studies. It also covers the benefits associated to urban forests, and
tree exchanges.

                                                 http://urban-forests.com

                                                 URBAN FORESTS contact
                                                 nicolasdebrabandere@gmail.com

                                     Author: Clara Manuel for URBAN FORESTS
                                     clara.manuel@hotmail.fr

                                                                                             1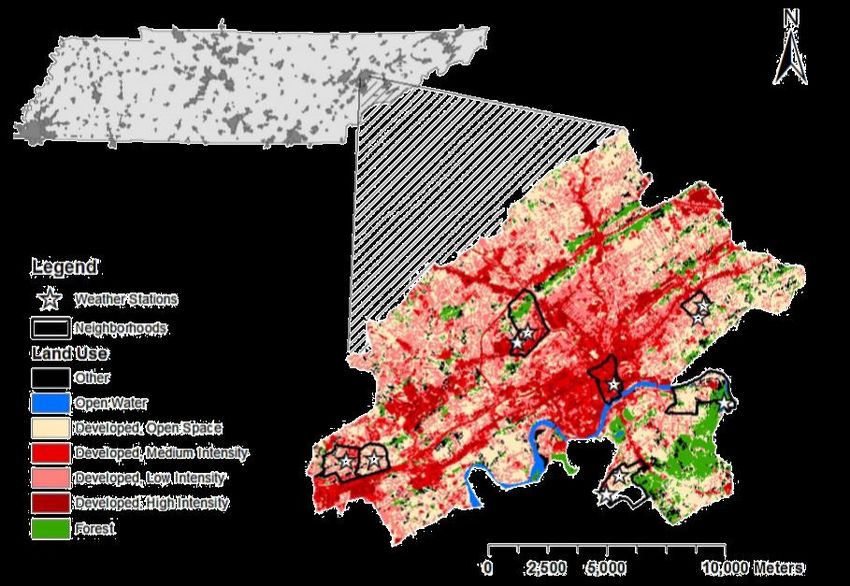
URBAN FORESTS COMPANY - 2020

Sommaire
1.        Miyawaki forest key-numbers                                         3
2.        Photographic survey                                                 4
3.        Concepts                                                            6
4.        Miyawaki forest growth data                                         8
     A.     Multiple protective forest projects in Japan                      8
     B.     Rainforest restoration project in Brazil                          9
     C.       Rainforest restoration project in Malaysia                      11
     D.       An impossible task yet a success in some arid area in Sicilia   13
     E.     Biodiversity project in Netherlands                               14
5.        Comparisons between climates                                        15
6.        Micro-forest benefits                                               17
     A.     Temperature reduction                                             17
     B.     Air quality improvement, containment of pollution                 19
     C.       Noise reduction                                                 21
     D.       Health and well-being                                           22
     E.     Biodiversity balance                                              24
     F.     Soils stability and natural disaster prevention                   26
     G.       CO2 balance sheet                                               26
     H.       Impact on real estate prices                                    28
7.        Tree exchanges                                                      29
     References                                                               32

                                                                               2
URBAN FORESTS COMPANY - 2020

1. Miyawaki forest key-numbers

         Multistratal quasi-natural forest – Miyawaki method

Planting density: 2 to 7 trees per m²
Green surface area: 30 times more than a meadow
Survival rate (Natural Selection): 15 to 90%
Growth rate: 1.5 m/year [rainforest], 1 m/year [temperate forest], 0.3 m/year
[Mediterranean forest]
Growth stabilization: from 15-20 years [temperate zone], 30-40 years
[tropical zone]
Final average size: 20 m [upper layer.], 4m [lower layer]
Density after stabilization: 0.5 to 2.5 trees per m²
Biodiversity (fauna): 18 times more (mean of different species)

                                                                                3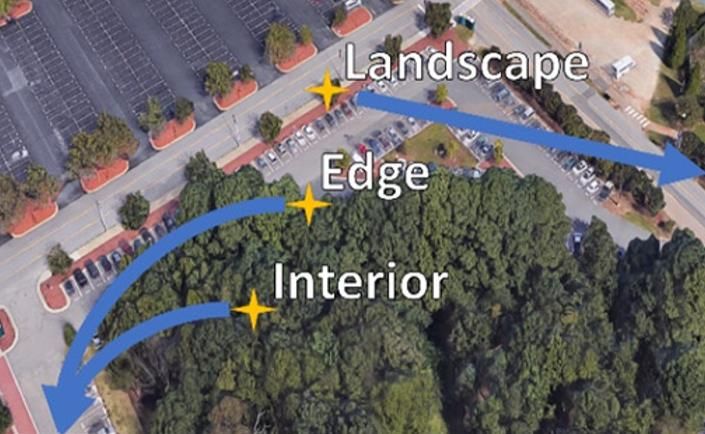
URBAN FORESTS COMPANY - 2020
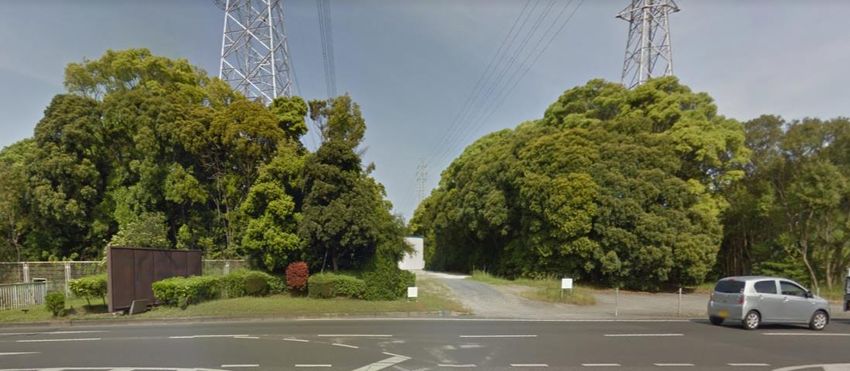
2. Photographic survey
4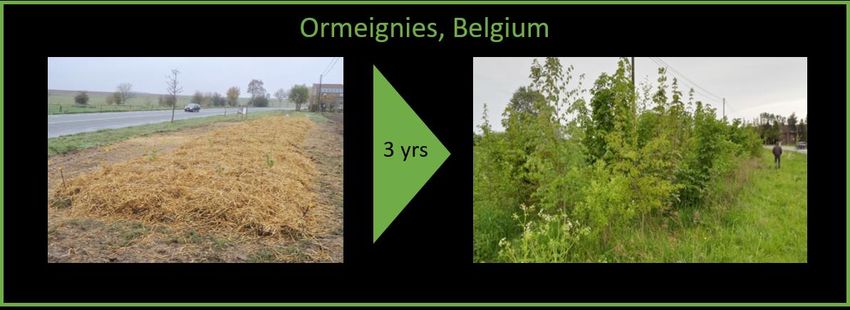
URBAN FORESTS COMPANY - 2020

                               5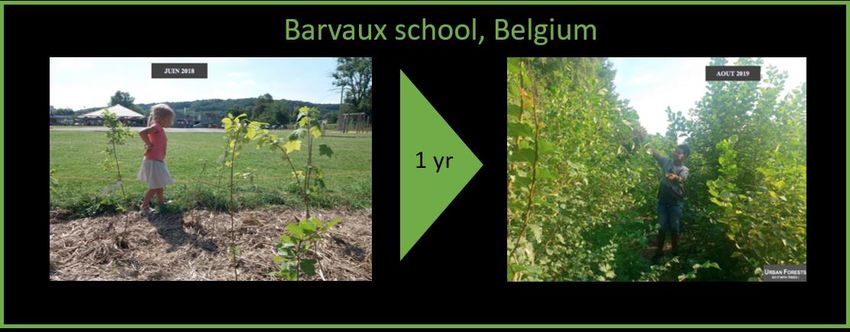
URBAN FORESTS COMPANY - 2020

   3. Concepts

A Miyawaki forest is an opportunity to take part in ecosystem restoration (1). Indeed, the
method takes into account ecological successions (2), and allows to immediately plant an
advanced forest through the choice of the most adapted plant communities (3). It is called
the Potential Natural Vegetation (4). Cooperation between trees (5) enhances quick
development and great resilience.
   (1) Natural restoration : ‘‘an intentional activity that initiates or accelerates recovery of an
       ecosystem with respect to its health, integrity and sustainability (Aronson et al. 2002)’’
       (Schirone et al., 2011)

   (2) Ecological succession: “In a natural forest cycle, as Clements (1916) described, annual
       plants on barren land are succeeded by perennial grass, sun-tolerant shrubs, light
       demanding, fast-growing pioneer trees, and finally natural forests; each step may
       require decades, and the climax vegetation could be formed after two centuries or more
       (Connell and Slatyer 1977). Currently, most forest reforestation programs adopt a
       scheme of planting one or more early successional species; after successful
       establishment, they are gradually replaced by intermediate species (either naturally or
       by planting), until late successional species arise. This pattern tries to simulate natural
       processes of ecological succession, from pioneer species to climax vegetation.
       However, it requires several silvicutural practices and normally takes a long time.”
       (Schirone et al., 2011) “It was said that it would take 150-200 years in Japan to reach
       the final indegenous natural forests by secondary progressive succession and 300-500
       years in Southeast Asia. It is proved here that multistratal quasi-natural forests can be
       built in 15-20 years in Japan and 40-50 years in Southeast Asia by ecological
       reforestation based on the system of natural forests.” (Miyawaki, 1999)

                           Figure 1 – Ecological successions, (Marie, 2010)

                                                                                                 6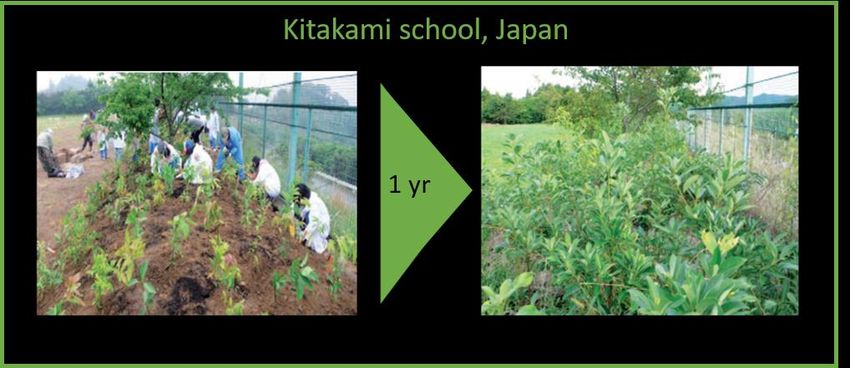
URBAN FORESTS COMPANY - 2020

       Figure 2 – Comparison between the classical theory and the new one (Miyawaki, 2004)

(3) Plant community: “We decide local community units by tablework comparing releves
    and grouping similar species combinations. Then we compare them with community
    units investigated and systematized in other parts of the world and see the species
    combinations. When we see species combinations, we find high-fidelity species for
    particular communities. These species are called character species. We decide
    phytosociological units based on the character species. We compare phytosociological
    units widely from natural forests to secondary communities, and decide "associations",
    basic units of a plant community system, which can be applied to worldwide vegetation
    science. Likewise, we group the units into alliances, orders and classes by species
    combinations. In this way the hierarchical vegetation community system is decided.”
    (Miyawaki, 1999)

                                                                                             7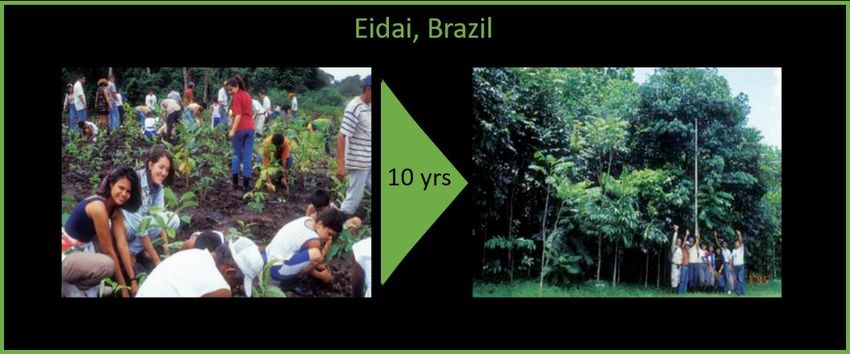
URBAN FORESTS COMPANY - 2020

   (4) Potential Natural Vegetation (PNV): “Potential vegetation is a concept of vegetation
       science, developed in Europe by Tuxen (1956). It does not imply an ecological climax,
       in the sense of Clements (1916) or a climax as a steady-state, in current American
       ecological terminology. Potential vegetation is an abstract concept of a vegetation
       made up of the plant species present in remnants of the plant cover, without human
       influence. The vegetation scientist studies patches of natural vegetation and, through
       understanding the relations of species to each other and the physical conditions of the
       site, reconstructs the potential patterns. The potential patterns give the ecological
       engineer an endpoint or a design goal to guide reconstruction.” (Miyawaki, 1993)

   (5) Cooperation: “Numerous studies indicate that the abundance, fitness, zonation, and
       perhaps even local existence of species are not simply due to abiotic conditions and
       competition, but are highly affected by direct positive interactions within the plant
       community and complex indirect positive interactions with consumers and mutualists.
       Perhaps our conceptual models of community organization should incorporate the idea
       of the abiotic environment as a template on which the effects of competitors,
       consumers, mutualists, and facilitators on community structure and diversity vary in
       intensity and importance. The ubiquity of positive interactions indicates that some plant
       communities may be “real entities'' (Van der Maarel 1996), albeit not necessarily with
       tidy, discrete boundaries.” (Callaway, 1997) “Low plant density has been traditionally
       retained as appropriate in arid and semiarid environments in order to avoid competition
       for water resources between plants (Caramalli 1973; Bernetti 1995), but it is now
       evident that cooperative processes, e.g., mutual shading, prevail over competitive
       processes (Callaway 1997).” (Schirone et al., 2011)

   4. Miyawaki forest growth data

   A. Multiple protective forest projects in Japan

Many reports written by Miyawaki provide averaged key values for micro-forests development
in Japan:

            ●   ’’By natural selection, the trees grow about 10 meters tall in 10
                years, and 20 meters tall in 20 years.” (Miyawaki, 2014)

            ●   “In about three years the trees grow 2 to 3 meters high, and the crown
                covering the forest floor comes to keep the sunlight from coming in.”
                (Miyawaki, 1999)

            ●   ““Though it was said to be difficult to restore native forests in the area
                because of dry air in summer and overgrazing, we have found that
                native forests can be restored if we take sufficient care for the first
                several years after planting.” (Miyawaki, 1999)

            ●   “It was said that it would take 150-200 years in Japan to reach the
                final indigenous natural forests by secondary progressive succession

                                                                                              8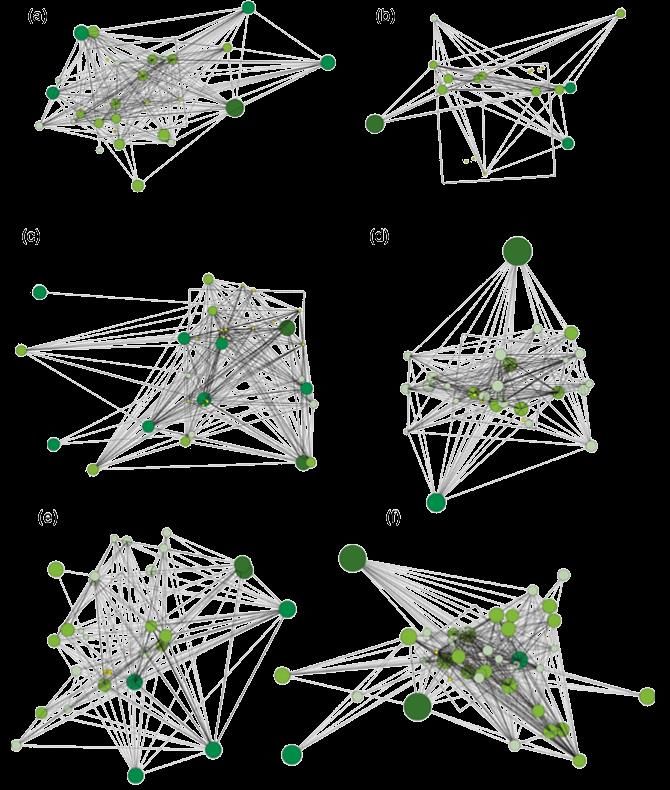
URBAN FORESTS COMPANY - 2020

                   and 300-500 years in Southeast Asia. It is proved here that
                   multistratal quasi-natural forests can be built in 15-20 years in Japan
                   and 40-50 years in Southeast Asia by ecological reforestation based
                   on the system of natural forests.” (Miyawaki, 1999)

              ●    “Field surveys have told us it is not climate conditions but soil
                   conditions that matter. […] In this way we have succeeded in
                   restoring quasinatural forests in 15–20 years in every region of
                   Japan.” (Miyawaki, 1999)

              ●    “On the average one person planted 20 seedlings in 1 h. The results
                   of these ecological plantations based on a vegetation-scientific
                   scenario are quite good. Seedlings that were only 30– 50 cm high
                   when planted grew to 7 m high after 10 years, higher than 10 m after
                   15 years, and form so called antidisaster environment protection
                   forests. […] Dense, mixed planting of 30–50 species of the potential
                   natural vegetation is in accordance with the system of natural forests,
                   and enables a multilayer forest to grow after 15–20 years by the
                   peculiarity of planted species. At some planting sites, however, even
                   after ecological dense, mixed planting, adequate natural selection is
                   not seen until 10–15 years after planting and some tall trees have
                   thin stems compared to their height. This problem will be solved in
                   time.” (Miyawaki, 2004)

              ●    “Among 550 locations of our planting throughout Japan we don't see
                   a single failure. We succeeded in restoration of native forests from in
                   cold-temperate zone to in tropical forest zone.” (Miyawaki, 1999)

              ●    “The green surface of a multi-stratal forest of the potential natural
                   vegetation is about thirty times as large as that of a mono-stratal
                   lawn, which needs periodical maintenance. As for absorbing and
                   accumulating CO2 multi-stratal native forests have a much larger
                   capacity than do lawns.” (Miyawaki, 1999)

 Figure 3 - Miyawaki forest in Kimitsu, May 2015 (“Google Maps,” n.d.) – The forest is probably part of the 1973
                                      project, hence it would be 47 year-old.

    B. Rainforest restoration project in Brazil

Miyawaki’s project for Mitsubishi (“Brazilian Project in Tropical Forest Regeneration,” n.d.)
makes reforestation trials on two locations : Belem, and Breves a secondary site. Belem site

                                                                                                               9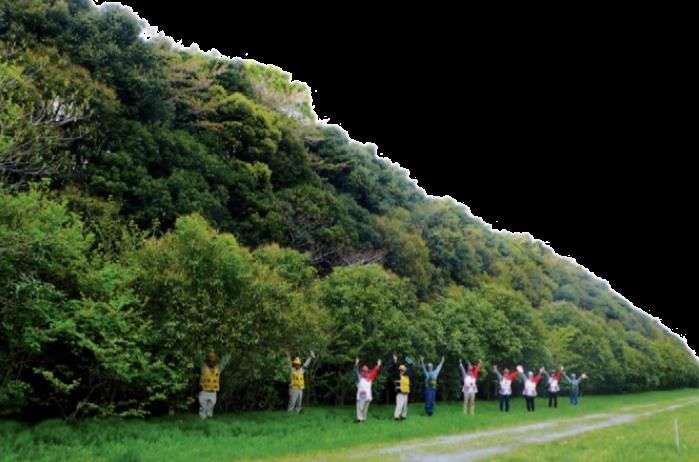
URBAN FORESTS COMPANY - 2020

does not develop as expected and does not satisfies Miyawaki and his team despite some
results. On the other side, Breves site yields excellent results. The following extracts (Miyawaki
and Abe, n.d.) (Miyawaki, 1998) summarize the project’s data and conclusions :

         “Fast-growing species like Balsa; Ochroma pyramidale and Boleira;
         Joannesia princeps, were 6 m high in 1994, 2 years after planting; 10 m high
         in 1996, 4 years after planting; and 15 m high in 1998, 6 years after planting.
         DBH measured up to 20–30 cm. The trees had grown magnificently, and
         the physiognomy was a quasinatural forest. However, in the field
         investigation of 2000 and 2001, we found that most of them had fallen down
         although they had not experienced very strong wind.” | “In the Belem forest,
         fast-growing pioneer species developed shallow horizontal roots before soil
         conditions changed to those of mature sites. The stems of these species
         broke and fell down in the somewhat strong winds. As a result, the broken
         pioneer stems killed many individuals of the PNV species, which waited in
         the lower layer.” | “The fallen trees prevented the growth of Virola spp. and
         the other main component species of the potential natural vegetation in the
         forest. Unfortunately, biodiversity there cannot be said to be adequate
         (Miyawaki & Abe 2002). For comparison studies we had planted potted
         seedlings of 14 species only from the potential natural vegetation, including
         Virola spp., on Breves Island, Brazil. They have grown steadily and
         reached 8–10 m to form a quasi-natural forest in 10 years. We saw great
         differences in growth between the two sites, Belém and Breves (Miyawaki &
         Abe in press).” | “In the Breves forest, unplanted species such as Cecropia
         spp., Vismia cayannensis, Synphonia globulifera, Bertholletia excelsa,
         Diplotropis purpuria were also recorded. These species might have invaded
         from surrounding forests.” | “The Breves forest grew well for 9 years,
         because of planting mainly Virola surinamensis, which composed the mature
         Varzea forest (Prance 1989; Worbes et al. 1992). In the future the Breves
         forest is expected to change to be more natural by self-thinning and
         invasion of native trees. From this study, we concluded that, for tropical
         forest restoration surely in the longterm, seedlings of species from the
         mature potential natural vegetation should mainly be used, if the
         number of species is not sufficient, and that planting pioneer species
         like pulpwood trees, which grow so fast, may be avoided unless other
         reasons suggest their utilization.” | “As a result, it can be said that restoration
         of diverse quasi-natural forests in a shorter period is attained from dense,
         mixed planting of main and companion tree species from the potential natural
         vegetation, following the system of natural forests with much care for soil
         conditions. It takes 15– 20 years in Japan and 30–40 years in the Torrid
         Zone.”

                                                                                               10
URBAN FORESTS COMPANY - 2020
Figure 4 – Growth rate of the main trees species, Belem / Brazil
Comparison between the maximal size and the
maximal DBH (Diameter at Breast Height) of
the trees in Belem and Breves
20
14,53
15 11,71 11,90
10,19
10
5
0
Maximum tree height (m) Maximum DBH (cm)
Belem Breves
Figure 5 - Charts made from table 4, (Miyawaki and Abe, n.d.)
C. Rainforest restoration project in Malaysia
Frequently, tropical rainforests are damaged and it is difficult to regenerate them:
“Since 1978 we have been researching in the tropical rainforest zone of Malaysia, Thailand
and Indonesia. The study results show that natural forests were completely destroyed in many
areas because of slash-and burn farming, felling trees and oil palm farming. Slash-and-burn
farming over a large area has destroyed every tree within a forest and it takes quite a long time
to see a forest naturally restored. Sometimes it is nearly impossible.” (Miyawaki, 2004)
However, the Miyawaki method is an interesting tool to speed up forest restoration. Miyawaki’s
team does an attempt in Bintulu as early as 1990, Miyawaki gives details about the forest
development (Miyawaki, 2011) :
● 1990-2011: “From 1990 to 2011, 350,000 seedlings from 126 tree species were planted
at four different areas and surrounding the nursery. Meanwhile, 100 research plots
11URBAN FORESTS COMPANY - 2020
were established and growth performances of planted seedlings were recorded twice
a year.”
● 2000: “15 tree species started flowering and fruiting in the plots established in
1991 to 1993. Some of the young seedlings have reached 4.5 meters in height. Seeds
of these tree species were collected and used for subsequent replanting.”
● 2011: “With time, the number of surviving plant species decreased because of natural
selection. Instead, surviving trees grew tall and thick, and form a splendid quasi-natural
multi-layered forest. Planted trees at Phase One area [1991] are about 15 m high.”
Figure 6 - Growth behavior of (a) tree height and (b) diameter of planted seedlings at Bintulu reforestation site,
Sarawak, Malaysia, based on vegetation surveys. (⬪) Baccaurea lanceolate (4) ; (■) Baccaurea macrocarpa (12) ;
(▲) Dracontomelon dao (20) ; (●) Eurycoma longifolia (10) ; (◊) Sandoricum koetjape (20) ; (□) Shorea dasyphylla
(92) ; (∆) Shorea leprosula (59) ; (○) Shorea mecistopteryx (77) ; (×) Shorea ovata (170). The numbers in
parenthesis are those of investigated trees. (Miyawaki, 2004)
Figure 7 – Growth curve in height on PQ 203 in Bintulu, Sarawak, Malaysia (left) ; Survival rate passage time on
PQ 203 in Bintulu, Sarawak, Malaysia (right). (Miyawaki, 1999)
One could wonder to what extent a Miyawaki forest grows faster than a naturally regenerated
forest. A study about young trees’ growth in Gabonese tropical forest windthrows (Hladik and
Blanc, n.d.) provides data from which rainforest usual growth rate can be estimated. On
average, trees grow at a pace of 20 cm/year over the five first years. Whereas Miyawaki
tropical forests rather grow at a pace of 110 cm/year.
12URBAN FORESTS COMPANY - 2020
D. An impossible task yet a success in some arid area in Sicilia
The following figures are extracted from the report about the first Miyawaki forest attempts
in dry climate (Schirone et al., 2011), on two sites: A and B. Reforestation in such places is
complicated and often fails. Thus, the method has been adapted. The results turned out to be
very encouraging. The price of this success? A high mortality rate, hence an intense natural
selection. In this way, very dense and resilient forests were obtained after 12 years. A high
mortality rate is not something negative: it simply indicates that the most adapted trees have
been selected.
Figure 8 – Mortality rates in experimental fields. Percentage measured during three surveys for each species on
site A (a); result on site B (b). X-axis labels refer to the species acronyms, (Schirone et al., 2011)
Sites A and B (Miyawaki Forests A and B) were compared to parts of traditionally reforested
sites with forests around 15 years old (Control Forests A and B). It seems that the Miyawaki
method in arid zone guarantees a greater density for trees of identical size to those obtained
with conventional reforestation techniques: ‘’Although mean height of species common to all
study areas does not differ significantly, plant density on site A is around four times higher than
on [Control forest A] and five times on [Control forest B], whereas on site B, maritime pine
densities are 3 and 4.5 times higher than on traditional reforested plots were observed.”
(Schirone et al., 2011)
Figure 9 – Chart made from table 5, (Schirone et al., 2011)
13URBAN FORESTS COMPANY - 2020
Figure 10 – Chart made from table 5, (Schirone et al., 2011)
The report provides a favorable conclusion to the use of Miyawaki method and sums up the
changes to be done:
‘‘The Miyawaki method could offer a quicker and more effective reforestation approach in the
Mediterranean environment, adopting naturalistic theoretical principles not previously tested in
Mediterranean Europe, which has the additional challenge of a seasonal climate characterized
by summer aridity compounded in several cases by winter cold, and also by thin soils. Here
we provide a comparison between the Miyawaki method and two other reforestation methods
(gradoni and holes) traditionally applied in Mediterranean countries. The results showed a
more rapid development of trees on the Miyawaki plots, in particular, early-successional
species. The benefits over previous methods are remarkable and comparable with those
obtained by Miyawaki in Asia and South America. At the same time, some of the changes
made in this study to better fit the method to the Mediterranean environment seem to be
particularly useful. First, we used tillage to improve soil water storage over the winter and
reduce water stress during the summer. Summer aridity implies the soil would be able to stock
winter rainfalls in order to allow the plants avoiding water stress of the next season. This
outcome has been achieved using tillage; such action is necessary and should be enough,
even if it would be possible to get a better performance by adding compost or local soil.
Mulching with green material does not seem effective (Navarro-Cerrillo et al. 2009), whereas
mulching with dry material has been useful. Moreover, avoiding clearing all bush is opportune
for the Mediterranean environment, in contrast with some studies.” (Schirone et al., 2011)
E. Biodiversity project in Netherlands
In Zaanstad in the Netherlands, two Miyawaki micro-forests were created in 2015. In 2017, a
study (Alterra - Animal ecology et al., 2018) was carried out over a full year in order to compare
the biodiversity in these forests (in green below) with the one from surrounding woods (in brown
below).
14URBAN FORESTS COMPANY - 2020
Comparaison de la biodiversité (faune) entre forêts
Miyawaki et forêts témoins
1750
14218,5
800 758 860
671
700 280,5
600
486
500
400 364
306,5 296 317,5
236,5
300
215 14,5
200 11 153,5 169,5
0,5 49 107 0 18,5
40 50 60 3,5 79,5 73,5
100 35,5 2 11,5 12 9
9 2
0 0 0 4 2 3 7 0 1
0
Forêts Miyawaki (2-3 ans) Forêts témoins (âge indéterminé > 10 ans)
Figure 11 – Chart made from the report (Alterra - Animal ecology et al., 2018)
The results are clear: the Miyawaki micro-forests, although very recent, are much richer
in biodiversity, from 2 to 162 times more, on average 18 times more.
5. Comparisons between climates
Figure 12 – Volume indicator « D²H » at a tropical rainforest zone in Malaysia and a laurel forest in Japan. (■)
Bintulu/Borneo (27.3 t ha-1.y) ; (●) Ohgishima/Tokyo Bay (16.6 t ha-1.y). (Miyawaki, 1999)
If we simply observe the volume of vegetation formed in a tropical Miyawaki forest and a
temperate Miyawaki forest in Japan, it appears that the Miyawaki forest in the temperate zone
15URBAN FORESTS COMPANY - 2020
grows more slowly. But the difference is not immense: in 3 to 6 years depending on the stage
of growth, the temperate forest overtakes the tropical forest. For two very different climates,
the development gaps are therefore rather small. Miyawaki reports on the prevalence of the
soil and not the climate in the development of the forest: ‘’Field surveys have told us it is not
climate conditions but soil conditions that matter.” (Miyawaki, 1999)
In addition, the observation of a biomes map indicates that similar types of forests grow in
Japan and in Europe:
➔ We can therefore assume that the development of Miyawaki forests in Europe is
on average similar to that recorded in Japan.
16URBAN FORESTS COMPANY - 2020
6. Micro-forest benefits
Even if the benefits delivered by the Miyawaki forests as such have not all been the subject
of studies, it is nevertheless possible to rely on studies of urban forests in general. Miyawaki
forests’ particularities will be taken into account.
Urban forest benefits
Temperature reduction : -2℃ minimum, locally
Air quality improvment, pollution clustering : absorbtion of 15% microparticules,
leaves and bark intercept dust.
Noise reduction : -10 dB for a mature Miyawaki forest
Health and well-being : reduction of stress, anxiety, solitude, cardio-vascular et
respiratory diseases.
Biodiversity balance : biodiversity is on average 18 times higher, pest concentration
can be lower, the forest ensures transfers and biodiversity increase in urban context.
Soils stability : the entanglement of roots forms a matrix-pillar system that retains
soils
CO2 sequestration : stock = 60 kgC/m2 forest cover, flux = 0.5 kgC/m2 forest cover/
year. 100 m² of Miyawaki forest long-term compensates one year of a european
person’s carbon emissions.
Real estate prices : properties with tree cover can see their price increase by a few
thousands of euros
A. Temperature reduction
The study (Long et al., 2019) focuses on the temperature difference between trees
according to their location : isolated decorative trees (landscape), urban forests edge trees
(edge) and trees within the urban forests (interior).
Figure 13 – The different studied locations are marked with a star. (Long et al., 2019)
17URBAN FORESTS COMPANY - 2020
The surveys are carried out at the canopy level, there is a significant difference in
temperature between the isolated trees and the forest trees, up to 2 ℃ less in the
forest.
Figure 14 The effects of tree location on canopy temperature illustrated using boxplots to demonstrate the range
of values obtained. The median of the data range is marked by the line which divides each box. Boxes represent
the interquartile range and upper and lower whiskers represent data outside the middle 50% of observations.
Asterisks indicate significant differences from Tukey HSD tests. The average canopy temperature of urban
landscape trees (n=16)was significantly greater than it was for trees growing at urban forest fragment edge(n=16)
or interior(n=16). (Long et al., 2019)
As for whether urban forests create micro-climates, in other words, if nearby people can benefit
from this additional freshness; the following study (Howe et al., 2017) shows that they do. The
study used a network of 10 identical weather stations and high-resolution land cover and land
use data in Knoxville, Tennessee, to analyze the microclimates of a mid-sized city with a
temperate climate.
Figure 15 - Location of monitoring stations, national land use data 2011
18URBAN FORESTS COMPANY - 2020 The challenge is clearly described: ‘’Increasingly extreme heat waves are frequent in city centers, and their increase is very likely given climate change. […] The heat island is a widely documented phenomenon, due to urbanization. It is characterized by locally higher temperatures in a city than in the other surrounding spaces, day and night. […] Thus, it is urgent to determine how to live in urban environments sustainably and in line with public and ecological health.’’ I ‘’These data can be used as support for the development of plans aimed at strengthening resilience extreme heat in urban environments, taking into account the influence of forest cover.’’ In the following table, two values are important for the analysis. The p value shows that the results are statistically significant when p
URBAN FORESTS COMPANY - 2020

   Air quality in western (North American) cities has been assessed using models based on
environmental databases and simulations (eg i-Tree) : ‘’Despite the limitations, there are
several advantages to the modeling estimates, which include the use of best available tree,
weather, population and pollution data, modeling of tree effects on hourly pollution
concentrations and modeling of pollution effects on human health.’’ (Nowak et al., 2014)
The capacity of urban forests covers to reduce pollution over a year has been calculated by
pollutant type (CO, NO2, O3, PM2.5, SO2). The health and economic benefits are also
examined.
The conclusions (Nowak et al., 2018) are the following :

            •   ’The total amount of pollution removal in the 86 cities in 2010 was
                16,500 t (range: 7500 t to 21,100 t), with a human health value of
                $227.2 million (range: $52.5 million to $402.6 million).’’

            •   ‘’Maximum annual air quality improvement among the cities
                averaged around 0.01 percent for CO, 2 percent for NO2, 3 percent
                for SO2, 4 percent for O3 and 15 percent for PM2.5.’’

            •   ‘’The greatest effect of urban trees on ozone, sulfur dioxide, and
                nitrogen dioxide is during the day time of the in-leaf season when
                trees are transpiring water. Particulate matter removal occurs both
                day and night and throughout the year as particles are intercepted by
                leaf and bark surfaces. Carbon monoxide removal also occurs both
                day and night of the in-leaf season, but at much lower rates than for
                the other pollutants.’’

            •   ‘’Ozone studies that integrate temperature, deposition and emission
                effects of trees are revealing that urban trees can reduce ozone
                concentrations.’’

            •   ‘’Under stable atmospheric conditions (limited mixing), pollution
                removal by trees could lead to a greater reduction in pollution
                concentrations at the ground level. Large stands of trees can also
                reduce pollutant concentrations in the interior of the stand due to
                increased distance from emission sources and increased dry
                deposition (e.g., Dasch, 1987; Cavanagh et al., 2009).’’

            •   ‘’Forest canopies can limit the mixing of upper air with ground-level
                air, leading to significant below-canopy air quality improvements.’’
The study also mentions a few negative effects:

            •   ‘’However, where there are numerous pollutant sources below the
                canopy (e.g., automobiles), the forest canopy could have the inverse
                effect by minimizing the dispersion of the pollutants away at ground
                level.’’

            •   ‘’Air pollution removal is only one aspect of how urban trees affect air
                quality. Trees reduce air temperatures, which can lead to reduced
                emissions from various anthropogenic sources (e.g., Cardelino and
                Chameides, 1990). Trees around buildings alter building energy use
                (e.g., Heisler,1986) and consequent emissions from power

                                                                                          20
URBAN FORESTS COMPANY - 2020
plants.Trees reduce wind speeds, lowering mixing heights and can
therefore increase pollution concentrations (e.g., Nowak et al.,
2006a). Trees also emit pollen, which affects allergies (e.g., Ogren,
2000), and volatile organic compounds (VOCs) that are precursor
chemicals to O3 and PM2.5 formation (e.g., Chameides et al., 1988;
Hodan and Barnard, 2004).’’
The study sums up the conditions to avoid to enhance trees’ positive effect on air quality:
‘’At the local scale, pollution concentrations can be increased if trees:
a) trap the pollutants beneath tree canopies near emission sources
b) limit dispersion by reducing wind speeds, and/or
c) lower mixing heights by reducing wind speeds (Nowak et al., 2006a).
These local scale interactions are important for determining the net effect of
trees on air quality and human health.’’
C. Noise reduction
Figure 17 - Scale of auditory decibels and associated soundscape. A difference of 10 dB (A) allows to change the
sound environment
Traditional noise barriers allow a noise reduction of ten decibels A. This corresponds
to the difference that human beings perceive between the noise of a highway (70 dB) and a
normal voice (60 dB). Some studies focus in increasing the performance of noise barriers by
adding vegetation. It appears that a noise barrier with approximately 30 cm of vegetation on
each of its faces reduces the sound by an additional 3 dBA. Vegetation can also be used
directly as a noise barrier, in the form of an urban forest. The study (Ow and Ghosh, 2017)
analyses the noise reduction resulting from urban forests along highways. It takes into account
the porosity of the soil, the presence of plant cover, its density, its thickness, as well as the
21URBAN FORESTS COMPANY - 2020
thickness of the trunks. The results show a reduction in noise of the order of 10 dB in the most
favorable cases, that is to say a medium to high density, a 20-meter-thick forest and 20-
centimeter-thick trunks. It is also mentioned that the best cost / benefit balance is obtained with
a 5-meter-thick forest. The study also reports the results of other studies, for example,
indicating a reduction of 12 dBA by a 20-meter-thick urban forest. Performance is even better
if the noise barrier forest is located less than 15 meters away from the road. Ultimately, a
Miyawaki forest is one of the favorable combinations with its medium to high density. By
the age of 15 the trunks can reach 20 cm thickness and can therefore place the forest in optimal
conditions to reduce noise pollution. Thus, an anti-noise forest continues to improve its
performance from year to year as it develops. It represents an alternative to noise
barriers or an inexpensive and aesthetically appreciated addition.
Figure 18 - Examples of reference and abatement experimental set ups for numerical predictions.
D. Health and well-being
The study (Donovan et al., 2013) reports on the consequences of the loss of 100 million trees
in the United States because of the emerald ash borer. Data collected between 1990 and 2007
lead to the following conclusions: “There has been an increase in mortality from cardiovascular
and lower respiratory diseases in the counties infested with the emerald ash borer. The
magnitude of this effect was greater as the infestation progressed and in counties with median
household incomes above the average. In the 15 states in the study area, emerald cherry [loss]
was associated with 6,113 additional deaths related to lower respiratory tract disease and
15,080 cardiovascular deaths. […] This finding is added to the growing evidence that the
natural environment has major benefits for public health.”
The effects of a green setting (for example, an urban forest) on well-being are observed by
studying the level of anxiety, stress, and depression. Among others:
• A study carried out in an underprivileged district shows a drop in the level of stress
hormone (cortisol): ‘’Results indicate significant relationships between self-reported
stress (pURBAN FORESTS COMPANY - 2020
URBAN FORESTS COMPANY - 2020

This series of studies (1, 2, 3, 4) systematically shows the presence of physical, mental,
and social benefits.

                   Figure 20 – Benefits of environmental civism for health, (Townsend, 2006)

   Figure 21 - Differences in means on key variables in the study of volunteers for the Trust for Nature (TfN),
                                              (Townsend, 2006)

   E. Biodiversity balance

A. Miyawaki (Miyawaki and Box, 2006) expresses the completeness of an ecosystem and its
ability to regenerate from fragments: ‘’The variety of species in a biological community is called
biodiversity, a term that emcompasses both the number of species (species richness) and
some aspects of the relative abundance of the different species. A more comprehensive
concept of biological diversity is that of biological complexity, which includes diversity not
only in entities but also in the many functional relationships just suggested. No one creature
monopolizes the available space and energy; rather, these ressources are shared. Thus, within
the biological community, the habitats of the member populations are segrated, horizontaly
and verticaly, according to each group's mode of life. For example, a forest consists of an
overstorey tree layer, a ground layer of herbaceous plants, possibly a layer of mosses or
lichens directly on the ground, and certainly an underground system of roots. All these
components, above and below ground, divide the living space three-dimensionlly and
coexist while competing with one another. To a certain extent, a biological community can
restore a destroyed portion of itself by re-forming its living environment anew or by
relocating itself.’’
The study (Sullivan et al., 2009) reports on this phenomenon by which the urban forest gains
in biodiversity and subsequently serves as a reservoir and relay of biodiversity : ‘’Site
colonization by native species was particularly high at sites ≤ 100 m from existing native
vegetation, suggesting that even small patches of native vegetation in urban landscapes
will be valuable as seed sources for accelerating native plant establishment at nearby
receptive sites.’’

                                                                                                                  24
URBAN FORESTS COMPANY - 2020
The previously cited study (4.E) conducted in the Netherlands on the Miyawaki forests of
Zaanstad shows an average biodiversity 18 times higher in the two Miyawaki forests studied
than in a conventional forest. Even though these Miyawaki forests (in green below) are very
young, and the control forests (in brown below) are much older.
Comparaison de la biodiversité (faune) entre forêts
Miyawaki et forêts témoins
1750
758 14218,5 860
800
671
700 280,5
600
486
500
364
400 306,5 317,5
296 236,5
300 14,5
215
200 11 153,5 169,5
0,5 49 107 79,5 73,5 0 18,5
40 50 60 3,5
100 9 35,5 20 4 2 11,5 12
0 0 2 3 7 0 91
0
Forêts Miyawaki (2-3 ans) Forêts témoins (âge indéterminé > 10 ans)
Figure 22 – Chart made from data from the report (Alterra - Animal ecology et al., 2018)
Furthermore, another study (Long et al., 2019) shows another advantage. In some cases, trees
in the form of an urban forest host fewer invasive and parasitic species than single trees. Three
positions were tested: isolated as decorative trees (landscape), on the edge of an urban forest
(edge) and within an urban forest (interior). The following statement relates to a parasitic wasp
of the hymenoter family.
Figure 23 - Effect of tree position on parasitoid wasp abundance. The total number of parasitoid hymenopterans
captured on sticky cards from three families (Aphelinidae, Encyrtidae, and Signophoridae) were more numerous
in landscape trees (n=13) than either forest fragment edge (n=12) or interior trees (n=11). Post hoc nonparametric
multiple comparisons from Steel-Dwass all pairs test. Asterisks indicate significant differences (PURBAN FORESTS COMPANY - 2020
F. Soils stability and natural disaster prevention
In his study (Miyawaki, 2014), Miyawaki observes native trees after the 2011 tsunami
(photos below). He concluded on the protective role of native trees. The well-rooted trees
served as protection, and their roots retained part of the soil (b) This is not the case for non-
native conifers originally planted for protection (c), their weak rooting failed to resist and the
trunks swept away by the tsunami created even more damage.
Figure 24 – (a) General view after the 2011 tsunami (b) A native tree and its root system that enabled it to resist
and maintain the soil (c) Protective conifers that did not fulfill the intended function (Miyawaki, 2014)
Figure 25 - Schematic representation of the combined effects of trees, shrubs and herbaceous species in their
early stages of development on the stabilization of surface slopes
According to (Burylo et al., 2011) fine roots are proportionally more resistant to tensile forces
due to their elasticity. Large diameter roots can withstand higher absolute forces but are more
rigid and brittle. Diversified vegetation forms a complementary matrix-pillar system, by
entangling the horizontal and pivot root systems. The study concludes on the interest of taking
vegetation into account in the study of soil stability: ‘’Combined with the knowledge on
vegetation dynamics, ecological site properties and species resistance to erosion, these
results can help in evaluating land vulnerabilty to erosion and the efficiency of restoration
actions in eroded marly lands.’’ (Burylo et al., 2011)
G. CO2 balance sheet
26URBAN FORESTS COMPANY - 2020
Forests are the second largest carbon stock on Earth after the oceans. For a given
area in France, forests absorb each year 15 times more carbon than meadows. The
recent report (“La séquestration de carbone par les écosystèmes en France,” 2019) of
EFESE (French Assessment of Ecosystems and Ecosystem Services) on carbon
sequestration indicates the following figures:
Table 1 – National carbon sequestration data
Metropolitan French forests
EFESE 2019 values Units
(biomass + soil)
Surface 17 158 000 ha
Carbon stock 10 263 000 000 tCO2eq
Sequestration flow 87 000 000 tCO2eq/an
The following terms are defined as such:
- The current carbon stock in situ: this is the average amount of carbon contained in
the compartment [in this case the forest ecosystem] considered as observed today (in
tCO2eq / ha).
- The current sequestration flow: it is the average annual carbon sequestration flow
in the compartment [in this case the forest ecosystem] considered, as it is currently
observed (in tCO2eq / ha / year).
These data take into account the role of forest soil in carbon retention.
It can be noted that these average values bring together those of different types of forest
ecosystems: ’’Thus, in the continental biogeographical region, carbon stocks in deciduous
closed forest are among the highest, of the order of 730 tCO2eq / ha whereas those in the
Mediterranean biogeographical region, notably made up of low-productivity holm oak coppices,
have much lower carbon stocks, of the order of 500 tCO2eq / ha.’’ (“La séquestration de
carbone par les écosystèmes en France,” 2019)
The values of the EFESE flows were compared with the values of a similar Inra survey, and
with the values of the UTCATF national inventory (Land use, land use change and forestry)
that did not take into account the impact of the soil. Aside from assumption differences, values
are close for each category.
MtCO2eq/year Total flow Dead wood and soils flow Biomass flow Land use change
(M=million) flow
EFESE 86.8 21.8 65 0
Inra (2017) for 88 17.6 70.4
2013 (dead wood 10.3 ; soils 7.3) (broadleaves 56 ; conifers 14.4)
UTCATF 62 0 55 7
Figure 26 - Comparisons of major data on carbon sequestration flows in a forest environment (“La séquestration
de carbone par les écosystèmes en France,” 2019)
The following table displays the results of calculations for a Miyawaki forest of medium
age, with an area of 100 m², soil sequestration included:
27URBAN FORESTS COMPANY - 2020
Table 2 – Carbon sequestration data applied to a 100 m² Miyawaki forest
Values calculated
100 m² Miyawaki
from EFESE 2019 Units
forest
values
Surface 100 m²
Carbon stock 5980 kgCO2eq
Sequestration flow 50,7 kgCO2eq / year
According to these data, the biomass and soil of a Miyawaki forest of 100 m2 and of
average age (a few decades) therefore represents a stock of 5980 kg of CO2 equivalent,
i.e. two thirds of annual carbon emissions of a European person (average: 8400 kg of
CO2 equivalent / person / year in the EU), or even the total annual carbon emissions of a
Swedish. (“Empreinte carbone − Indicateurs de richesse nationale | Insee,” n.d.). In other
words, a European with very reasonable emissions can hope in the long term to offset
one year of carbon emissions per 100 m² lot of planted Miyawaki forest.
After stabilization, the micro-forest sequesters 50.7 kg of additional CO2 equivalent each
year, the equivalent of the carbon emissions of a European over more than two days.
These calculations readily overlap with a figure regularly cited by the ONF (Office National des
Forêts): a 5 m³ tree can store 5 tonnes of carbon. However, a Miyawaki forest represents,
according to estimates, around 400 m³ / ha of tree biomass after about fifteen years. Which is
4 m³ per 100 m², so a stock of 4 tonnes of CO2 equivalent (a lower figure because the soil
action is not taken into account).
The study from (Nowak and Greenfield, 2010) et (Nowak et al., 2013) is also very popular but
does not incorporate the storage of forest soils either. Annual sequestration is estimated from
the total carbon accumulated during tree growth, subtracted from the estimated amount of
carbon lost during decomposition of dead trees. The average annual value of total carbon
accumulated as a stock by urban forests in the United States is 7.69 kgC / m2 of forest cover
(standard error (SE) = 1.36 kgC / m2). Estimates of annual sequestration (flow) vary according
to the length of the growing seasons, the average value is 0.226 kgC / m2 / year (SE = 0.045
kgC / m2 / year). Values range from 0.430 kgC / m2 / year (Hawaii) to 0.135 kgC / m2 / year
(Wyoming).
H. Impact on real estate prices
A study (Escobedo et al., 2015) conducted in Florida screens the impact of different vegetation
types on real estate prices : “Results, on average, indicate trade-offs in that more trees with
greater Leaf Area Indices (LAIs) [Individual LAI is the amount of one-sided leaf surface area
(m2) over ground unit area (m2) and is often used as a proxy for the amount of tree crown
density and overall tree health] add to property value, while biomass and tree–shrub cover
have a neutral effect, and replacing tree with grass cover has lower value. On average,
property value increased by $1586 per tree and $9348 per one-unit [400 m2] increase in
LAI, while increasing maintained grass from 25% to 75% decreased home value by $271.”
(Escobedo et al., 2015)
Hence, the presence of a tree cover in the properties increases their price by several
thousand euros.
28URBAN FORESTS COMPANY - 2020
In Europe, climate change is increasing the average temperatures in certain areas,
especially during summer. The results put forward by this study of subtropical Florida
may then be relevant in a European context.
7. Tree exchanges
Recent report (Fournier and Moulia, 2018) takes stock of current knowledge regarding tree
communication: ‘’The messages sent are, for example, electric signals transmitted inside
the plant, or chemical substances diffused to other parts of the plant. The most
spectacular are the alert messages: for example, when a leaf is attacked by a caterpillar, a
molecule, the systemin, is transported by the sap, and quickly warns the other leaves which
can set up defense reactions, for example by producing substances toxic to the animal. These
chemical messages are also volatile substances released into the air, which warn other plants
or attract caterpillar predators. If we consider that communication is the emission of a signal
followed by its reception inducing a change of attitude, we can speak of plant communication.’’
Trees can also transfer water to each other, through their roots or connecting fungi networks:
‘’We found up to 21.6% of the water in a seedling could be supplied by HR from a source tree.
The average value was substantially lower, only 1.8% after two weeks and 4.9% after three
weeks. This is an approximate estimate […] but it does highlight the potential importance of
HR for seedlings surrounding residual trees.’’ (Schoonmaker et al., 2007) It can be estimated
that hydraulic redistribution is usually low, but it can reach up to 20% when stress
occurs.
Also, there are some carbon (C) transfers. Carbon is an essential element for green plant
storage and energy: ‘’We showed that mycorrhizal networks exist in tundra, and facilitate
belowground transfer of C among Betula nana individuals, but not between or within the other
tundra species examined. Total C transfer among conspecific B. nana pairs was 10.7 ±
2.4% of photosynthesis, with the majority of C transferred through rhizomes or root
grafts (5.2 ± 5.3%) and mycorrhizal network pathways (4.1 ± 3.3%) and very little through
soil pathways (1.4 ± 0.35%).’’ I ‘’Below-ground C transfer was of sufficient magnitude to
potentially alter plant interactions in Arctic tundra, increasing the competitive ability and mono-
dominance of B. nana. C transfer was significantly positively related to ambient temperatures,
suggesting that it may act as a positive feedback to ecosystem change as climate warms.’’
(Deslippe and Simard, 2011) While a laboratory experiment, similar observations have been
recorded for different species (diagram below).
29URBAN FORESTS COMPANY - 2020
Figure 27 - Microscosms and labeling chambers. The gas (carbon dioxide) marked by two different isotopes is
injected into each room (one type per room). Carbon progression is recorded, leading to the observation of
carbon transfers between the two species via mycorrhizal networks.(Simard et al., 1997)
As mentioned above, mushrooms are connected to trees in the form of mycorrhizal networks,
themselves connected to each other, thus connecting the trees together. The mushrooms
serve as root extension. The oldest trees often have very developed mycorrhizal
networks, allowing them to be strongly connected to the trees of the forest, they are
called central trees or mother trees. The study (Beiler et al., 2015) is interested in the
complexity of these networks, illustrating the concept of central tree by surveying the DBH
(diameter) of trees correlated to their age, and their degree of connection (node degree).
Within the same species, the more mature the tree, the higher its degree of connection
to others.
Figure 28 - Large mature trees acted as hubs with a significantly higher node degree than smaller trees. The
colors correspond to different types of soil and fungi, we observe an increase in all cases even if subtle for two
cases.(Beiler et al., 2015)
30URBAN FORESTS COMPANY - 2020
The following study illustrates forest tree networks with schemes:
Figure 29 - Network models depicting the socio-spatial topology of tree-mycorrhizal fungus interaction networks in
100 m plots with xeric (a-c) or mesic (d-f) soil moisture regimes (squares show plot boundaries, models shown at
different scales). Nodes (circles) are Psuedotsuga menziesii trees, sized relative to tree diameter and darkening
in colour with increasing age class, and links represent the number of Rhizopogon spp. genotypes shared
between trees (shown by line heaviness). (Beiler et al., 2015)
31URBAN FORESTS COMPANY - 2020
References
Alterra - Animal ecology, PE&RC, Ottburg, F., Lammertsma, D., Bloem, J., Dimmers, W.,
Jansman, H., 2018. Tiny Forest Zaanstad : citizen science and determining biodiversity
in Tiny Forest Zaanstad. Wageningen Environmental Research, Wageningen.
https://doi.org/10.18174/446911
Beiler, K.J., Simard, S.W., Durall, D.M., 2015. Topology of tree-mycorrhizal fungus interaction
networks in xeric and mesic Douglas-fir forests. J. Ecol. 103, 616–628.
https://doi.org/10.1111/1365-2745.12387
Brazilian Project in Tropical Forest Regeneration [WWW Document], n.d. . Mitsubishi Corp.
URL
https://www.mitsubishicorp.com/jp/en/csr/contribution/environment/activities03/activiti
es03-04.html (accessed 3.26.20).
Burylo, M., Hudek, C., Rey, F., 2011. Soil reinforcement by the roots of six dominant species
on eroded mountainous marly slopes (Southern Alps, France). CATENA 84, 70–78.
https://doi.org/10.1016/j.catena.2010.09.007
Deslippe, J.R., Simard, S.W., 2011. Below-ground carbon transfer among Betula nana may
increase with warming in Arctic tundra. New Phytol. 192, 689–698.
https://doi.org/10.1111/j.1469-8137.2011.03835.x
Empreinte carbone − Indicateurs de richesse nationale | Insee [WWW Document], n.d. URL
https://www.insee.fr/fr/statistiques/3281683?sommaire=3281778#consulter (accessed
4.20.20).
Escobedo, F.J., Adams, D.C., Timilsina, N., 2015. Urban forest structure effects on property
value. Ecosyst. Serv. 12, 209–217. https://doi.org/10.1016/j.ecoser.2014.05.002
Fournier, M., Moulia, B., 2018. Sensibilité et communication des arbres: entre faits
scientifiques et gentil conte de fée. 11.
Google Maps [WWW Document], n.d. . Google Maps. URL
https://www.google.com/maps/@35.3457647,139.88057,3a,75y,79.72h,104.37t/data=
!3m6!1e1!3m4!1spQ2hPfK1i5fL8DpUPXAejA!2e0!7i13312!8i6656 (accessed 4.1.20).
Han, K.-T., 2017. The effect of nature and physical activity on emotions and attention while
engaging in green exercise. Urban For. Urban Green. 24, 5–13.
https://doi.org/10.1016/j.ufug.2017.03.012
Hladik, A., Blanc, P., n.d. Croissance des plantes en sous-bois de forêt dense humide
(Makokou, Gabon) 15.
Howe, D.A., Hathaway, J.M., Ellis, K.N., Mason, L.R., 2017. Spatial and temporal variability of
air temperature across urban neighborhoods with varying amounts of tree canopy.
Urban For. Urban Green. 27, 109–116. https://doi.org/10.1016/j.ufug.2017.07.001
La séquestration de carbone par les écosystèmes en France, 2019. 102.
Long, L.C., D’Amico, V., Frank, S.D., 2019. Urban forest fragments buffer trees from warming
and pests. Sci. Total Environ. 658, 1523–1530.
https://doi.org/10.1016/j.scitotenv.2018.12.293
Marie, O., 2010. Les successions écologiques.
Miyawaki, A., 2014. The Japanese and Chinju-no-mori Tsunami-protecting forest after the
Great East Japan Earthquake 2011. Phytocoenologia 44, 235–244.
https://doi.org/10.1127/0340-269X/2014/0044-0571
Miyawaki, A., 2011. Rehabilitation of Tropical Rainforest Ecosystems 6.
Miyawaki, A., 2004. Restoration of living environment based on vegetation ecology: Theory
and practice: Restoration of living environment. Ecol. Res. 19, 83–90.
https://doi.org/10.1111/j.1440-1703.2003.00606.x
Miyawaki, A., 1999. Creative Ecology: Restoration of Native Forests by Native Trees. Plant
Biotechnol. 16, 15–25. https://doi.org/10.5511/plantbiotechnology.16.15
Miyawaki, A., 1998. Restoration of urban green environments based on the theories of
vegetation ecology. Ecol. Eng. 11, 157–165. https://doi.org/10.1016/S0925-
8574(98)00033-0
32URBAN FORESTS COMPANY - 2020
Miyawaki, A., 1993. Forest reconstruction as ecological engineering.
Miyawaki, A., Abe, S., n.d. Public awareness generation for the reforestation in Amazon
tropical lowland region 7.
Miyawaki, A., Box, E.O., 2006. The healing power of forests. The philosoohy behind restoring
Earth’s balance with native trees., Kosei Publishing Co. Tokyo. ed.
Nowak, D.J., Greenfield, E.J., 2010. Evaluating The National Land Cover Database Tree
Canopy and Impervious Cover Estimates Across the Conterminous United States: A
Comparison with Photo-Interpreted Estimates. Environ. Manage. 46, 378–390.
https://doi.org/10.1007/s00267-010-9536-9
Nowak, D.J., Greenfield, E.J., Hoehn, R.E., Lapoint, E., 2013. Carbon storage and
sequestration by trees in urban and community areas of the United States. Environ.
Pollut. 178, 229–236. https://doi.org/10.1016/j.envpol.2013.03.019
Nowak, D.J., Hirabayashi, S., Doyle, M., McGovern, M., Pasher, J., 2018. Air pollution removal
by urban forests in Canada and its effect on air quality and human health. Urban For.
Urban Green. 29, 40–48. https://doi.org/10.1016/j.ufug.2017.10.019
Ow, L.F., Ghosh, S., 2017. Urban cities and road traffic noise: Reduction through vegetation.
Appl. Acoust. 120, 15–20. https://doi.org/10.1016/j.apacoust.2017.01.007
Schirone, B., Salis, A., Vessella, F., 2011. Effectiveness of the Miyawaki method in
Mediterranean forest restoration programs. Landsc. Ecol. Eng. 7, 81–92.
https://doi.org/10.1007/s11355-010-0117-0
Schoonmaker, A.L., Teste, F.P., Simard, S.W., Guy, R.D., 2007. Tree proximity, soil pathways
and common mycorrhizal networks: their influence on the utilization of redistributed
water by understory seedlings. Oecologia 154, 455–466.
https://doi.org/10.1007/s00442-007-0852-6
Simard, S.W., Jones, M.D., Durall, D.M., Perry, D.A., Myrold, D.D., Molina, R., 1997.
Reciprocal transfer of carbon isotopes between ectomycorrhizal Betula papyrifera and
Pseudotsuga menziesii. New Phytol. 137, 529–542. https://doi.org/10.1046/j.1469-
8137.1997.00834.x
Sullivan, J.J., Meurk, C., Whaley, K.J., Simcock, R., 2009. Restoring native ecosystems in
urban Auckland: urban soils, isolation, and weeds as impediments to forest
establishment. N. Z. J. Ecol. 33, 12.
Townsend, M., 2006. Feel blue? Touch green! Participation in forest/woodland management
as a treatment for depression. Urban For. Urban Green. 5, 111–120.
https://doi.org/10.1016/j.ufug.2006.02.001
33You can also read