Fish associations with shallow water subsea pipelines compared to surrounding reef and soft sediment habitats
←
→
Page content transcription
If your browser does not render page correctly, please read the page content below
www.nature.com/scientificreports
OPEN Fish associations with shallow
water subsea pipelines compared
to surrounding reef and soft
sediment habitats
Karl D. Schramm1, Michael J. Marnane2, Travis S. Elsdon2, Christopher M. Jones3,
Benjamin J. Saunders1, Stephen J. Newman1,4 & Euan S. Harvey1*
Offshore decommissioning activities are expected to increase as oil and gas subsea infrastructure
becomes obsolete. Decisions on decommissioning alternatives will benefit from quantifying and
understanding the marine communities associated with these structures. As a case study, fish
assemblages associated with an inshore network of subsea pipelines located on the North West shelf
of Western Australia were compared to those in surrounding natural reef and soft sediment habitats
using remotely operated vehicles fitted with a stereo-video system (stereo-ROVs). The number of
species, the abundance, biomass, feeding guild composition and the economic value of fishes were
compared among habitats. The community composition of fish associated with pipelines was distinct
from those associated with natural habitats, and was characterised by a greater abundance and/
or biomass of fish from higher trophic levels (e.g. piscivores, generalist carnivores and invertivores),
including many species considered to be of value to commercial and recreational fishers. Biomass of
fish on pipelines was, on average, 20 times greater than soft sediments, and was similar to natural
reefs. However, the biomass of species considered important to fisheries recorded on the pipelines
was, on average 3.5 times greater than reef and 44.5 times greater than soft sediment habitats. This
study demonstrates that fish assemblages on the pipeline infrastructure exhibit high ecological and
socioeconomic values.
There are approximately 7500 oil and gas structures in the marine environment globally, many of which will
require decommissioning in the near future as they reach the end of their production l ife1,2. In most countries,
current decommissioning policies require the complete removal of infrastructure. This is in alignment with inter-
national obligations (i.e. the United Nations Convention on the Law of the Sea (UNCLOS) and the Convention
on the Prevention of Marine Pollution by Dumping of Wastes and Other Matter (London Convention)3,4). In
Australia, the default policy position on decommissioning is complete r emoval5. However, with growing evidence
that oil and gas structures have the potential to function as artificial reefs (e.g.6–12), there is a compelling envi-
ronmental case for consideration of in situ decommissioning alternatives. These alternatives include leaving the
infrastructure in place, partial removal, toppling onto the seafloor or relocating to a designated reefing site3,13,14.
Alternative decommissioning strategies could be supported if there is information demonstrating equal or better
environmental and safety outcomes in comparison to complete r emoval15.
There is demonstrated evidence that oil and gas infrastructure can support a high abundance and diversity of
sessile invertebrates and fish, including species that are considered commercially and recreationally important3,9,
and/or are of high conservation value10,16. The option of leaving these structures in the water may potentially
benefit fisheries through increased c atch17. They may also provide opportunities for diver-based tourism where
structures are readily a ccessible18. Some of these structures have also been documented as having potential con-
servation benefits10,19,20. However, there are concerns that the aggregation of fish may also lead to overfishing
and depletion of fish stocks, especially if attraction is driving these a ssociations21–24, although s ee7. Additionally,
1
School of Molecular and Life Sciences, Curtin University, Bentley, WA 6102, Australia. 2Chevron Technical Center,
250 St Georges Tce, Perth, WA 6000, Australia. 3Chevron Australia Pty Ltd, 250 St Georges Tce, Perth, WA 6000,
Australia. 4Western Australian Fisheries and Marine Research Laboratories, Department of Primary Industries and
Regional Development, Government of Western Australia, P.O. Box 20, North Beach, WA 6920, Australia. *email:
euan.harvey@curtin.edu.au
Scientific Reports | (2021) 11:6238 | https://doi.org/10.1038/s41598-021-85396-y 1
Vol.:(0123456789)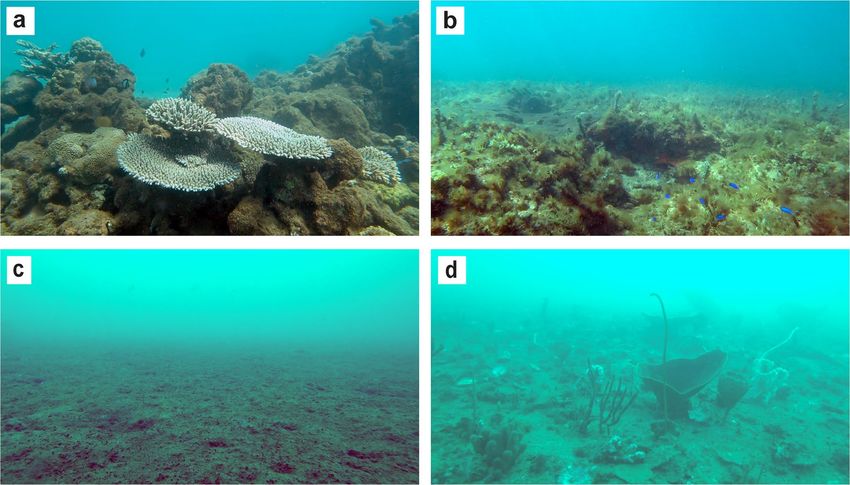
www.nature.com/scientificreports/
it has been suggested that offshore infrastructure may facilitate the propagation of invasive species by providing
a mechanism for connecting habitat mosaics25,26. Other considerations often associated with in-situ decommis-
sioning alternatives include potential leaching of contaminants, snagging risk for trawl fisheries and shipping
navigational hazards27,28. From an ecological perspective, it is important that rigorous scientific data is collected
to characterise fish assemblages associated with these structures in order to weigh the environmental, social and
economic value of retaining these habitats against other benefits and risks.
Subsea pipelines are an integral component of oil and gas operations and form extensive networks on the
seafloor. Despite their prevalence in our oceans there are few environmental studies that assess the ecological
role of subsea pipelines as habitat (although see29–34), with the majority of literature focused on oil and gas
platforms14. Research is now beginning to demonstrate the potential role subsea pipelines may serve in the
marine environment. For example, a colony of Australian fur seals (Arctocephalus pusillus doriferus) in the Bass
Strait, south-eastern Australia, has been documented using subsea pipelines to search for p rey35. Similarly, fish
34
have been documented utilising subsea pipelines as habitat, with Love and Y ork reporting that fish densities
were six to seven times greater on pipelines compared to the adjacent seafloor in the Santa Barbara Channel,
Southern California. Studies specific to north Western Australia29,32,33 have also documented a high diversity
and abundance of fish on pipelines, including species that are considered important to fisheries (e.g. lutjanids
(snappers) and epinephelids (groupers)). Higher distributions of fish were observed near spanning pipelines
(i.e. unsupported pipe where seabed sediment has been removed by water flow scouring), suggesting that these
structures may be favourable places for refuge and access to food (e.g. ambush behaviours) for some s pecies29,32,33.
Studies that have assessed fish associations with subsea pipelines have either used existing industry remotely
operated vehicle (ROV) video footage31–33, small submersibles34, or Baited Remote Underwater stereo-Video
systems (stereo-BRUVs)29,30 as a means of sampling. The use of a mini-ROV fitted with a stereo-video system
(stereo-ROV) may be a more appropriate sampling approach for assessing fish associations on pipelines, as the
stereo camera setup provides per unit area measurements of fish and accurate length data for biomass estimates
in situ12. Furthermore, the majority of studies have assessed pipelines in relatively deep waters, ranging from 56
to 230 m (although see30, where fish surveys started at 15 m depth), and where surrounding habitat consisted
predominantly of soft sediment. There is little information describing how fish communities interact with subsea
pipelines at shallow depths (< 30 m), particularly where surrounding habitats are complex, such as coral reefs.
The North West Shelf of Western Australia encompasses the Northern Carnarvon and Roebuck Basins, where
several thousand kilometres of subsea pipeline exist across multiple oil and gas p rojects36. These structures are
predominantly situated over soft sediment habitat and sparse, sponge garden communities. However, at shallower
depths (< 30 m) they also lie within, or adjacent to complex reef systems, which include communities of hard and
soft corals. Studies in this region have shown the inshore fish assemblage to be highly diverse and include species
which are endemic (e.g. Lethrinus punctulatus), protected (e.g. Epinephelus lanceolatus), and of importance to
commercial and recreational fishers37–40.
With decommissioning activities expected to increase in the future, understanding the ecological roles of
oil and gas structures, including subsea pipelines, will contribute valuable information to the decision-making
process on decommissioning alternatives. This study aims to compare fish assemblages on exposed shallow-
water subsea pipelines to those observed in nearby natural reef and soft sediment habitats using stereo-ROVs.
We assessed the number of species, abundance, biomass, feeding guild composition and the potential economic
value of fish communities associated with pipelines near Thevenard Island, Western Australia. We also surveyed
nearby natural reef and soft sediment habitats in order to contextualise the value of pipelines as habitat for
shallow-water fish communities.
Methods
Study area. Surveys were carried out in September 2018 on a network of subsea pipelines located near
Thevenard Island, Western Australia, ranging in water depths of 10.6–20 m (Fig. 1). The majority of the pipelines
were installed between 1989 and 1994, with the most recent installation in 2001 prior to cessation of operations
in 2014. The network of pipelines has a combined length of 132 km in depths ranging from 0 to 20 m and con-
nects nine platforms (three tripods and six monopods) to onshore facilities. During installation, ~ 80% of the
pipelines were trenched and backfilled. At the time of the study approximately 14 km (~ 10%) of pipelines were
exposed above the substrate and ranged from more than half-buried, more than half-exposed to spanning above
the seafloor (Fig. 2b–d). The proportion of pipeline buried (Fig. 2a) and how exposed above the seabed unbur-
ied sections are is likely to change over time (especially in high current areas) due to sediment transport and
scouring processes in the shallow-water environment. For the purposes of this study, other structures associated
with the pipeline such as concrete mattresses and tie downs were considered part of the pipeline (Fig. 2e,f). Fish
seen on these structures were included in counts from the pipelines. The outer diameter of the pipelines ranged
between approximately 89–720 mm. Marine growth had not been cleaned from the pipelines since installation,
but had been subject to natural disturbances such as cyclones.
We also surveyed natural reefs and soft sediment habitats in the surrounding area in water depths of 3.7–18.5
m at the same time to provide ecological context to the data obtained from the pipelines. GIS maps of the region
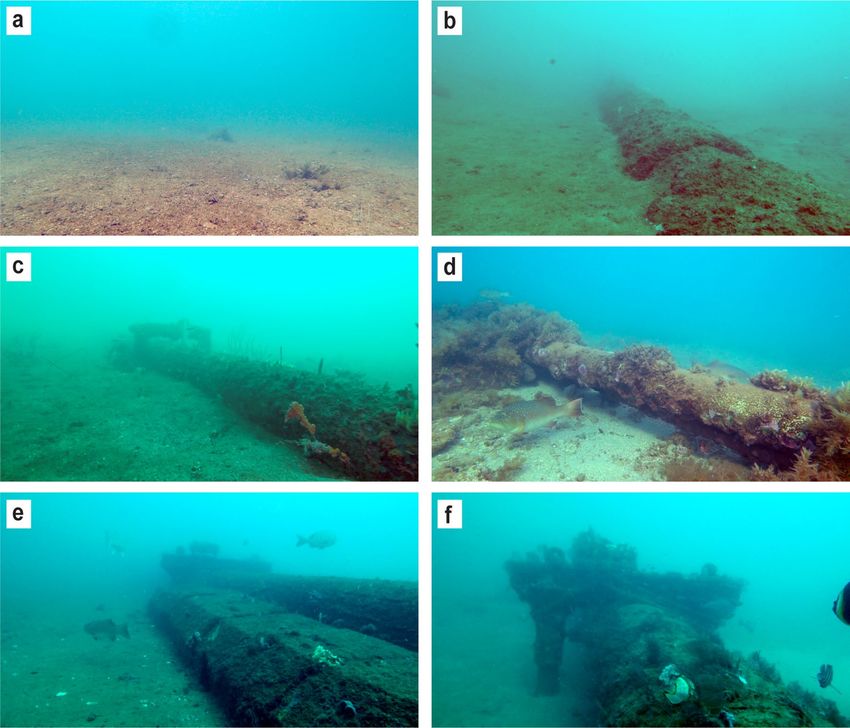
with habitat overlays were used as guides for the selection of reef and soft sediment s ites41. Reef habitat consisted
of hard substrate with coral cover and/or macro algae (Fig. 3a,b), while soft sediment consisted of bare sand
(Fig. 3c) or sand with patchy epibenthos (e.g. sponges and gorgonians) with underlying hard substrate not visible
(Fig. 3d). The inshore waters where the focal pipelines are located are closed to commercial fisheries, except for
a small-scale trawl fishery that targets banana prawns (Fenneropenaeus indicus) and a pelagic fishery for Spanish
mackerel (Scomberomorus spp.)42. This region is subject to recreational fishing activities, however due to low
human population sizes along the Pilbara coast, fishing pressures are minimal43.
Scientific Reports | (2021) 11:6238 | https://doi.org/10.1038/s41598-021-85396-y 2
Vol:.(1234567890)
www.nature.com/scientificreports/
Figure 1. Location of exposed subsea pipelines surveyed and surrounding reef and soft sediment sites, in the
vicinity of Thevenard Island, off Onslow, Western Australia (generated using ArcMap v10.7.1, https://deskt
op.arcgis.com, Memory-Map v1.2, https://memory-map.com, and Adobe Illustrator v25.0.1, https://www.adobe
.com/au/products/illustrator.html).
Sampling technique. Two mini ROVs of a similar size and functionality (SeaBotix vLBV300:
625 mm × 390 mm × 390 mm (l × w × h), ~ 18 kg; and BlueROV2 Heavy Configuration; 457 mm × 338 mm × 25
4 mm, ~ 11 kg) fitted with a stereo-video system44,45 were used to survey fish associated with pipelines, natural
reefs and soft sediment habitats. The two ROVs were operated simultaneously, with the SeaBotix vLBV300 used
to survey pipelines and the BlueROV2 used in natural habitats. The stereo-video systems on both ROVs used
Sony FDR-X3000 ActionCams mounted in purpose-built housings with a base separation of 590 mm and an
inward convergence of 5°. Cameras were set to record at 60 frames per second in a 1080p format. The SeaBotix
vLBV300 ROV used a Tritech Ultra Short Baseline Positioning system (USBL) and an Oculus 750D multibeam
sonar to help with positioning and navigation, while the BlueROV2 was equipped with Seatrac X150 USBL and
X010 Modem.
Pipeline surveys. GIS maps combined with recent hydrographic survey data were used to identify the posi-
tion of exposed segments of pipeline around Thevenard Island. Live feed from the ROV camera and attached
Scientific Reports | (2021) 11:6238 | https://doi.org/10.1038/s41598-021-85396-y 3
Vol.:(0123456789)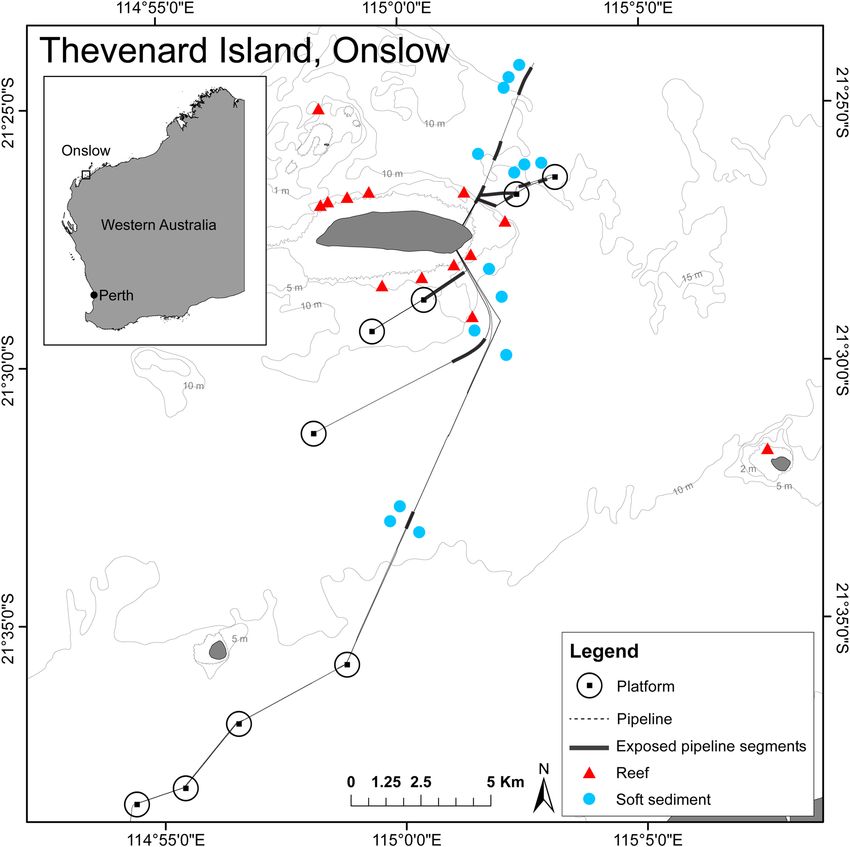
www.nature.com/scientificreports/
Figure 2. Representative (a) buried, (b) more than half buried, (c) more than half exposed, (d) spanning above
the seafloor pipeline positions and associated structures along the pipe, (e) concrete mattress, (f) tie down
(generated using Adobe Illustrator v25.0.1, https://www.adobe.com/au/products/illustrator.html).
multibeam sonar were then used to locate pipelines in-situ. Once located, the ROV operated approximately
1.4 ± 0.05 m from the pipeline on one side only, with the system angled approximately 25° (23.05 ± 0.77°) towards
the pipeline to enable a field of view of any undercut sections between the pipe and the seafloor. The system was
operated at an average flight speed of approximately 0.54 ± 0.04 m/s (similar to the recommended velocity of
stereo-DOV transects, 0.3 m/s45). Continuous footage of exposed pipelines was collected during active boating,
with the vessel trailing behind the stereo-ROV, 100–150 m away. In total, eleven segments of exposed pipeline
were surveyed with segment lengths varying between 0.3 and 1.7 km, which was dependent on the level of expo-
sure of the pipeline. Pipeline surveys were completed between 08:30 and 17:00 h to minimise the effects of diel
changes in fish behaviour on data collected31,46.
Quantitative comparisons between the reef and soft sediment habitats were undertaken by dividing continu-
ous footage of the pipelines into 50 m transects, with a minimum 20 m separation between transects to ensure
independence. To do this, the average flight speed of the stereo-ROV for each segment of pipeline was used to
determine the time taken to complete a 50 m transect. Each pipeline transect surveyed encompassed an area 5 m
wide × 50 m long (250 m2). The level of pipeline exposure varied across transects. If a 50 m transect contained
more than 17.5 m (35% of a 50 m transect) of buried pipeline, it was excluded from image analysis. In total, 88
independent 50 m transects were retained for analyses. For pipeline segments that were included in analyses, on
average per transect: 5% (2.33 ± 0.72 m) was in free-span above the seafloor, 55% (27.62 ± 2.10 m) was more than
half-exposed, 33% (16.40 ± 2.02 m) was more than half-buried and 7% (3.66 ± 0.93 m) was completely buried.
Reef and soft sediment surveys. Concurrent surveys in natural habitats were undertaken > 500 m away
from the pipeline or any artificial structure, such as platforms. The ROV was operated from an anchored vessel
and was continuously flown for approximately 25 min. As the vessel was stationary during these surveys, the
operating range of the stereo-ROV was limited by the tether length (150 m). To avoid tension on the tether and
ensure new ground was covered, the ROV was maneuvered in an expanding square around the vessel (similar
to polygonal patterns described in Ref.47,48). During image analysis, the imagery was split into 5 m × 50 m tran-
sects (250 m2) with a 20 m separation between the end and start of transects as per the pipelines. Determining
Scientific Reports | (2021) 11:6238 | https://doi.org/10.1038/s41598-021-85396-y 4
Vol:.(1234567890)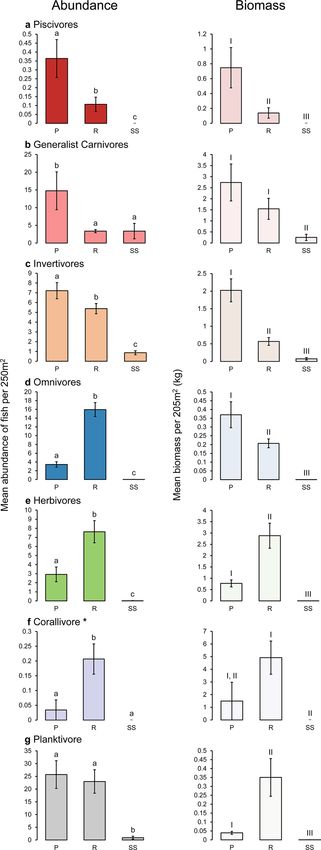
www.nature.com/scientificreports/
Figure 3. Representative reef (a,b) and soft sediment (c,d) habitats surrounding pipelines in the area around
Thevenard Island, Western Australia (generated using Adobe Illustrator v25.0.1, https://www.adobe.com/au/
products/illustrator.html).
the start and end of these transects followed the procedure described above for pipeline transects. Imagery was
analysed from 150 transects derived from 13 sites in reef habitat, and 145 transects from 14 sites in soft sediment
habitat. Surveys in natural habitats were similarly undertaken between 08:30 and 17:00 h. All fish surveys were
completed in compliance with the Australian Code for the Care and Use of Animals for Scientific Purposes and
were approved by the Curtin University Animal Ethics Committee (ARE_2018_20).
Stereo‑video calibration and video analysis. Stereo-video systems were calibrated before and after
fieldwork using the software package ‘CAL’ (https://www.seagis.com.au/bundle.html) following well established
protocols and guidelines in Ref.49–52. All fish counts, identifications, and fork length (FL) measurements (tip of
snout to mid of forked caudal fin) were made in EventMeasure Stereo Version 5.25 (https://www.seagis.com.au/
event.html). Where fish could not be identified to a species level, individuals were pooled to the next highest
taxonomic level, i.e. genera/family. To maintain a defined unit area of sampling across image analyses a horizon-
tal and vertical constrained field of view was set to 2.5 m in either direction of the centre point (x = 5 m, y = 5 m),
with a depth (z) range to 7 m. All individuals were counted within this defined sampling area, and those that
were observed outside this area were not included in the data set45. Fish that were identified as having left the
area of the transect, which later re-entered (where they could be identified) were only counted once. In order to
obtain positioning and time information, the video imagery from the stereo system was synchronised with the
video footage collected by the onboard ROV camera. Synchronisation was achieved by referring to the timecode
overlay and manually defining the start time of the ROV footage. Both the ROV footage and stereo footage were
then paused at the same unique synchronisation point (i.e. a digital clapperboard or physical clap). Calculating
the difference in the elapsed time between the stereo and ROV video footage allowed us to define the start time
of the high definition footage. Using the event logs collected in the field we were able to skip to the time at which
the ROV commenced its survey. For quantitative analyses, this also allowed us to identify fish counts and meas-
urements that were observed within the timed 50 m transects using their corresponding time stamp.
Calculating biomass, feeding guilds and economic value of fish. Fish length was used as a proxy of
weight (biomass), using the equation: Weight (g) = a × Length (cm)b53. Relevant slope (a) and intercept (b) val-
ues for different species/genera were sourced from F ishBase54. Where fish could not be measured due to visual
obstruction from other fish or structure (pipe and reef etc.), or were oblique to the camera with neither the head
nor tail visible, we allocated that fish a mean length which was based on that specific species from within the
same habitat (similar to Ref.55). Classification of feeding guilds for fish were sourced from FishBase based on
the ecology and/or diet descriptions54 (See Supplementary Table S1). The value of commercial and recreational
fish ($AUD/kg) was calculated using the mean wet weight market value for commercial species for 2017/201842.
In total, 39 species for which a corresponding market value was available were recorded (See Supplementary
Table S2).
Statistical analysis. Statistical analyses were undertaken in PRIMER 7 with PERMANOVA + add on56. A
one way PERMANOVA was used to test for differences among habitats in the numbers of species, overall fish
Scientific Reports | (2021) 11:6238 | https://doi.org/10.1038/s41598-021-85396-y 5
Vol.:(0123456789)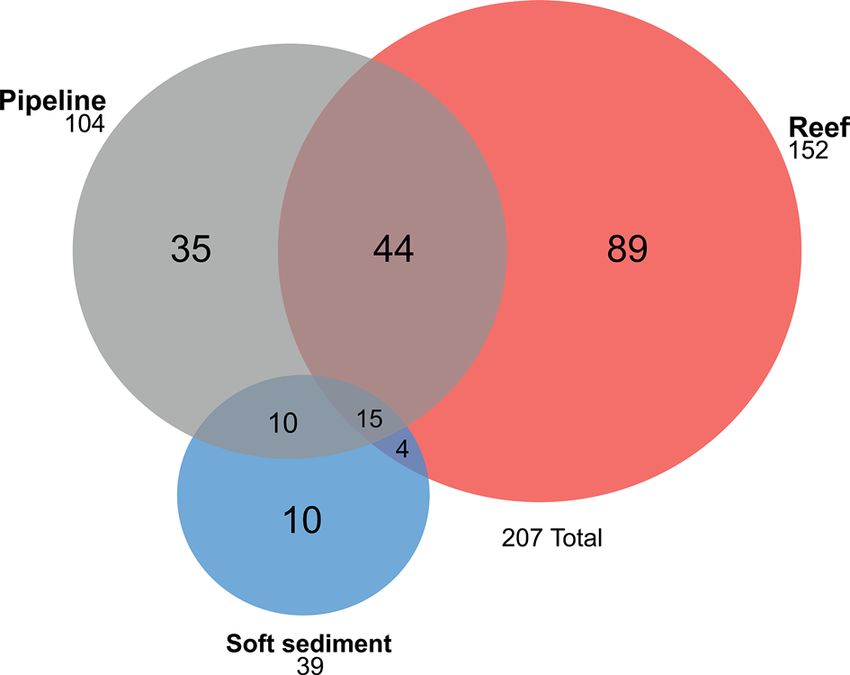
www.nature.com/scientificreports/
Figure 4. Mean (± SE) number of species (a), abundance (b), and biomass of fish (kg) (c) per transect
(50 m × 5 m, 250 m2) for pipeline, reef, and soft sediment habitats. Statistically similar means are indicated by the
same letter (e.g. a) (generated using Microsoft Excel v16.0.5122.1000, https://www.microsoft.com/).
Figure 5. Total number of species recorded at each habitat: pipeline, reef, soft sediment, and across
combinations of habitats (generated using Venn Diagram Plotter v1.5.5228.29250, http://omics.pnl.gov/).
abundance, the overall biomass, differences in feeding guilds and focal species (Habitat: 3 levels; pipeline, reef,
soft sediment)56,57. Focal species were considered to be those species identified as being dominant in a SIMPER
analyses, as well as those species commonly targeted by fishers in the Pilbara area43. Focal species were Neopoma-
centrus aktites (Western Australian demoiselle), Pomacentrus coelestis (Neon damsel), Thalassoma lunare (Moon
wrasse), Parupeneus indicus (Yellowspot goatfish), Scarus ghobban (Bluebarred parrotfish), Pentapodus porosus
(Northwest threadfin bream), Choerodon cauteroma (Bluespotted tuskfish), Choerodon schoenleinii (Blackspot
tuskfish), Plectropomus spp. (Coral trout), Lutjanus carponotatus (Stripey snapper) and Lethrinus laticaudis
(Grass emperor). Data were tested for dispersion using P ERMDISP58 and were analysed using the untrans-
formed data based on a Euclidean distance matrix. When a statistical difference was found (P < 0.05, using 9999
permutations), a post-hoc pairwise comparison was completed. P values from pairwise tests are indicated using
P(pairwise). A Monte Carlo bootstrapping correction was used in instances where a low permutation value was
obtained for post-hoc tests (< 100), and indicated using P(MC). A venn diagram showing the number of species
shared between habitats was constructed.
To test for statistical differences in the fish assemblage recorded between habitats a one-way PERMANOVA
was used (Habitat: 3 levels; pipeline, reef, soft sediment). A fourth root transformation was applied to down
weight the influence of more common species over those rarely recorded across the data set. A Bray Curtis
similarity matrix was used for analysis with a dummy added variable (+ 1) to account for transects in which no
fish were observed. A significant difference was determined when P < 0.05 using 9999 permutations, followed
by a pairwise comparison to distinguish which habitats were statistically different from one another ( P(pairwise)).
Principal coordinates analysis (PCO) and constrained canonical analysis of rincipal coordinates (CAP) plots
were used to visually represent differences in the abundance and biomass of fish assemblages among habitats.
Overlays onto CAP axes were done using SIMPER analyses and selecting the top five species that contributed to
group differences (based on similarity/standard deviation values). A leave-one-out allocation test was also used
to estimate and classify how distinct samples were relative to each habitat.
Scientific Reports | (2021) 11:6238 | https://doi.org/10.1038/s41598-021-85396-y 6
Vol:.(1234567890)www.nature.com/scientificreports/
Abundance (m: 24, total correct: 327/383) Biomass (m: 7, total correct: 330/383)
Habitat Pipeline Reef Soft sediment Total Success (%) Pipeline Reef Soft sediment Total Success (%)
Pipeline 67 0 21 88 76.14 67 0 21 88 76.14
Reef 2 130 18 150 86.67 4 125 21 150 83.33
Soft sediment 14 1 130 145 89.66 7 0 138 145 95.17
Table 1. Leave-one-allocation success of observations to habitat: cross validation for fish abundance and
biomass.
Figure 6. Principal Coordinates Analysis (PCO) and Canonical Analysis of Principal Coordinates (CAP)
plots for the abundance (a) and biomass (b) of the observed fish assemblage with SIMPER species overlay
showing the differences between habitats: pipeline, reef, and soft sediment. Ordinations are based on four root
transformations and Bray Curtis similarities (generated using PRIMER 7 v7, https://www.primer-e.com/).
Results
A total of 13,883 fish from 46 families and 207 species were recorded in surveys of pipelines and surrounding reef
and soft sediment habitats. The mean number of species varied between habitats (PERMANOVA: F2,382 = 125.82,
P < 0.001) with reef having significantly more species than pipeline (P(pairwise) = 0.008) and soft sediment habitats
(P(pairwise) < 0.001), which were also different from one another (pipeline and soft sediment: P (pairwise) < 0.001)
(Fig. 4a). Pipeline and reef habitats however were more similar in the composition of the fish assemblage, shar-
ing 44 species (21% of the total fish assemblage), than pipeline and soft sediment habitats, which shared only
ten species (5%) (Fig. 5). Fish abundance varied between habitats (PERMANOVA: F 2,382 = 33.339, P < 0.001),
but pipeline and reef habitats had similar abundances of fish (P(pairwise) = 0.904). Soft sediment habitat had lower
abundances of fish than pipeline or reef habitats ( P(pairwise) < 0.001) (Fig. 4b). A similar pattern was observed for
biomass (PERMANOVA: F 2,382 = 24.641, P < 0.001), with soft sediment having lower biomass compared to pipeline
and reef habitats (P(pairwise) < 0.001), which were similar ( P(pairwise) = 0.461) (Fig. 4c).
Scientific Reports | (2021) 11:6238 | https://doi.org/10.1038/s41598-021-85396-y 7
Vol.:(0123456789)www.nature.com/scientificreports/
Figure 7. Mean (± SE) abundance and biomass of fish per transects (50 m × 5 m × 5 m) for feeding guilds:
piscivores (a), generalist carnivores (b), invertivores (c), omnivores (d), herbivores (e), corallivores (f), and
planktivores (g), between habitats: pipeline (P), reef (R), soft sediment (SS). Statistically similar means are
indicated by the same letter for abundance (e.g. a), and roman numerals for biomass (e.g. I). *Biomass of
corallivores are represented in grams (g) (generated using Microsoft Excel v16.0.5122.1000, https://www.micro
soft.com/).
Scientific Reports | (2021) 11:6238 | https://doi.org/10.1038/s41598-021-85396-y 8
Vol:.(1234567890)www.nature.com/scientificreports/
Fish assemblage composition. The composition of the fish assemblage differed among habitats (PER-
MANOVA: F2,382 = 64.833, P < 0.001) with each habitat being distinct from one another (P(pairwise) < 0.001). The
leave one out allocation success between pipeline, reef, and soft sediment habitats was high overall with 85.38%
of samples (327/383) being correctly classified to the correct habitat (Table 1). However, there was higher overlap
between pipeline and soft sediment habitats, than between reef and pipeline habitats (Table 1). A PCO and CAP
plot showed a distinct separation between reef and the other habitats (pipeline and soft sediment), which were
more similar, but still statistically different from one another (P < 0.001; Fig. 6a). This separation was driven by
high abundances of damselfish species (Pomacentrus limosus, P. coelestis, and Pomacentrus milleri), Acanthurus
grammoptilus and T. lunare that were observed on natural reefs. Separations between pipeline and soft sediment
were less distinct on CAP axis 2 and were driven by fish that are reef associated (Chromis fumea, N. aktites, and
Labroides dimidiatus). The separation was also driven by fish that occupy a combination of sandy areas over or
near reef areas (C. cauteroma, P. indicus, and P. porous) (Fig. 6a). A similar pattern was detected for biomass
at an assemblage level (PERMANOVA: F2,382 = 63.303, P < 0.001), where all habitats differed from one another
(P(pairwise) < 0.001) with an overall high (86.16%) allocation success for samples by habitat (Table 1). Separation
and grouping by habitat in the ordinations was driven by high abundances of P. porosus, C. cauteroma and C.
fumea on the pipeline, and larger P. indicus individuals, which created a greater biomass on pipelines than in
natural reef and soft sediment habitats (Fig. 6b). Conversely, reef samples were driven by the high abundance of
damselfishes (P. milleri, P. limosus and P. coelestis), as well as A. grammoptilus, and T. lunare, which were more
abundant on the reef in comparison to pipeline and soft sediment habitats (Fig. 6b).
Feeding guilds. Guild-specific abundance was greater on pipelines than in reef habitats for piscivores
(P(MC)(pairwise) = 0.009; Fig. 7a), generalist carnivores (P(pairwise) < 0.001; Fig. 7b), and invertivores (P(pairwise) = 0.048;
Fig. 7c), while similar abundances were found between these habitats for planktivores ( P(pairwise) = 0.727; Fig. 7g).
Biomass was greater on pipelines than in reef habitats for piscivores (P(pairwise) = 0.006; Fig. 7a) and inverti-
vores (P(pairwise) < 0.001; Fig. 7c), but similar for generalist carnivores ( P(pairwise) = 0.195; Fig. 7b) and corallivores
(P(pairwise) = 0.092; Fig. 7f). Reef habitats had greater abundances of omnivore ( P(pairwise) < 0.001; Fig. 7d), herbi-
vores (P(pairwise) = 0.002; Fig. 7e) and corallivores (P(MC)(pairwise) = 0.016; Fig. 7f) than pipeline habitats. A greater
biomass of herbivores (P(pairwise) = 0.001; Fig. 7e) and planktivores (P(pairwise) = 0.010; Fig. 7g) was found in reef
habitats compare to pipeline habitats. This differed for omnivores where a greater biomass was found on pipeline
habitats (P(pairwise) = 0.014; Fig. 7d). In general, abundance and biomass of all guilds were lowest in soft sediment
habitats (P(pairwise) < 0.05), with the expectation of the abundance of generalist carnivore, which was similar to
reef (P(pairwise) = 0.999; Fig. 7b), and the abundance and biomass of corallivores, which were similar to pipeline
(P(MC)(pairwise) = 0.195; P(MC)(pairwise) = 0.202; Fig. 7f).
Focal species. The mean abundance and biomass of focal species differed between habitats (PERMANOVA:
P < 0.05; Fig. 8). For N. aktites, P. indicus and S. ghobban the mean abundance was similar between pipeline
and reef habitats (P(pairwise) = 0.565; P(MC) (pairwise) = 0.835; P(pairwise) = 0.309, respectively) with both habitats hav-
ing a greater abundance of fish than soft sediment habitat ( P(pairwise) < 0.001; Fig. 8a,d,e). A similar pattern was
observed for the biomass of these species, with the exception of P. indicus where a greater biomass was recorded
on the pipeline in comparison to reef (P(pairwise) = 0.010) and soft sediment (P(pairwise) < 0.001), which also differed
from one another (P(pairwise) < 0.001; Fig. 8d). By contrast, the mean abundance and biomass of P. coelestis was
greater in reef habitat than on the pipeline ( P(pairwise) < 0.001), and soft sediment habitats ( P(pairwise) < 0.001) where
no individuals were encountered (Fig. 8b). A greater abundance and biomass of T. lunare was detected on reefs
than pipelines (P < 0.05) and soft sediment habitats (P(pairwise) < 0.001), which also differed from one another
(P(pairwise) < 0.001; Fig. 8c). A greater abundance of P. porosus was found on the pipeline in comparison to natural
habitats (reef: P(pairwise) > 0.001; soft sediment: P(pairwise) = 0.002), where soft sediment had a higher abundance
than reef habitat (P(MC)(pairwise) < 0.001; Fig. 8f). A similar pattern was observed for the biomass of P. porosus
(Fig. 8f).
Species that are commonly targeted or retained by recreational fishers in the Pilbara region (C. cauteroma, C.
schoenleinii, Plectropomus spp., L. carponotatus, and L. laticaudus) were more abundant on pipelines than reef
and soft sediment habitats (P(pairwise) < 0.05; Fig. 8g–k), which were also different from one another. C. cauteroma
and L. laticaudus were exceptions where reef and soft sediment had a similar abundance of individuals (P(MC)
(pairwise) = 0.414; P(MC) (pairwise) = 0.623, respectively; Fig. 8g,k), which were less than the pipeline. The biomass of
these species was also consistently greater on pipelines than in natural habitats ( P(pairwise) < 0.05; Fig. 8g–k) with
soft sediment having a lower biomass than reefs. Again, C. cauteroma and L. laticaudus were exceptions with
natural habitats having a similar biomass of fish (P(pairwise) = 0.056; P(MC)(pairwise) = 0.153, respectively; Fig. 8g,k)
which were less than the pipeline.
Economic value. An equivalent area (250 m2) of pipeline had ~ 71% more biomass (3.5 times more) than
natural reefs, and ~ 98% more biomass (44.5 times more) than soft sediment habitat for species commonly
retained by commercial and recreational fishers in the region (See Supplementary Table S2). When converted
into an economic dollar value ($AUD) based on market prices for wet weight (See Supplementary Table S2),
an equivalent area of pipeline contained an economic value of fish that was 3.4 times greater than the adjacent
natural reef habitat and 57 times more than the adjacent soft sediment habitat (Table 2).
Scientific Reports | (2021) 11:6238 | https://doi.org/10.1038/s41598-021-85396-y 9
Vol.:(0123456789)www.nature.com/scientificreports/
Figure 8. Mean (± SE) abundance and biomass of Neopomacentrus aktites (a), Pomacentrus coelestis (b),
Thalassoma lunare (c), Parupeneus indicus (d), Scarus ghobban (e), Pentapodus porosus (f) Choerodon cauteroma
(g), Plectropomus spp. (h), Lutjanus carponotatus (i), Choerodon schoenleinii (j), Lethrinus laticaudis (k) among
habitats: pipeline (P), reef (R), soft sediment (SS). Statistically similar means are indicated by the same letter for
abundance (e.g. a), and roman numerals for biomass (e.g. I) (generated using Microsoft Excel v16.0.5122.1000,
https://www.microsoft.com/).
Discussion
Fish assemblages associated with pipelines were distinctly different from nearby natural reefs and soft sediment
habitats. Pipelines were characterised by a greater abundance and/or biomass of species from higher trophic
Scientific Reports | (2021) 11:6238 | https://doi.org/10.1038/s41598-021-85396-y 10
Vol:.(1234567890)www.nature.com/scientificreports/
Pipeline Reef Soft sediment
Mean biomass per 250 m2 (kg) 4.90 ± 0.92 1.40 ± 0.25 0.11 ± 0.07
Mean catch value per 250 m2 ($AUD) 30.20 ± 4.76 8.82 ± 1.88 0.53 ± 0.31
Number of transects 88 150 145
Table 2. Economic value of species retained by commercial and recreational fishers.
levels (i.e. piscivores, generalist carnivores, and invertivores) compared to reef and soft sediment habitats, which
resulted in them having a higher fisheries value than equivalent areas of reef and soft sediment. In comparison,
natural reefs had a greater proportion of omnivores, herbivores, and corallivores than pipelines and soft sedi-
ment habitats, which was likely due to the greater cover of benthic communities and associated food sources
(i.e. coral and macroalgae) observed on reefs. Soft sediment habitat was dominated by generalist carnivores and
invertivores, but overall had much lower abundances than other habitats.
These findings differ from a previous study undertaken in the same region at similar depths, which indicated
that fish assemblages were similar in both the pipeline and soft sediment h abitats30. However, the disparity in
30
findings between this study and that of Bond et al. are likely attributable to the sampling technique (stereo-
BRUVs) attracting fish from other habitats. For example, attracting fish from the soft sediment habitat to the
baited camera located near the pipeline. Stereo-BRUVs have been shown to sample a broad range of species59,60,
and are particularly effective at sampling large, highly mobile carnivorous fishes. The distance these species travel
to a bait is u nknown12, and fish do tend to aggregate around the bait in numbers which are much higher than
count data collected by other sampling techniques60,61. By comparison, the stereo-ROV collects data at a much
finer scale than stereo-BRUVs and is particularly good for habitat affiliated fi shes12. It is acknowledged that the
stereo-ROV technique may have some avoidance biases due to the noise associated with the ROV thrusters,
electronics and tether v ibrations12. This avoidance may have been heightened within soft sediment habitat where
there was limited structure for fish to take shelter. Consequently, it is possible that in soft sediment habitat fish
avoided the ROV, increasing the difference between soft sediment areas and p ipelines12.
Density-dependent mechanisms, such as habitat availability, competition, and predation have likely contrib-
uted to the observed abundance of fish along the pipeline. The presence of predatory fish on artificial reefs has
been associated with food availability24, both on and off the structure, where searching for prey is likely optimised
with lower energy e xpenditure62,63. For resident predatory species, such as Plectropomus spp., the limited spatial
area of the pipeline may enhance prey encounters, whereby food sources are potentially concentrated along the
structure. This may also be true for invertivores that consume sessile invertebrates that were associated with
pipelines and will likely be influenced by patterns in epifaunal growth32. Habitat forming biota, particularly
sponges, support a range of marine fauna (e.g. fish, crustaceans and echinoderms) and likely contribute a link
between species of a higher trophic level64.
Fish that use reefs for shelter by day, but forage in different habitats by night, such as in seagrass or macroal-
gae beds or open sand, are also likely to benefit from the physical presence of structure within open and sparse
habitats, where suitable food resources may be p revalent65 as opposed to shelter sites in natural reef habitat which
may be distant from foraging habitat. Networks of pipelines are typically situated on sandy substrates and foraging
efficiency may be increased for some species that feed on infaunal burrowing organisms (e.g. crustaceans, poly-
chaetes and molluscs). Lutjanid species display this foraging behaviour at night by migrating to nearby habitats
away from reefs to feed on invertebrates38,66–68. Some lethrinid species also migrate away from reefs to forage
over soft substrate during the n ight39,67,69,70. Similar diel variations have been documented on subsea pipelines,
with fewer encounters of fish and number of species at night, compared to during the day using industry ROV
footage31,32. Therefore, the high abundance of lujtanids and certain lethrinids on the pipeline may not be due to
prey availability on pipelines, but rather due to the physical structure acting as a daytime shelter. Fish that forage
in other habitats and return to pipelines for shelter may play an important role in concentrating nutrients around
pipelines via waste e xcretion31,71–73, which may, in itself, result in increased species, abundance and biomass of a
range of species. Foraging fish returning to the pipeline may also be preyed upon by resident piscivores, which
in turn excrete nutrients at the pipeline. Future work assessing diurnal variations both on and off the pipeline
will provide better insights into the behaviour of fish that occupy these structures during the day and their role
in facilitating nutrient and energy transfer onto the pipeline from surrounding areas.
Prey availability, structural complexity, and habitat characteristics influence the distribution of reef fishes74,75.
Pipeline features such as span length32,34, wellheads76,77 and field joints33 have been associated with high abun-
dances of fish, particularly of predatory species (e.g. lujtanids, epinephelids, and sebastids). Our findings were
consistent with previous subsea pipeline studies29–34, whereby predatory fish (e.g. in this study, L. carponotatus
and Plectropomus spp.) were commonly observed near pipe spans or utilising small interstitial spaces created
between concrete mattresses and the pipe. Ambush predators, such as Plectropomus spp., likely rely on struc-
tural features that limit visibility to prey, thus increasing capture s uccess78,79. Juvenile Plectropomus spp. display
a strong association with Acropora corals over sandy substrates as the morphological complexity of Acropora
skeletons provides s helter79, and importantly this Acropora edge habitat has a variety of food sources, with a high
prevalence of small cryptic fishes around the coral, and invertebrates in the sandy s ubstratum74,79. Shelter size
requirements are also likely to change as fish grow due to the effectiveness of shelter and ease of rapid escape
from predators80. Although pipeline features, such as spans and concrete mattresses, may not represent typical
refuges (e.g. live coral) for some predatory fish, their structural complexity may serve as favourable habitats for
both access to prey and refuge from predators.
Scientific Reports | (2021) 11:6238 | https://doi.org/10.1038/s41598-021-85396-y 11
Vol.:(0123456789)www.nature.com/scientificreports/
Population estimates of some commercially and recreationally important fish species are influenced by behav-
ioural biases towards divers, particularly in areas exposed to fishing pressure where fish exhibit more pronounced
avoidance responses81–84. Behavioural reactions of avoidance or attraction to ROVs vary and are likely to be
species-specific85. It is possible that fish responses to the ROV varied across habitat types. In particular, natural
reefs have high structural complexity, which allows fish to shelter and potentially be obscured in surveys. Like-
wise, flight responses as the ROV approaches may be heightened in open and sandy habitats due to the lack of
structure12. As pipelines are often the only shelter in an open and sandy environment, any avoidance towards
the ROV is likely to result in fish fleeing near the structure in close proximity, where they can still be observed
in the video i magery12. However, this is likely to be dependent on whether cautious fish take shelter on the side
of the pipeline where ROV operations are taking place, still permitting observations. In some cases, fish may
flee to the opposite side of the pipeline and be out of the field of view, limiting pipeline fish counts to a more
conservative estimate. This is likely to be more of an issue where segments of pipeline are fully exposed, creating
a larger obstruction in video imagery, in comparison to free-spanning segments of pipeline where fish may still
be captured in the field of view underneath the pipe. Therefore, predatory fish that are commonly targeted by
fishers may have been underestimated in the reef and soft sediment habitats due to potential avoidance behav-
iours in areas of high structural complexity or lack of structure, but may also have been underestimated where
pipelines were fully exposed and when fish fled to the opposite side of the structure out of view of ROV cameras.
Previous studies have documented that pipelines can provide habitat for a greater abundance of fish than
adjacent soft sediment habitat29,30. However, to our knowledge, the present study is the first to demonstrate that
pipelines can hold a similar abundance and biomass of fish per unit area compared to natural reefs. Furthermore,
the biomass of species commonly targeted by fishers that were recorded on pipelines was approximately 3.5
times greater than natural reefs, highlighting the potential fisheries value of these s tructures29–34,77. Studies by
Bond et al.29,30 reported a higher biomass of targeted fish species associated with pipelines compared to adjacent
natural habitats (predominantly soft bottom areas), ranging from two to eight times greater. The present study
demonstrated even greater disparities in biomass between pipeline and natural habitats (3.5 times more than
reef and 44.5 times more than soft sediment) than previous studies. We also note that our pipeline estimates may
be conservative as we effectively only surveyed one side of the larger pipelines. However, it is possible that fish
estimates in reef habitat were also similarly conservative and potentially under represented due to fish seeking
shelter in or around the reef, obscuring their view from the stereo-ROV12. These disparities are likely attribut-
able to the biases of the sampling method (stereo-BRUVs) used by Ref.29,30 in comparison to the biases of the
stereo-ROV method used in the present study (discussed in Ref.12).
Predatory fish, such as L. carponotatus, L. laticaudus, C. schoenleinii, Plectropomus maculatus and Plectropo-
mus leopardus, are some of the most commonly retained species by recreational anglers in the Pilbara r egion43.
The prevalence of these species associated with pipelines, which were higher in abundance and biomass than sur-
rounding natural habitats, suggests that these structures offer an extractive value for fishers, similar to purposely
deployed artificial r eefs86,87. In the North Sea, oil and gas pipelines are commonly targeted by commercial fishers,
with ~ 36% of trips taking place within 200 m of a pipeline, and > 1% which actively target these structures88.
The predatory fish assemblages that characterise pipeline infrastructure in the Pilbara region of north-western
Australia exhibit high ecological and socioeconomic value, indicating that retaining these structures in situ offers
significant ecological and community benefits.
Whether the higher fish numbers and biomass we recorded on these oil and gas pipelines are caused by fish
production or is due to attraction from other nearby habitats is not clear (the production vs. attraction debate24).
This is partly due to difficulties involved in demonstrating an overall increase in regional fish biomass after the
installation of such structures, whilst controlling for natural variation, external fishing pressures and possible
immigration7. Claisse et al.6 demonstrated that the secondary production on oil and gas platforms in California
was 27.4 times more than natural rocky reefs at similar depths. To assess secondary production (the formation
of new animal biomass from growth for all individuals in a given area during a period of time) we would need to
resample these pipelines repeatedly. However, given these structures have been in situ for 17–29 years (at the time
of this study), it is likely that they contribute directly to biomass production rather than simply attraction from
the surrounding area. Removal of these structures would therefore likely result in a net habitat loss, resulting in
a net loss of production in this region.
Identifying particular habitat features of pipelines that drive fish associations would be of benefit for decom-
missioning of structures, including planning and understanding their ecological value. The distinct fish assem-
blage observed on the pipelines suggests these structures are not surrogates of natural reefs or soft sediment
habitats, but may offer additional structural complexities and conditions that are favourable for certain species
to seek refuge, particularly those species of a high trophic level that are also considered of value for fishing
activities. In general, the more complex a habitat is, the greater the species richness will b e89,90, as it provides a
variety of niche microhabitats/structural features suitable for particular taxa to inhabit (e.g. caves, crevices, and
other interstitial spaces). Hence, the high species count observed within natural reef habitats. Fish communities
on pipelines will only mimic aspects of natural reefs if they share similar habitat features favourable for r efuge91
and while differences in habitat features remain, different fish assemblages will also be found92,93. Anecdotally
we observed that where habitat complexity increased around small structures, such as spans, rock dumps, and
concrete mattresses along the pipeline, in addition to high epifaunal growth, the abundance and number of spe-
cies increased (similar to Ref.29–34,77). Understanding how fish utilise these small structures along the pipeline
as habitat may be useful for enhancing artificial reef d esigns11. Further work is needed on nearshore pipeline
systems, focusing on covariates such as pipeline features, diameter, depth, and distance from natural reefs, and
a better understanding of day/night residency of fish, all of which would provide greater clarity around the
ecological, social and economic value of structures associated with subsea pipelines.
Scientific Reports | (2021) 11:6238 | https://doi.org/10.1038/s41598-021-85396-y 12
Vol:.(1234567890)www.nature.com/scientificreports/
Data availability
The datasets generated during the current study are available from the corresponding author on reasonable
request, via the GlobalArchive repository, https://globalarchive.org/.
Received: 18 November 2020; Accepted: 26 February 2021
References
1. Parente, V., Ferreira, D., Moutinho dos Santos, E. & Luczynski, E. Offshore decommissioning issues: deductibility and transfer-
ability. Energy Policy 34, 1992–2001 (2006).
2. Macreadie, P. I., Fowler, A. M. & Booth, D. J. Rigs-to-reefs: will the deep sea benefit from artificial habitat?. Front. Ecol. Environ.
9, 455–461 (2011).
3. Fowler, A. M., Macreadie, P. I., Jones, D. O. B. & Booth, D. J. A multi-criteria decision approach to decommissioning of offshore
oil and gas infrastructure. Ocean Coast. Manag. 87, 20–29 (2014).
4. Hamzah, B. A. International rules on decommissioning of offshore installations: some observations. Mar. Policy 27, 339–348 (2003).
5. Chandler, J., White, D., Techera, E. J., Gourvenec, S. & Draper, S. Engineering and legal considerations for decommissioning of
offshore oil and gas infrastructure in Australia. Ocean Eng. 131, 338–347 (2017).
6. Claisse, J. T. et al. Oil platforms off California are among the most productive marine fish habitats globally. Proc. Natl. Acad. Sci.
U. S. A. 111, 15462–15467 (2014).
7. Fowler, A. M. & Booth, D. J. Evidence of sustained populations of a small reef fish on artificial structures. Does depth affect pro-
duction on artificial reefs?. J. Fish Biol. 80, 613–629 (2012).
8. Gallaway, B. J., Szedlmayer, S. T. & Gazey, W. J. A life history review for red snapper in the Gulf of Mexico with an evaluation of
the importance of offshore petroleum platforms and other artificial reefs. Rev. Fish. Sci. 17, 48–67 (2009).
9. Love, M. S. et al. Potential use of offshore marine structures in rebuilding an overfished rockfish species, bocaccio (Sebastes pau-
cispinis). Fish. Bull. 104, 383–390 (2006).
10. Friedlander, A. M., Ballesteros, E., Fay, M. & Sala, E. Marine communities on oil platforms in Gabon, West Africa: high biodiversity
oases in a low biodiversity environment. PLoS ONE 9, e103709 (2014).
11. McLean, D. L., Taylor, M. D., Giraldo Ospina, A. & Partridge, J. C. An assessment of fish and marine growth associated with an
oil and gas platform jacket using an augmented remotely operated vehicle. Cont. Shelf Res. 179, 66–84 (2019).
12. Schramm, K. D. et al. A comparison of stereo-BRUVs and stereo-ROV techniques for sampling shallow water fish communities
on and off pipelines. Mar. Environ. Res. 162, 105198 (2020).
13. Schroeder, D. M. & Love, M. S. Ecological and political issues surrounding decommissioning of offshore oil facilities in the Southern
California Bight. Ocean Coast. Manag. 47, 21–48 (2004).
14. Bull, A. S. & Love, M. S. Worldwide oil and gas platform decommissioning: a review of practices and reefing options. Ocean Coast.
Manag. 168, 274–306 (2019).
15. Department of Industry, Science, Energy and Resources. Offshore Petroleum Decommissioning Guideline 4 (Department of Industry,
Science, Energy and Resources, 2018).
16. Bell, N. & Smith, J. Coral growing on North Sea oil rigs. Nature 402, 601–601 (1999).
17. APPEA. Scientific Literature Review. Environmental Impacts of Decommissioning Options (APPEA, 2017).
18. Stolk, P., Markwell, K. & Jenkins, J. M. Artificial reefs as recreational scuba diving resources: a critical review of research. J. Sustain.
Tour. 15, 331–350 (2007).
19. Scarborough-Bull, A., Love, M. S. & Schroeder, D. M. Artificial reefs as fishery conservation tools: contrasting the roles of offshore
structures between the Gulf of Mexico and the Southern California Bight. Am. Fish. Soc. Symp. 49, 899–915 (2008).
20. Moore, C. H. et al. Improving spatial prioritisation for remote marine regions: optimising biodiversity conservation and sustainable
development trade-offs. Sci. Rep. 6, 32029 (2016).
21. Cripps, S. J. & Aabel, J. P. Environmental and socio-economic impact assessment of Ekoreef, a multiple platform rigs-to-reefs
development. ICES J. Mar. Sci. 59, 300–308 (2002).
22. Matthews, K. R. Species similarity and movement of fishes on natural and artificial reefs in Monterey bay, California. Bull. Mar.
Sci. 37, 252–270 (1985).
23. Grossman, G. D., Jones, G. P. & Seaman, W. J. Jr. Do artificial reefs increase regional fish production? A review of existing data.
Fisheries 22, 17–23 (1997).
24. Bohnsack, J. A. Are high densities of fishes at artificial reefs the result of habitat limitation or behavioral preference?. Bull. Mar.
Sci. 44, 631–645 (1989).
25. Page, H. M., Dugan, J. E., Culver, C. S. & Hoesterey, J. C. Exotic invertebrate species on offshore oil platforms. Mar. Ecol. Prog. Ser.
325, 101–107 (2006).
26. Pajuelo, J. G. et al. Introduction of non-native marine fish species to the Canary Islands waters through oil platforms as vectors. J.
Mar. Syst. 163, 23–30 (2016).
27. van Elden, S., Meeuwig, J. J., Hobbs, R. J. & Hemmi, J. M. Offshore oil and gas platforms as novel ecosystems: a global perspective.
Front. Mar. Sci. 6, 548 (2019).
28. Rouse, S., Hayes, P. & Wilding, T. A. Commercial fisheries losses arising from interactions with offshore pipelines and other oil
and gas infrastructure and activities. ICES J. Mar. Sci. 77, 1148–1156 (2020).
29. Bond, T. et al. Fish associated with a subsea pipeline and adjacent seafloor of the North West Shelf of Western Australia. Mar.
Environ. Res. 141, 53–65 (2018).
30. Bond, T., Partridge, J. C., Taylor, M. D., Cooper, T. F. & McLean, D. L. The influence of depth and a subsea pipeline on fish assem-
blages and commercially fished species. PLoS ONE 13, e0207703 (2018).
31. Bond, T. et al. Diel shifts and habitat associations of fish assemblages on a subsea pipeline. Fish. Res. 206, 220–234 (2018).
32. McLean, D. L. et al. Using industry ROV videos to assess fish associations with subsea pipelines. Cont. Shelf Res. 141, 76–97 (2017).
33. McLean, D. L., Vaughan, B. I., Malseed, B. E. & Taylor, M. D. Fish-habitat associations on a subsea pipeline within an Australian
Marine Park. Mar. Environ. Res. 153, 104813 (2020).
34. Love, M. S. & York, A. A comparison of the fish assemblages associated with an oil/gas pipeline and adjacent seafloor in the Santa
Barbara Channel, Southern California Bight. Bull. Mar. Sci. 77, 101–118 (2005).
35. Arnould, J. P. Y. et al. Use of anthropogenic sea floor structures by Australian fur seals: potential positive ecological impacts of
marine industrial development?. PLoS ONE 10, e0130581 (2015).
36. DMP. Maps and Geospatial Information (Government of Western Australia, Department of Mine, Industry Regulation and Safety,
2020).
37. McLean, D. L. et al. Distribution, abundance, diversity and habitat associations of fishes across a bioregion experiencing rapid
coastal development. Estuar. Coast. Shelf Sci. 178, 36–47 (2016).
38. Travers, M. J., Clarke, K. R., Newman, S. J., Hall, N. G. & Potter, I. C. To what extents are species richness and abundance of reef
fishes along a tropical coast related to latitude and other factors?. Cont. Shelf Res. 167, 99–110 (2018).
Scientific Reports | (2021) 11:6238 | https://doi.org/10.1038/s41598-021-85396-y 13
Vol.:(0123456789)www.nature.com/scientificreports/
39. Travers, M. J., Newman, S. J. & Potter, I. C. Influence of latitude, water depth, day v. night and wet v. dry periods on the species
composition of reef fish communities in tropical Western Australia. J. Fish Biol. 69, 987–1017 (2006).
40. Travers, M. J., Potter, I. C., Clarke, K. R. & Newman, S. J. Relationships between latitude and environmental conditions and the
species richness, abundance and composition of tropical fish assemblages over soft substrata. Mar. Ecol. Prog. Ser. 446, 221–241
(2012).
41. Chevron. Wheatstone Project: Dredging and Dredge Spoil Placement Environmental Monitoring and Management Plan 234 (Chevron
Australia Pty Ltd., 2016).
42. Gaughan, D. J. et al. (eds) Status Reports of the Fisheries and Aquatic Resources of Western Australia 2017/18: The State of the Fisheries
(Department of Primary Industries and Regional Development, 2019).
43. Ryan, K. L. et al. Statewide Survey of Boat-Based Recreational Fishing in Western Australia 2017/18. Fisheries Research Report No.
297, Department of Primary Industries and Regional Development (2019).
44. Harvey, E. S., Goetze, J., McLaren, B., Langlois, T. & Shortis, M. R. Influence of range, angle of view, image resolution and image
compression on underwater stereo-video measurements: high-definition and broadcast-resolution video cameras compared. Mar.
Technol. Soc. J. 44, 75–85 (2010).
45. Goetze, J. S. et al. A field and video analysis guide for diver operated stereo-video. Methods Ecol. Evol. 10, 1083–1090 (2019).
46. Myers, E. M. V., Harvey, E. S., Saunders, B. J. & Travers, M. J. Fine-scale patterns in the day, night and crepuscular composition of
a temperate reef fish assemblage. Mar. Ecol. 37, 668–678 (2016).
47. Sward, D., Monk, J. & Barrett, N. A systematic review of remotely operated vehicle surveys for visually assessing fish assemblages.
Front. Mar. Sci. 6, 134 (2019).
48. Gregoire, T. G. & Valentine, H. T. Sampling Strategies for Natural Resources and the Environment (CRC Press, 2007).
49. Harvey, E. S. & Shortis, M. R. Calibration stability of an underwater stereo-video system: implications for measurement accuracy
and precision. Mar. Technol. Soc. J. 32, 3–17 (1998).
50. Shortis, M. R. & Harvey, E. S. Design and calibration of an underwater stereo-video system for the monitoring of marine fauna
populations. Int. Arch. Photogramm. Remote Sens. 32, 792–799 (1998).
51. Shortis, M., Harvey, E. & Abdo, D. A review of underwater stereo-image measurement for marine biology and ecology applications.
In Oceanography and Marine Biology Vol. 47 (eds Gibson, R. et al.) 257–292 (Taylor & Francis, 2009).
52. Boutros, N., Shortis, M. R. & Harvey, E. S. A comparison of calibration methods and system configurations of underwater stereo-
video systems for applications in marine ecology. Limnol. Oceanogr. Methods 13, 224–236 (2015).
53. Taylor, R. B. & Willis, T. J. Relationships amongst length, weight and growth of north-eastern New Zealand reef fishes. Mar. Freshw.
Res. 49, 255–260 (1998).
54. Froese, R. & Pauly, D. FishBase. www.fishbase.org, Accessed Sept 2019 (2019).
55. Bach, L. L., Saunders, B. J., Newman, S. J., Holmes, T. H. & Harvey, E. S. Cross and long-shore variations in reef fish assemblage
structure and implications for biodiversity management. Estuar. Coast. Shelf Sci. 218, 246–257 (2019).
56. Anderson, M., Gorley, R. & Clarke, K. P. PERMANOVA+ for PRIMER: Guide to Software and Statistical Methods 1st edn. (PRIMER-
E, 2008).
57. Anderson, M. J. A new method for non-parametric multivariate analysis of variance. Austral. Ecol. 26, 32–46 (2001).
58. Anderson, M. J. Distance-based tests for homogeneity of multivariate dispersions. Biometrics 62, 245–253 (2006).
59. Harvey, E. S., Cappo, M., Butler, J. J., Hall, N. & Kendrick, G. A. Bait attraction affects the performance of remote underwater video
stations in assessment of demersal fish community structure. Mar. Ecol. Prog. Ser. 350, 245–254 (2007).
60. Watson, D. L., Harvey, E. S., Anderson, M. J. & Kendrick, G. A. A comparison of temperate reef fish assemblages recorded by three
underwater stereo-video techniques. Mar. Biol. 148, 415–425 (2005).
61. Langlois, T. J. et al. Cost-efficient sampling of fish assemblages: comparison of baited video stations and diver video transects.
Aquat. Biol. 9, 155–168 (2010).
62. Simon, T., Pinheiro, H. T. & Joyeux, J.-C. Target fishes on artificial reefs: evidences of impacts over nearby natural environments.
Sci. Total Environ. 409, 4579–4584 (2011).
63. Simon, T., Joyeux, J.-C. & Pinheiro, H. T. Fish assemblages on shipwrecks and natural rocky reefs strongly differ in trophic structure.
Mar. Environ. Res. 90, 55–65 (2013).
64. Wulff, J. L. Ecological interactions of marine sponges. Can. J. Zool. 84, 146–166 (2006).
65. Bohnsack, J. A. & Sutherland, D. L. Artificial reef research: a review with recommendations for future priorities. Bull. Mar. Sci. 37,
11–39 (1985).
66. Harvey, E. S., Butler, J. J., McLean, D. L. & Shand, J. Contrasting habitat use of diurnal and nocturnal fish assemblages in temperate
Western Australia. J. Exp. Mar. Biol. Ecol. 426–427, 78–86 (2012).
67. Newman, S. J. & Williams, D. M. Mesh size selection and diel variability in catch of fish traps on the central Great Barrier Reef,
Australia: a preliminary investigation. Fish. Res. 23, 237–253 (1995).
68. Nagelkerken, I., Dorenbosch, M., Verberk, W. & van der Cocheret de la Morinière Velde, E. G. Day-night shifts of fishes between
shallow-water biotopes of a Caribbean bay, with emphasis on the nocturnal feeding of Haemulidae and Lutjanidae. Mar. Ecol.
Prog. Ser. 194, 55–64 (2000).
69. Currey, L. M., Heupel, M. R., Simpfendorfer, C. A. & Williams, A. J. Assessing fine-scale diel movement patterns of an exploited
coral reef fish. Anim. Biotelem. 3, 41 (2015).
70. Newman, S. J. & Williams, D. M. Spatial and temporal variation in assemblages of Lutjanidae, Lethrinidae and associated fish
species among mid-continental shelf reefs in the central Great Barrier Reef. Mar. Freshw. Res. 52, 843–851 (2001).
71. Layman, C. A., Allgeier, J. E., Yeager, L. A. & Stoner, E. W. Thresholds of ecosystem response to nutrient enrichment from fish
aggregations. Ecology 94, 530–536 (2013).
72. Shantz, A. A., Ladd, M. C., Schrack, E. & Burkepile, D. E. Fish-derived nutrient hotspots shape coral reef benthic communities.
Ecol. Appl. 25, 2142–2152 (2015).
73. Marnane, M. J. & Bellwood, D. R. Diet and nocturnal foraging in cardinalfishes (Apogonidae) at One Tree Reef, Great Barrier
Reef, Australia. Mar. Ecol. Prog. Ser. 231, 261–268 (2002).
74. Wen, C. K. C., Pratchett, M. S., Almany, G. R. & Jones, G. P. Patterns of recruitment and microhabitat associations for three preda-
tory coral reef fishes on the southern Great Barrier Reef, Australia. Coral Reefs 32, 389–398 (2013).
75. Friedlander, A. M. & Parrish, J. D. Habitat characteristics affecting fish assemblages on a Hawaiian coral reef. J. Exp. Mar. Biol.
Ecol. 224, 1–30 (1998).
76. Pradella, N., Fowler, A. M., Booth, D. J. & Macreadie, P. I. Fish assemblages associated with oil industry structures on the continental
shelf of north-western Australia. J. Fish Biol. 84, 247–255 (2014).
77. McLean, D. L. et al. Fish and habitats on wellhead infrastructure on the north west shelf of Western Australia. Cont. Shelf Res. 164,
10–27 (2018).
78. Frisch, A. J. Are juvenile coral-trouts (Plectropomus) mimics of poisonous pufferfishes (Canthigaster) on coral reefs?. Mar. Ecol.
27, 247–252 (2006).
79. Wen, C. K. C., Pratchett, M. S., Almany, G. R. & Jones, G. P. Role of prey availability in microhabitat preferences of juvenile coral
trout (Plectropomus: Serranidae). J. Exp. Mar. Biol. Ecol. 443, 39–45 (2013).
80. Kerry, J. T. & Bellwood, D. R. The effect of coral morphology on shelter selection by coral reef fishes. Coral Reefs 31, 415–424
(2012).
Scientific Reports | (2021) 11:6238 | https://doi.org/10.1038/s41598-021-85396-y 14
Vol:.(1234567890)You can also read