Spatial and social connectivity of fish eating "Resident" killer whales (Orcinus orca) in the northern North Pacific
←
→
Page content transcription
If your browser does not render page correctly, please read the page content below
Mar Biol (2014) 161:459–472
DOI 10.1007/s00227-013-2351-0

 ORIGINAL PAPER

Spatial and social connectivity of fish‑eating “Resident” killer
whales (Orcinus orca) in the northern North Pacific
Holly Fearnbach · John W. Durban · David K. Ellifrit ·
Janice M. Waite · Craig O. Matkin · Chris R. Lunsford ·
Megan J. Peterson · Jay Barlow · Paul R. Wade

Received: 8 May 2013 / Accepted: 23 October 2013 / Published online: 7 November 2013
© Springer-Verlag Berlin Heidelberg (outside the USA) 2013

Abstract The productive North Pacific waters of the                   likely representing groupings of stable matrilines, with
Gulf of Alaska, Aleutian Islands and Bering Sea sup-                  distinct ranging patterns, that combined to form a large
port a high density of fish-eating “Resident” type killer             network of associated whales that ranged across most of
whales (Orcinus orca), which overlap in distribution with             the study area. This provides evidence of structure within
commercial fisheries, producing both direct and indirect              the Alaska stock of Resident killer whales, important for
interactions. To provide a spatial context for these interac-         evaluating ecosystem and fisheries impacts. This network
tions, we analyzed a 10-year dataset of 3,058 whale photo-            included whales known to depredate groundfish from
identifications from 331 encounters within a large (linear            longline fisheries, and we suggest that such large-scale
~4,000 km) coastal study area to investigate the ranging              connectivity has facilitated the spread of depredation.
and social patterns of 532 individually identifiable whales
photographed in more than one encounter. Although
capable of large-scale movements (maximum 1,443 km),                  Introduction
we documented ranges generally
460                                                                                                   Mar Biol (2014) 161:459–472

mitigating conflicts due to shared resources with humans          and the fish-eating Residents are by far the most abun-
(Hoare 1999; Sigler et al. 2008; Mazur and Seher 2008;            dant (Zerbini et al. 2007; Matkin et al. 2007; Durban et al.
Whitehead 2010). In mammals, social organization may              2010). This high density of Resident killer whales overlaps
underlie ranging patterns, both by restricting movements          in distribution with the most lucrative commercial fisheries
and reflecting a response to a heterogeneous environ-             in US waters, producing both direct and indirect interac-
ment (Emlen and Oring 1977; Clutton-Brock and Harvey              tions between whales and fisheries (Braham and Dahlheim
1977; Packer et al. 1990; Wittemyer et al. 2005; Whitehead        1982; Yano and Dahlheim 1995; Dahlheim 1997). There
et al. 2008). Analysis of social affiliations between indi-       is still considerable uncertainty about the diet of Residents
viduals can provide context for understanding individual          that occur in this region (Herman et al. 2005; Krahn et al.
movements, as well as the overall social structure of the         2007a), but observations have included whales feeding on
population, and can further our understanding of the spatial      commercially important species such as Atka mackerel
ecology and resource requirements of a population.                (Pleurogrammus monopterygius), Pacific salmon (Onco-
    The influence of social structure on the spatial partition-   rhynchus spp.) and Pacific halibut (Hippoglossus stenolepis)
ing of populations is likely to be particularly important in      (Matkin et al. 2007; NMML, unpublished data). Addi-
the marine environment (e.g., Lusseau et al. 2005), where         tionally, Residents commonly depredate halibut, sablefish
there is an absence of major physical barriers to movement.       (Anoplopoma fimbria), arrowtooth flounder (Atheresthes sto-
It is therefore not unexpected that some of the most stable       mias), Greenland turbot (Reinhardtius hippoglossoides) and
social structures among mammals are found in the marine           Pacific cod (Gadus macrocephalus) from longline fisher-
environment, notably the matrilineally structured socie-          ies (Yano and Dahlheim 1995; Lunsford and Rutecki 2010;
ties of killer whales (Bigg et al. 1990; Baird and Whitehead      Peterson et al. 2013) and are frequently observed feeding on
2000; Parsons et al. 2009). Long-term studies in the eastern      the discards of trawlers (Yano and Dahlheim 1995; Matkin
North Pacific have documented three genetically divergent,        et al. 2007). Killer whales are known to have high caloric
sympatric lineages (Stevens et al. 1989; Hoelzel and Dover        requirements (Williams et al. 2004; Noren 2011) and the
1991; Hoezel et al. 1998, 2002; Barrett-Lennard 2000) with        impact of this competition with fisheries may be consider-
differences in morphology (Baird and Stacey 1988; Ford            able (Lunsford and Rutecki 2010; Peterson et al. 2013).
et al. 2000), vocalizations (Ford 1989; Barrett-Lennard et al.        Assessment of the spatial extent, intensity and value of
1996a, b; Deecke et al. 2005) and social structure (Bigg et al.   these interactions is required to develop mitigation strate-
1990; Baird and Whitehead 2000). It has been suggested            gies and account for this substantial natural mortality in
that the evolution of these lineages has been supported by        ecosystem and fisheries assessments (Lunsford and Rutecki
cultural traditions, vertically transmitted across generations    2010; Peterson et al. 2013). This in turn requires data on
within stable family groupings (Baird 2000; Rendell and           the distribution and population structuring of killer whales
Whitehead 2001; Yurk et al. 2002), and has recently been          in this region. Currently, all Resident killer whales in the
proposed that they may represent different species (Morin         GOA, Aleutian Islands and Bering Sea are managed as the
et al. 2010). These lineages have distinct prey specializations   “Eastern North Pacific Alaska Resident” stock (Allen and
(Ford et al. 1998; Saulitis et al. 2000), with “Resident” type    Angliss 2012), but there is new genetic evidence of structure
killer whales feeding on fish, notably salmon in some areas       at finer spatial scales (Parsons et al. 2013). In this study, we
(Ford and Ellis 2006), “Bigg’s” killer whales (previously         use 10 years of sighting surveys and photo-identifications
referred to as “transients,” Ford 2011) feeding on marine         of individual whales to explore the spatial connectivity of
mammals and “Offshores” thought to specialize on high             Resident killer whales in coastal waters from the western
trophic level fish (Herman et al. 2005; Krahn et al. 2007a;       GOA to the western Aleutian Islands, including the Bering
Dahlheim et al. 2008), notably sharks in recent observations      Sea shelf edge. We include a quantitative description of the
(Ford et al. 2011). Consequently, these lineages are often        social structure underlying individual movements. Notably,
referred to as “ecotypes” (Ford et al. 2000).                     we examine the associations and movements of whales that
    Killer whale social and population ecology is well docu-      have been observed to depredate longlines to understand
mented for the coastal waters of the eastern North Pacific.       their social and spatial relationship within the region.
However, relatively few data exist for the more remote
waters of the northern North Pacific, despite the densities of
killer whales in the Gulf of Alaska (GOA), Aleutian Islands       Materials and methods
and Bering Sea being among the highest in the world (For-
ney and Wade 2006). Recent work has shown that the die-           Study area and data collection
tary differences and ecotype classification of killer whales
from the eastern North Pacific also extend to these more          Photo-identification data were collected from 2001 to
remote waters (Herman et al. 2005; Krahn et al. 2007a),           2010, during sightings surveys conducted in coastal waters

13
Mar Biol (2014) 161:459–472 461 Fig. 1 Map showing vessel track lines (solid lines) during sightings surveys with photo- identification of killer whales, 2001–2010 ranging from the northern GOA (~60°N, 150°W) to the also conducted in a focused area of the eastern Aleutian western extent of US waters in the western Aleutian Islands Islands from 2001 to 2005 using smaller (10–14 m) charter (~55°N, 175°E), including the waters of the continental fishing vessels (NGOS, Table 1; Matkin et al. 2007). shelf edge in the Bering Sea. The area surveyed covered a Data were also collected on an opportunistic basis from linear distance of ca. 4,000 km, generally including waters a number of platforms: during wide-scale sightings sur-
462                                                                                                        Mar Biol (2014) 161:459–472

Table 1  List of dedicated (D)       Survey   Ship                     Dates                  Type                 Areas              IDs
killer whale sighting surveys
and opportunistic (O) platforms      01AH     F/V Alpha Helix          04-Jun-01: 17-Jun-01   O: Oceanographic     1, 2, 4, 5, 8       98
from which killer whale
                                     01AM     F/V Aleutian Mariner     20-Jul-01: 25-Aug-01   D: Killer whale      1, 2, 3, 4, 5, 8   123
photo-identification data were
collected                            02AH     F/V Alpha Helix          21-May-02: 18-Jun-02   O: Oceanographic     1, 2 4, 5, 8        99
                                     02CP     F/V Coastal Pilot        12-Jul-02: 20-Aug-02   D: Killer whale      1, 2, 3, 4, 5, 8   112
                                     02MA     R/V MacArthur I          13-Jul-02: 29-Aug-02   O: Right whale       1, 2, 3, 4, 7, 8    14
                                     02MF     R/V Miller Freeman       16-Jun-02: 28-Jul-02   O: Pollock trawl     2, 4, 7, 8          20
                                     03CP     F/V Coastal Pilot        03-Jul-03: 14-Aug-03   D: Killer whale      1, 2, 3, 4, 5, 8   153
                                     03MF     R/V Miller Freeman       27-Jun-03: 15-Jul-03   O: Pollock trawl     1, 2                 4
                                     04AE     F/V Alaskan Enterprise   21-Jul-04: 27-Aug-04   D: Killer whale      2, 3, 4, 5, 7, 8    58
                                     04MA     R/V MacArthur II         29-Jun-04: 31-Oct-04   O: Humpback whale    1–8                100
                                     04MF     R/V Miller Freeman       04-Jun-04: 04-Jul-04   O: Pollock trawl     2, 4, 7, 8           6
                                     05AE     F/V Alaskan Enterprise   31-May-05: 11-Jul-05   D: Killer whale      2, 4, 5, 6, 7, 8   131
                                     05OD     R/V Oscar Dyson          02-Aug-05: 28-Sep-05   O: Humpback whale    1, 2                20
                                     06OL     F/V Ocean Olympic        31-May-06: 25-Jun-06   D: Killer whale      4, 5, 6, 7, 8      253
                                     07OD     R/V Oscar Dyson          01-Aug-07: 28-Aug-07   O: Right whale       4, 8                16
                                     07OL     F/V Ocean Olympic        30-May-07: 16-Jun-07   D: Killer whale      4, 8                 9
“Areas” lists the 5° latitude by     08DA     R/V Oscar Dyson          15-Feb-08: 03-Mar-08   O: Pollock trawl     4, 5                15
10° longitude areas that were        08OL     F/V Ocean Olympic        02-Aug-08: 12-Sep-08   O: Right whale       2, 4, 8              5
covered by each survey area
                                     09AQ     F/V Aquila               21-Jun-09: 14-Jul-09   D: Killer whale      4, 5, 7, 8          79
(see Fig. 2), and IDs is the total
number of distinct “Resident”        10AE     F/V Alaskan Enterprise   24-Jun-10: 12-Jul-10   D: Killer whale      4, 5, 6            197
type killer whales identified        LL       F/V Alaskan Leader       May–Sep 06–10          O: Longline          2, 3, 4, 5, 7, 8    41
from high-quality photographs        NGOS     Various                  May–Sep 01–05          D: Killer whale      4, 8               288
on each survey

with the photographs to confirm lineage. Lineage assign-               approach is validated by an absence of association between
ment was made using the criteria established in previous               killer whales of different lineages in the North Pacific,
studies in this region (Matkin et al. 2007; Zerbini et al.             including our study area, despite decades of previous obser-
2007; Durban et al. 2010; Parsons et al. 2013), based on               vations (Ford et al. 1998, 2000; Matkin et al. 2007; Zerbini
a combination of molecular genetic analysis from skin                  et al. 2007; Durban et al. 2010; Parsons et al. 2013).
samples (Parsons et al. 2013) to corroborate assignments
based primarily on morphological characteristics of the                Photo analysis
photographed whales. Resident killer whales are by far
the most frequently encountered in this region (Zerbini                Photo-identification images were taken with either 35-mm
et al. 2007) and can be readily distinguished from Bigg’s              SLR cameras, shooting Fuji Neopan 1600 ISO black and
and Offshore killer whales in photographs by experienced               white film (2000–2003), or with digital SLR cameras with
observers (Durban et al. 2010). Specifically, there are key            a minimum resolution of 6 MP (2004–2010). All 35-mm
morphological differences in dorsal fin shape and sad-                 photo-identification images were digitized using a slide
dle patch pigmentation that have been long established                 copy adaptor to capture 6 MP tagged image format files
as diagnostic features to distinguish these lineages (Baird            with a Nikon Coolpix digital camera. Once all images
and Stacey 1988; Ford et al. 2000). In this study, all photo-          were in digital format, the best photograph of each whale,
graphic assignments were conducted by at least two of the              in each encounter (the best-in-encounter photograph), was
authors, who independently analyzed all photographs col-               selected.
lected in each encounter, extending previous assessments                  Each best-in-encounter photograph was then compared
of lineage in earlier examinations of this growing data-               to a master photo-identification catalog of individuals. If
set (Zerbini et al. 2007; Matkin et al. 2007; Durban et al.            a match was found, the whale was linked with the corre-
2010). Where available, genetic analysis of biopsy samples             sponding identification number. If no match was found, a
was used to directly confirm the ecotype identity of whales            new number was assigned. Although unique identification
in a sampled encounter and to indirectly assign whales in              numbers were assigned to every whale that could be dif-
additional encounters through association with individuals             ferentiated during an encounter, permanent numbers were
from a biopsied encounter (e.g., Zerbini et al. 2007; Matkin           only assigned to whales that were deemed to be distinctly
et al. 2007; Durban et al. 2010; Parsons et al. 2013). This            marked so that they could be matched between encounters

13
Mar Biol (2014) 161:459–472 463
and across years. Temporary numbers were assigned to “social space” (e.g., Hoff et al. 2002). Latentnet provides
whales that could only be distinguished within the encoun- a way of assessing the significance of social relation-
ter and were not sufficiently distinct to track over time. Dis- ships (distances) between individuals by assigning cluster
tinctiveness was based on a combination of features of the membership for each individual based on their position
dorsal fin (e.g., distinctive shape, the presence of notches) in Euclidean space (Krivitsky and Handcock 2008). This
and the adjacent saddle patch (distinctive pigmentation, Bayesian inference is probabilistic, estimating the probabil-
scarring patterns) following Durban et al. (2010), with the ity of each whale belonging to each cluster, which is desir-
distinctiveness of features being determined by the expert able given sparse observational data with limited numbers
opinion of two of the authors (H.F., D.E.). Only distinctive of re-sightings across this large study area. The package
whales were used in the subsequent analysis. In addition, performs estimation using a Markov Chain Monte Carlo
all best-in-encounter photographs were assigned quality (MCMC) algorithm and provides a way of assessing how
grades (Q = 1–3) for exposure, amount of fin and saddle many clusters there are by identifying the model (number
captured, clarity and angle, and only high-quality photo- of clusters) with the lowest Bayesian information criterion
graphs (Q > 1 for all categories) were included in the sub- (BIC). As with other model selection methods, this criterion
sequent analysis. achieves a compromise between the goodness-of-fit and a
penalty for the number of free parameters in the model; the
Data analysis model with the smallest BIC value was estimated to be the
model that best fit the data. We fit the social network mod-
Ranging patterns were examined for all distinctly marked els to two datasets, to assess the sensitivity of inference to
individuals that were identified two or more times. We the selected number of sightings that qualified individuals
used ARCGIS 9.2 (www.esri.com) with Hawth’s analysis for inclusion in the analysis. One dataset comprised asso-
tools (http://www.spatialecology.com/htools/tooldesc.php) ciation indices between all whales that were seen on two or
to map encounter locations for each individual and sum- more occasions and another restricted the dataset to whales
marized two ranging parameters: maximum extent of that were seen on three or more occasions.
movement and maximum longitudinal range using the
great circle distance calculation. Spatial ranging was fur-
ther summarized by examining the overlap of individual Results
encounter locations relative to eight areas of dimension 5°
latitude by 10° longitude (Fig. 2). Data samples
Associations between individuals were evaluated using
the half-weight index (HWI, Cairns and Schwager 1987), A total of 331 encounters with Resident killer whales
also known as Dice’s index (Dice 1945). We assumed that were included in analyses (Fig. 2), based on assign-
any two whales identified in the same encounter were asso- ment to the Resident type. Ecotype identification based
ciated, and the half-weight index of association was calcu- on defining morphological characteristics was congruent
lated for each pair of whales as HWI = 2X/(A + B), where at all times between the two photo analysts and was also
X = the total number of times that individuals A and B consistent with previous assessments of earlier subsets of
were observed together and A + B represents the total num- these data (Zerbini et al. 2007; Matkin et al. 2007; Dur-
ber of times individuals A and B were observed (Cairns and ban et al. 2010). There were no disparities between the
Schwager 1987). The HWI, therefore, ranged from 0, when morphological assessments and the genetic assignments,
two individuals were never seen in the same encounter, to when available (Parsons et al. 2013). Ecotype identifica-
1, if two individuals were always seen together. tion was directly corroborated by genetic sequence data
To characterize population structure, we adopted a for 90 of these encounters from which biopsy samples
Bayesian approach to fitting a social network model to were also obtained from at least one whale and for an addi-
identify significant clusters of associates from the repeated tional 205 encounters through individual associations to
pair-wise association measures. Specifically, we used the biopsied whales at other times, for a total of 295 (89 %)
Latentnet package from the statistical software program of all encounters. Most of the encounters occurred around
R (R Development Core Team 2011) to fit latent position the central and eastern Aleutian Islands, largely reflecting
and cluster models to these association indices (Krivitsky the increased survey effort in this central area, although
and Handcock 2008). This approach assumes the existence Resident killer whales were encountered throughout the
of a latent (unknown) space of sociality of the individuals, study area, ranging from the northern GOA to the western
where the probability of a relationship between two indi- Aleutians and into the Bering Sea. Residents were always
viduals is modeled as a function of an estimated distance encountered in aggregations, ranging in size from 3 to 120
between two individuals in a two-dimensional Euclidean whales (median = 15).
13464 Mar Biol (2014) 161:459–472
Fig. 2 Top map of the study
area showing all encounters
with “Resident” type fish-eating
killer whales from 2001 to 2010
(n = 331), bottom the number
of encounters in each of eight
spatial areas of dimension 5°
latitude by 10° longitude (see
top)
180
160
140
120
Number of Encounters
100
80
60
40
20
0
1 2 3 4 5 6 7 8
Area
In total, 77,815 photographs of Resident killer whales range 1–6 different years). Most (1,002) of these distinct
were taken, resulting in 3,058 unique whale-by-encounter whales were only seen in a single spatial area, with the
identifications and 1,220 distinct individuals. The major- highest number seen in the eastern and central Aleutians
ity (2,705) of these unique identifications were judged to areas (Fig. 2; areas 4 and 5), with re-sightings in the same
be of sufficiently reliable photographic quality, comprising area up to 10 years apart. However, 169 whales were pho-
1,186 distinct individuals. The re-sighting frequency var- tographed in two areas, and 2 whales were documented in
ied for these individuals, with a median of 1 encounter per three areas. These spatial re-sightings were not solely in
individual, a range of 1–7 encounters, and 417 whales were adjacent areas, indicating some relatively long-distance
seen in more than one calendar year (median = 1 year, movements (Table 2).
13Mar Biol (2014) 161:459–472 465
Table 2 Table of the total number of distinct individual “Resident” type killer whales that were identified in each of eight spatial areas (diagonal
cells) of dimension 5° latitude by 10° longitude (Fig. 2) and overlap of individuals between areas (non-diagonal cells)
Area 1 Area 2 Area 3 Area 4 Area 5 Area 6 Area 7 Area 8
Area 1 6 10 0 0 0 0 0 0
Area 2 158 1 21 0 0 0 0
Area 3 3 0 0 0 0 0
Area 4 373 35 1 7 64
Area 5 352 31 0 0
Area 6 95 0 1
Area 7 1 4
Area 8 14
The bold values represent the total number of distinct individual “Resident” type killer whales that were identified in each of eight spatial areas
Examination of re-sighting locations of whales identified extent of their movement being466 Mar Biol (2014) 161:459–472 Fig. 3 Maps displaying. a Encounter locations for n = 41 “Resi- (n = 63), d straight line distance between the repeated encoun- dent” type fish-eating killer whales that have been observed depredat- ter locations for n = 441 “Resident” type fish-eating killer whales ing longline fisheries. Red stars depict locations where whales were within the large connected social network. Line color represents dis- observed depredating and black lines connect repeated encounters, tinct cluster membership of whales assigned with high probability b connections of repeated encounter locations of “Resident” type (p ≥ 0.75) as per Fig. 6; cluster 1 red, n = 31 whales; cluster 2 green, fish-eating killer whales with maximum ranges
Mar Biol (2014) 161:459–472 467
Fig. 5 The range indicated by 160
the maximum distance between
re-sighting locations for
140
n = 532 “Resident” type fish-
eating killer whales identified in
more than one encounter 120
Number of Whales
100
80
60
40
20
0
0-99
100-199
200-299
300-399
400-499
500-599
600-699
700-799
800-899
900-999
1000-1099
1100-1199
1200-1299
1300-1399
1400-1499
Range(km)
4-cluster model, 327/441 whales could be assigned to a dis-
tinct cluster with high probability (p ≥ 0.75; cluster 1 = 31
whales; cluster 2 = 169 whales; cluster 3 = 33 whales;
cluster 4 = 94 whales). The 114 remaining whales could
not be assigned with such high confidence to a specific
cluster, although probability of cluster membership fell
between 0.50 and 0.74 for 103 of these whales. Notably, of
the 30 depredating whales included in the social network,
17 whales were assigned to social cluster 2, 3 whales were
assigned to social cluster 4 and 10 whales could not be
assigned to a specific social cluster with high probability.
Similar inference (84 % of individuals connected and
four estimated clusters) was obtained when fitting the
social network model to a dataset constrained to include
only individuals seen on three or more occasions (n = 209).
This indicated that the inference was not sensitive to the
selection of the number of sightings that qualified individu-
als for inclusion in the social network analysis. As such, we
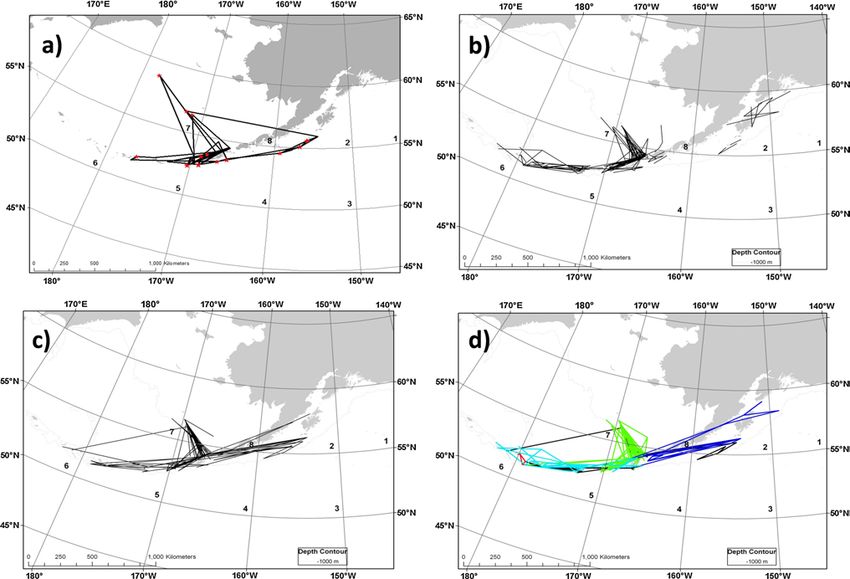
Fig. 6 Cluster assignment in 2-D social space of n = 441 “Resi- based inference on the dataset including individuals seen
dent” type fish-eating killer whales encountered more than once that
were part of a connected network. Direct associations (seen together on two or more occasions, with more individuals (n = 532)
at least once) are indicated by solid lines, social positions for each providing greater population coverage.
whale (circular pie symbols) were estimated from association indices The levels of association between whales differed
between each pair of whales: The color of the pie reflects the clus- within these defined clusters, with mean association val-
ter assignment of each whale, with the proportion composed of each
color representing the probability of that whale being assigned to ues of 0.36 (SD = 0.37, nonzero values = 56.1 %), 0.07
each cluster. Cluster 1 red, n = 31 whales; cluster 2 green, n = 169 (SD = 0.17, nonzero values = 18.9 %), 0.23 (SD = 0.29,
whales; cluster 3 blue, n = 33 whales; cluster 4 turquoise, n = 94 nonzero values = 42.2 %) and 0.09 (SD = 0.22, nonzero
whales. Cross symbols indicate the mean social space of each clus- values = 18.1 %) for clusters 1, 2, 3 and 4, respectively.
ter, open circles represent the estimated the standard deviation of the
intra-cluster variances and stars represent the estimated social posi- Notably, all four clusters contained some highly associated
tion of whales that have been observed depredating, with star size whales, with 53, 84, 20 and 100 pair-wise association indi-
proportional to number of whales (range 1–10) ces equaling a value of 1, where two whales were always
13468 Mar Biol (2014) 161:459–472
seen together. These consistent associations persisted for 1986; Wrangham and Rubenstein 1986), and the restricted
up to 10 years (maximum duration of the study). range of these Resident killer whales may reflect the highly
This connected social network was composed of whales productive environment, particularly around the Aleutian
with a combined range spanning more than half of the passes (Sinclair et al. 2005), reducing the need to move
study area, covering a linear distance of almost 3,000 km long distances.
(Fig. 3d). The distinct social clusters of whales within this The movements we documented were primarily
network also showed relatively distinct ranging patterns, restricted within three regions: the northern GOA, the east-
with limited spatial overlap between clusters. Whales in ern Aleutian Islands and Bering Sea shelf edge, and the
cluster 3 ranged most widely (median range 430 km, range central Aleutian Islands. This is consistent with both die-
54–903 km), covering waters from the GOA to the eastern tary differences (Krahn et al. 2007a) and spatial patterns of
Aleutians (areas 1, 2, 4 and 8), followed by whales in clus- genetic variability, indicating population structuring (Par-
ter 2 (median range 236 km, range 6–1,061 km), that pre- sons et al. 2013). However, the relatively rare longer dis-
dominantly used the waters of the eastern Aleutian Islands, tance movements did suggest spatial connectivity between
with north/south movements along the Bering Sea shelf neighboring regions, specifically between the central Aleu-
edge (areas 4, 7 and 8). However, whales in this cluster tian Islands and the eastern Aleutians/Bering Sea shelf
also undertook east/west movements to the central Aleu- edge, and between the eastern Aleutian Islands and western
tians (5). Whales in cluster 4 (median range 162 km, range GOA waters west of Kodiak Island. There were no direct
1–988 km) predominantly used the waters of the central movements of whales between the northern GOA waters
Aleutian Islands (areas 5), but also ranged into the eastern east of Kodiak Island and the Aleutian Islands, or between
Aleutians (4) and the western Aleutian Islands (6). Finally, the far western Aleutian Islands and areas to the east.
whales in cluster 1 were encountered over more restricted These could be edge effects, resulting from sparser photo-
ranges (median range 91 km, range 17–245 km) near identification data at the far eastern and western extents of
Amchitka Pass, on the boundary of the central and eastern our study area. However, the limited exchange of whales
Aleutian Islands (area 5). between these areas and the core of our study area none-
theless suggests a lack of social connectivity and supports
genetic hypotheses of population boundaries (Parsons et al.
Discussion 2013). Our analysis of social connectivity suggested that
this spatial structuring was mediated by social affiliations.
Quantitative analysis of photographs from 331 killer whale Pair-wise associations were distributed into four distinct
encounters revealed significant social and spatial structur- clusters, the largest three of which defined whales ranging
ing with within the Eastern North Pacific Alaska Resident in each of our three connected regions, respectively. The
stock of killer whales between the northern GOA and the fourth, smaller, cluster consisted of whales was encoun-
western Aleutian Islands. Although some long-distance tered exclusively at the boundary of the central and western
movements (up to 1,443 km) were documented, most Aleutian Islands, and it is likely that we have not sampled
whales had maximum observed rangesMar Biol (2014) 161:459–472 469
we defined represent preferred but temporary groupings of facilitate the spread of information throughout the popula-
multiple stable matrilines, based on both strong and weak tion by cultural transmission, likely enhancing success in
associations within each connected cluster. Future genetic resource acquisition (Lusseau and Newman 2004; Ruben-
work will help resolve the relatedness within and between stein et al. 2007; Allen et al. 2013) and fitness (White-
clusters. head and Rendell 2004; Whitehead et al. 2004; Whitehead
Many mammalian populations occur in social systems 2010). In this case, large-scale social connectivity may
where changes in group membership are observed as indi- facilitate the widespread practice of depredation of longline
viduals form temporary groups that fuse together and then fisheries, despite relatively restricted movements of some
break apart (Kummer 1971; Struhsaker and Leland 1979). whales.
The fission–fusion dynamics of populations that occur in Depredation of longlines by killer whales in Alaskan
a variable environment are likely to be less cohesive and waters has been observed for several decades (Dahlheim
are comprised of a few, large connected components, each 1988; Yano and Dahlheim 1995; Matkin et al. 1997),
consisting of highly associated “cliques” (Rubenstein but the incidence of depredation has been increasing in
et al. 2007; Aureli et al. 2008). In this case, our clusters of recent years (Lunsford and Rutecki 2010; Peterson et al.
preferentially associating groups appear to align with key 2013). Whales that were photographed while depredating
ecological variability: Specifically, an ecological gradi- longlines in several areas throughout our study area were
ent that shifts from the continental shelf in the nearshore members of the two largest social clusters primarily using
waters of GOA to shelf edge waters in the eastern Aleu- the eastern Aleutian Islands/Bering Sea and central Aleu-
tian Islands/Bering Sea shelf and finally to more pelagic tian Islands, respectively. This aligns with widespread dep-
waters off the shelf in the central Aleutian Islands (Fig. 1; redation by killer whales along the Aleutian chain and into
Krahn et al. 2007a). Chemical analyses of skin biopsies the Bering Sea (Yano and Dahlheim 1995; Lunsford and
from these Resident killer whales revealed a similar gra- Rutecki 2010; Peterson et al. 2013). Although our sample
dient in skin stable isotope profiles (Krahn et al. 2007a) size is small, we did not confirm any depredation by whales
that supports an east–west shift away from prey found in assigned to the cluster that ranged into the Northern GOA
shallower waters on the continental shelf. Resident killer waters east of Kodiak Island, coinciding with a negligible
whales in the GOA consume salmon as a substantial part occurrence of killer whale depredation in this region (Yano
of their diet (Saulitis et al. 2000), but it is likely that whales and Dahlheim 1995; Lunsford and Rutecki 2010; Peterson
in the eastern Aleutian Islands consume salmon to a lesser et al. 2013), despite frequent depredation by sperm whales
extent (Wade et al. 2006) and those in the central Aleutian (Physeter macrocephalus, Sigler et al. 2008). This supports
Islands likely consume alternative locally available prey in previous suggestions (Whitehead and Rendell 2004; White-
deeper waters (Krahn et al. 2007a). The socially mediated head 2010) that a social mechanism may be responsible for
spatial structure we have documented supports consistent the spread of depredation, through the vertical and horizon-
use of different foraging areas by these clusters, helping to tal cultural transmission of learned behaviors between asso-
explain these spatial differences in dietary signals. ciated individuals (Whitehead and Rendell 2004; Ruben-
At a larger scale, the four defined clusters were stein et al. 2007; Aureli et al. 2008; Whitehead 2010; Allen
linked by occasional associations to form a single large et al. 2013).
connected network, with an expansive longitudinal range We hypothesize that depredation behavior is likely first
(ca. 3,000 km), including most (83 %) of the photo-iden- spread within groups of consistent associates (likely mat-
tified whales that were seen on more than one occasion. rilines) and then spread to associating groups that may
Due to limited sample sizes, we cannot assess the sig- witness depredation during these associations. During this
nificance of the outliers: It is possible that they were sim- study, we observed large aggregations of whales (max
ply not observed sufficiently often to be seen associating encounter group size = 120) likely composed of multiple
within the network. However, it is interesting to note that matrilines traveling and feeding together (median encoun-
the percentage of whales included in the network remained ter group size = 15, consistent with a single matriline; see
similar, regardless of whether individuals qualified with a Matkin et al. 1999; Ford et al. 2000). Other killer whale
criterion of being seen on more than one or more than two populations are known to form ephemeral aggregations
occasions. This tends to imply that it may not be sampling during feeding. Pack-ice (type B) killer whales in Antarc-
variability alone that led to their exclusion, and there may tica feed predominantly on ice seals and stable groups have
be further structure to be detected in this region. For exam- been observed joining to engage in cooperative feeding
ple, we may not have fully sampled the clusters ranging at (Pitman and Durban 2012) and Resident killer whales in
the western extent of our study area or along the Bering eastern North Pacific form larger social clusters, compris-
Sea shelf edge, due to more limited survey effort in these ing multiple matrilines, in years with a higher abundance
regions. Nonetheless, the large connected network may of their Chinook salmon (Oncorynchus tshawytscha) prey
13470 Mar Biol (2014) 161:459–472
(Parsons et al. 2009). It is plausible therefore that such Aureli F, Schaffner CM, Boesch C, Bearder SK, Call J, Chapman
feeding aggregations also offer opportunities for social C, Connor R, Di Fiore A, Dunbar RI, Henzi SP, Holekamp
K, Korstjens AH, Layton R, Lee P, Lehmann J, Manson JH,
learning among a larger number of associating whales. Ramos-Fernandez G, Strier KB, van Schaik CP (2008) Fission–
Although there was some depredation observed by appar- fusion dynamics: new research frameworks. Curr Anthropol
ently unconnected individuals in the western GOA, it is 49(4):627–653
possible that their connections to the network were unde- Baird RW (2000) The killer whale: foraging specializations and group
hunting. In: Mann J, Connor RC, Tyack PL, Whitehead H (eds)
tected in our data sample. Recent observations have docu- Cetacean societies: field studies of dolphins and whales. Univer-
mented the long-distance movement of known depredating sity of Chicago Press, Chicago, pp 127–153
whales over more than 1,200 km between the eastern Aleu- Baird RW, Stacey PJ (1988) Variation in saddle patch pigmentation in
tians and western GOA (CBSFA Final Report 2012), align- populations of killer whales (Orcinus orca) from British Colum-
bia and Washington State. Can J Zool 66:2582–2585
ing with a recent increase in depredation by killer whales Baird RW, Whitehead H (2000) Social organization of mammal-eat-
in the western GOA, west of Kodiak Island (Peterson et al. ing killer whales: group stability and dispersal patterns. Can J
2013). Further collection of movement and association Zool 78:2096–2105
data will help to resolve the finer details of the association Barrett-Lennard LG (2000) Population structure and mating patterns
of killer whales, Orcinus orca, as revealed by DNA analysis.
network and further examine the likely social basis for the Ph.D. thesis. University of British Columbia, Vancouver
spread of depredation. Barrett-Lennard LG, Smith TG, Ellis GM (1996a) A cetacean biopsy
The spatial structuring we have documented within system using lightweight pneumatic darts, and its effect on the
killer whales in the coastal waters between the northern behavior of killer whales. Mar Mamm Sci 12(1):14–27
Barrett-Lennard LG, Ford JKB, Heise KA (1996b) The mixed bless-
GOA and the western Aleutian Islands needs to be consid- ing of echolocation: differences in sonar use by fish-eating and
ered when evaluating the ecosystem impact of these top mammal-eating killer whales. Anim Behav 51:553–565
predators (e.g., Guenette et al. 2006) and the extent of com- Bigg MA, Olesiuk PF, Ellis GM, Ford JKB, Balcomb KC III (1990)
petition with fisheries (e.g., Lunsford and Rutecki 2010; Social organization and genealogy of resident killer whales (Orci-
nus orca) in the coastal waters of British Columbia and Washing-
Peterson et al. 2013). Killer whales are known to have high ton State. Rep Int Whal Comm (special issue) 12:383–405
caloric requirements (Williams et al. 2004; Noren 2011), Braham HW, Dahlheim ME (1982) Killer whales in Alaska docu-
and the density of Resident killer whales in these produc- mented in the platforms of opportunity program. Rep Int Whal
tive waters is considered to be among the highest in the Comm 32:643–646
Cairns SJ, Schwager SJ (1987) A comparison of association indices.
world (Forney and Wade 2006; Zerbini et al. 2007). Their Anim Behav 35:1454–1469
impact in this region is therefore undoubtedly considerable, Calambokidis J, Falcone EA, Quinn TJ, Burdin AM, Clapham PJ,
but likely underestimated (Lunsford and Rutecki 2010). Ford JKB et al (2008) SPLASH: structure of populations, levels
Future assessments of the importance of killer whale preda- of abundance and status of humpback whales in the north Pacific.
Final Report for contract AB133F-03-RP-00078 to the US Depart-
tion are needed and should incorporate area-specific abun- ment of Commerce, Seattle. http://www.cascadiaresearch.org/
dance estimates, guided by the clustered space-use patterns SPLASH/SPLASH-contract-Report-May08.pdf
we have reported. Central Bering Sea Fisherman’s Association (CBSFA) (2012) Final
report by Alaska Longline Fisherman’s Association, 834 Lincoln
Acknowledgments This work would not have been possible without Street, Sitka Alaska
the help of an amazing Captain and friend, the late Atle Remme. We Clapham P, Zerbini AN, Kennedy A, Rone B, Berchok C (2009) Update
are grateful to many scientists and crew who participated in the sur- on North Pacific right whale research. In: Paper SC/61/BRG16
vey efforts and contributed photographs to our study. Paul Thompson, presented to the IWC Scientific Committee, Madeira, Portu-
John Ford, Kim Parsons, Phil Clapham and two anonymous review- gal, 9 pp. http://iwcoffice.org/_documents/sci_com/SC61docs/
ers provided useful comments on an earlier draft of the manuscript. SC-61-BRG16.pdf
Dedicated field efforts were supported by NOAA’s Steller Sea Lion Clutton-Brock TH, Harvey PH (1977) Primate ecology and social
Research Initiative, with specific funding from the National Marine organization. J Zool 183:1–39
Mammal Laboratory, the North Pacific Universities Marine Mammal Dahlheim ME (1988) Killer whale (Orcinus orca) depredation on
Research Consortium and the Alaska SeaLife Center. Research was longline catches of sablefish (Anoplopoma fimbria) in Alaskan
conducted under permits 545-1488-03, 782-1510, 932-1489-05 and waters. Northwest and Alaska Fisheries Science Center Processed
782-1719 issued by the National Marine Fisheries Service. Report, Seattle, 88-14, pp 1–31
Dahlheim ME (1997) A Photographic Catalog of Killer Whales, Orci-
nus orca, from the Central Gulf of Alaska to the Southeastern
Bering Sea. US Department of Commerce, NOAA Tech Report
References NMFS-131
Dahlheim ME, Schulman-Janiger A, Black N, Ternullo R, Ellifrit D,
Allen BM, Angliss RP (2012) Alaska marine mammal stock assess- Balcomb KC III (2008) Eastern temperate North Pacific offshore
ments, 2011. US Department of Commerce, NOAA Tech Memo killer whales (Orcinus orca): occurrence, movements and insights
NMFS-AFSC-234 into feeding ecology. Mar Mamm Sci 24(3):719–729
Allen J, Weinrich M, Hoppitt W, Rendell L (2013) Network-based Deecke VB, Ford JKB, Slater PJB (2005) The vocal behaviour of
diffusion analysis reveals cultural transmission of lobtail feeding mammal-eating killer whales: communicating with costly calls.
in humpback whales. Science 340(6131):485–488 Anim Behav 69:395–405
13Mar Biol (2014) 161:459–472 471
Dice LR (1945) Measures of the amount of ecologic association and genetic differentiation between foraging specialists. J Hered
between species. Ecology 26(3):297–302 89:121–128
Durban JW, Ellifrit DK, Dahlheim ME, Waite JW, Matkin CO, Bar- Hoff PD, Raftery AE, Handcock MS (2002) Latent space approaches
rett-Lennard LG, Ellis GM, Pitman RL, LeDuc RG, Wade PR to social network analysis. J Am Stat Assoc 97(460):1090–1098
(2010) Photographic mark-recapture analysis of clustered mam- Hunt GL, Stabeno PJ (2005) Oceanography and ecology of the Aleu-
mal-eating killer whales around the Aleutian Islands and Gulf of tian Archipelago: spatial and temporal variation. Fish Oceanogr
Alaska. Mar Biol 157:1591–1604 14(1):292–306
Elwen SH, Best PB (2004) Environmental factors influencing the dis- Krahn MM, Herman DP, Matkin CO, Durban JW, Barrett-Lennard
tribution of southern right whales (Eubalaena australis) on the LG, Burrows DG, Dahlheim ME, Black N, LeDuc RG, Wade PR
south coast of South Africa: broad scale patterns. Mar Mamm Sci (2007a) Use of chemical tracers in assessing the diet and foraging
20(3):567–582 regions of eastern North Pacific killer whales. Mar Environ Res
Emlen ST, Oring LW (1977) Ecology, sexual selection and the evolu- 63:91–114
tion of mating systems. Science 197:215–223 Krahn MM, Hanson MB, Baird RW, Boyer RH, Burrows DG,
Ford JKB (1989) Acoustic behaviour of resident killer whales (Orci- Emmons CK, Ford JK, Jones LL, Noren DP, Ross PS, Schorr
nus orca) off Vancouver Island, British Columbia. Can J Zool GC, Collier TK (2007b) Persistent organic pollutants and stable
67:727–745 isotopes in biopsy samples (2004/2006) from Southern Resident
Ford JKB (2011) Killer whales of the Pacific Northwest coast. In: Pit- killer whales. Mar Poll Bull 54:1903–1911
man RL (ed) Whalewatcher: killer whale: top, top predator, vol Krivitsky PN, Handcock MS (2008) Fitting position latent clus-
40. American Cetacean Society, San Pedro, pp 15–23 ter models for social networks with latentnet. J Stat Softw
Ford JKB, Ellis GM (2006) Selective foraging by fish-eating killer 24(5):1–23
whales Orcinus orca in British Columbia. Mar Ecol Prog Ser Kummer H (1971) Primate societies: group techniques of ecological
316:185–199 adaptations. Aldine, Chicago
Ford JKB, Ellis GM, Barrett-Lennard LG, Morton AB, Palm RS, Bal- Ladd C, Hunt GL Jr, Mordy CW, Salo SA, Stabeno PJ (2005) Marine
comb KC (1998) Dietary specialization in two sympatric popula- environment of the eastern and central Aleutian Islands. Fish
tions of killer whales (Orcinus orca) in coastal British Columbia Oceanogr 14(1):22–38
and adjacent waters. Can J Zool 76:1456–1471 LeDuc R (2004) Report of the results of the 2002 survey for the North
Ford JKB, Ellis GM, Balcomb KC III (2000) Killer whales: the natu- Pacific right whales. US Department of Commerce, NOAA Tech-
ral history and genealogy of Orcinus orca in British Columbia nical Memo NMFS-SWFSC-357
and Washington State, 2nd edn. University of British Columbia Lunsford C, Rutecki TL (2010) Cruise report OP-09-01: longline
Press, Vancouver survey of the Gulf of Alaska and Eastern Bering Sea, pp 1–25.
Ford JKB, Ellis GM, Olesiuk PF, Balcomb KC III (2009) Linking http://www.afsc.noaa.gov/abl/mesa/pdf/2009_LonglineCruiseRe
killer whale survival and prey abundance: food limitation in the port.pdf
oceans’ apex predator. Biol Lett 6:139–142 Lusseau D, Newman MEJ (2004) Identifying the role that ani-
Ford JKB, Ellis GM, Matkin CO, Wetklo MH, Barrett-Lennard LB, mals play in their social networks. Proc R Soc Lond B
Withler RE (2011) Shark predation and tooth wear in a popula- 271(Suppl):S477–S481
tion of northeastern Pacific killer whales. Aquat Biol 11:213–224 Lusseau D, Wilson B, Hammond PS, Grellier K, Durban JW, Parsons
Forney KA, Wade PR (2006) Worldwide distribution and abundance KM, Barton T, Thompson P (2005) Quantifying the influence of
of killer whales. In: Estes J (ed) Whales, whaling and ecosys- sociality on population structure in bottlenose dolphins. J Anim
tems. University of California Press, Berkeley, pp 145–162 Ecol 75(1):14–24
Friedlaender AS, Halpin PN, Qian SS, Lawson GL, Wiebe PH, Thiele Matkin CO, Matkin DR, Ellis GM, Saulitis E, McSweeney D (1997)
D, Read AJ (2006) Whale distribution in relation to prey abun- Movements of resident killer whales in southeastern Alaska and
dance and oceanographic processes in shelf waters of the Western Prince William Sound, Alaska. Mar Mamm Sci 13(3):469–475
Atlantic Peninsula. Mar Ecol Prog Ser 317:297–310 Matkin CO, Ellis GM, Olesiuk P, Saulitis EL (1999) Associa-
Goley PD, Straley JM (1994) Attack on gray whales (Eschrichtius tion patterns and inferred genealogies of resident killer whales,
robustus) in Monterey Bay, California, by killer whales (Orcinus Orcinus orca, in Prince William Sound, Alaska. Fish Bull US
orca) previously identified in Glacier Bay, Alaska. Can J Zool 97(4):900–919
72:1528–1530 Matkin CO, Barrett-Lennard LG, Ellifrit DK, Trites AW (2007)
Guenette S, Heymans SJJ, Christensen V, Trites AW (2006) Ecosys- Ecotypic variation and predatory behavior of killer whales (Orci-
tem models show combined effects of fishing, predation, com- nus orca) in the Eastern Aleutian Islands, Alaska. Fish Bull US
petition, and ocean productivity on Steller sea lions (Eumetopias 105:74–87
jubatus) in Alaska. Can J Fish Aquat Sci 63:2495–2517 Mazur R, Seher V (2008) Socially learned foraging behavior in wild
Herman DP, Burrows DG, Wade PR, Durban JW, LeDuc RG, Matkin black bears, Ursus americanus. Anim Behav 75:1503–1508
CO, Barrett-Lennard LG, Krahn MM (2005) Feeding ecology of Moore SE, Waite JM, Friday NA, Honkalehto T (2002) Cetacean dis-
eastern North Pacific killer whales Orcinus orca from fatty acid, tribution and relative abundance on the central-eastern and the
stable isotope, and organochlorine analyses of blubber biopsies. southeastern Bering Sea shelf with reference to oceanographic
Mar Ecol Prog Ser 302:275–291 domains. Prog Oceanogr 55:249–261
Hoare RE (1999) Determinants of human–elephant conflict in a land- Morin PA, Archer FI, Foote AD, Vilstrup J, Allen EE, Wade P, Dur-
use mosaic. J Appl Ecol 36:689–700 ban J, Parsons K, Pitman R, Li L, Bouffard P, Nielsen SCA,
Hoelzel AR, Dover GA (1991) Genetic differentiation between sym- Rasmussen M, Willerslev E, Gilbert MTP, Harkins T (2010)
patric killer whale populations. Heredity 66:191–195 Complete mitochondrial genome phylogenetic analysis of killer
Hoelzel AR, Natoli A, Dahlheim ME, Olavarria C, Baird RW, Black whales (Orcinus orca) indicates multiple species. Genome Res
NA (2002) Low worldwide genetic diversity in the killer whale 20(7):908–916
(Orcinus orca): implications for demographic history. Proc R Soc Noren D (2011) Estimated field metabolic rates and prey require-
Lond B 269:1467–1473 ments of resident killer whales. Mar Mamm Sci 27(1):60–77
Hoezel AR, Dahlheim ME, Stern SJ (1998) Low genetic variation Packer C, Scheel D, Pusey AE (1990) Why lions form groups: food is
among killer whales (Orcinus orca) in the eastern north Pacific not enough. Am Nat 36(1):1–19
13472 Mar Biol (2014) 161:459–472
Parsons KM, Balcomb KC III, Ford JKB, Durban JW (2009) The RA, Beer C, Busnel M (eds) Advances in the study of behavior.
social dynamics of the southern resident killer whales and impli- Academic Press, New York, pp 159–228
cations for the conservation of this endangered population. Anim Tufto J, Andersen R, Linnell J (1996) Habitat use and ecological cor-
Behav 77:963–971 relates of home range size in a small cervid: the roe deer. J Anim
Parsons K, Durban J, Burdin A, Burkanov V, Pitman R, Barlow J, Ecol 65(6):715–724
Barrett-Lennard L, LeDuc R, Robertson K, Matkin C, Wade P Wade PR, Hirons AC, Krahn MM, Matkin CO, Durban JW, Her-
(2013) Geographic patterns of genetic differentiation among man DP, Burrows DG (2006) Investigations into dietary spe-
killer whales in the Northern North Pacific. J Hered 104(6):737– cialization of killer whales (Orcinus orca) in the Bering Sea
754. doi:10.1093/jhered/est037 and Aleutian Islands. North Pacific Research Board pro-
Peterson M, Mueter F, Hanselman D, Lunsford C, Matkin C, Fearn- ject final report (Project# 0411/0535), http://doc.nprb.org/
bach H (2013) Killer whale (Orcinus orca) depredation effects on web/05_prjs/535_final_report.pdf
catch rates of six groundfish species: implications for commercial Wade PR, DeRobertis A, Hough KR, Booth R, Kennedy A, LeDuc
longline fisheries in Alaska. ICES J Mar Sci 70(6):1220–1232 RG, Munger L, Napp J, Shelden KEW, Rankin S, Vasquez O,
Pitman RL, Durban JW (2012) Cooperative hunting behavior, prey Wilson C (2011) Rare detections of North Pacific right whales
selectivity and prey handling by pack ice killer whales (Orci- in the Gulf of Alaska, with observations of their potential prey.
nus orca), type B, Antarctic Peninsula waters. Mar Mamm Sci Endang Species Res 13:99–109
28(1):16–36 Waite JM, Friday NA, Moore SE (2002) Killer whale (Orcinus orca)
R Development Core Team (2011) R: a language and environment distribution and abundance in the Central and Southeastern Ber-
for statistical computing. R Foundation for Statistical Com- ing Sea, July 1999 and June 2000. Mar Mamm Sci 18:779–786
puting, Vienna, ISBN 3-900051-07-0.Version 2.12.2. URL: Whitehead H (2010) Conserving and managing animals that learn
http://www.R-project.org/ socially and share cultures. Learn Behav 38(3):329–336
Rendell LE, Whitehead H (2001) Culture in whales and dolphins. Whitehead H, Rendell L (2004) Movements, habitat use and feeding
Behav Brain Sci 24:309–382 success of cultural clans of South Pacific sperm whales. J Anim
Renner M, Bell K (2008) A white killer whale in the central Aleu- Ecol 73:190–196
tians. Arctic 61(1):102–104 Whitehead H, Rendell L, Osborne RW, Wursig B (2004) Culture and
Rubenstein DI, Sundaresan S, Fischhoff I, Saltz D (2007) Social net- conservation of non-humans with reference to whales and dol-
works in wild asses: comparing patterns and processes among phins: review and new directions. Biol Conserv 120:427–437
populations. In: Stubbe A, Kaczensky P, Wesche K, Samjaa R, Whitehead H, Coakes A, Jaquet N, Lusseau S (2008) Movements
Stubbe M (eds) Exploration into the biological resources of mon- of sperm whales in the tropical Pacific. Mar Ecol Prog Ser
golia, vol 10. Martin-Luther-University Halle-Wittenberg, Halle, 361:291–300
pp 159–176 Williams TM, Estes JA, Doak DF, Springer AM (2004) Killer appe-
Saulitis EL, Matkin CO, Barrett-Lennard LG, Heise K, Ellis GM tites: assessing the role of predators in ecological communities.
(2000) Foraging strategies of sympatric killer whale (Orcinus Ecology 85:3373–3384
orca) populations in Prince William Sound, Alaska. Mar Mamm Wittemyer G, Douglas-Hamilton I, Getz WM (2005) The socio-ecol-
Sci 16:94–109 ogy of elephants: analysis of the processes creating multileveled
Sigler MF, Lunsford CR, Straley JM, Liddle JB (2008) Sperm whale societies. Anim Behav 69:1357–1371
depredation of sablefish longline gear in the northeast Pacific Wrangham RW (1986) Ecology and social relationships in two spe-
Ocean. Mar Mamm Sci 24(1):16–27 cies of chimpanzee. In: Rubenstein DI, Wrangham RW (eds)
Silva MA, Prieto R, Magalhaes S, Seabra MI, Santos RS, Hammond Ecological aspects of social evolution. Princeton University
PS (2008) Ranging patterns of bottlenose dolphins living in Press, Princeton, pp 352–378
oceanic waters: implications for population structure. Mar Biol Wrangham RW, Rubenstein DI (1986) Social evolution in birds and
156:179–192 mammals. In: Rubenstein DI, Wrangham RW (eds) Ecological
Sinclair EH, Moore SE, Friday NA, Zeppelin TK, Waite JM (2005) aspects of social evolution. Princeton University Press, Princeton,
Do patterns of Steller sea lion (Eumetopias jubatus) diet, popula- pp 452–470
tion trend and cetacean occurrence reflect oceanographic domains Yano K, Dahlheim ME (1995) Killer whale (Orcinus orca) depreda-
from the Alaska Peninsula to the central Aleutian Islands? Marine tion on longline catches of bottomfish in the southeastern Bering
environment of the eastern and central Aleutian Islands. Fish Sea and adjacent waters. Fish Bull US 93(2):355–372
Oceanogr 14(1):223–242 Yurk H, Barrett-Lennard LG, Ford JKB, Matkin CO (2002) Cultural
Stevens TA, Duffield DA, Asper ED, Hewlett KG, Bolz A, Gage LJ, transmission between cultural lineages: vocal clans in resident
Bossart GD (1989) Preliminary findings of restriction fragment killer whales in southern Alaska. Anim Behav 63:1103–1119
differences in mitochondrial DNA among killer whales (Orcinus Zerbini AN, Waite JM, Durban JW, Dahlheim ME, Wade PR (2007)
orca). Can J Zool 67:2592–2595 Estimating abundance of killer whales in the nearshore waters of
Struhsaker TT, Leland L (1979) Socioecology of five sympatric mon- the Gulf of Alaska and Aleutian Islands using line-transect sam-
key species in a Kibale forest, Uganda. In: Rosenblatt JJ, Hinde pling. Mar Biol 150:1033–1045
13You can also read