How Twitter affects the perception of public opinion: Two case studies
←
→
Page content transcription
If your browser does not render page correctly, please read the page content below
c The Author(s) 2020
                                        How Twitter affects the perception of
                                        public opinion: Two case studies
                                        Felix Gaisbauer1 , Armin Pournaki1 , Sven Banisch1 and Eckehard Olbrich1

                                        Abstract
                                        This article analyses public debate on Twitter via network representations of retweets and replies. We argue that
arXiv:2009.01666v1 [cs.SI] 3 Sep 2020

                                        tweets observable on Twitter have both a direct and mediated effect on the perception of public opinion. On this
                                        basis, we show that through the interplay of the two network representations, it is possible to investigate which opinion
                                        groups on the platform primarily shape public opinion, and which ones remain silent to a disproportionate degree.
                                        The method is employed to observe public debate about two events: The Saxon state elections and violent riots on
                                        New Year’s Eve of 2019 in the city of Leipzig. We show that in both cases, (i) different opinion groups exhibit different
                                        propensities to get involved in debate, and therefore have unequal impact on public opinion. Users retweeting right
                                        to far-right parties and politicians are significantly more active, hence their positions are disproportionately visible. (ii)
                                        Said users direct their replies primarily to other opinion groups, hence act more confrontational, while the contrary is
                                        not the case.

                                        Keywords
                                        Political impact of social media, social networks, patterns and inequalities of use, Twitter, political participation,
                                        computational social science, public opinion

                                        Introduction
                                        Twitter is an immensely popular object of study for social scientists in a variety of contexts, ranging from politics (Jungherr,
                                        2015) to crisis communication (Bruns & Burgess, 2014). One reason for this popularity is that Twitter is open in a
                                        double sense: On the one hand, researchers can call Twitter data conveniently via an API. On the other hand—and more
                                        importantly—the content created on the platform is public by default. In principle, a user’s activity is visible to everyone
                                        on the platform, and any user can interact with anyone else.
                                           Due to its open platform design, user interactions on Twitter might, of all major social media platforms, come closest to
                                        what is commonly referred to as ‘public debate.’ While not being representative of the general public (Mellon & Prosser,
                                        2017; Mislove, Lehmann, Ahn, Onnela & Rosenquist, 2011), Twitter provides a public arena for information gathering,
                                        opinion formation and persuasion. Since journalists incorporate the platform in their daily routines (Broersma & Graham,
                                        2013; Paulussen & Harder, 2014), explicitly refer to content visible on Twitter as public opinion (McGregor, 2019), and
                                        even tend to judge tweets as newsworthy as press agency reports (McGregor & Molyneux, 2020), the standpoints that are
                                        prominently featured there are reinforced in traditional media. A better understanding of how different opinion groups
                                        shape debate on the platform is therefore highly important: The image created on the platform not only affects how
                                        public opinion on certain issues is perceived by its users, but by society more generally. Certain standpoints—advanced
                                        by committed minorities in particular—might appear more prevalent than they actually are.
                                           This explorative study attempts to make these systematic differences in the engagement of groups with different political
                                        leaning visible. Its goal is both methodological and case-oriented: First, we propose a novel method to assess what users

                                        1 Max   Planck Institute for Mathematics in the Sciences, Inselstraße 22, 04103 Leipzig

                                        Corresponding author:
                                        Felix Gaisbauer
                                        Email: felix.gaisbauer@mis.mpg.de

                                        Prepared using sagej.cls [Version: 2017/01/17 v1.20]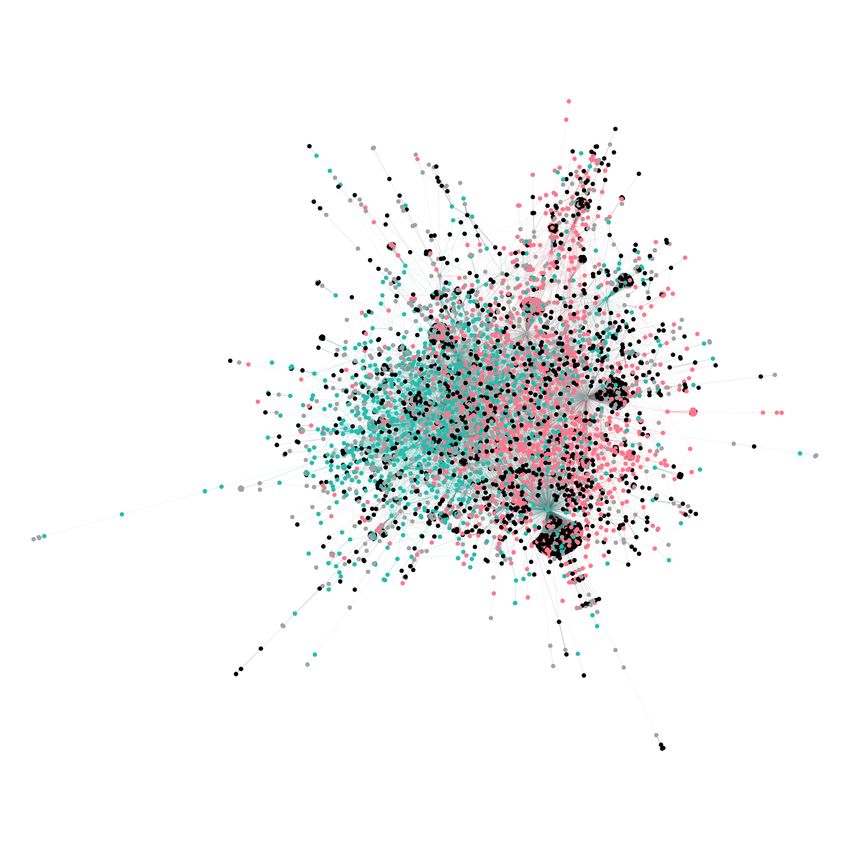
2                                                                                                         Journal Title XX(X)

and lurkers perceive as public opinion on a specific issue on Twitter. Secondly, we employ this method in two case studies
covering two political events in Germany.
   To this end, we firstly choose a suitable theoretic underpinning for the concepts of public debate and public opinion,
which have been interpreted from different angles (Noelle-Neumann, 1984; Price, 1992), and which we connect to
findings on user comments and their effects on readers. Then, we describe how relevant tweets are collected, and the
data transformations which yield a social-structural view on interactions between users. The proposed method relies on an
interplay of network representations of two types of user interactions on Twitter: Retweets and replies. Retweet networks
are used to discern opinion groups, while reply networks make it possible to assess how these groups participate in public
debate. We construct said networks from a user-centered data collection for two events: A state election in the German
state of Saxony and a violent clash on New Year’s Eve between police and parts of the population in the city of Leipzig.
We show for both cases that while retweet networks are strongly polarized, debate between users of different opinion
clusters is vivid. We also show that the impression of public opinion is biased. While being a minority in number, Twitter
users who mostly share content of parties to the right of the political spectrum are disproportionately active in debate and
act more confrontational, i.e. they address users with other opinions disproportionately often.

Theory
Public debate and public opinion
A communication-based view on public debate has been provided by Vincent Price. He describes public debate as
“communication processes through which publics are constituted and within which opinions on public affairs are formed”
(Price, 1992, p. 74). While he invokes the analogy of a big town meeting, the technical feasibility of creating such
a meeting still seemed out of reach in the early nineties: “Modern communication technologies may have enabled the
enlargement of public consciousness [...] but they have not come close to creating any sort of town meeting at large”
(Price, 1992, p. 78).
   With the advent of social media, the analogy appears to have become a (digital) reality. As has been stressed in the
introduction, Twitter is a public medium and allows its users to interact with potentially anyone else on the platform.
Users can share others’ thoughts, put out their own, and organize around hashtags, thereby creating publics and attracting
attention of others (Bruns & Burgess, 2015). These processes are strongly reinforced and amplified by traditional media:
Journalists incorporate social media, especially Twitter, as an established news source in their daily routine (Paulussen
& Harder, 2014; Broersma & Graham, 2013; McGregor & Molyneux, 2020), journalistic content or events on television
are discussed on the platform in parallel (Trilling, 2015; Gearhart & Kang, 2014), and Twitter content is often explicitly
used to represent public opinion, both in qualitative (by quoting certain tweets, e.g. to underline meta-narratives) and
quantitative fashion1 (McGregor, 2019).
   Two different, basic paradigms of public opinion can be subsumed under the terms discursive and demoscopic public
opinion (Price, 1992; Schweiger & Weihermüller, 2008). The former refers to public opinion as a social-structural
phenomenon and has a strong normative imprint. The process of arriving at public opinion—public debate—is understood
as as a rational discourse between well-informed citizens (Schweiger & Weihermüller, 2008), and should lead to the best
possible decision with respect to the overall good. The latter is related to survey research where scientists seek to aggregate
the attitudes of individuals towards certain issues in a representative fashion, which yields, by majority rule or a breakdown
of percentages, public opinion.
   For an understanding of online interactions, both conceptions are problematic. There have been attempts to replace
classical voter surveys for elections by social media observations (Tumasjan, Sprenger, Sandner & Welpe, 2010; Burnap,
Gibson, Sloan, Southern & Williams, 2016), but the findings have been contested by others (Jungherr, 2015) or turned out
to be incorrect (Burnap et al. (2016) predicted a Labour win in the 2015 UK elections). Discursive public opinion as a
normative concept, on the other hand, is in general hardly accessible to empirical research. And, after all, the internet does
know many compulsions besides “the unforced force of the better argument” (Habermas, 2015, p. 306).
   Elisabeth Noelle-Neumann has proposed a social-psychological approach centered around observable opinion
expressions2 . She conceives public opinion—or rather, what people perceive as the opinion of ‘the’ public—as a force
of informal social pressure and control manifesting itself in “approval and disapproval of publicly observable positions
and behavior” (Noelle-Neumann, 1984, p. 64). Her operational definition of public opinion incorporates “opinions on
controversial issues that one can express in public without isolating oneself” (Noelle-Neumann, 1984, p. 63). Especially
for controversial topics, individuals, being social creatures and fearing social isolation, constantly and mostly sub-
consciously monitor their social environment and the mass media. They estimate the majority opinion around them,

Prepared using sagej.cls
3

employing some “quasi-statistical sense” (Noelle-Neumann & Petersen, 2004), which they then refer to as public or
popular opinion. The theory hence puts strong emphasis on the role of the subjective impression of public opinion of
individuals. Noelle-Neumann’s spiral of silence theory states that if people realize that they hold an opinion that differs
from their impression of public opinion, they tend to be less willing to express their opinion publicly any longer. This,
in turn, affects the perception of public opinion of others, potentially setting off a spiralling process in which certain
groups become more expressive while others fall silent. Quantified interactions in online environments (Twitter displays
the number of likes, retweets, and replies below each tweet) might suggest themselves as an objective foundation for the
quasi-statistical impression of the opinion climate—but as we will show, these interactions themselves can be subject to
strong biases.

Comment spaces and perceived public opinion
In order to capture public debate online, comment sections, predominantly on news websites, have been the target of
attention since their introduction (Springer & Kümpel, 2018; Lee & Jang, 2010; Lee, 2012; Friemel & Dötsch, 2015; Toepfl
& Piwoni, 2015). Studies found that user comments on news articles affected individuals’ perceptions of public opinion
(Lee & Jang, 2010; Lee, 2012)—more so than simple comparisons of likes and dislikes. In the 20th century, scholars often
distinguished between representatives of interest groups that debated publicly, and a large and more spectator-like ‘body’
which then reacted to the debate and approved or disapproved, hence formed public opinion (Price, 1992, p. 27). This
relation is reproduced by the combination of newspaper articles and user comments below, which allow directly visible
engagement in larger amount and with less control than the very limited number of redacted letters to the editor.
   Allowing differing points of view to reach an audience with few formal constraints, comment spaces have also been
interpreted as counter-public spaces (or spheres) (Toepfl & Piwoni, 2015; Kaiser, 2017), an expansion of the Habermasian
concept of the public sphere. Nancy Fraser originally defined counterpublics as “parallel discursive arenas where members
of subordinated social groups invent and circulate counterdiscourses to formulate oppositional interpretations of their
identities, interests, and needs” (Fraser, 1990, p. 67), arising in response to hegemonic “publics at large” (Fraser, 1990,
p. 67). Comment sections in general (may they be the comment sections of newspapers, or the reply thread of a tweet of a
public figure on Twitter) are quite suitable for the formulation of oppositional interpretations: They are in the direct vicinity,
nevertheless clearly demarcated from the interpretations and content they want to distance themselves from (Toepfl &
Piwoni, 2015).
   Lessons of these findings and interpretations are (i) that comment sections have a significant effect on how people
perceive public opinion on an issue—in Noelle-Neumann’s terms, the “opinion climate” (Noelle-Neumann, 1984)—and
(ii) that they are hence, for all kinds of interest groups, important arenas for confrontation and contestation of certain
interpretations and frames, may they be hegemonic or not. Therefore, a careful investigation of comment sections and
the views expressed there is important: Which standpoints are expressed, how often, and which viewpoints (or users)
remain silent? That different groups strive for the award of being called the public is nothing new. As Baker notes of
the pre-revolutionary times in France: “Indeed, one can understand the conflicts of the Pre-Revolution as a series of
struggles to fix the sociological referent of the concept in favor of one or another competing group” (Baker, 1990, p.
186). Online environments, which facilitate communication and decentralize information distribution, might appear to
make this competition more transparent. But they also introduce additional potential for misperceptions, not least due
to differing willingness of public opinion expression of different groups (Kalogeropoulos, Negredo, Picone & Nielsen,
2017; Friemel & Dötsch, 2015; Mustafaraj, Finn, Whitlock & Metaxas, 2011). For certain opinion groups, this can lead
to a False Consensus Effect (Ross, Greene & House, 1977), according to which individuals see their own opinions as
more prevalent in society than they actually are. On the other hand, groups less willing to express their opinion might
underestimate their size (False Uniqueness Effect, see Mullen, Dovidio, Johnson and Copper (1992)). The method in this
contribution will allow an estimation of how public opinion and public debate are perceived on Twitter, and which opinion
groups principally shape this impression.

Political background
The two events under consideration were the Saxon state election which took place on September 1st, 2019, and a violent
clash between police and parts of the population in the city of Leipzig on New Year’s Eve four months later (in the
following abbreviated with NYE). The events were complementary in the sense that the election was long-anticipated,
while the latter occasion was a spontaneous incident, making them suitable for comparison.

Prepared using sagej.cls
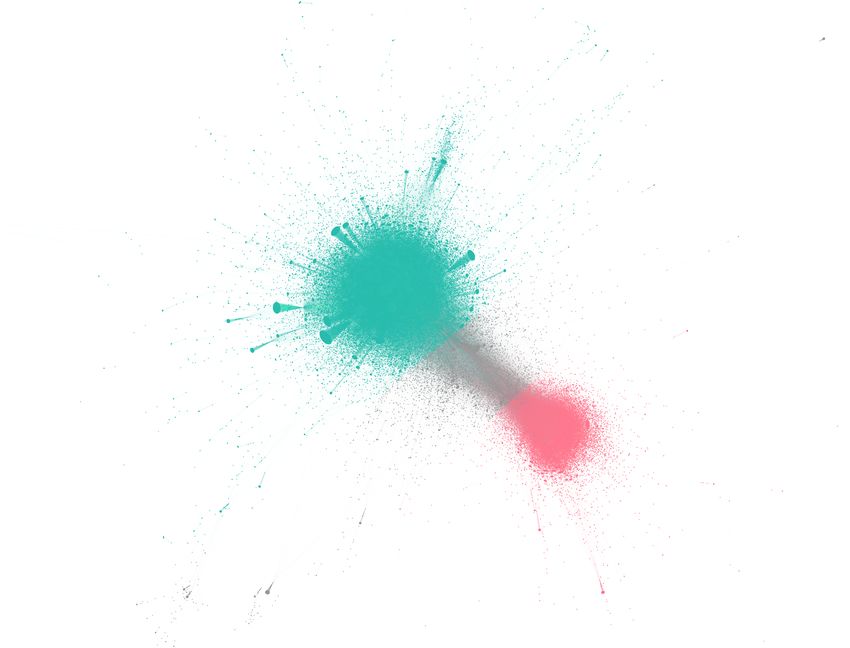
4                                                                                                         Journal Title XX(X)

  The election was of special, nation-wide interest. Since Saxony had been the birthplace of the anti-Islam movement
Pegida in 2014, which received international attention, the election was considered a litmus test for the mobilizing
potential of extreme forces. Before the election, it was not clear whether there would be the possibility of forming a
majority coalition without participation of the Alternative fr Deutschland (AfD), a right-wing party founded in 2013, or the
democratic socialist party Die Linke. While the Christian democratic party Christlich Demokratische Union Deutschlands
(CDU) leading the polls ruled out coalitions with both of the parties, it was publicly discussed whether parts of the CDU
were open towards collaboration with the AfD (Reissing, 2019).
  The NYE incident was not anticipated, but a spontaneous event which was subsequently discussed not only in Saxony,
but also in national politics. On New Year’s Eve, violent riots and attacks on police officers occurred in the city of Leipzig’s
quarter Connewitz. The event was particularly polarizing: While some political actors framed the incident as an example
of the violent potential of left-wing extremism, others accused the police of deliberate provocation (Fiedler & Jansen,
2020).

Methods
Data acquisition
The data was collected in a user-centered approach. That is, all tweets that were produced by a seed set of users were
gathered. Moreover, all tweets containing the Twitter handle of one or more of the seed users were collected—this included
retweets, mentions, and replies to the users. With this method, not only first-order replies to a user in question could be
collected, but any part of a reply tree that had been initiated by the user (see Figure 2). In the months preceding the
Saxon state elections in September 2019, a first seed set was constructed out of Twitter accounts of Saxon politicians,
Saxon media and Saxony correspondents of national media. Politicians in the seed set were the leaders of the local party
organizations, the leaders of fractions in the state parliament, the Saxon members of the national parliament and the
European parliament and the candidates for the upcoming elections that had an active Twitter account. The seed set was
expanded with a snowball-sampling method: In each sampling step, users that were not contained in the seed set but
retweeted or mentioned at least once a week by users that were already in the seed set and were related to Saxony were
included. The latter criterion was necessary to exclude nation-wide media accounts and national politicians. At the end of
July, the final seed set consisted of 270 users.
   Tweets were gathered until February 2020. This allowed observation of other Saxony-related events, such as the NYE
incident. Since the seed set was not perfectly tailored towards this event, we restricted the analysis to the subset of tweets
containing certain event-specific keywords (see Supplementary Material). The tweets used for the analysis of the election
stem from the time period between the 25th of July and the 10th of September (364,626 tweets). For the NYE data set,
tweets from December 31 until January 19 (130,685) were used.

Network representations
We used networks as a mathematical abstraction to represent two types of interaction in the data set: retweets and replies.
Retweet networks were used to discern different opinion communities on Twitter, while reply networks made it possible
to assess how these groups participated in public debate.

Retweet networks Retweet interactions are represented as a directed network in which every node is a user. A link is
drawn from user a to user b every time a retweets b. It has become standard practice to employ community detection
algorithms to find strongly connected clusters in a retweet network which are then interpreted as groups of users sharing
an opinion or political position (Conover, Goncalves, Ratkiewicz, Flammini & Menczer, 2011a; Conover, Ratkiewicz,
Francisco, Gonçalves, Menczer & Flammini, 2011b; Gaumont, Panahi & Chavalarias, 2018).
   An alternative approach is the spatialisation of the retweet network via a force-directed algorithm, such as ForceAtlas2
(Jacomy, Venturini, Heymann & Bastian, 2014). The advantage of this alternative is that while “community detection
algorithms tend to generate clear-cut and non-overlapping partitions, force-directed spatialisation reveals zones of different
relational density but with blurred and uncertain borders” (Venturini, Jacomy & Jensen, 2019, p. 13). Public debate and
the different opinion camps cannot be clearly demarcated from one another, and regions of transition between different
groups, that do not clearly belong to any one of them, are politically meaningful and should hence be discernible. We
therefore based our analysis and the affiliation of users to different clusters on the force-directed representation of the
retweet network. This will make the analysis more coarse-grained in one sense, but more nuanced in another: There will

Prepared using sagej.cls
5

usually be fewer communities, but the communities will represent more fundamental divides and it will be possible to
discern the border regions in-between, which can be treated as separate clusters.
   As will be shown in the following section, retweet networks of both events showed polarized structure in the force-
directed layout. The users were classified into one of three opinion camps with respect to their position in this polarized
layout (one for the pole which included the majority of users, one for the minority pole, and one for the users in the border
region between the poles).
Reply trees and reply networks Due to the user-centered data collection, it was also possible to retrieve an exhaustive
collection of all replies that were initiated by posts of the seed users. A post together with all its replies can be represented
by a reply tree (see Figure 2). Only taking into account reply trees initiated by the prominent seed users corresponds quite
naturally to the distinction of the previous section between representatives of interest groups debating publicly and the
spectator-like body approving or disapproving subsequently (Price, 1992). These reply threads then function as spaces
where different opinion groups can confront each other: They are widely visible due to the prominence of the creator
of the tweet which spans up discussion, and can hence attract users of different opinion camps. Retweets, on the other
hand, mainly serve to share information with one’s followers. A retweet might point towards a debate, but does not imply
involvement in it.
   In order to gain a global view on public debate, we aggregated the combined interaction structure of all reply trees into
one reply network, assigning a directed edge between two users if one had directly replied to the other in a tree (see Figure
1). (Obviously, trees are networks, too. But if we in the following speak of reply networks, we mean the bigger networks
constructed in this procedure.)
   Some works have taken similar routes by taking into account direct user interactions in the form of mentions (Conover,
Ratkiewicz, Francisco, Gonçalves, Menczer & Flammini, 2011b) and replies (Sousa, Sarmento & Mendes Rodrigues,
2010; Aragón, Kappler, Kaltenbrunner, Laniado & Volkovich, 2013; Yardi & boyd, 2010). Sousa, Sarmento and Mendes
Rodrigues (2010) and Yardy and boyd (2010) use a keyword-based tweet collection. This approach is useful if one is
solely interested in tweets that include a certain keyword, while full conversations in a reply thread between users are not
accessible with the method. Aragn, Kappler, Kaltenbrunner, Laniado and Volkovich (2013) and Nuernbergk and Conrad
(2016) employ a user-centered collection and construct a reply network, but only between politicians on Twitter and hence
do not capture debate among a more general public. Since the data sets in the present contribution include the complete
reply trees below each post of one of the seed users, it was possible to gain a more general perspective on public debate
that did not only include certain elites.
   The classification of users from the retweet network—the information about whether they belonged to the minority
or majority pole, or the in-between region—was imported into the reply trees and networks. This made it possible to
investigate how many users of the different retweet clusters were also involved in public debate, hence willing to express
their opinion in discussion with others of possibly different opinions, and whether users of different opinion clusters
debated mainly among each other or with others.
   It must be noted here that not all users involved in debate were present in the retweet network. Hence, the classification
in the reply trees and networks was not complete. Initially, around 47% of the users involved in debate in the election data
set could be classified (33% for NYE). In order to include more users in the classifications, a larger retweet network was
additionally constructed which included all retweets from July 2019 until the end of February 2020. The overall structure
of the network was similar to the incident-specific retweet networks (see Supplementary Material). If a user was present in
the reply trees, but not present in the incident-specific retweet network, it was checked whether the user was present in the
large retweet network—if so, the user was assigned the classification from this network. With the use of the big retweet
network, 63% (election) and 67% (NYE) of users present in the reply trees could be classified.

Findings
Retweet networks and classification
The retweet networks for both cases are strongly polarized (see Figure 1 A/B) in the force-directed layout.
   For the election data set (31,108 users in the giant component), seed users placed in the majority pole are politicians
of the parties SPD, Die Linke, and Bndnis 90/Die Grnen (and one politician of the CDU), along with media accounts
(e.g. Bild Leipzig, LVZ, or MDR Sachsen) and left-wing activists. In the region between the two clusters, politicians of
the CDU, Freie Waehler and FDP are placed, as well as media accounts (e.g. MDR Aktuell, Bild Dresden, or TAG24).
The minority pole, on the other hand, includes seed users from the AfD, Freie Waehler, Blaue Partei and the anti-Islam
movement Pegida. The structure of the retweet network hence quite accurately mirrors the political constellations in the

Prepared using sagej.cls
6 Journal Title XX(X)
A Jörg Urban SPD Saxony
B
(AfD Saxony, chairman)
Saxon Police Juliane Nagel
(Die Linke Saxony)
Sebastian Wippel
(AfD Saxony)
CDU Saxony
Michael Kretschmer
Michael Kretschmer (CDU Saxony, MP)
(CDU Saxony, MP)
Katja Kipping
(Die Linke, chairwoman)
C Katja Kipping D
(Die Linke, chairwoman)
SPD Saxony
Michael Kretschmer
(CDU Saxony, MP)
Michael Kretschmer
(CDU Saxony, MP) Sebastian Wippel
(AfD Saxony)
Saxon Police
CDU Saxony
Juliane Nagel
Jörg Urban (Die Linke Saxony)
(AfD Saxony, chairman)
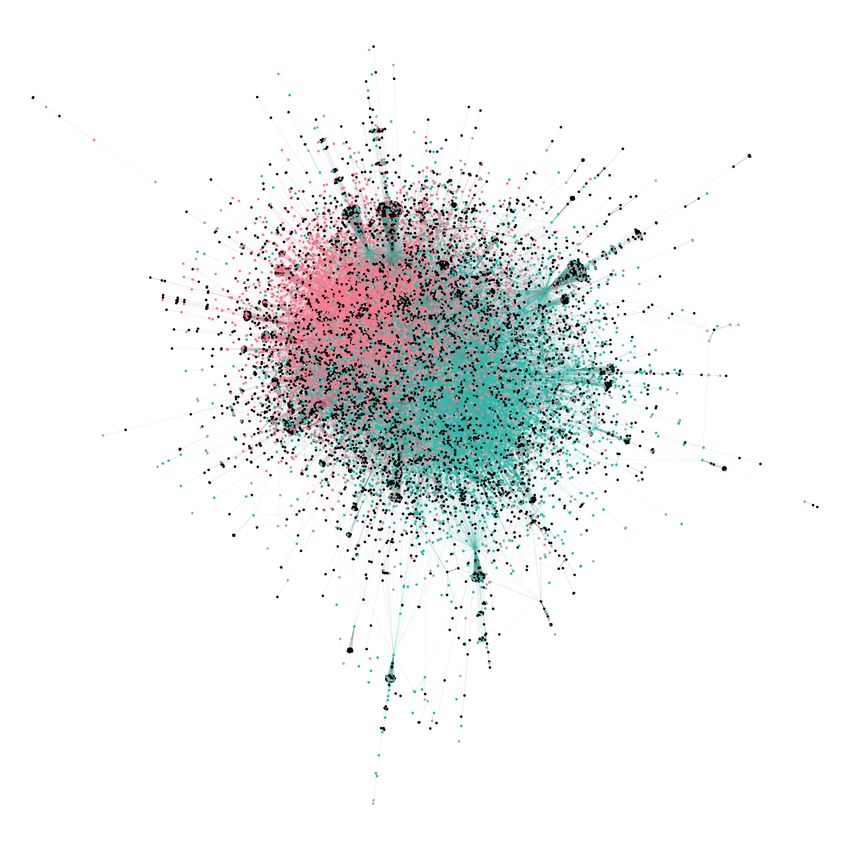
Figure 1. The giant component of the retweet networks (above) for the elections (A) and the NYE incident (B), and the giant
component of the reply networks (C: elections, D: NYE). The retweet networks are both polarized, and users are classified
according to their position in the force-directed layout. The borders for the classifications are included (black lines). The
classifications are imported in the reply networks, which are not polarized. Black nodes indicate users that do not show up in the
corresponding retweet network.
run-up to the elections. Left-wing and eco-friendly parties are placed in one cluster and the right to far-right parties in
another, while politicians of the market-liberal FDP and the center-right CDU are located in-between the two.
The users of the majority cluster made up 64.5% (20,052) of the retweet network, 23.1% (7,195) were part of the
minority cluster, and 12.4% (3,861) of the users were in the region between the two.
A very similar structure, both in proportions and in political leanings, is given for the NYE incident. Some differences
occur, however. The set of users placed in-between the two clusters (711 or 7.9%) includes the official account of the
city of Leipzig and the account of the Saxon police, as well as one politician of the AfD, one from Die Linke and one
SPD politician. The majority (6,010 users, 66.6%) and minority cluster (2,301 users, 25.5% of the giant component) show
similar composition as in the election retweet network.
The classification of users on the basis of their position in the force-directed layout of the retweet network was taken
as a proxy for the political position of the users in the two issues. It must be noted, however, that users of one cluster
should not necessarily be interpreted as holding exactly the same opinion or political position. Rather, the clusters reflect
an issue-specific fundamental political difference which is then also reflected by the classification.
Prepared using sagej.cls7
A B
First-order replies
Root tweet Size S = 10
Depth D = 5
Figure 2. An exemplary dummy reply tree (A), along with two reply trees from the data set (B). Each node represents a tweet,
and a directed edge between two nodes indicates a reply. If the users of the tweets appear in the retweet network, their replies
were color-coded according to the cluster of the user (a black node indicates a reply by a user that does not appear in the
retweet network). The root tweet is the original tweet by one of the seed users, while first-order replies are the direct replies to
the root tweet.
$ %
7UHHVKDUH
FXPXODWLYH
7UHHVKDUH
FXPXODWLYH
(OHFWLRQ (OHFWLRQ
18 Journal Title XX(X)
Table 1. Users and replies from the different retweet clusters involved in the reply trees.
Election NYE
Users Replies Users Replies
Majority cl. 6,736 (33.3%) 30,615 (40.5%) 2,008 (32.4%) 6,403 (39.2%)
Minority cl. 4,696 (23.2%) 23,790 (31.5%) 1,727 (27.9%) 4,858 (29.8%)
Intermediate cl. 1,470 (7.0%) 6,785 (9.0%) 389 (6.3%) 1,235 (7.6%)
Not classified 7,395 (36.5%) 14,344 (19.0%) 2,072 (33.4%) 3,816 (23.4%)
Table 2. First-order replies by retweet clusters. First-order replies from users of the two poles are roughly equal in number in
both data sets and make up the majority of all first-order replies. The minority cluster is even more active in replies of first order
than in reply trees in general.
Election NYE
Majority cl. 15,347 (36.0%) 2,445 (32.7% )
Minority cl. 14,911 (35.0%) 2,451 (32.8%)
Intermediate cl. 3,710 (8.7%) 572 (7.6%)
Not classified 8,629 (20.3%) 2,014 (26.9%)
Table 3. Percentage of users in the incident-specific retweet networks that are active in the reply networks (seed users
excluded) by cluster. The share of users from the minority pole is, in both cases, around twice as big as the share of users from
the majority pole. User share from the in-between region is slightly bigger than that of the majority pole in both cases.
Election NYE
Majority cl. 22.4% (4,644) 16.2% (977)
Minority cl. 48.2% (3,604) 32.2% (752)
Intermediate cl. 26.4% (1,050) 22.0% (707)
the corresponding retweet network was 64.5% to 23.1%. For the NYE incident, even more users from the minority retweet
cluster participated in the debate—32.4% belonged the majority in the NYE retweet cluster, while 27.9% were minority
users involved in the debate (see Table 1). Users placed in-between the two poles in the retweet network also participated
in the debate, but less so both in number of users and in number of replies. 36.5% (election) and 33.4% (NYE) of the users
that participated in the reply trees were not present in the retweet network (i.e., they did not retweet any of the seed users
nor any tweets that contained the Twitter handle of one of the seed users). Interestingly, while these users make up the
biggest number of users involved in the debate, they do not constitute the majority in terms of replies. In both data sets,
users from the poles of the retweet network, if involved in the debate, are most active. Users from ‘outside’ do not tend to
debate often and extensively—on average, in both data sets, they only give around two replies.
First-order replies are of special interest since they are usually directly displayed below the root tweet on Twitter.
Therefore, they most probably have a stronger impact on the perception of public opinion than tweets that are at the end
of a long discussion branch. The amount of first-order replies by the different clusters is displayed in Table 2. First-order
replies from users of the two poles are roughly equal in number in both data sets. Minority pole users hence produced an
even larger proportion of highly visible replies. Users from the intermediate region in the retweet network only account
for less than 10 percent of first-order replies, while users that were not present in the retweet networks produced 20.3%
(election) and 26.9% (NYE) of the replies of first order.
Comparing engagement in the form of replies and retweets makes it possible to assess whether the different opinion
groups show different inclination to participate in the debate. To this end, we calculate the share of users present in the
different clusters of the incident-specific retweet networks3 that were also present in the respective reply network (see
Table 3). For both events, the groups showed significantly different behavior (election: χ2 = 850.7, p < 0.001; NYE:
χ2 = 138.2, p < 0.001). Users of the minority cluster were roughly twice as likely to get involved in the debate than users
belonging to the majority cluster (election: z-score 41.0, p < 0.001; NYE: z-score 15.0, p < 0.001). Users from the in-
between region were slightly more active in the debate than users from the majority pole (election: z-score 5.4, p < 0.001;
NYE: z-score 4.0, p < 0.001), but still less than the minority pole (election: z-score 22.1, p < 0.001; NYE: z-score 46.0,
p < 0.001).
Prepared using sagej.cls9
Table 4. Reply interactions between and within the different clusters—the columns show what cluster the replies are from, the
rows who the cluster replies to. The percentages (in brackets) are given with respect to the overall number of replies a cluster
has given. Note that the column entries do not sum up to the overall number of given replies since there are also replies from
users that do not show up in the retweet networks, hence could not be classified.
Election NYE
to/from Majority cl. Minority cl. Intermediate cl. Majority cl. Minority cl. Intermediate cl.
Majority cl. 18,185 (59.4%) 10,590 (44.5%) 3,596 (53.0%) 3,234 (50.5%) 2,814 (57.9%) 821 (66.5%)
Minority cl. 5,778 (18.9%) 5,964 (25.1%) 1,035 (15.3%) 1,445 (22.6%) 827 (17.0%) 162 (13.1%)
Intermediate cl. 4,770 (15.6%) 6,025 (25.3%) 1,757 (25.9%) 1,041 (16.3%) 949 (19.5%) 191 (15.5%)
Overall 30,615 23,790 6,785 6,403 4,858 1,235
Hence, two findings are worth stressing: (i) Minority pole users are disproportionately active in the debate compared
to the majority pole, both in number of users involved and of replies written (see also the Discussion). This effect is even
more pronounced in first-order replies that are, by platform design, most visible. And (ii), users from both poles of the
retweet network, if they take part in the debate in the form of replies, do so more extensively than users from in-between
the poles or unclassified users.
Reply networks and global interaction patterns
The reply networks give a more comprehensive structural picture of debate—it is possible to make visible patterns of
discussion between different users and user groups beyond interactions in single reply trees. Each reply network was
constructed by aggregating all reply interactions in the reply trees into one big network, where each node represents a user
and a directed edge is created between two users if one has replied to the other.
The question of interest here is whether the groups also exhibit large-scale polarization when they discuss among each
other, and whether there are differences in discussion behavior between the groups. If public debate was fragmented in the
sense that discussion ties were only existent amongst a certain subset of users, this would be visible in the force-directed
layout of the reply network. But, as is displayed in Figure 1 C/D, this is the case for neither of the two events (again,
spatialisation was carried out with ForceAtlas2). Users of clusters that are clearly separated in the force-directed layout of
the retweet networks interact quite frequently in the form of replies.
A useful measure describing the tendency of individuals in a network to link to others with similar properties or attributes
is assortativity (Newman, 2003), which yields one assortativity coefficient for a whole network. An assortativity coefficient
of r = 1 means that all edges in the network only connect nodes of the same type, while for r = −1, the edges only connect
nodes of different type (hence, the network is strongly disassortative). It has been argued that such a global view might
obstruct insights into local differences between individuals or groups (Peel, Delvenne & Lambiotte, 2018). Using local
assortativity has been proposed in order make those differences visible—each node l in a network is assigned a local
assortativity score r(l), such that differences in the score can be compared across all nodes. For a detailed account of how
local assortativity is computed, see the Supplementary Material.
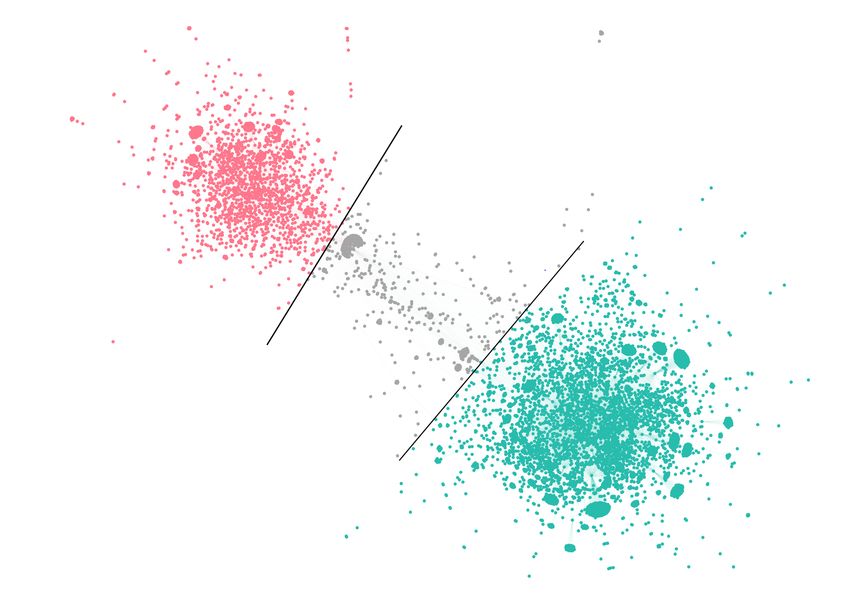
In Figure 4, the local assortativity distributions of users of the different groups are displayed. The distributions are
multimodal, i.e. exhibit more than one peak. In the election data set, users of the majority cluster (A) have their largest
peak at a local assortativity close to 1, i.e. they reply mainly to users of their own clusters (and, since local assortativity
also takes into account the assortativity of the broader neighborhood, also mainly interact with users who do the same).
A second, yet smaller peak is visible with negative local assortativity (around −0.3). Hence, some majority cluster users
mainly seek debate with users from other clusters. The reverse holds for the minority cluster (B): There, most of the users
reply to users from the other groups. A smaller peak is visible at positive local assortativity (around 0.6). Users from the
intermediate region (C) also exhibit a multimodal distribution, with one slightly negative peak and one peak at around 0.6.
The NYE data shows an even more pronounced trend: Only few users of the minority cluster get assigned a positive local
assortativity. Majority group users again show a bimodal distribution with one peak close to rl = 1, the other peak is now
at around rl = −0.6.
Further insight into the interaction patterns between the different clusters is provided by Table 4, which shows counts
of replies between and within the clusters. While users of the majority cluster of the retweet network address almost 60%
(election) or 50% (NYE) of their replies to other users of their own cluster, the opposite holds for the other groups: Most of
their replies are directed towards users from the majority cluster. For the election, users of the intermediate cluster replied
more often to others from their cluster than to the minority pole, while for the minority pole, replies to the own and replies
Prepared using sagej.cls10 Journal Title XX(X)
(OHFWLRQ
$ 0DMRULW\FOXVWHU % 0LQRULW\FOXVWHU
)UHTXHQF\
& ,QWHUPHGLDWHFOXVWHU ' $OOGLVWULEXWLRQV
)UHTXHQF\
í í í í í í
/RFDODVVRUWDWLYLW\ /RFDODVVRUWDWLYLW\
111
Discussion
Vincent Price’s comparison of public debate and town meetings receives a refinement in the conclusion of Price (1992).
He states that:
“The democratic foundations of the concept of public opinion are indisputable; far less so are the democratic
foundations of day-to-day political decisions, even when they are formed out of public debate. [...] We may
well compare public debate to a town meeting—provided we keep in mind that although some town meetings
enjoy free-flowing debate, there are other meetings for which almost no one shows up, at which powerful
leaders and organized coalitions dominate, and at which people with minority viewpoints are shouted down
or left standing outside.” (Price, 1992, p. 91)
The paragraph is quoted at length here since it illustrates aspects of public debate that might be amplified in online
environments, specifically by social media. While the facilitation of communication bears the potential of enabling
minorities and their concerns to gain public attention (Toepfl & Piwoni, 2015; Fraser, 1990), it can easily introduce
systematic biases in the perception of public opinion. Online user comments are generally an important source of
information for many and help in judging whether a product is good, a certain video is worth watching—or whether certain
views should be taken into consideration in political decisions. While the experiences and opinions of others can provide a
very useful basis for decision in these contexts, naive reliance on what others express online can be collectively dangerous,
especially in an era in which social media shapes politics to an unprecedented extent. If groups with certain minority
opinions manage to become increasingly visible, their opinions might appear more socially acceptable and accepted than
they actually are. Such disparities can be problematic since perceived public opinion, as different studies have shown,
can have a persuasive and/or silencing effect (Noelle-Neumann, 1984; Noelle-Neumann & Petersen, 2004; Lee & Jang,
2010; Noelle-Neumann, 1980). Under certain circumstances, committed minorities might even be able to gain public
predominance, while the majority falls silent (Gaisbauer, Olbrich & Banisch, 2019; Banisch, Gaisbauer & Olbrich, 2020).
In the context of Twitter, this phenomenon might be especially problematic due to its tight links with traditional media
and news outlets, where Twitter content is often directly taken as representing public opinion (McGregor, 2019) or used
as a source in routine coverage (Paulussen & Harder, 2014; Broersma & Graham, 2013; McGregor & Molyneux, 2020),
introducing either strongly biased data or leading to a potentially false alarmism in coverage.
This study shows that there are such biases regarding the Twitter activity of users with a right-wing populist background
for two events of national interest in Germany. Reply sections on Twitter, being understood as the spaces where the
‘voice of the public’, public opinion (Lee & Jang, 2010; Lee, 2012), can enter debate, give a misleading picture of
opinion proportions on the platform. More precisely, it has been shown that in pure number of replies in the data sets,
disproportionately many come from users which constitute, if retweet networks are considered, a minority—composed of
accounts by right to far-right parties, politicians, and users retweeting their content. It is hence probable that the content
produced by this group influenced mere observers’ perceptions of public opinion to a degree that did not reflect their real
number. Interestingly, users of different clusters also diverge in who they tend to reply to. While users from the majority
cluster tend to interact mainly amongst themselves, users from the intermediate and especially from the minority cluster
are more keen on confronting differently-minded others (Figure 4, Table 4).
Previous findings from Switzerland point in the same direction: It has been shown that users with a right-wing political
leaning engage more frequently in the comment sections of news pages (Friemel & Dötsch, 2015), an effect also visible in
Table 3. As an explanation for this effect in connection to the rise of right-wing populism, Schweiger (2017) argues that
misperceptions of the opinion climate, fuelled by news consumption through social media, lead to higher willingness of
opinion expression for certain social groups—especially for those who already put less trust in established media sources,
and those who lack awareness about the bias implicit in social media.
With the proposed method, differences in willingness of opinion expression can be made visible. We stress that the
method proposed here is not restricted to the specific cases studies. With a suitable seed set of users, any debate on Twitter
can be analysed analogously. It is, nevertheless, limited in scope: It attempts to gain a comprehensive structural view on
Twitter debate, but does not analyze the content of the tweets. Moreover, a proportion of users in the data sets remains
unclassified by the employed method since they did not appear in the retweet networks. Complementary methods of
classification should be sought.
Finally, Twitter is only one social media platform, which in addition is not representative of the general population
(Mellon & Prosser, 2017). A potentially insightful avenue for future inquiry might be the comparison of reply sections
with comment sections of online newspapers (Willaert, Banisch, Van Eecke & Beuls, 2019). Still, as we have argued,
both Twitter’s platform design as well as its echo in traditional media outlets at least implicitly award Twitter the role of
Prepared using sagej.cls12 Journal Title XX(X)
the host of the big town meeting called public debate. We therefore deem it increasingly important to develop methods
which enable a better understanding of which viewpoints are prominently featured on the platform, and which ones remain
mostly unspoken or unheard.
Acknowledgements
We are grateful for the repeated discussion of the ideas described in the paper with Stephanie Juetersonke, Stephan Poppe, Wolfram
Barfuss, Roger Berger, Marcel Sarkoezy and the members of O DYCCEUS.
Declaration of conflicting interests
The author(s) declared no potential conflicts of interest with respect to the research, authorship, and/or publication of this article.
Funding
This project has received funding from the Euro-pean Unions Horizon 2020 research and innovation programme under grant agreement
No. 732942 (www.Odycceus.eu).
Notes
1. Often, social media platforms themselves provide tools or even supply journalists with data or analyses in order to get mentioned
in their articles (McGregor, 2019).
2. ‘Expressions’ is interpreted very broadly: Noelle-Neumann’s account includes also non-verbal modes of communication, e.g.
badges that support certain political parties or even subtle facial expressions such as raised eyebrows.
3. Note that the numbers and percentages here are related to the incident-specific retweet networks. Including the retweet network
constructed out of all retweets in the time from July 2019 to February 2020 yields different numbers, but very similar tendencies
(see the Supplementary Material).
References
Aragón, P., Kappler, K. E., Kaltenbrunner, A., Laniado, D. & Volkovich, Y. (2013). Communication dynamics in twitter
during political campaigns: The case of the 2011 spanish national election. Policy & internet, 5(2), 183–206.
Baker, K. M. (1990). Public opinion as political invention (p. 167200). Inventing the French Revolution: Essays on French
Political Culture in the Eighteenth Century. Cambridge University Press.
Banisch, S., Gaisbauer, F. & Olbrich, E. (2020). How social feedback processing in the brain shapes collective opinion
processes in the era of social media. arXiv:2003.08154.
Broersma, M. & Graham, T. (2013). Twitter as a news source: How dutch and british newspapers used tweets in their
news coverage, 2007–2011. Journalism practice, 7(4), 446–464.
Bruns, A. & Burgess, J. (2014). Crisis communication in natural disasters: The queensland floods and christchurch
earthquakes. Twitter and society [Digital Formations, Volume 89]: (pp. 373–384).
Bruns, A. & Burgess, J. (2015). Twitter hashtags from ad hoc to calculated publics. Hashtag publics: The power and
politics of discursive networks (pp. 13–28).
Burnap, P., Gibson, R., Sloan, L., Southern, R. & Williams, M. (2016). 140 characters to victory?: Using twitter to predict
the uk 2015 general election. Electoral Studies, 41, 230–233.
Conover, M. D., Goncalves, B., Ratkiewicz, J., Flammini, A. & Menczer, F. (2011a). Predicting the political alignment of
twitter users. In 2011 IEEE Third International Conference on Privacy, Security, Risk and Trust and 2011 IEEE Third
International Conference on Social Computing (pp. 192–199).
Conover, M. D., Ratkiewicz, J., Francisco, M., Gonçalves, B., Menczer, F. & Flammini, A. (2011b). Political polarization
on twitter. In Fifth international AAAI conference on weblogs and social media.
Fiedler, M. & Jansen, F. (2020). Was geschah an silvester in leipzig-connewitz?
https://www.tagesspiegel.de/politik/angriff-auf-polizisten-wirft-fragen-auf-was-geschah-an-silvester-in-leipzig-
connewitz/25386832.html (last accessed: 20 June 2020).
Fraser, N. (1990). Rethinking the public sphere: A contribution to the critique of actually existing democracy. Social text,
(25/26), 56–80.
Friemel, T. N. & Dötsch, M. (2015). Online reader comments as indicator for perceived public opinion.
Gaisbauer, F., Olbrich, E. & Banisch, S. (2019). The dynamics of opinion expression. arXiv preprint arXiv:1912.12631.
Prepared using sagej.cls13
Gaumont, N., Panahi, M. & Chavalarias, D. (2018). Reconstruction of the socio-semantic dynamics of political activist
twitter networksmethod and application to the 2017 french presidential election. PLOS ONE, 13(9), 1–38.
Gearhart, S. & Kang, S. (2014). Social media in television news: The effects of twitter and facebook comments on
journalism. Electronic News, 8(4), 243–259.
Habermas, J. (2015). Between facts and norms: Contributions to a discourse theory of law and democracy. John Wiley &
Sons.
Jacomy, M., Venturini, T., Heymann, S. & Bastian, M. (2014). Forceatlas2, a continuous graph layout algorithm for handy
network visualization designed for the gephi software. PloS one, 9(6).
Jungherr, A. (2015). Analyzing political communication with digital trace data. Cham, Switzerland: Springer.
Kaiser, J. (2017). Public spheres of skepticism: Climate skeptics online comments in the german networked public sphere.
International Journal of Communication, 11.
Kalogeropoulos, A., Negredo, S., Picone, I. & Nielsen, R. K. (2017). Who shares and comments on news?: A cross-
national comparative analysis of online and social media participation. Social media+ society, 3(4).
Lee, E.-J. (2012). That’s not the way it is: How user-generated comments on the news affect perceived media bias. Journal
of Computer-Mediated Communication, 18(1), 32–45.
Lee, E.-J. & Jang, Y. J. (2010). What do others reactions to news on internet portal sites tell us? effects of presentation
format and readers need for cognition on reality perception. Communication research, 37(6), 825–846.
McGregor, S. C. (2019). Social media as public opinion: How journalists use social media to represent public opinion.
Journalism, 20(8), 1070–1086.
McGregor, S. C. & Molyneux, L. (2020). Twitters influence on news judgment: An experiment among journalists.
Journalism, 21(5), 597–613.
Mellon, J. & Prosser, C. (2017). Twitter and facebook are not representative of the general population: Political attitudes
and demographics of british social media users. Research & Politics, 4(3), 2053168017720008.
Mislove, A., Lehmann, S., Ahn, Y.-Y., Onnela, J.-P. & Rosenquist, J. N. (2011). Understanding the demographics of
twitter users. In Fifth international AAAI conference on weblogs and social media.
Mullen, B., Dovidio, J. F., Johnson, C. & Copper, C. (1992). In-group-out-group differences in social projection. Journal
of Experimental Social Psychology, 28(5), 422–440.
Mustafaraj, E., Finn, S., Whitlock, C. & Metaxas, P. T. (2011). Vocal minority versus silent majority: Discovering the
opionions of the long tail. In 2011 IEEE Third International Conference on Privacy, Security, Risk and Trust and
2011 IEEE Third International Conference on Social Computing (pp. 103–110).
Newman, M. E. (2003). Mixing patterns in networks. Physical Review E, 67(2).
Noelle-Neumann, E. (1980). Die Schweigespirale. ffentliche Meinung–Unsere soziale Haut. Riper [ie Piper].
Noelle-Neumann, E. (1984). Public opinion. our social skin.
Noelle-Neumann, E. & Petersen, T. (2004). The spiral of silence and the social nature of man. In Handbook of political
communication research (pp. 357–374). Routledge.
Nuernbergk, C. & Conrad, J. (2016). Conversations and campaign dynamics in a hybrid media environment: Use of twitter
by members of the german bundestag. Social Media+ Society, 2(1).
Paulussen, S. & Harder, R. A. (2014). Social media references in newspapers: Facebook, twitter and youtube as sources
in newspaper journalism. Journalism practice, 8(5), 542–551.
Peel, L., Delvenne, J.-C. & Lambiotte, R. (2018). Multiscale mixing patterns in networks. Proceedings of the National
Academy of Sciences, 115(16), 4057–4062.
Price, V. (1992). Public opinion, Volume 4.
Reissing, C. (2019). Sachsens cdu-kandidaten schlieen koalition mit afd aus.
https://www.mdr.de/nachrichten/politik/regional/cdu-schliesst-koalition-afd-aus-sachsen-100.html (last accessed:
20 June 2020).
Ross, L., Greene, D. & House, P. (1977). The false consensus effect: An egocentric bias in social perception and attribution
processes. Journal of experimental social psychology, 13(3), 279–301.
Schweiger, W. (2017). Der (des)informierte Bürger im Netz. Springer.
Schweiger, W. & Weihermüller, M. (2008). Öffentliche meinung als online-diskurs–ein neuer empirischer zugang.
Publizistik, 53(4), 535–559.
Sousa, D., Sarmento, L. & Mendes Rodrigues, E. (2010). Characterization of the twitter@ replies network: are user ties
social or topical? In Proceedings of the 2nd international workshop on Search and mining user-generated contents
(pp. 63–70).
Prepared using sagej.cls14 Journal Title XX(X)
Katja Kipping
(Die Linke, chairwoman)
SPD Saxony CDU Saxony
Michael Kretschmer
(CDU Saxony, MP) Jörg Urban
(AfD Saxony, chairman)
Figure 5. Largest retweet network, constructed out of all retweets in the data set from July 2019 to the end of February 2020.
Springer, N. & Kümpel, A. S. (2018). User-generated (dis) content. In Journalismus im Internet (pp. 241–271). Springer.
Toepfl, F. & Piwoni, E. (2015). Public spheres in interaction: Comment sections of news websites as counterpublic spaces.
Journal of Communication, 65(3), 465–488.
Trilling, D. (2015). Two different debates? investigating the relationship between a political debate on tv and simultaneous
comments on twitter. Social science computer review, 33(3), 259–276.
Tumasjan, A., Sprenger, T. O., Sandner, P. G. & Welpe, I. M. (2010). Predicting elections with twitter: What 140 characters
reveal about political sentiment. In Fourth international AAAI conference on weblogs and social media.
Venturini, T., Jacomy, M. & Jensen, P. (2019). What do we see when we look at networks.
Willaert, T., Banisch, S., Van Eecke, P. & Beuls, K. (2019). Facilitating on-line opinion dynamics by mining expressions
of causation. the case of climate change debates on the guardian. arXiv:1912.01252.
Yardi, S. & boyd, d. (2010). Dynamic debates: An analysis of group polarization over time on twitter. Bulletin of science,
technology & society, 30(5), 316–327.
Supplemental material
Large retweet network Figure 5 shows the retweet network constructed out of all retweets in the data set between the 1st of
July 2019 and then 24th of February 2020. If users were not present in the incident-specific retweet network, it was checked whether
this large retweet network contained the users to increase the amount of classified users. Figure 5 exhibits a very similar shape as the
incident-specific retweet networks. Out of 88,167 users, 71.8% belonged to the majority cluster, 18.4% to the minority cluster and 9.8%
to the intermediate region.
Prepared using sagej.cls15
Table 5. Percentage of users in the respective retweet networks (not only incident-specific) that are active in the reply networks
(seed users excluded) by cluster.
Election NYE
Majority cl. 10.3% (6,737) 3.1% (2010)
Minority cl. 28.1% (4,697) 10.2% (1727)
Intermediate cl. 14.5% (1,431) 4.3% (390)
Table 6. Percentage of users in the respective retweet (networks without replies) that are active in the reply networks (seed
users excluded) by cluster.
Election NYE
Majority cl. 21.5% (4,040) 16.5% (954)
Minority cl. 44.1% (2,173) 25.6% (386)
Intermediate cl. 24.7% (827) 22.3% (116)
Activity share and possible biases in the data In Table 3 of the main text, we attempt to assess whether users from different
clusters have different probabilities to get involved in debate. We use the incident-specific retweet network for the statistics there. One
can also use the incident-specific retweet cluster combined with the large retweet cluster (Figure 5). The effect then is even more
pronouned, as we show in Table 5.
We must note here, however, that the number of seed users in the majority pole is, for both data sets, significantly bigger than the
number of seed users in the minority pole. While we do believe that the snowball-sampling method yielded a representative sample of
important figures of Saxon politics and Saxon media outlets on Twitter, if this was not the case, a bias could have been introduced in
the activity share of users if many retweets were replies and minority pole users mostly commented in reply trees that were initiated
by majority pole users. In both data sets, around 20% of the retweets were replies. One can also construct a retweet network without
retweets of replies to make sure this bias is eliminated. The effect still holds (Table 6).
Local assortativity Local assortativity r(l) is defined by the equation (Peel, Delvenne & Lambiotte, 2018)
1 X
r(l) = (egg (l) − ag bg ),
Qmax g
with Qmax as the maximum modularity, which normalizes the assortativity coefficient. Maximum modularity is reached if all edges in
the network only connect nodes of the same type. The proportion of edges in the local neighborhood of node l which connect nodes of
the same type g is compared to ag bg , which is the proportion of edges between nodes of group g if one would randomly create edges
between nodes, while keeping the total number of outgoing and incoming edges for each type constant. ag here is the proportion of
edges starting from nodes of group g, while bg is the proportion of edges ending at nodes of group g. In general, egh is given by
X X Aij
egh = w(i; l) .
i:yi =g j:yj =h
ki
w(i; l) is a distribution over all nodes designed to capture the mixing patterns within the local neighborhood of node l. While there is
some freedom in the choice of this distribution, we follow Peel et al. (2018) in choosing the personalized PageRank vector
X Aij
wα (i; l) = α wα (j; l) + (a − α)δi,l .
j
ki
This is the stationary distribution of a random walk on the network, modified so that the random walker returns with probability α to
node l in each time step. Since the choice of α is arbitrary, a multi-scale distribution is generated by integrating over all possible values
of α,
Z 1
wmulti (i; l) = wα (i; l)dα.
0
The local assortativity coefficient is also capable of including incomplete metadata—since in the current data set, not all users could be
classified, this feature is beneficial. In the histograms displayed in Figure 4 (main text), the node contributions to the histograms were
Prepared using sagej.clsYou can also read