2019 Tasmanian Dairy Awards - DAMIEN AND BROOKE COCKER - University of Tasmania
←
→
Page content transcription
If your browser does not render page correctly, please read the page content below
CLEAR SPRINGS DAIRY
                       MANAGED BY TIM AND FIONA SALTER
                            Winners of the 2019 ANZ
                        Dairy Business of the Year Award

2019
Tasmanian
Dairy Awards                  DAMIEN AND BROOKE COCKER
                             Winners of the 2019 Fonterra Share
                              Dairy Farmer of the Year Award

        TASMANIAN
        INSTITUTE OF
        AGRICULTURE
2019 Tasmanian Dairy Awards
The Tasmanian Dairy Awards are organised by TIA and DairyTas. The Awards have been made
possible by the generous support of the following:

                                        SPONSORS
                            ANZ – Dairy Business of the Year Award
                       Fonterra – Share Dairy Farmer of the Year Award
                                   WFI – Dairy Safety Award
                             Veolia – Dairy Environmental Award
                       Cadbury – Young Farmer Encouragement Award.
                        Van Dairy Group - Employee of the Year Award
                       Aurora Energy – Dairy Employer of Choice Award
                      Elphinstone Stevens Pty Ltd – Dairy Services Award

                              ACKNOWLEDGEMENTS
Thank you to all the farmers who participate in the Awards.
The Dairy Business of the Year Award and Share Dairy Farmer of the Year Award are organised
by TIA. Data for these Awards has been analysed using DairyBase. The field days for these Awards
are conducted through the Dairy On PAR project which is funded by Dairy Australia and TIA.
Other Awards in this booklet are co-ordinated by DairyTas.
This booklet has been prepared by Samantha Flight, Nathan Bakker, Lesley Irvine and Symon
Jones, TIA.
Disclaimer: This publication has been prepared for the general information of dairy farmers in
Tasmania. TIA and the University of Tasmania do not accept any liability for damage caused by, or
economic loss arising from reliance upon information or material contained in this publication.

                                                                                      1|Page
Table of Contents
2019 Dairy Award Winners ....................................................................................................................... 3
2019 Dairy Business of the Year Awards ............................................................................................. 3
2019 Dairy Business of the Year Winners - Clear Springs Dairy ................................................ 5
Judges’ Comments – 2019 ANZ Dairy Business of the Year Award ............................................ 9
Finalist Profiles ............................................................................................................................................. 11
2019 Fonterra Share Dairy Farmer of the Year Winners – Damien & Brooke Cocker ..... 13
Judges’ Comments – 2019 Fonterra Share Dairy Farmer of the Year...................................... 16
Share Farmer Profiles................................................................................................................................. 17
Tasmanian Snapshot................................................................................................................................... 20
WFI Farm Safety Encouragement Award ........................................................................................... 25
Veolia Environment Award ...................................................................................................................... 27
Cadbury Young Dairy Farmer Encouragement Award.................................................................. 28
Van Dairy Group Employee of the Year Award ................................................................................ 29
Aurora Energy Dairy Employer of Choice Award............................................................................ 30
Elphinstone Stevens Pty Ltd Dairy Services Award ....................................................................... 31
Summary of all participants ..................................................................................................................... 32
Notes ................................................................................................................................................................. 33

                                                                                                                                                       2|Page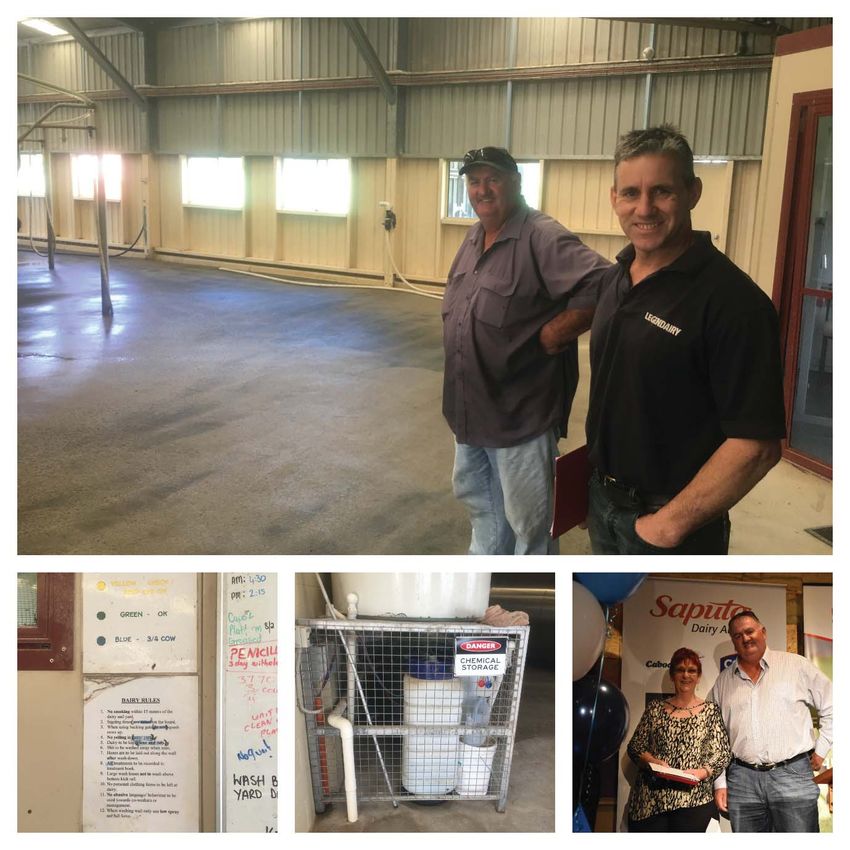
2019 Dairy Award Winners
In conjunction with TIA, DairyTas hosted the 2019 Dairy Awards Dinner on the evening of 21
March. Congratulations to the following winners:
2019 ANZ Dairy Business of the Year
Clear Springs Dairy, managed by Tim and Fiona Salter

2019 Fonterra Share Dairy Farmer of the Year
Damien and Brooke Cocker
Dairy Safety Award, sponsored by WFI
Wayne and Joanne Bowen
Dairy Environmental Award, sponsored by Veolia
Gary Watson
Young Farmer Encouragement Award, sponsored by Cadbury
Jeremy Page
Employee of the Year Award, sponsored by Van Dairy Group
Nigel Lee
Dairy Employer of Choice Award, sponsored by Aurora Energy
Dalmore Dairy
Dairy Services Award, sponsored by Elphinstone Stevens Pty Ltd
Peter Tyson

                                                                                3|Page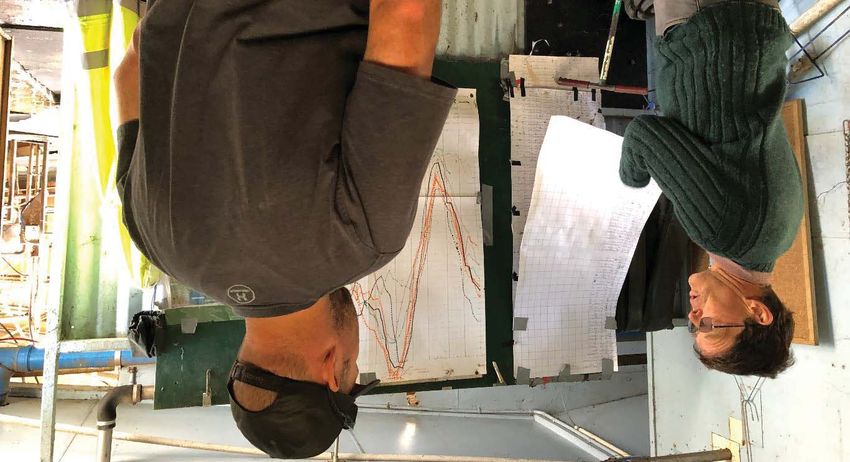
2019 Dairy Business of the Year Awards
DBOY Winners:         Clear Springs Dairy - managed by Tim and Fiona Salter
Finalists:            Waterhouse Dairies ‘Oxberry Dairy’ – managed by David Risbey-Pearn
                      Gary and Helen Strickland

Recent Past DBOY Winners
Year     Winner                                                           Participants
2018     Remlap                                                                36
2017     Mulder family, Forest                                                 34
2016     Brian & Michele Lawrence, Meander                                     31
2015     Bill & Jill Chilvers with Grant & Kim Archer, Symmons Plains          52
2014     Nigel & Rachael Brock, Montana                                        35
2013     Rob, Norm & Lesley Frampton, Gawler                                   31
2012     Rob & Jo Bradley with Grant & Kim Archer, Cressy                      40
2011     Darron & Veronica Charles, Mawbanna                                   33
2010     Grant & Melanie Rogers, Ouse                                          45
2009     Huisman family & Hatfield Dairies P/L                                 36
2008     Paul & Nadine Lambert, Merseylea                                      36
2007     Gary & Helen Strickland, King Island                                  36
2006     Stephen & Karen Fisher, Togari                                        40
2005     Symon & Louise Jones, Gunns Plains                                    50
2004     John & Katrina Sykes, Ringarooma
                                                                               42
         Alan & Rosie Davenport, Derby
2003     Grant & Kim Archer, Mella                                             47

                                                                              4|Page
2019 Dairy Business of the Year Winners -
            Clear Springs Dairy
                       Managed by Tim and Fiona Salter
Clear Springs Dairy is in its third season     data entry for benchmarking a much easier
following conversion from a beef property.     process.
The Meander property is owned by a
                                               Other data, such as nitrogen and concentrate
syndicate of family investors led by Andrew
                                               use is managed in Excel. This has been set-up
Beattie and John Hewitt from Limberlost.
                                               to allow them to easily produce graphs and
                                               reports for meetings.
                                               At the farm level, Tim and Fiona conduct
                                               toolbox meetings with their team every
                                               month.    Farm     safety   issues   and
                                               improvements are discussed at these
                                               meetings.

Management
Tim and Fiona Salter have managed the
property since it was converted. They are
responsible for employing their farm team,
the day-to-day management as well as
preparing options and budgets for strategic
discussion with the board or management
team.                                          Tim and Fiona are enthusiastic knowledge
The business has quarterly board meetings      seekers. They regularly attend discussion
with the farm managers and investors. There    groups and get involved in the many
are also monthly management support            different programs offered within the dairy
meetings with Tim and Fiona (managers),        industry.
Andrew Beattie, John Wilson (owners) and
Brian Lawrence (local farmer). At these          “One of the biggest
meetings, the group discuss the farm walk
data, milk production, nitrogen use, feed
budget actual versus predicted, cow health
                                                things is being open
and condition, and seasonal decisions such
as dry-off date.
                                                  to other opinions
Fiona manages all the farm’s financial               and advice”
information using Xero. Data is allocated to
categories according to Dairy Australia’s      Through their learning and experience, they
standard chart of accounts. Fiona has set-up   have identified their focus for managing a
a report template that summarises the data     successful dairy business: achieving high
to match the sections in DairyBase making      pasture consumption and healthy cows.

                                                                                 5|Page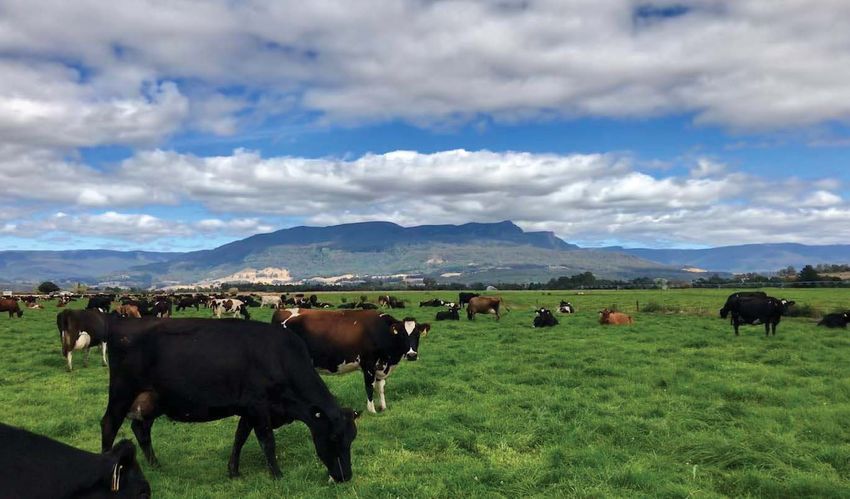
Achieving   high                   pasture        Nitrogen is applied post-grazing once or
                                                  twice weekly by a contractor at a rate of 1 kg
consumption                                       N/ha/day. Straight urea is used for most of
                                                  the year but when frosts start, a mixture of
The amount of pasture harvested on the
                                                  urea and sulphate of ammonia is used.
farm has increased by almost 2 t DM/ha
                                                  Nitrogen is generally not applied in July or
since the first year of the conversion. In
                                                  August because it is too wet. The weather
2017-18, the amount of feed harvested on
                                                  forecast is always considered when
the farm (grazed plus conserved) was 10.5 t
                                                  scheduling fertiliser applications to ensure
DM/ha. This is with 70% of the farm
                                                  there isn’t any run-off into waterways.
irrigated. Tim has a strong focus on
                                                  Gibberellic acid is applied in June.
managing pasture to provide quality feed to
the cows. This involves undertaking weekly        Effluent is managed in a two-pond system.
farm walks with a plate meter and producing       The first pond holds 5 ML. Liquid flows
a feed wedge to assist in the development of      through into the second pond which can hold
the weekly grazing plan. Pre-grazing              15 ML. Effluent is irrigated through the 13-
measurements of paddocks about to be              span pivot.
grazed are also done to check the amount of
pasture available to the cows. Pasture is         Healthy cows
grazed at the 2.5 leaf stage or canopy closure
– whichever occurs first. Monthly pasture         The Salter’s are milking over 1000 cows on
samples are collected and sent for quality        the 370 hectare milking area.
analysis. A grazing residual of 1650 kg           The Salter’s believe having healthy cows is
DM/ha is targeted. If the residual is higher      essential to managing a profitable dairy farm.
than 1800 kg DM/ha the paddock will be            For Tim, this starts with monitoring cow
topped.                                           condition and keeping it in the target range.
Tim and Fiona participated in the Meander         While pasture is the major component and
discussion group’s recent Measuring and           focus on this farm, concentrate supplement
Monitoring Boot Camp to hone skills in using      is used to fill feed gaps or provide the cows
pasture management data to make decisions.        with extra feed if condition is below target.

Tim is also currently participating in the        A fixed-time artificial insemination program
Beyond Water Smart Irrigation discussion          is used on the farm. AI is used for 6 weeks. In
group being facilitated by TIA. The farm has      the 2018-19 season, 65% of cows conceived
3 pivot irrigators. A 13-span pivot irrigating                                 to the fixed-time
140 ha, a 9-span pivot irrigating 82 ha and a                                      insemination
7-span pivot irrigating 45 ha. Tim is keen to                                  and a 74% 6-
learn more about using water efficiently to                                    week in-calf rate
grow      more     pasture.    He     believes                                 was      achieved.
participation in the irrigation specific                                       This is followed
discussion group this season has resulted in                                   by a 3-week bull
better pasture growth rates.                                                   mating period
                                                                               using       Jersey
The business participates in the Fert$mart                                     bulls and beef
program with consultant Bill Cotching. A                                       bulls – Speckle
fifth of the farm is soil-tested each year and                                 Park           and
an annual fertiliser plan developed from the                                   Hereford.       No
results. The farm had a good fertiliser history                                inductions are
so there isn’t a large capital fertiliser                                      used.
requirement. Extra fertiliser is applied to
paddocks where silage and hay is harvested.
                                                                                     6|Page
that night and a second dot is sprayed on
                                                  their rump. The next morning they receive a
                                                  third feed of tested colostrum. After the third
                                                  feed, they will then be fed 6 litres of pooled
                                                  colostrum/fresh milk each day. Calves are
                                                  trained on the towable feeders from day 3. At
                                                  the moment, Salter’s are rearing 400 heifer
                                                  calves as they are still growing the herd to
                                                  reach 1200 cows.
Fiona manages the calf rearing. Calves are        Calves are weighed regularly and weaning
collected from the calving pad 2-3 times per      from milk begins when they reach 70 kg and
day. All calves are fed colostrum when they       is completed when they reach 90 kg. Once
are brought into the shed. Fiona uses a ‘dot’     calved are weaned from milk, they are put
system to ensure calves have received their       into groups of up to 200. Concentrates
colostrum. Calves are given their first feed of   feeders are placed with each group so they
tested colostrum off the feeder when they         continue to have access to concentrates. The
are brought into the shed and a dot is            calves are put on agistment once they reach
sprayed on their rump. If they won’t drink,       110 kg and they stay on agistment until just
they are stomach-tubed and a dot is sprayed       prior to calving. When they are brought
on their head so extra attention is given to      home, the heifers are teat sealed.
them on the feeder next time. The calves are
then given another feed of tested colostrum

                                                                                     7|Page
Table 1 Key performance indicators for Clear Springs compared to the state average (2017-18)

                                                              Clear Springs       Clear Springs   Tasmanian
 KEY PERFORMANCE INDICATORS
                                                                2016-17             2017-18        average
 Usable area, ha                                                   370                 370           289
 Milking area, ha                                                  360                 370           208
 Irrigated area, ha                                                260                 260           137
 Cows milked, number                                               905                1,080          607
 Stocking rate, cows/milking area                                  2.5                 2.9           2.9
 Milksolids per cow, kg MS/cow                                     382                 421           445
 PASTURE AND FEED – MILKING AREA
 Grazed feed, t DM/ha                                                8.4                 9.9        10.1
 Conserved feed, t DM/ha                                             0.3                 0.6         0.5
 Total Homegrown Feed, t DM/ha                                      8.8                 10.5        10.6
 Grazed feed fed, t DM/cow                                           3.4                 3.4         3.5
 Homegrown fodder fed, t DM/cow                                      0.2                 0.2         0.2
 Purchased fodder fed, t DM/cow                                      0.0                 0.3         0.4
 Purchased concentrate fed, t DM/cow                                 0.6                 0.8         1.2
 Total feed fed, t DM/cow                                           4.1                 4.8         5.3
 Nitrogen applied, kg N/ha                                          204                 227         219
 Water used, ML/irrigated ha                                         3.2                 2.7         3.8
 Total water use efficiency, t DM/100mm/usable ha                   0.65                0.85        0.87
 FINANCIAL KPI’s ($/kg MS)
 Milk income (net)                                                  5.16                6.11        5.95
 Livestock trading profit                                           0.93                0.57        0.71
 Other farm income                                                  0.10                0.00        0.02
 Gross farm income                                                  6.20                6.69        6.69
 VARIABLE COSTS
 Herd costs                                                        0.40                 0.46        0.30
 Shed costs                                                        0.15                 0.10        0.18
          Homegrown feed costs                                     0.94                 0.62        0.86
          Purchased feed costs                                     1.39                 1.41        1.60
          Feed & water inventory change                            -0.02                0.12        -0.01
 Total feed costs                                                  2.31                 2.16        2.46
 Total variable costs                                              2.87                 2.73        2.94
 GROSS MARGIN                                                      3.33                 3.96        3.74
 OVERHEAD COSTS
 Employed labour cost                                               0.94                0.82        0.72
 Farm insurance                                                     0.05                0.02        0.06
 Repairs and maintenance                                            0.32                0.29        0.37
 Other overhead costs                                               0.14                0.10        0.19
 Imputed labour cost                                                0.00                0.03        0.43
 Depreciation                                                       0.06                0.20        0.28
 Total overhead costs                                               1.54                1.47        2.08
 TOTAL OPERATING COSTS                                              4.41                4.21        5.03
 EARNINGS BEFORE INTEREST & TAX                                     1.79                2.48        1.66
 COST OF PRODUCTION (excl inventory change)                         4.43                4.08        5.03

                                                                                                   8|Page
Judges’ Comments – 2019 ANZ Dairy
            Business of the Year Award
               Michael and Rhys Palmer, dairy farmers and 2018 DBOY winners
               Lesley Irvine, TIA Dairy Development & Extension Team Leader

Three finalists were selected from the
participants     in     the     Tasmanian
benchmarking program based on their
Return on Total Assets (RoTA) and Earnings
Before Interest and Tax per hectare
(EBIT/ha) during the 2017/18 financial year.
This year the judges of the Dairy Business of
the Year Award were Michael Palmer and
Rhys Palmer, dairy farmers from Sisters
Creek and winners of the 2018 Dairy
Business of the Year Award, and Lesley
Irvine from TIA.
The judges would like to congratulate the
three finalists in the 2019 ANZ Dairy
Business of the Year Award on their
                                                 However, it was also really encouraging to
achievements this year:
                                                 see a smaller, family farm performing just as
x   Waterhouse Dairies ‘Oxberry Dairy’,          well as the two conversion properties.
    managed by David Risbey-Pearn,
                                                 The diversity seen in top Tasmanian dairy
x   ‘Clear Springs Dairy’ managed by Tim
                                                 farm businesses shows there is not a single
    and Fiona Salter, and
                                                 pathway to business profitability.
x   Gary and Helen Strickland
                                                 The Return on Total Assets of the finalists
The judges visited each of these businesses
                                                 was very close – ranging from 8.8% to 9.2%.
in February - March and had discussions
about the financial performance of each farm     Pasture management skills were of a high
based on the data collected through the          standard on all the farms. Gary and Helen
benchmarking process. The judges also            Strickland also incorporated an extensive
conducted a farm tour observing and              cropping rotation within their business.
discussing the pasture management, cow           Staged planting of crops was used to manage
health and nutrition, breeding program,          the pasture surplus and deficit in place of
young stock, work place health and safety,       using silage or hay.
and environmental management. The judges
also considered the overall business strategy.   Irrigation was used on each of the farms
                                                 although the judges noted there wasn’t much
It was great to see two recent dairy             soil moisture monitoring taking place which
conversions performing so well. The two          is an opportunity to improve water use
farms are excellent examples of how large        efficiency and pasture growth.
herds can be managed profitably and still
look after their people, cows and the
environment.

                                                                                   9|Page
Nutrient management was conducted to a undertaken on dairy farms, so it was really
high standard with all farms using soil pleasing to see the many years of work that
testing to develop their fertiliser plans. had been undertaken on Strickland’s farm to
protect and encourage native habitat and
Each of the farms employed staff and
improve salt affected land. Clear Springs
acknowledged the importance of their farm
Dairy had also been very proactive
team in helping each business achieve its
improving the banks of the river flowing
goals. It was encouraging to see all farms had
through the farm by stabilising the banks
people policies in place on their farm to
and planting trees.
assist with training and keep people safe.
Both of the large dairies also had very high This is just a snapshot of some of the
labour use efficiency at 190 and 233 practices examined as part of the judging
cows/FTE. In particular, Oxberry Dairy had process. The judges would like to thank each
developed and implemented streamlined of the participants for their openness in
processes to ensure jobs were undertaken sharing about their farm management and
efficiently. again congratulate each business on their
performance. They should each be very
Cow nutrition, health and welfare was a
proud of their achievement.
priority for each business. Pasture was the
main source of energy with a range of 3.4 to Based on the analysis of financial data and
5 t DM/cow of homegrown fodder fed. The the visits to each of the finalist properties,
amount of concentrates fed ranged from 0.7 the judges declare Clear Springs Dairy to be
to 1.3 t DM/cow. the winner of the 2019 ANZ Dairy Business
of the Year Award.
Often there isn’t a lot of non-production
related environmental improvements
10 | P a g eFinalist Profiles
Gary and Helen Strickland
Gary and Helen Strickland purchased their
King Island dairy farm from Gary’s parents,
Dick and Jan Strickland, in 1985. Since then,
they have expanded the business through
purchasing neighbouring land. They split
calve their herd of 500 cows due to the
factory requirement for milk supply.
Gary and Helen love to learn and this has
been a driving factor in their business
success. They participate in all the dairy
discussion groups, workshops and field days
conducted on King Island as well as source
expert advice from researchers and finding it a useful tool for comparison and
consultants. The Strickland’s have motivation. They have been finalists
participated in the Tasmanian dairy multiple times in the Dairy Business of the
benchmarking program for many years
Year Award and have won the Award twice.
11 | P a g eWaterhouse Dairies ‘Oxberry Dairy’ – managed by David Risbey-
Pearn
Located 25 minutes northeast of Scottsdale, farms participating in the benchmarking
Oxberry Dairy was converted to a dairy farm milking 233 cows/FTE. While the dairy is
five seasons ago and is managed by David set-up to allow one-person milking, the
Risbey-Pearn. This is the third consecutive efficiency of this farm is much more than just
year the farm has been a finalist in the Award. technology and tools. It is more about the
people and their attitude towards making an
effective and efficient workplace. Led by
David, the team have developed a consistent
work routine for milking and other tasks that
focuses on maximising the efficiency of the
team as a whole rather making individual
task faster. David is very supportive of his
team and proud of what they have achieved
on the farm.
Pasture management is a big focus at
Oxberry Dairy with David undertaking
regular farm walks to determine the pasture
cover of each paddock and develop the
weekly grazing plan. He has also worked as a
nutritionist so uses this knowledge to make
Over 1000 cows are milked on the 245 ha sure the nutritional needs of the cows are
fully irrigated milking platform. Oxberry being met. The cows produce 95% of their
Dairy is one of the most labour efficient liveweight in milk solids.
12 | P a g e2019 Fonterra Share Dairy Farmer of the
Year Winners – Damien & Brooke Cocker
Damien and Brooke Cocker share farming for Rushy Lagoon.
Damien and Brooke Cocker share farm in the This is a production increase of 245,206 kg
far north east on Rushy Lagoon, one of MS or 40%.
Tasmania’s largest dairy farms. They operate
This increase has been a result of:
two of the four dairy farms on a cents per
kilogram of milk solids payment x increased cow numbers
arrangement. x increased per cow production
They have three daughters under the age of x improved herd, feed, irrigation and
8 years and juggle the demands of their general farm management.
family commitments with running their
large share farming business. Key to Success
Rushy Lagoon spans almost 21,000 ha Damien and Brooke believe the important
comprising 14,000 ha of grazing country and factors in their business success is having:
milks 2500 dairy cows alongside all dairy x A strong work ethic
young stock and 7000 beef cattle. The area x Excellent communication
receives an average rainfall of 750 mm per
x Good guidelines and work procedures
year and therefore has developed 1000 ha of
x Attention to detail
irrigated area.
x Careful planning
Damien and Brooke are very hands on and
do a large amount of work themselves. Not
only does this help reduce costs but helps
them observe, understand and react to the
changes in the farm system.
Damien and Brooke share farm the spring
calving farm Cinderella Dairy and the
autumn calving farm Cygnus Dairy for a
combined effective area of 640 hectares and
approximately 1,650 cows to calve.
The Cinderella Dairy is 320 effective
hectares and almost fully irrigated, milking
850 spring calved cows and the Cygnus Dairy
has 320 effective ha with 280 hectares
irrigated milking 550 autumn calved cows
and 200 spring cows.
Damien and Brooke have been share farming
on Rushy Lagoon for five years and in that
time have increased milk production on both
farms from 381,180 kg MS to 626,386 kg MS.
13 | P a g eDamien and Brooke both share the milking The staff rosters are drawn up well in
responsibilities and calf rearing. Damien advance so that all staff can plan ahead.
manages pastures, cropping, repairs and
Daily communication and staff contact is
maintenance and fits in some local
supported using farm maps and a large
contracting while Brooke manages and rears
white board in the dairy providing day to day
around 500 heifer calves, updates the staff
instructions. A diary recording grazing
roster and keeps the accounts in order. In
rotations informs staff of herd and paddock
addition, the couple have recently realised
movements.
their goal of farm ownership by purchasing a
small dairy farm at Sheffield. A team meeting is held when important
issues need to be raised such as dealing with
Career path high cell counts or identifying cycling cows.
Damien began his dairy career as an While Damien and Brooke are responsible
apprentice with Charleston Bros at Wilmot for the day to day management of the farms
in 1998. regular contact is maintained with the
general farm manager Rodney Moore to
After his apprenticeship, Damien worked at
discuss farm performance, the farm budget,
Rushy Lagoon, then with John Wilson at
update cow numbers, additional feed
Milabena and with Grant Archer at Mella.
requirements, young stock support, dry cow
Damien’s career took a turn when became a support and capital expenditure
cropping farmer with Premium Fresh in requirements.
2009. He returned to the dairy industry in
2013 where he took up his position with Pasture management
Rushy Lagoon. Brooke began her farming
Managing pastures for a large herd of 1600
career alongside Damien helping out at
cows requires continuous observation.
Charleston Bros but credits most of her
knowledge and experience to their time at Damien closely monitors feed availability,
Rushy Lagoon. pasture cover and seasonal growth rates,
adjusting the grazing rotation accordingly.
Staff
His decision-making ability is supported by
Damien and Brooke recognise the valuable his innate sense of observation, allocation
contribution their employees make within and delegation skills.
the business and believe in the “leading by
example” philosophy. They would not ask 9.6 t DM/ha of pasture was consumed in
anyone to do something they wouldn’t do 2017-18 which formed 79% of the diet.
themselves. Table 2 Annual amount of feed per cow
They employ 5 full time labour units and Feed t DM/cow
have a staff- cow ratio of 228 cows/FTE (full Pasture consumed 3.3
time equivalent). Everyone is given the Homegrown fodder 0.4
opportunity to take on additional training Purchased concentrate 0.8
and as a result one employee has progressed Total Feed Fed 4.5
through a farm apprenticeship to becoming
a share farmer for the Rushy Lagoon
operation. Animal Health & Nutrition
Quad bike training is compulsory with The spring calving dairy herd is made up of
additional training and discussion groups 850 medium sized Friesian-cross cows.
optional.
14 | P a g eThe ‘autumn’ herd is increasing and consists them into a share farming position that
of 550 autumn calving cows and 200 spring provides return for effort.
cows (spring calvers and spring carry-over
Their aim over time has been to continually
cows).
build their business to reach a position of
Prior to mating, the dairy herd is metri- farm ownership. Damien and Brooke
checked to ensure the best submission and recognise that the size and scale of the Rushy
conception rates are achieved. Lagoon dairy business has been critical in
developing their own successful business
The spring herd is mated for ten weeks.
but it has required a large personal
There is four weeks of artificial insemination
commitment.
commencing October 23rd and paddock
mated using dairy bulls for the remainder. While they have reached a milestone of farm
The bulls are removed on January 1st. ownership, purchasing a dairy farm in
Sheffield in 2018 they know there is still a
The autumn herd are paddock mated using
long way to go to ensure this next move is
dairy bulls for six weeks only.
just as successful.
Wealth creation They are proof that a strong work ethic,
commitment and personal sacrifice can lead
Damien and Brooke have built up a wealth of
to success.
experience and knowledge which has led
Table 3 Key performance indicators for Damien and Brooke compared to the other share farmer participants (2017-18)
Key performance indicators D&B Cocker Average for
sharefarmers 17/18
Milking area, ha 640 276
No. cows milked 1600 739
Stocking rate, cows/ha 3.0 3.0
Milk production, kg MS/cow 396 382
Milk production, kg MS/kg lwt 0.8 0.80
Milk production, kg MS/Mha 977 1047
Labour efficiency, cows/FTE 148 148
Pasture consumption, t DM/Mha 9.4 10.0
Percentage of milking area irrigated 94% 66%
Nitrogen, kg N/Mha 216 165
Concentrate fed, t DM/cow 1.0 1.0
Proportion of homegrown feed in the diet 77% 72%
15 | P a g eJudges’ Comments – 2019 Fonterra Share
Dairy Farmer of the Year
Judges
Troy Franks, Fonterra Milk Supply Officer
Wayne & Caroline Saward, 2018 Share Dairy Farmer of the Year Winner
Symon Jones, TIA Dairy Development & Extension Officer
This year there were four entrants in the The judges were impressed with the
Fonterra Share Dairy Farmer of the Year dedication and commitment shown by all the
Award: entrants towards the management of their
individual businesses. All participants are
x Andrew and Jenny Aldridge extremely capable dairy farm managers with
x Damien and Brooke Cocker a very good understanding of their business,
x John and Emma Innes-Smith their progression and aspirations in the
x Jeffrey Gijsbers and Monique Mulder industry and a willingness to engage in staff
The judges would like to congratulate each training and self-improvement.
entrant not only on their business In terms of management skill and capability
performance but their willingness to across all areas of the business very little
participate and share their information to separated the participants. They understand
benefit other share farmers and the dairy the fundamentals of what is required to
industry as a whole. manage a successful dairy business. They
In choosing a winner for the share dairy focus on doing the basic things well, such as
farmer of the year award, the judges visit maximising homegrown pasture production,
each of the entrants and assess their setting grazing rotation length to leaf stage,
management across all areas of the business. best management of irrigation and the
strategic use of nitrogen. They all have
The strong field of entrants were judged on a excellent herd management skills and meet
range of criteria covering both the target liveweights for all young stock.
operational and financial management
within the business. In general, they have:
These areas included: x Excellent observation skills
x Excellent attention to detail
x Farm management x The ability to react to changes within
x Pasture management the farm business.
x Herd management
x Animal health and welfare The judges were impressed with the
excellent drive, work ethic and the focus on
x Record keeping
their future and particularly with the
x Young stock management
business growth achieved by all participants.
x People management
The winners, Damien and Brooke Cocker,
x Induction and training
who performed particularly well in the areas
x Working conditions and safety
of pasture, herd management and people
x Motivating & supporting staff management had impressive business
x Relationship with the farm owner profitability and Return on Assets.
16 | P a g eShare Farmer Profiles
Damien and Brooke Cocker John and Emma Innes-Smith
Damien and Brooke have been share farming for John and Emma are 50/50 share farmers for
five years and operate two of the four Rushy Silverdale in Togari.
Lagoon dairy farms milking a total of 1600 cows. They have three young children and are in their
The judges were impressed with the couple’s third season on the farm following a previous share
ability to manage a large-scale operation. They farming position and large herd management
were able to achieve relatively high per cow experience.
production on a largely pasture based system John and Emma employ 1.5 FTE and share the
with minimal grain and additional supplements. workload on all day to day tasks.
With employed labour playing a key role in the They are excellent pasture and herd managers with
business the Cockers have managed to provide a a focus on setting the grazing rotation length to leaf
workplace which offers a pathway for their stage and meeting target weights on all youngstock.
employees to progress further in the industry.
One apprentice has progressed to a share farmer Pasture management is always spot on with
position. minimal wastage.
The judges highly commended the couple on John and Emma encourage all employees to
their business performance with their Return on develop within the business by encouraging them
Assets a stand-out at 34% on assets owned. to attend workshops and various courses.
In addition, Damien and Brooke have been able John and Emma have grown their business to a
to grow their asset base in a relatively short point where they now have surplus stock and are
period of time to purchase a dairy farm at moving to an equity partnership on a new family
Sheffield. development farm.
FARM DETAILS FARM DETAILS
• 490 spring calving cows
x 1600 split calving cows
• 142 dry land hectares
x 640 hectares
• Stocking rate 3.45 cows/ha
x 94% irrigated • 1362 kg MS/ha
x Stocking rate 2.5 cows/ha • 395 kg MS/cow
x 979 kg MS/ha • 1.6 t concentrates/cow
x 391kg MS/cow • 9.5 t DM/ha pasture consumed
x Labour 246 cows/FTE • Homegrown feed as a % of diet 74%
x 0.8 t concentrates/cow fed
x 8.1 t DM/ha pasture consumed
x Homegrown feed as a % of diet 77%
Jeffery Gijsbers and Monique Mulder
Jeffrey and Monique are 50/50 share farmers
for Ashgrove Farms at Elizabeth Town.
17 | P a g eAndrew & Jenny Aldridge Jeffrey Gijsbers & Monique Mulder
Andrew and Jenny 50/50 share farm with Jeffrey and Monique have a great eye for detail.
Andrew’s parents, Peter and Felicia Aldridge at They are completely focused on the day to day
Branxholm. running of their business and employ one labour
The judges were impressed by Andrew’s unit.
understanding of the production system and his The judges were impressed with the
absolute attention to detail on his irrigated presentation of the farm, the overall pasture
pasture management. management and particularly the young stock.
Andrew and Jenny have recently steered away The young stock were described as exceptional
from convention to a once-a-day milking system with weaning weights of 200 kg liveweight being
as a way of maintaining an extremely low cost of achieved.
production. Jeffrey and Monique have also grown their
Andrew and Jenny are working towards business to a point where they can now look at
purchasing the family farm. farm purchase options or take on a second farm.
FARM DETAILS FARM DETAILS
• 430 spring calving cows • 435 spring calving cows
• 144 ha • 147 hectares
• 70% irrigated • 52% irrigated
• Stocking rate 2.98 cows/ha • Stocking rate 3.0 cows/ha
• 857 kg MS/ha • 458 kg MS/cow
• 287 kg MS/cow • 150 cows per FTE
• 287 cows per labour unit • 1.6 t concentrates/cow
• 10.4 t DM/ha pasture consumed
• Homegrown feed as % of diet 80%
• 10.9 t DM/ha pasture consumed
18 | P a g e19 | P a g e
Tasmanian Snapshot
Benchmarking in Tasmania
The Tasmanian dairy industry has a long           was on average $358,205 per farm
history of benchmarking, with dairy farmers       compared to $153,967 per farm in the
having the opportunity to submit their            previous year, a 133% increase from last
figures and benchmark their business              year.
performance on an annual basis for over 30
                                                  Three out of the 32 farms recorded a
years. Since 2011, the Tasmanian Institute of
                                                  negative return on equity (RoE). The
Agriculture (TIA) has been funded by Dairy
                                                  average RoE was 6.7% and 13.1% for the top
Australia to manage the Tasmanian Dairy
                                                  25%. After a relatively large decline in
Farm Monitor Project. This involves
                                                  average equity percentage from 70% in
collecting benchmarking data from 30
                                                  2015-16 to 61% in 2016-17, there was a
Tasmanian dairy businesses each year. The
                                                  slight increase this year to 62%. There was a
data from these businesses is used to
                                                  decline in debt service ratio from 11% to 9%.
compile an annual report that monitors
trends in the Tasmanian dairy industry. The       There was an increase in cost of production
data is also used in DairyBase (the national      without inventory change from $4.87/kg MS
online benchmarking program) as a                 to $5.04/kg MS, an increase of 3.5%.
validated dataset that can be used by anyone
for comparative analysis. This year, 32           The top 25% received a slightly higher than
Tasmanian dairy businesses participated in        average milk price at $6.02/kg MS and
the Dairy Farm Monitor Project. A summary         posted 3% more gross income of $6.90/kg
of the data from the 2017-18 Dairy Farm           MS than the average of all participant farms
Monitor Project annual report is provided         of $6.70/kg MS. Their variable costs were
below. A copy of the full report is available     13% lower at $2.59/kg MS compared to the
on the TIA and Dairy Australia websites. A        average ($2.95/kg MS). The top 25%
printed version of the report is available        performers also spent less on overhead costs
from DairyTas.                                    at $1.66/kg MS than the average ($2.09/kg
                                                  MS). They generated much higher EBIT
Dairy Farm Monitor Project                        ($2.65/kg MS) than the average of all
                                                  participants ($1.66/kg MS).
Summary
                                                  Milk sold increased on both a per cow basis
In 2017-18 Earnings before interest and tax       and per hectare basis. Milk sold per hectare
(EBIT) was on average $493,729 per farm, a        increased from 976 kg MS/ha to 1031 kg
75% increase on the previous year (adjusted       MS/ha with milk sold per cow increasing
for inflation). Return on total assets            from 433 kg MS/cow to 445 kg MS/cow. The
managed (RoTA) has increased for the first        top performers sold more milk per cow and
time in three years to an average of 6.3% this    per hectare, 2% and 16% higher,
year from 3.7% in the previous year. The top      respectively.
25% of farms (as measured by RoTA) had
RoTA of 11.5%.                                    Stocking rate, measured as cows per usable
                                                  hectare remained the same compared to
Of the 32 participants, all recorded a positive   2016-17 at 2.3 cows per hectare.
return on assets with a range (for all farms)
from 1.6% to 15.2%.                               Farms in the top 25% had a higher stocking
                                                  rate with 2.8 cows/ha. This was an increase
Net farm income, calculated after interest        from 2.5 cows/ha the season before.
and lease charges were deducted from EBIT,

                                                                                   20 | P a g e
Average milk fat was 4.6%, 0.1% higher than 1 below shows pasture consumption
the previous season and milk protein was trending upwards overtime with a similar
3.6%, the same as the previous season. trend occurring for % of milking area
irrigated on farms involved in benchmarking.
Pasture consumption was 10.6 t DM/ha,
forming an estimated 66% of the diet. Figure
Table 4 Farm physical data – Tasmania overview (from the 2017-18 Tasmanian Dairy Farm Monitor Report)
Farm physical parameters Tasmania Top 25%
Q1 to Q3 range
average average
Herd size 607 - 738
Annual Rainfall 901 806-1,060 897
Total water use efficiency (tDM/100mm/ha) 0.9 0.7-0.9 1.0
Total usable area (hectares) 289 174-437 278
Milking cows per usable hectare 2.3 1.7 - 2.8 2.8
Milk sold (kg MS/cow) 445 400-483 480
Milk sold (kg MS/ha) 1,031 652-1,289 1,368
Home grown feed as % of ME consumed 66% 64%-76% 72%
Labour efficiency (milking cows/FTE) 154 119-185 158
Labour efficiency (kg MS/FTE) 67,059 51,293-78,913 75,044
11.0 55.0
Pasture consumption (t DM/ha)
Irrigation (% of milking area)
10.5 50.0
45.0
10.0
40.0
9.5
35.0
9.0
30.0
8.5 25.0
8.0 20.0
Pasture consumption (tDM/ha) Irrigation (% of milking area)
Figure 1 Pasture consumption vs irrigation (% of milking ha)
National Dairy Farm Monitor Project Results
Being part of a national project means direct comparative analysis. Some of the key
comparisons can be made with other states. performance indicators for Tasmania,
Western Australia, South Australia, Victoria, Victoria, South Australia and New South
New South Wales and Queensland all Wales are shown in the table below. The data
participate in the Dairy Farm Monitor shows that despite having one of the lowest
Project. Reports for each of these states is milk prices, Tasmanian dairy businesses
available on the Dairy Australia website. achieved the highest return on assets
Data from these states is also included in through good cost management. This was
DairyBase which expands the pool validated assisted by a high proportion of home-grown
farm data sets that can be used for feed in the diet and high labour efficiency.
Table 5 Comparison of Tasmanian Dairy Farm Monitor Project data with previous years and other states
21 | P a g eTAS TAS TAS VIC SA NSW
Average Average Average Average Average Average
2015-16 2016-17 2017-18 2017-18 2017-18 2017-18
Herd size 580 542 607 352 399 337
Annual rainfall (mm) 1044 1288 901 668 686 718
Total water use
efficiency - - 0.9 0.7 0.6 0.6
(tDM/100mm/ha)
Total usable area
302 268 289 246 527 251
(ha)
Milking area (ha) 198 190 208 166 205 142
Stocking rate
2.9 2.9 2.9 2.1 1.9 2.8
(cows/Mha)
Milk sold (kg
444 432 445 503 569 488
MS/cow)
Pasture consumed (t
10.7 10.4 10.6 6.1 4.4 6.4
DM/Mha)
Home grown feed
69% 74% 66% 62% 54% 55%
as % of ME consumed
Labour efficiency
141 143 154 106 94 77
(milking cows/FTE)
Labour efficiency (kg
62,053 61,111 67,059 52,988 52,742 37,536
MS/FTE)
Milk income (net)
$5.55 $5.03 $5.95 $5.81 $6.24 $7.25
($/kg MS)
Total variable costs
$3.27 $2.87 $2.95 $3.46 $3.40 $4.53
($/kg MS)
Total overhead costs
$1.91 $1.98 $2.09 $2.29 $2.50 $3.13
($/kg MS)
Earnings before
interest and tax ($/kg $0.92 $0.99 $1.66 $0.66 $1.18 $0.33
MS)
Return on Assets 3.9% 3.7% 6.3% 2.5% 4.3% -0.3%
22 | P a g eTen Year Tasmanian Trends
Table 6 Key performance indicators from benchmarking in Tasmania for the past ten years
07-08 08-09 09-10 10-11 11-12 12-13 13-14 14-15 15-16 16-17 17-18
Return on Assets, % 7.9% 6.1% 3.4% 7.2% 8.4% 4.6% 9.9% 7.9% 3.7% 3.9% 6.3%
EBIT $385,024 $271,890 $172,525 $340,747 $462,923 $296,170 $565,784 $492,084 $269,598 $298,398 $493,729
Production, kg MS 171,995 187,360 157,637 173,714 218,651 232,381 220,157 247,283 267,906 252,467 272,726
Cows Milked, nos 466 484 404 415 514 548 508 552 552 566 607
Milking area, ha 239 236 204 206 233 186 183 194 201 195 208
Labour used, FTE 4.5 4.8 4.2 3.3 3.6 3.7 3.8 4.0 4.3 4.0 4.1
useable area irrigated, % 32% 34% 38% 43% 38% 43% 43% 49% 48% 45% 53%
Milksolids kg MS/Mha 739 835 772 878 971 1,032 1,206 1,312 1,333 1,295 1,327
Milksolids kg MS/cow 373 400 374 407 422 420 422 445 485 437 445
Stocking Rate, cows/Mha 2.0 2.1 2.0 2.1 2.3 3.0 2.8 2.8 2.9 2.9 2.9
Pasture, t DM/Mha 8.3 9.6 9.3 9.8 9.3 10.1 9.2 10.1 10.8 10.6 10.6
Grain intake, tonne/cow 0.92 0.94 0.89 1.04 1.17 1.33 1.30 1.33 1.64 1.23 1.25
Nitrogen, kg N/ha 212 201 173 157 140 142 158 173 236 199 219
Cows per FTE 105 105 94 120 137 126 137 141 141 146 154
Dairy assets owned, $’000 $4,811 $5,040 $4,512 $4,658 $5,200 $5,345 $5,090 $5,516 $6,405 $6,152 $7,003
Assets per eff ha, $/ha $20,442 $22,094 $22,514 $22,661 $23,818 $23,166 $19,834 $19,852 $21,590 $21,814 $26,396
Assets per cow, $/cow $10,641 $10,949 $11,737 $11,220 $10,619 $9,750 $10,020 $10,124 $11,596 $10,068 $11,448
Liabilities, $’000 $1,602 $1,560 $1,176 $1,351 $1,607 $1,602 $1,317 $1,335 $1,413 $2,299 $2,767
Liabilities per cow, $ $3,346 $3,167 $3,306 $3,254 $3,370 $3,171 $2,628 $2,491 $2,558 $4,062 $4,559
Equity, % 69% 70% 72% 70% 68% 70% 71% 70% 76% 61% 62%
Milk Income, $/ha $4,732 $4,502 $3,561 $4,854 $5,257 $5,215 $6,200 $5,771 $7,436 $4,923 $5,657
Total Income, $/ha $4,938 $4,746 $3,861 $5,469 $5,985 $5,670 $6,733 $6,405 $8,196 $5,732 $6,362
Animal Costs, $/ha $299 $341 $311 $363 $417 $452 $435 $447 $708 $479 $326
Feed Costs, $/ha $1,878 $1,940 $1,441 $1,770 $1,940 $2,433 $2,361 $2,450 $3,796 $2,383 $2,565
Labour, $/ha $735 $824 $866 $948 $985 $1,047 $650 $732 $1,182 $1,143 $1,139
Other Overheads, $/ha $543 $597 $546 $652 $638 $554 $1,154 $1,032 $1,309 $661 $890
Operating Costs, $/ha $3,455 $3,701 $3,164 $3,734 $3,979 $4,541 $4,600 $4,661 $6,995 $4,666 $5,103
EBIT, $/ha $1,483 $1,046 $697 $1,735 $2,006 $1,129 $2,133 $1,744 $1,201 $1,030 $1,836
Milk Income, $/kg MS $6.33 $5.50 $4.66 $5.51 $5.40 $5.01 $6.88 $6.19 $5.58 $5.03 $5.95
Total Income, $/kg MS $6.87 $6.01 $5.17 $6.24 $6.17 $5.50 $7.52 $6.91 $6.25 $5.92 $6.70
Operating Costs, $/kg MS $4.76 $4.53 $4.27 $4.26 $4.07 $4.48 $5.09 $5.04 $5.28 $4.87 $5.04
EBIT, $/kg MS $2.10 $1.48 $0.92 $1.98 $2.09 $1.02 $2.43 $1.88 $0.97 $1.01 $1.66
Finance costs, $/kg MS $0.63 $0.63 $0.75 $0.81 $0.66 $0.54 $0.52 $0.41 $0.46 $0.65 $0.58
Net Farm Income, $/kgM8S $1.47 $0.85 $0.16 $1.17 $1.43 $0.49 $1.91 $1.47 $0.51 $0.36 $1.07
Participants 46 40 33 40 27 34 52 31 34 40 33
As % of dairy farmers 10% 9% 8% 9% 6% 8% 13% 7% 7% 9% 8%
Please note: Data in this table is from all Tasmanian benchmarking participants which may include additional data sets
to the Dairy Farm Monitor Project. Therefore, the data in this table may not exactly match the data from the Dairy Farm
Monitor Project. Data is not directly comparable from year to year as the farm businesses participating are not necessarily
the same each year and data analysis methods change from time-to-time. Rather the data in the above table indicates
trends.
23 | P a g eWFI Farm Safety Encouragement Award
The 2019 WFI Farm Safety Encouragement x Altering of non-compliant steps to be
Award winner is Wayne and Joanne Bowen the correct width, number of steps and
owners of Pineview Dairies in Springfield. installation of handrails.
Milking 900 to 950 cows at peak Wayne and x Having a clean dairy (one of the cleanest
Joanne are new to the safety journey. With dairies that judges have seen).
the assistance of Deb Morice from Fonterra’s x Keeping records of machinery servicing.
Farm Source Team they have started to put x Painting of yellow lines on clearly
in place a safety system that will suit them. indicate different levels (steps)
After a few safety incidences on the farm throughout the dairy.
Wayne and Joanne knew they needed to x Installing an automatic chemical wash.
change their practices to ensure that their Safety systems previously in place at
staff remained safe at work. Pineview relied heavily on all incidents and
hazards being reported to Wayne directly.
The change to reporting forms will ensure
that hazards are not missed.
While they are still in the early stages of
implementing their safety changes, Wayne
and Joanne are to be applauded for
recognising an issue, taking control of the
situation and making changes within their
business. The judges wish Wayne and
Joanne all the best in their safety journey
into the future.
Recognising some of their biggest dangers
being quad bikes, they have gone about
ensuring that the bikes are safe as possible.
This includes having bikes regularly serviced
by the dealer, maintaining a fleet of newer
bikes, substituting in side by side vehicles,
speed limiting the bikes and having all staff
wear helmets when on bikes. All users of
bikes are also required to attend ATV driver
training.
Seeking outside help has helped them to
recognise where they need to improve their
systems. Putting in place Employment
Policies and Procedures Manuals, Individual
Employee Agreements, Incident forms and
Hazard Reporting forms.
Other simple safety systems in place include:
x Use of a contractor for many tasks,
particularly chemical spraying.
25 | P a g e26 | P a g e
Veolia Environment Award
Gary Watson operates a Dairy Farm in Lileah,
located in Circular Head. Milking 360 cows,
Gary has incorporated several strategies on
farm to maximise efficiency of water usage,
power creation and effluent distribution.
Sustainability is important to Gary and some
of activities he has undertaken in the area of
environmental sustainability have included:

x   Installation of soil moisture probes to
    provide accurate details for effective
    irrigation usage
x   Installation of solar panels, creating over
    35 kilowatts of power
x   Built an effluent pond and weeping wall
    for effective effluent management
    allowing 100% of effluent being retained
    on farm
x   Installation of a solid set irrigation
    system which distributes this effluent
                                                  x   Future aspirations include travel to
    across 100 out of 120 hectares of the
                                                      Europe to further expand knowledge in
    farm
                                                      biodigesters
x   Regular soil and hair sample testing
                                                  Congratulations to Gary Watson for the
x   Fencing of natural bushland                   positive environmental projects he has
x   Undertaken travel to the US to build          undertaken on his property and for winning
    knowledge in areas of environmental           the 2019 Veolia Environment Award.
    sustainability

                                                                                27 | P a g e
Cadbury Young Dairy Farmer
Encouragement Award
DairyTas and the Young Dairy Network
Tasmania wish to recognise and encourage a
young dairy farmer in the Tasmanian Dairy
Awards through the presentation of the
Tasmanian Young Dairy Farmer
Encouragement Award. The Award is open
to people working on dairy farms aged
between 18-35 and recognises the
importance of young people to the
sustainable future of the dairy industry. We
were seeking someone who not only enjoys
working within the dairy industry but is
achieving their goals, progressing in and is
passionate about the industry.
DairyTas received a number of nominations,
for this Award. Nominees were interviewed
over the phone by Richard Duniam and Jacki
Hine who were impressed by the high
standard of responses to the questions.
Congratulations to all the nominees who are others to participate in Young Dairy
great ambassadors and share a genuine Network events and other dairy events.
passion for the dairy industry. Jeremy started out his agricultural career
The winner of the 2019 Cadbury Young within the beef industry before moving to
Dairy Farmer Encouragement Award is Oxberry Dairy at Waterhouse in the last
Jeremy Page who works at Waterhouse couple of years.
Dairies ‘Oxberry Dairy’. Jeremy was encouraged to attend a Young
Outlined in the interview, this nominee Dairy Network event in Scottsdale by his
demonstrated participation in training manager David Risbey-Pearn). From there
he participated in the Dairy Sage mentoring
opportunities, both formal and informal and
program which proved to be a real turning
shared with us the ways they encouraged
point for Jeremy helping him set career goals,
28 | P a g ebuild confidence and skills and stay Jeremy is grateful for all the support
motivated to progress. This enabled him to available in the dairy industry and actively
take up further opportunities for growth at encourages others to take advantage of the
both a personal and professional level. plethora of learning opportunities
Jeremy is now a regular attendee at supported by the levy and federal
workshops and courses and has undertaken government funding.
formal training at TasTAFE attaining his Cert
IV. Jeremy aspires to continue to increase his
skills and one day become a manager at
Waterhouse Dairies.
Van Dairy Group
Employee of the Year Award
The inaugural winner of the Dairy Employee
of the Year award is Nigel Lee. Nigel is
employed by Ken and Jill Lawrence in
Osmaston. Nigel was nominated by his
employer and after interviewing by the
panel it was clear that Nigel has many
attributes that will continue to see him play
a valued role as an employee.
Some key points that stood out about Nigel:
x He takes time to educate others within
the team and learn with them new skills
x He demonstrates an effective way of
communicating and explaining during
training
x He readily shares his acquired
x He manages the run off block and 640
knowledge and skills effectively amongst
young stock since the land was
the team that includes two apprentices
purchased
x He shows great pride in milk quality,
x He managed the installation of irrigation
young stock and recently won the on-
on the run off block
farm challenge
x He went above and beyond his normal
role when the owner underwent hip
surgery to ensure the business
continued to operate smoothly
x He continues to expand knowledge and
skills through attendance at field days
and workshops
x He continues to show great pride in the
industry and harbours aspirations to
remain involved
Congratulations to Nigel for winning the
2019 Dairy Employee of the Year Award.
29 | P a g eAurora Energy
Dairy Employer of Choice Award
x The Manager is then encouraged to relay
these discussions through to team
members
x The Manager has input into the 5 years
plan of the business
x Regular tool box meetings where each
employee signs the minutes at the
conclusion
x Safety discussions form part of these tool
box meetings
x Clear and Updated Position descriptions
for all roles
x Use of support group to leverage skills
from outside the business
x Use of Board knowledge and Primary
Employers Tasmania to ensure all
employment agreements are aligned
The 2019 Employer of the Year Award is with award requirements
Dalmore Dairy. Dalmore Dairy have x Ongoing development discussions with
incorporated numerous first-class systems team members
and standards despite only operating for x Internal and external training
short period of time. Through the use of x Interaction between board members and
external support, internal resources, the farm team is encouraged
network support and board knowledge they Whilst the business is only in its early
ensure all staff members are well supported. foundation laid for its team lays a solid
foundation for sustained success through its
x Provides visibility to all staff of business
people.
goals by the Manager attending board
meetings
30 | P a g eElphinstone Stevens Pty Ltd
Dairy Services Award
The third Dairy Services Award is awarded Throughout his
to Peter Tyson. Peter has a long and time at the Dairy
distinguished career in the Tasmanian Dairy Branch and TIA, he
Industry. Some key qualifications and was instrumental
highlights include: in driving practices
that still remain
x 1966-1968 Trainee Livestock Officer key to the success
Webster and Woolgrowers of the Tasmanian
x 1968-1971 Technical Advisor North Dairy Industry. He
Western Dairy Co-operative (Deloraine drove the growth
and Devonport) of the Dairy
x 1970 - Hawkesbury Agricultural College, Business of the
Diploma Dairy Technology Year award to what it is today and took the
x 1978 - Roseworthy Agricultural College, focus away from production, to productivity
Graduate Diploma of Agriculture which in turn lead to greater
x 1972-1992 Varied responsibilities as profitability. This was mirrored by
extension officer and later deputy chief programs that focussed on measuring and
Dairy Branch recording growth rates / pasture cover and
x 1993-2007 Manager Dairy Branch the importance of the three-leaf phase.
Department Primary Industry Water and
Throughout Peter’s career he took great
Environment Tasmania
pride in supporting dairy farmers at an
x 2007-2010 Leader Dairy Industry
individual level. He was and continues to be
Development/ Senior Fellow -
a great source of information. Within the
Tasmanian Institute of Agricultural
industry took an active role in mentoring
Research, University of Tasmania
farmers during his career, many of whom
In addition to these roles, on his retirement remain involved in Tasmanian Dairy
from the Department he continued to be industry today.
involved with the dairy industry through the Peter now joins Rhys Palmer (2013) and Bob
TDIA Board and with Sydney University in Bush (2018) as recipients of this prestigious
the development of a robotic dairy. award.
31 | P a g eSummary of all participants
Table 7 Key performance indicators for individual participants in the 2017-18 Dairy Business of the Year Award
Home Proportion Milk Return
Milking Cows Stocking Milk Cost of
Grown of Home Income on Total
Area Milked Rate Production Production
Feed Grown Feed (net) Assets
Milking Total
ha No. t DM/ha % of Diet $/kg MS $/kg MS %
cows/ha Milksolids
230 780 3.4 473,284 17.4 66% 5.95 3.45 15.2%
155 570 3.7 255,260 14.3 60% 6.14 2.97 13.8%
265 810 3.1 368,022 13.1 63% 6.10 3.89 12.9%
260 1060 4.1 463,062 12.8 67% 6.02 3.77 10.9%
300 1050 3.5 537,258 12.6 75% 6.20 4.46 10.5%
80 280 3.6 132,236 10.2 54% 5.92 3.88 10.5%
90 280 3.2 136,359 12.8 60% 5.67 3.63 9.5%
370 1080 2.9 454,323 10.5 64% 6.12 4.16 9.2%
245 1040 4.3 502,207 14.5 52% 6.01 4.68 9.1%
255 490 1.9 221,181 9.5 86% 6.83 5.56 8.8%
440 1230 2.8 523,313 9.3 54% 6.08 4.71 8.6%
280 500 1.8 206,832 8.5 88% 5.91 3.75 7.6%
80 200 2.5 96,137 9.2 57% 5.73 4.68 6.4%
270 750 2.7 324,215 9.3 70% 5.89 4.70 6.0%
300 970 3.2 536,961 11.6 59% 6.19 5.03 5.8%
120 340 2.8 145,962 8.8 53% 6.03 5.32 5.3%
290 920 3.2 353,366 10.1 48% 5.97 5.03 4.8%
150 420 2.8 238,300 8.0 65% 5.87 5.05 4.7%
140 430 3.0 123,386 10.4 88% 5.94 4.35 4.6%
180 480 2.7 262,775 11.8 57% 5.97 4.95 4.2%
165 370 2.3 180,311 9.3 70% 5.54 4.85 4.2%
170 560 3.3 246,024 11.8 55% 5.90 5.27 3.9%
450 1300 2.9 467,395 9.1 77% 6.03 5.71 3.8%
60 200 3.5 73,819 14.2 66% 6.02 5.17 3.8%
110 230 2.1 110,312 8.0 72% 5.71 5.02 3.8%
120 465 3.8 267,872 11.3 68% 6.16 6.32 3.7%
185 465 2.5 186,053 8.8 75% 5.86 5.26 3.4%
210 420 2.0 131,944 8.1 82% 5.84 4.86 3.3%
250 720 2.9 289,954 8.7 51% 6.09 6.34 2.4%
240 890 3.8 427,144 13.5 77% 5.48 5.36 2.0%
160 400 2.5 146,170 7.6 67% 5.61 5.72 1.7%
70 220 3.1 81,310 7.4 67% 5.85 6.26 1.7%
230 420 1.8 117,848 7.4 90% 5.80 5.20 1.6%
214 637 3.0 287,113 10.6 0.65 5.99 4.79 6.5%
Note: The averages presented in this table are based on all participants entered in 2017-18 benchmarking program, even if
their data is not presented in the table. Per hectare refers to per milking hectare.
32 | P a g eNotes
33 | P a g eMeande
River
Lon
gR id g e
Rd
1b
r
2 3
4 5
6 7 8 3.4
18 17 9
1a 4.6
16 15 PIVOT 1
14 13
11
PIVOT 2 12 10
Transfer Pumps
HP2 BP4
CP 2&3
21 CP1 Pump Shed
22 BP1
19 23
24 C1 C2 C3C4 C5
25 C6
20 B
28
29
27
BP2
HP1
41 26 Dairy Water
42 40 39 38 BP3
37 36
35 34
33 32
31
30
d
rR
de
43
PIVOT 3
44 an
Me
45
46 47
48
49 50 Dixons R
51 d
Meande
River
r
BP1 Bore pump
Clear Springs FARM IRRIGATION Irrigation pump
Operations P/L Underground power
264 Meander Rd Irrigation pipe 12
Meander 7304 Irrigation pipe 8
Hydrants
Managers Tim & Fiona Salter Irrigation pipe 6
Tim's Mob 0419 341 424 Hard hose Irrigation 68 Ha Hard hose area
Fiona's Mob 0499 124 227 Pivot centre
manager@clearsprings.co Pivot wheel
Pivot overhang
Pivot spray
Clear Springs Pivot Irrigation 262 Ha Pivot area
Boundary 400 Ha
Ph. 0417 521 002
harry@farmmappingservices.com
www.farmmappingservices.com.au
59 Paddocks 366 Ha Gross
csmp0818.pdf Aug 2018 365 Ha Grass 0
100
1000 mYou can also read