Personalized genealogical history of UK individuals inferred from biobank-scale IBD segments
←
→
Page content transcription
If your browser does not render page correctly, please read the page content below
Naseri et al. BMC Biology     (2021) 19:32
https://doi.org/10.1186/s12915-021-00964-y

 RESEARCH ARTICLE                                                                                                                                   Open Access

Personalized genealogical history of UK
individuals inferred from biobank-scale IBD
segments
Ardalan Naseri1, Kecong Tang2, Xin Geng1, Junjie Shi1, Jing Zhang1, Pramesh Shakya2, Xiaoming Liu3,
Shaojie Zhang2* and Degui Zhi1,4*

  Abstract
  Background: The genealogical histories of individuals within populations are of interest to studies aiming both to
  uncover detailed pedigree information and overall quantitative population demographic histories. However, the
  analysis of quantitative details of individual genealogical histories has faced challenges from incomplete available
  pedigree records and an absence of objective and quantitative details in pedigree information. Although complete
  pedigree information for most individuals is difficult to track beyond a few generations, it is possible to describe a
  person’s genealogical history using their genetic relatives revealed by identity by descent (IBD) segments—long
  genomic segments shared by two individuals within a population, which are identical due to inheritance from
  common ancestors. When modern biobanks collect genotype information for a significant fraction of a population,
  dense genetic connections of a person can be traced using such IBD segments, offering opportunities to
  characterize individuals in the context of the underlying populations. Here, we conducted an individual-centric
  analysis of IBD segments among the UK Biobank participants that represent 0.7% of the UK population.
  Results: We made a high-quality call set of IBD segments over 5 cM among all 500,000 UK Biobank participants. On
  average, one UK individual shares IBD segments with 14,000 UK Biobank participants, which we refer to as
  “relatives.” Using these segments, approximately 80% of a person’s genome can be imputed. We subsequently
  propose genealogical descriptors based on the genetic connections of relative cohorts of individuals sharing at
  least one IBD segment and show that such descriptors offer important information about one’s genetic makeup,
  personal genealogical history, and social behavior. Through analysis of relative counts sharing segments at different
  lengths, we identified a group, potentially British Jews, who has a distinct pattern of familial expansion history.
  Finally, using the enrichment of relatives in one’s neighborhood, we identified regional variations of personal
  preference favoring living closer to one’s extended families.
  Conclusions: Our analysis revealed genetic makeup, personal genealogical history, and social behaviors at the
  population scale, opening possibilities for further studies of individual’s genetic connections in biobank data.
  Keywords: Identity by descent, RaPID, UK Biobank, Genealogical history

* Correspondence: shzhang@cs.ucf.edu; degui.zhi@uth.tmc.edu
2
 Department of Computer Science, University of Central Florida, Orlando, FL
32816, USA
1
 School of Biomedical Informatics, The University of Texas Health Science
Center at Houston, Houston, TX 77030, USA
Full list of author information is available at the end of the article

                                        © The Author(s). 2021 Open Access This article is licensed under a Creative Commons Attribution 4.0 International License,
                                        which permits use, sharing, adaptation, distribution and reproduction in any medium or format, as long as you give
                                        appropriate credit to the original author(s) and the source, provide a link to the Creative Commons licence, and indicate if
                                        changes were made. The images or other third party material in this article are included in the article's Creative Commons
                                        licence, unless indicated otherwise in a credit line to the material. If material is not included in the article's Creative Commons
                                        licence and your intended use is not permitted by statutory regulation or exceeds the permitted use, you will need to obtain
                                        permission directly from the copyright holder. To view a copy of this licence, visit http://creativecommons.org/licenses/by/4.0/.
                                        The Creative Commons Public Domain Dedication waiver (http://creativecommons.org/publicdomain/zero/1.0/) applies to the
                                        data made available in this article, unless otherwise stated in a credit line to the data.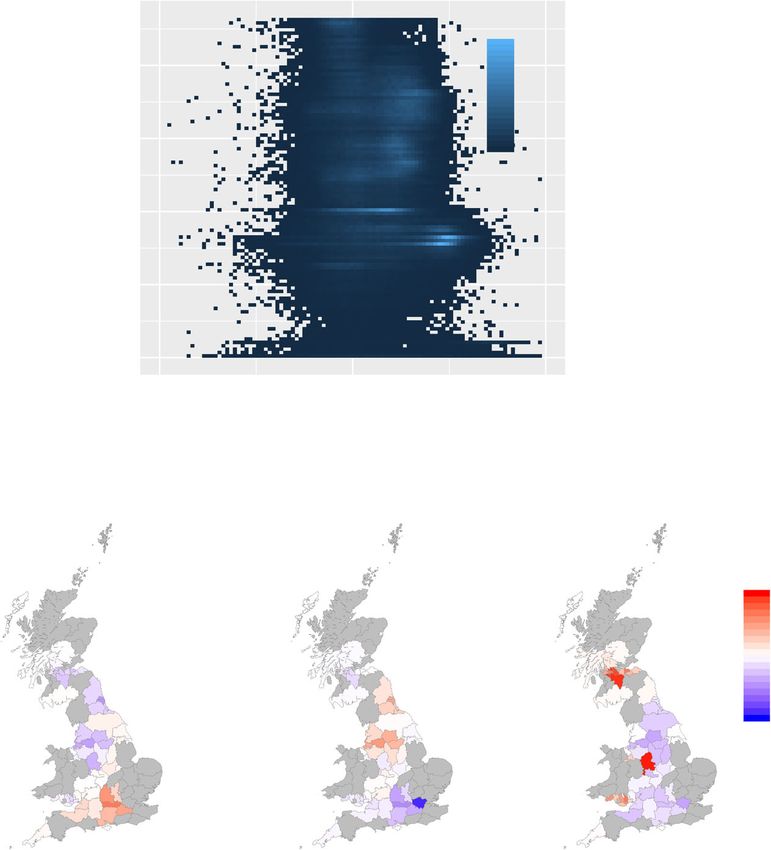
Naseri et al. BMC Biology   (2021) 19:32                                                                       Page 2 of 12

Background                                                     person having 5 cM genetic connections to 14,000, or
An individual’s genealogical history is often of interest to   about 3% of UKBB persons, whom we call genetic rela-
the innate curiosity about one’s ancestry. However, it         tives or relatives for short. These segments offer on aver-
has been challenging to collect the complete and accur-        age 10x coverage of the overall diploid genome for a UK
ate family pedigree of an individual. Further, the pedi-       individual.
gree record is often incomplete and lacking objective,            Noting that this density of IBD segments is higher
quantitative details of one’s ancestors and relatives. As a    than that reported by existing studies [10], we took extra
result, population studies of personal genealogical his-       caution assessing the quality of our results. Since quality
tory are often void of quantitative rigor.                     assessment of IBD segment calls of a large cohort is a
  Thanks to the establishment of modern biobanks and           less-studied problem, we developed a strategy for evalu-
direct-to-consumer (DTC) genetic testing companies             ating IBD segment calls in an “unsupervised” fashion:
which contain genotype information of a relatively large       First, we compared the kinship coefficients derived from
fraction (0.1–5%) of a population, it is now possible to       RaPID’s IBD calls against a standard genotype-based re-
identify dense genetic connections, as manifested by           latedness caller, KING [11]. We verified that RaPID’s call
identical-by-descent (IBD) segments, among individuals.        is indeed consistent with the theoretical expectation for
IBD segments are shared DNA segments between two               close relatives (Additional file 1: Fig. S1).
individuals that are inherited from a common ancestor.            Second, we verified the consistency of RaPID’s calls
This opens the possibility to study the quantitative de-       with traditional methods. As not all methods can run to
tails of one’s genealogical history and identify emerging      call > 5 cM IBD segments for all UK Biobank partici-
patterns.                                                      pants without extravagant computing resources, we used
  The patterns of IBD segments in large cohorts and            a subset of 200,000 participants and ran over chromo-
biobanks have been extensively studied. However, the           some 22. We ran traditional methods including GERM
scope of some studies is limited to unveil detailed pedi-      LINE [12], Refined IBD [13], and also a recent method
gree information [1]. Other IBD segment analyses aim to        iLASH [14], and calculated the overlap between these
reveal overall population demographic histories [2–6]          sets of IBD calls. We found that RaPID’s results included
and clusters [7]. There has been a lack of studies that in-    almost all segments called by other methods: 95.8% of
vestigate personal genealogical history at an intermediate     GERMLINE’s calls, 97.2% of iLash’s calls, and 99.4% of
scale. Although the complete pedigree for most individ-        Refined IBD’s calls (Additional file 1: Table S1 and Fig.
uals is difficult to trace beyond a few generations, it is     S2). Interestingly, RaPID detected 16.3% more segments
possible to describe a person’s genealogical history using     that were missed by all other methods.
their genetic relatives revealed by IBD segments.                 Third, we leveraged the monozygotic (MZ) twin pairs
  Here, we present a comprehensive analysis of the per-        to estimate the detection power of IBD segments. While
sonal genealogical history from all identity-by-descent        MZ twins should match their entire chromosomes, in
(IBD) segments of an individual in a biobank of a large        real data, the long IBD segments are interrupted by
modern population. We first made a high-quality call set       switch errors in phasing. Fortunately, these MZ twins
of IBD segments over 5 cM among all 500,000 UK Bio-            are easy to call from non-IBD calling methods, such as
bank [8] participants. Based upon the genetic connec-          KING. Using the 179 twin pairs identified by KING, we
tions revealed through these IBD segments, we                  observe that using the average haplotype matching iden-
investigate the “relative cohort,” all persons who share at    tity over the moving average of windows with 100 SNPs,
least one IBD segment, of individuals. We discuss a set        the switch errors are notably visible (Additional file 1:
of genealogical descriptors (GPs) based on the relative        Fig. S3). Thus, these switch errors created IBD segments
cohort and show that these genealogical descriptors offer      of various lengths. A perfect IBD segment detector
very rich information about one’s genetic makeup, per-         should identify multiple segments that in aggregate
sonal genealogical history, and social behaviors.              cover the entire length of the genome.
                                                                  We define the power of a method over one sample as
Results                                                        the percent of the sites over the entire genome that was
IBD segment calling and quality assessment                     covered by any segment detected by the method. The
Using RaPID [9], an efficient and accurate method, we          average power values over all twin pairs of these
identified 3.5 billion IBD segments over 5 cM within the       methods are shown in Additional file 1: Table S2 and
22 autosomes among 487,409 UK Biobank participants             Fig. S4. RaPID has consistently demonstrated higher
(Methods: the “IBD segment calling using RaPID” sec-           power when compared to other methods. It is also of
tion). Thanks to the efficiency of RaPID, we achieved          interest that the power values of all methods between
this in 5.25 days using a single-core CPU with 6.34G           British twin pairs are higher, probably due, in part, to
peak memory. This translates to, on average, each              the fact that British individuals have superior genotyping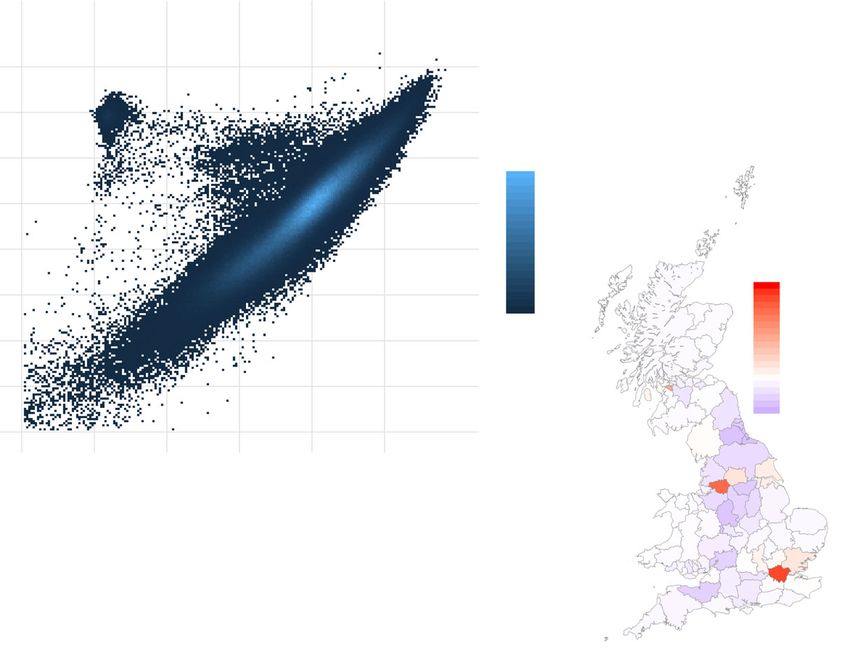
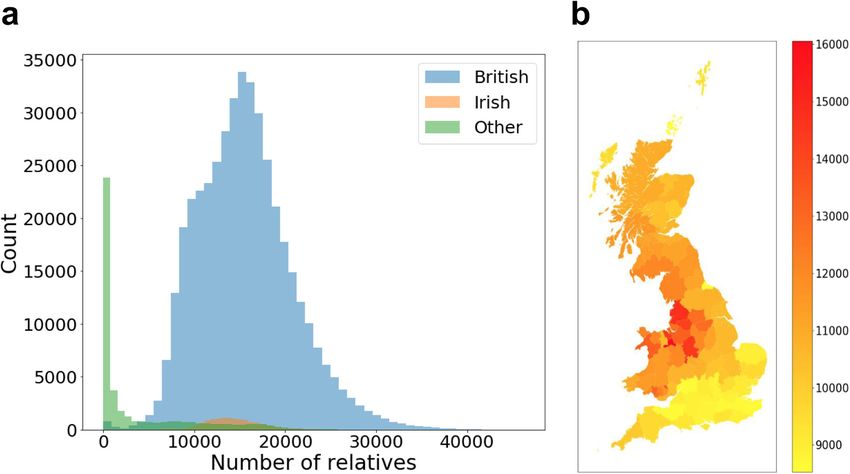
Naseri et al. BMC Biology      (2021) 19:32                                                                                                 Page 3 of 12

and phasing quality. Overall, RaPID’s power for detect-                       mismatch rate which may indicate that some of the
ing IBD segments among MZ twins is approximately 1%                           unique segments might have been inherited from a more
higher than GERMLINE for British and 5% higher for                            distant common ancestor or may contain higher geno-
non-British. The aforementioned benchmark may not                             typing errors. There is also a possibility that some of the
generalize to the detection power across all pairs of indi-                   segments may be false positives which has been ad-
viduals in UK Biobank since the MZ twin haplotypes                            dressed by conducting additional sensitivity analyses
contain probably fewer phasing errors. Therefore, the re-                     using filtered IBD segments. We also removed the par-
sults represent a lower bound for loss of detection                           ents and re-phased the UK Biobank data using SHAP
power.                                                                        EIT3 [16]. There were no major differences between the
   Fourth, we leveraged parent/offspring pairs to evaluate                    trio consistency results after rephasing the data (see
the accuracy of IBD calling. Overall, each method                             Additional file 1: Table S5).
achieved an accuracy of around 99.9% (see Additional                             The quality of IBD calls made by RaPID is high ac-
file 1: Table S3), as there is very little chance that a false                cording to the aforementioned quality assessment. We,
positive segment over 5 cM is called by any of these                          thus, proceeded to the downstream analysis of the IBD
methods. We also evaluated the consistency of reported                        calls. Still, out of an abundance of caution, we performed
IBD segments using trio information similar to the study                      additional sensitivity analyses by excluding the segments
in [15]. We used the average parent-coverage overlap                          with higher than μ + 2σ mismatch rate (2 standard devia-
rate, defined as the average of the percent of child-other                    tions above the mean of all segments across the gen-
segments that are also detected in at least one of the                        ome), retaining about 95% of segments with an average
parent-other segments. The average parent-coverage                            mismatch rate similar to other tools (0.055%) (Add-
overlap rate of RaPID is 98.51% which is in line with                         itional file 1: Table S4).
other tools. Interestingly, the average parent-coverage
overlap rate for the RaPID segments shared with any                           Relative count distribution by UK regions (county)
other tool is 95.92% (see Additional file 1: Table S4). In-                   Overall, average kinship coefficients across self-reported
cluding unique RaPID results will contribute to an even                       ethnic backgrounds are consistent with expectations
higher consistency of shared IBDs among trios and                             (Additional file 1: Fig. S5). The distribution of relative
others. RaPID segments have on average a higher                               counts of all UKBB participants is shown in Fig. 1a. Two

 Fig. 1 Relative count distribution (unadjusted stacked histograms of British, Irish, and others). Other refers to any other self-reported ethnic
 background including white. a Overall distribution over all individuals of all ethnicities. b Average relative counts of all UK areas (except Northern
 Ireland as home locations in Northern Ireland were not available)
Naseri et al. BMC Biology    (2021) 19:32                                                                                        Page 4 of 12

individuals were considered as relatives if they share any              the relative counts stratified by IBD segment length, and
IBD segments with a length greater than or equal to 5                   the relative enrichment within a neighborhood.
cM. While the peak with relative count < 4000 is mainly
due to other ethnic backgrounds rather than British and                 5 cM IBD segments cover the entire diploid genome of an
Irish, there are two peaks noticeable for the British                   average UK individual 10 times
people (Additional file 1: Fig. S6).                                    While 5 cM IBD segments on the average cover each in-
  We found that individuals from central England (e.g.,                 dividual’s genome 10 times, the coverage is highly un-
Manchester) have almost twice as many relatives as                      even. To capture the individual variability of genome
those from southern England (e.g., London) (Fig. 1b).                   coverage, we used 5 genealogical descriptors: percent
The two peaks persist even after adjusting the relative                 genome covered by IBD segments from 1, 2–5, 6–10,
counts by the uneven sampling rates of different regions                11–20, 21–50, or larger than 50 relatives. Our analyses
(Additional file 1: Fig. S6c and [17]) (Methods: the “Relative          are focused on British people as they are well-
count adjustment by the regional sampling rate” section).               represented (the results for all ethnicities are available in
Also, the inter-region relative counts indicate clusters that           Additional file 1: Fig. S8). We found that this coverage is
are consistent with geographic boundaries (Additional file              highly uneven among British individuals (Fig. 2a). Over-
1: Fig. S7). It is evident that Welsh and Scottish people               all ~ 53% (229,647 out of 430,189) of the British have
form relatively tight clusters, respectively. Northern                  over 85% of their genome and ~ 73% (312,796 out of
England has a visible cluster but also has significant sharing          430,189) have over 80% covered by at least 1 IBD seg-
with Scottish individuals. Southern England seems to be                 ment. For coverage of 10 IBD segments, 48% of British
less of a cluster and shares IBD segments evenly with most              individuals (205,976 out of 430,189) have over 40% cov-
other regions.                                                          ered by at least 10 segments. To an extreme, 5% of the
                                                                        British population (20,000 in UK Biobank) has 20% of
                                                                        their genome covered by over 50 segments. The cover-
Personalized genealogical descriptors                                   age for a smaller population would be notably higher
Using all relatives of an individual as a cohort, we can                even using a substantially smaller panel [18, 19]. For ex-
infer the personalized genealogical history of each individ-            ample, it was reported that using only 128 genomes of
ual. This is only possible as each participant has a suffi-             Ashkenazi Jews, the average coverage rate was 46.7%
ciently large number of relatives (estimated 14,000) on                 using 5 cM segments. It was also suggested that with the
average. Besides the obvious choice of total relative                   availability of a panel comprising 2600 AJ or more, the
counts, we developed the following three sets of genealogy              coverage of genome using IBD segments would be close
descriptors (GPs): the genome coverage of IBD segments,                 to 100% [18, 19].

 Fig. 2 Percentage of the genome covered by ≥ 5 cM IBD segments in the UK Biobank for chromosome 1. a Percentage coverage of
 chromosome 1 by increasing the number of IBD segments, across all British individuals. b Average percentage coverage of chromosome 1 by IBD
 segments. The percentage of the population is calculated by considering the available proportion of genotyped individuals from the
 UK population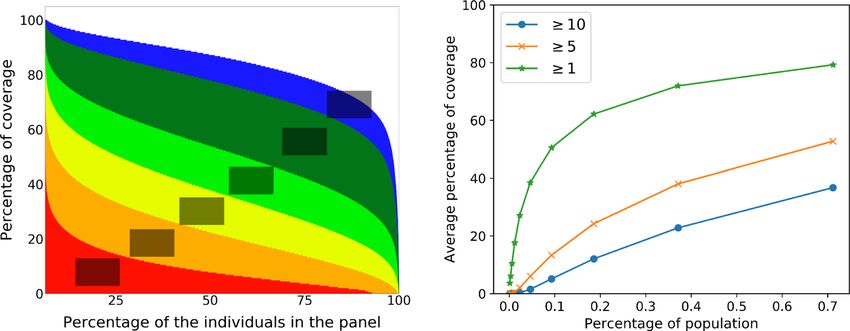
Naseri et al. BMC Biology      (2021) 19:32                                                                                                Page 5 of 12

   Further, we investigated the average percent of IBD                        relatives sharing > 10 cM segments, c10, also their ratio
covered genomes (by any IBD segment) as a function of                         c = c10/c5. For most British individuals, the ratio is cen-
the percent of the population being studied (Fig. 2b).                        tered around 0.13. Notably, there is a small fraction of
The percentage of the population is calculated by con-                        people, n = 1719, with c > 1 (Fig. 3a). Note that their c5
sidering subsets of UK individuals divided by the total                       is among the smallest, and their c10 is among the largest
number of UK population in 2019 (67,530 K) [20]). Fil-                        (Fig. 3b). Two clusters are also still distinguishable after
tering out IBD segments with high mismatch rates also                         filtering out IBD segments with higher mismatch rates
resulted in similar genome coverage (see Additional file                      (see Additional file 1: Fig. S11). Therefore, they represent
1: Fig. S9). The proportion of genomic bins covered by                        a population undergoing rapid recent expansion or rep-
different numbers of IBD segments and the genomic                             resent a population with a small and constant sized
coverage across chromosome 1 is shown in Additional                           population. These individuals are enriched in Greater
file 1: Fig. S10. At the 0.7% sampling rate of UK Biobank,                    London, Greater Manchester, and the outskirts of Glas-
80% of the genome is covered by at least 1 IBD segment.                       gow (Fig. 3c). Also, their population frequency is about
Even at a 0.1% sampling rate, the average genome cover-                       0.4%. All these characteristics match that of British Jewry
age remains 50%. This fact implies a much more reliable                       [22].
and base-pair resolution imputation or construction of                           In order to validate this hypothesis, we downloaded
one’s genome with a very small portion of genome poly-                        genotype data of an Ashkenazi Jewish individual and
morphism (e.g., microarray genotype data) when a bio-                         phased them using his parents’ genotypes. The trio’s
bank scale database is available. Public awareness of this                    data were downloaded from the Personal Genome Pro-
genome imputability is needed as to the potential issue                       ject [23]. We then searched for two-phased haplotypes
of genome privacy (see the “Discussions” section).                            of the son (in Chromosome 1) in the UKBB with a mini-
                                                                              mum target match length of 200 SNPs, corresponding to
Individuals’ relative count stratified by IBD length reflects                 about 8 cM, using PBWT-Query [24]. A detailed de-
familial expansion history                                                    scription of the pipeline can be found in the “Methods”
The decay pattern of relative counts with increasing IBD                      section. The first haplotype had 293 hits where 103 of
length reflects population history [2, 21]. Instead of ana-                   them were in the subset of individuals with high c value.
lyzing the gross pattern over all individuals, we analyzed                    The second haplotype had 257, out of which 88 were in
the pattern pertaining to each individual. We derived the                     the subset of individuals with high c values. The fact that
following relative counts for each individual: the count                      over 1/3 of hits were from this 0.4% population suggests
of relatives sharing 5–10 cM, c5, and the count of                            that this cluster of high c values identifies probable

 Fig. 3 A group of 1719 individuals with distinct IBD patterns. a Two clusters are distinctive in the histogram of the ratio of relative counts sharing
 5–10 cM and sharing 10 cM IBD segments. b People in cluster 2 have low relative counts in 5–10 cM segments and high relative counts in > 10
 cM segments. The diagonal line is depicted as a dotted red line. c Regional enrichment of cluster 2
Naseri et al. BMC Biology (2021) 19:32 Page 6 of 12
British Jews (p value< 10− 16, chi-squared test). We fur- Interestingly, local connectivity is inversely correlated
ther compared the potential Jews with European Jews in with the 25 km neighbor count (Fig. 5 and Additional
the Khazar dataset [25] using traditional Principal Com- file 1: Fig. S13 and Fig. S14). Based on e25, we identify 3
ponent Analysis. The PCA results confirm that the clus- clusters: people with weak, moderate, or strong local
ter with high c values is indeed similar to the European connectivity. Using the number of neighbors within 25
Jews (Italian or French Jews) which further confirms our km, i.e., the density of UK Biobank participants in one’s
conjecture (see Fig. 4). neighborhood, as a proxy of the living environment, we
divided the individuals as dwellers of five different re-
gions based on the population density of their home lo-
Analysis of relative enrichment in neighborhood reveals cation (Methods: the “Designating types of living
regional patterns of preference for living closer to environment by counting neighbors” section). For ex-
relatives ample, areas with more than 40,000 individuals are des-
It is generally expected that an individual lives near to ignated as high-density areas. Our analysis assumes
one’s extended family. Assuming relatives represent sampling density is an approximation of the census
one’s extended family, we can study the social behavior density. For people in very high-density areas, there is a
of individuals. To quantify the preference of an individ- lack of local connectivity (weak local connectivity). For
ual towards living closer to their extended family, or people living in high and moderate density areas (with
local connectivity, we calculated the relative enrichment the neighbor count in 21,000-40,000), there is a second
within the neighborhood (REIN). This can be defined as subgroup of people with e25 = 1.7. For people with a
the ratio between the relative density in the neighbor- neighbor count < 21,000, the relative enrichment in the
hood to the relative density across the entire UK. A neighborhood is very high, suggesting people living in
REIN of one indicates no preference for local connectiv- less-populated areas tend to have higher enrichment of
ity, and a larger REIN indicates a stronger preference. relatives within the neighborhood.
We confirmed that overall relative density is indeed We further depict the regional differences of people
enriched by almost 1.7 fold in the neighborhood of a 1 with weak, moderate, and strong local connectivities
km radius of a person. This enrichment showed a sign (Fig. 5(d–f) and Additional file 1: Table S7). Interest-
of slow decay as the neighborhood radius became ingly, the counties that are with the highest enrichment
greater (Additional file 1: Table S6). REIN as a measure for people with weak local connectivities are Greater
of local connectivity is quite noisy as indicated by its London, Berkshire, and Oxfordshire, while the counties
broad distributions (Additional file 1: Fig. S12). We with the highest enrichment for people with strong local
chose to use relative enrichment within a 25 km radius connectivity are Staffordshire, Greater Glasgow (South
(e25) as the REIN measure as it includes a greater num- Lanarkshire, East Dunbartonshire, and North Lanark-
ber of individuals and thus is numerically more stable. shire) and Cardiff. Interesting, Greater Manchester,
Fig. 4 Principal components analysis of genetic variants of potential British Jews, the Khazar dataset, and a randomly selected subset of
individuals from UK Biobank. PCA’s were calculated using the intersection of the genetic variants from the UK Biobank and the Khazar datasets.
Forty principal components of the variance-standardized relationship matrix were extracted using PLINK v.1.9 [26] and the first four components
were visualized: a first and second, b third and fourth principal components. The Italian and French Jews from the Khazar dataset are colored
in redNaseri et al. BMC Biology (2021) 19:32 Page 7 of 12
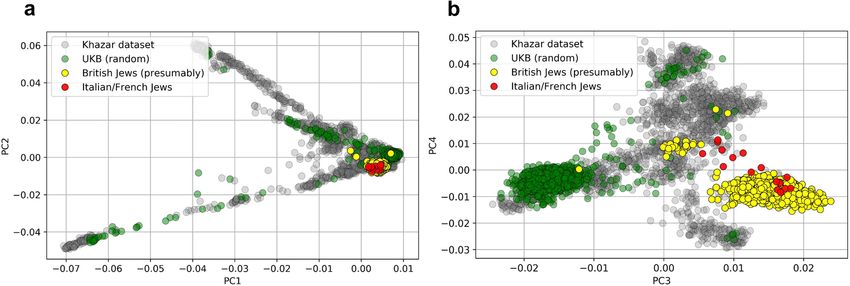
Fig. 5 Preference of local connectivity as measured by relative enrichment in the neighborhood (REIN). a Preference of local connectivity
(enrichment of relatives in a 25 km neighborhood, e25) is overall inversely correlated with population density (neighbor count). b Distribution of
the number of neighbors in a 25 km area. c Distribution of the preference for local connectivity (enrichment of relatives in a 25 km radius). UK
Biobank participants can be clustered into three groups using the local connectivity: people with preferences of weak, moderate, or strong local
connectivity. The vertical bars (divisions of strong, moderate, and weak local connectivity) were determined by visual inspection. d–f Maps of
regional enrichments of people with weak, moderate, and strong local connectivities. The enrichment of types of residents in each region was
quantified by the Pearsons’ residuals: A positive residual (red) corresponds to enrichment while a negative residual (blue) indicates depletion.
Counties with a low sampling rate (< 0.001) are colored in gray
Merseyside, and Tyne and Wear are the areas with the genealogical descriptors: the genome coverage by IBD
highest enrichment of moderate local connectivity. segments, the change of relative counts at different IBD
lengths, and the relative enrichment within a neighbor-
Discussions hood. Each of these genealogical descriptors reveals in-
The main focus of the study is to provide a new data- teresting details about personal genealogical history.
driven descriptive analysis of the personal genealogical First, our analysis of genome coverage by IBD seg-
history of a large modern population using IBD sharing ments provides much higher resolution detail about the
patterns. By analyzing the 3.5 billion IBD segments > 5 cM sharing of genetic information in a large modern popula-
shared among half a million UK Biobank participants, our tion. We found that even with sampling the UK popula-
analysis offers a unique angle into the very recent demo- tion at a rate of merely 0.7%, more than half of UK
graphic history of the UK. Unlike existing studies that individuals have 80% of their genome potentially im-
focus on IBD segments between all individuals that reflect puted using IBD segments shared with others. Our ana-
the history of the population [2, 10, 21], we focus on the lysis offered intricate implications as to genome privacy.
personalized genealogical histories of individuals. As the fast-growing business of direct-to-consumer
Based on approximately 14,000 IBD segments shared (DTC) genomics, genome privacy has become of import-
between a person and the rest of the UK Biobank partic- ance in both academia and the general public. Previ-
ipants, we discussed 3 categories of personalized ously, concerns have been focused on the potentialNaseri et al. BMC Biology (2021) 19:32 Page 8 of 12 discrimination by employers and health insurance com- approaches a significant proportion of the entire popula- panies against carriers of certain mutations [27, 28]. Re- tion. Traditional genetics studies are mostly at the sub- cently, a new concern [29] has been raised regarding law population scale, i.e., the samples under study were ei- enforcement’s access to biobank scale genomic databases ther a collection of “unrelated individuals” or familial for solving criminal cases by connecting remote relatives members with traceable pedigrees. Population-scale data genetically. Our study demonstrated that those two con- sets such as the UK Biobank offer the opportunity of cerns are indeed two sides of the same coin as one’s gen- studying emergent phenomena that are not possible at ome can be largely reconstructed by the genomes of his/ the sub-population scale. her genetic relatives traditionally thought as “unrelated.” This analysis offers an alternative definition of ances- Even sharing a low resolution of one’s genome, such as try. Traditionally, the global ancestry of a person is typ- genotypes of 500 K non-clinically-associated SNVs used ically labeled by one or several predefined continental- by a DTC genomics company, may grant access to a level groupings. Although local ancestries can add differ- much more detailed genomic information at base-pair ent labels across different genomic regions, each label is resolution. Therefore, public awareness of this issue of still of continental-level. Rather than resorting to these genome privacy is needed. somewhat arbitrary labels, we offer an alternative way of Second, our analysis of the variation of relative counts describing a person’s ancestry label by using the geo- at different IBD lengths revealed individualized family graphic labels of one’s ancestors, e.g., their birth loca- expansion history. While some existing studies of popu- tions [30] or the patterns of shared IBD segments. lation IBD patterns focused on clustering individuals Based on our analysis, a person can use the geographic based on the IBD network [10], we offered an locations of his/her genetic relatives as a proxy to the lo- individual-centered perspective. A unique benefit of our cations of potential ancestors. For example, one UK per- analysis is that instead of crawling the entire IBD net- son may be described as having 90% of genetic relatives work, such information can be collected efficiently via living in Manchester, 9% in London, and 1% from Africa. IBD queries such as PBWT-Query [24]. For example, we By revealing regional genetic connections, our approach identified a minority group of individuals (likely British may open new research avenues for studying family- Jews) that went through drastic recent expansion. Of related social behaviors. This description can be interest for potential future research is to derive theoret- enriched by adding temporal resolution by defining gen- ical frameworks for inferring more details of an individ- etic relatives with different IBD length cutoffs. Of ual’s family history. course, this is still imperfect. The number of ancestors Third, we also demonstrated that IBD information of of each individual grows quasi-exponentially with the individuals can be intersected with other information, number of generations in the near past; the genetic rela- such as geographic location, and offer new measurement tives identified by IBD segment analysis may be distrib- of social behaviors. Using relatives as a proxy of one’s uted broadly in a spectrum of generations. Also, the extended family, we showed that by studying the en- distribution of ancestors’ geographic locations may vary richment of relatives in one’s neighborhood, an indi- from generation to generation. Analyses of these pat- vidual’s preference towards staying with extended terns and theoretical modeling may be another exciting family (local connectivity) is revealed. Interestingly, new research avenue. drastic regional variations of preferences of local con- nectivity were shown. In Greater London, people with Conclusions the weakest local connectivity are found, reflecting its In this study, we investigate the individualized IBD shar- cosmopolitan status. In Greater Manchester, people ing patterns of UK individuals using UK Biobank data. with moderate enrichment of local connectivity are We found that since a substantial portion of the UK found, indicating regional demographic movement in population is sampled, very dense IBD information is re- central England. In the major cities of Scotland and vealed by modern IBD detection methods. These IBD Wales, people with strong local connectivity are segments offer new insights into personalized genea- found. A limitation of our study is that UK Biobank logical history of individuals. We found a large fraction is not necessarily a uniform random sampling of the of an individual’s genome can be covered by shared IBD UK population. The home addresses of participants segments, which has implications for genotype imput- are mostly clustered around recruitment centers (see ation and privacy. Also, we found by looking at the rela- Supplementary Fig. 1 in [17]). Therefore, validation of tive counts of IBD segments shared at different lengths, our results regarding the geographical locations on we can reveal genealogical history of individuals, and the rest of the UK regions may be needed. thus enabling discovery of subpopulations with distinct In this work, we conducted a population genetics genealogical patterns. Moreover, using people sharing study at the population-scale, i.e., the study sample size IBD segments as a representative sample of one’s
Naseri et al. BMC Biology   (2021) 19:32                                                                       Page 9 of 12

relatives, we can infer personal social behaviors such as     KING is a commonly used method for calling close rela-
preference favoring living closer to one’s extended fam-      tives from global genotype similarity and thus provides
ilies. In summary, our analysis revealed genetic makeup,      an anchor for evaluating IBD segment calls. The related-
personal genealogical history, and social behaviors at the    ness data (up to third-degree relationship) from geno-
population scale. While our current study is mostly de-       types generated by KING were downloaded from the UK
scriptive in nature, we believe it opens possibilities for    Biobank project [8]. In order to distinguish parent/off-
further studies of individual’s genetic connections in bio-   spring and full siblings pairs in the first-degree relation-
bank data.                                                    ships, an IBS0 cutoff of 0.002 was selected. If the IBS0
                                                              value was greater than 0.002, then the pair was consid-
Methods                                                       ered as full siblings.
IBD segment calling using RaPID
The phased haplotypes in BGENv1.2 format from the             Benchmarking RaPID results versus GERMLINE, Refined
UK Biobank release (version 2) were extracted and con-        IBD, and iLash
verted to VCF format. Phasing was performed by the UK         While it is possible to benchmark IBD segment detection
Biobank team using SHAPEIT3, as described in [8].             methods using simulated data, it is almost impossible to
RaPID v.1.7 was run for all 22 autosomal chromosomes          capture all of the nuances in the real data. On the other
of all phased haplotypes in the UKBB comprising 487,          hand, it is difficult to compare different methods within
409 participants and 658,720 sites [8]. We did not use        real data as there is often a lack of ground truth. We in-
the imputed data as the imputed data may not lead to          vestigated the consistency among the IBD calls from dif-
more accurate results. The data density would become          ferent methods and then used the small subsets of MZ
crucial when searching for shorter IBD segments (e.g., 1      twin pairs for evaluation of detection power. The parame-
or 2 cM). The phased haplotypes from the UK Biobank           ters for running GERMLINE and Refined IBD can be
V2 release were downloaded and converted to VCF files.        found in Additional file 1: Table S8.
The parameters for RaPID were calculated assuming a             We collected IBD results from four tools (GERMLINE,
genotyping error rate of 0.25%. The number of runs was        iLASH, Refined IBD, and RaPID) as four distinct sets of
set to 10, the minimum number of passes to 2, and the         IBD segments: S1, S2, S3, and S4 respectively. All IBD
window sizes to 3. The minimum target length was set          segments that have been reported by at least one of the
to 5 cM (-r 10 -s 2 -w 3 -l 5). The genetic maps from de-     tools (in any of the result sets) were further investigated.
CODE [31] for hg38 were downloaded and lifted over to         To check whether an IBD1 in S1 is reported in S2, we
h19 using the liftOver tool [32]. The sites that did not      searched in S2 for the same pair of individuals and
maintain the genomic position order to their neighbor-        checked if there is any reported IBD segment that over-
ing sites after conversion were discarded. The remaining      laps at least 50% or more of the reported segment in S1.
sites were used to obtain the genetic locations of the        The percentage of IBD segments in each set that has
available sites in the UKBB using linear interpolation.       been covered by other tools have been reported in the
                                                              Additional file 1: Table S1. This is not a systematic
Runs of PBWTs over genetic distance (RaPID v.1.7)             evaluation of the pros and cons of individual methods.
We modified RaPID to allow direct use of genetic dis-         Still, consistent IBD segment calls indicate a degree of
tances in PBWT [33]. The latest version of RaPID can          confidence. Inconsistent calls among methods would
take the minimum target length directly in cM and will        warrant some additional investigation.
return all detected segments greater than or equal to the
given length without post-processing of data. The pro-        Estimation of detection power and accuracy
gram holds a genetic mapping table for all the available      To estimate the detection power of different methods,
sites and the PBWT has been modified to work directly         179 pairs of MZ twins (reported by KING) were consid-
with the genetic length instead of the number of sites.       ered. We expected that the reported IBD segments
These changes were implemented in RaPID v.1.7.                would cover the entire chromosomes between any two
   We compared the results of the previous version of         MZ twins. Due to the stochastic nature of current phas-
RaPID (v.1.2.3) and the new version (v.1.7) using the UK      ing methods, there are phasing errors even between MZ
Biobank data. We found that the runtime has decreased         twins. The detection power for each MZ twin pair was
from 12.78 days to 5.25 days, primarily due to the accur-     defined as the percentage of the genome (all 22 chromo-
ate control of window sizes.                                  somes) that has been covered by reported IBD segments.
                                                              The average detection power values between all MZ
Benchmarking RaPID results versus KING                        twins among British, non-British, and all pairs were re-
Related individuals from KING were compared to the            ported. The field 21,000 from the UK Biobank data was
individuals sharing IBD segments reported by RaPID.           used to determine the ethnic backgrounds of the MZ
Naseri et al. BMC Biology (2021) 19:32 Page 10 of 12
twins. For Refined IBD, we ran the program only once. using the Python library convertbng (https://pypi.org/
Running Refined IBD with different seeds and merging project/convertbng/). The Python library reverse_geoco-
results may increase the detection power but at the same der (https://pypi.org/project/reverse_geocoder/) was
time, it will require more computational resources. For then used to find the nearest town/city using the GPS
GERMLINE, we used the tag -h_extend which is de- coordinates. For each coordinate, reverse_geocoder
signed for well-phased data. Therefore, it will be less tol- returns only the corresponding subdivision, which is
erable to phasing errors but no false positives are finer than counties. The subdivisions were then trans-
introduced as a result of tolerating phasing errors. lated into the corresponding counties.
Overall, there are low chances that a false positive
segment over 5 cM is called by any of these methods. To Relative count adjustment by the regional sampling rate
investigate the accuracy of the reported segment impli- The population size for each county was extracted [34].
citly, we extracted 5674 parent/offsprings (identified by For each county i, the sampling rate Si was defined as
KING) with the self-reported British background. As- the number of participants divided by the population
suming there is no inbreeding, reported IBD segments size. For each individual, the number of relatives in each
between parent and offspring should not overlap. Please county (Ci) was calculated (using the home locations).
note that multiple IBD segments in each chromosome The normalized number of cousins for each individual
may be reported between an offspring and its parent due was then calculated using the following formula: C ¼ r
to recombinations or phasing error. We collected all PN −1
i¼1 C i S i , where N denotes the total number of coun-
5674 parents/offspring pairs identified by KING. We P −1
searched for potential false positives, i.e., the overlapping ties. The quantity N i¼1 C i S i denotes the total number
IBD segments between parent/offspring pairs. An IBD of (sampled and unsampled) cousins the person has, and
segment is considered to be false positive if 50% of the the quantity r denotes the average sampling rate for all
segment is covered by another IBD segment between the counties, i.e., 0.7%.
same pair of parents/offspring. We find < 0.01% potential
false positives in any of these methods. If we defined the Searching for query haplotype from the Personal Genome
accuracy as percentage correctly identified segments: ac- Project in UKBB
curacy = (#IBD - #false positives)/(#IBD), then the accur- The trio data of an Ashkenazi Jewish family (huAA53E0
acy values for RaPID, GERMLINE, iLash, and Refined son and his parents hu8E87A9, hu6E4515) were down-
IBD using parent/offspring pairs would be 99.8740%, loaded [35]. The sites containing SNPs were extracted from
99.9803%, 99.9217%, and 99.9126%, respectively. Manual the trio data. Each site containing a missing value was dis-
inspection of false positives also revealed that most cases carded. The genotype data for the son were then phased
are also likely due to runs-of-homozygous segments. using parent data and simplified by filtering out all-het sites.
The overlapping sites with the UKBB (chromosome 1) were
Trio consistency selected which resulted in 6629 sites. The 6629 sites of
The consistency of reported IBD segments among trios chromosome 1 for all the individuals from UKBB were ex-
were investigated similar to [15]. The consistency check tracted using vcftools (v0.1.15) [36]. PBWT-Query [24] was
is based on the observation that if a child has an IBD used to search for the query haplotypes with a minimum
segment with another individual, then at least one of the target length of 200 SNPs (-L 200).
parents should also share the IBD segment with the
other individual. One hundred thirty-three parent/child Genetic comparison of potential British Jewry with Khazar
trios were extracted from 200,000 individuals in the UK dataset
Biobank. We then investigated the percentage of child- The full Khazar dataset [25] was downloaded and com-
other IBD segments that were covered by at least one of bined with 1719 potential Jews and another 1719 ran-
the parents of the child (we call parent-coverage overlap domly selected from the UK Biobank. The combined
rate). While Durand et al. [15] used a minimal overlap dataset contains 46,215 sites across all autosomal chro-
cutoff to define a binary overlap/nonoverlap label for mosomes. 427 sites from the Khazar dataset were flipped
each segment, we defined a non-binary fraction of child- using Plink (-flip) due to strand inconsistency. Plink was
other segments covered by parent-other pair, to allow a used to compute PCA for the first 40 components and
single number to describe the trio consistency. the first 4 components were presented.
Assignment of the geographic area Design of genetic genealogical descriptors
Ordinance coordinates in the form of (east, north) were The following categories of genetic genealogical descrip-
retrieved from the UKBB fields 22702 and 22704. The tors were defined to capture extensive information from
coordinates were converted to longitudes and latitudes the relative cohorts of an individual: (1) percentage of theNaseri et al. BMC Biology (2021) 19:32 Page 11 of 12
genome covered by IBD segments from relatives, (2) decay and very low density, as people with the count of neigh-
of relative counts as the length of IBD segments increase, bors included in UK Biobank > 40,000, 31,000–40,000,
and (3) enrichment of relatives in one’s neighborhood. 21,000–31,000, 5000–21,000, and < 5000, respectively.
Enrichment of counts in tables Supplementary Information
For describing the enrichment of counts of individuals The online version contains supplementary material available at https://doi.
in a contingency table, e.g., e25 vs city_size or c vs area, org/10.1186/s12915-021-00964-y.
we used the Pearson’s residual: ((observed − expected)/
Additional file 1: Figure S1. The probability distributions of the sum
sqrt (expected)). of genetic lengths shared among pairs of individuals in five types of
relatedness using detected IBD segments by RaPID. Figure S2.
Percentage of the genome covered by IBD segments Number of IBD calls for different IBD detection tools using
chromosome 22 of 200K individuals from UK Biobank. Figure S3. An
To investigate the correlation between the available example of IBD segments over chromosome 12 called by different
number of individuals from a population and the per- methods using a twin pair. Figure S4. Average detection power of
centage of the genome covered, 10 subsets {S1, S2,.., S10} different methods for twins on all autosomes. Figure S5. Ethnicity
by ethnicity kinship matrix using the self-reported ethnic back-
of the UK Biobank were extracted. S1 contains all avail- grounds in UK Biobank and the sum of detected IBD segments by
able 480,518 individuals. Si + 1 was generated by ran- RaPID in all autosomes. Figure S6. Relative count of British individ-
domly selecting half of the individuals from Si. For each uals. Figure S7. Cross-region average relative count. Numbers are
normalized by total potential pairs and the total length of the chro-
subset, the average genome coverage was computed as mosomes. Figure S8. Percentage of the genome covered by IBD
follows: each chromosome was divided into bins of 1 segments from others in UK Biobank by ethnicity. Figure S9. Aver-
Mbps. For each individual, the number of shared IBD age percentage coverage of chromosome 1 by IBD segments after
filtering out detected IBD segments. Figure S10. Genome coverage
segments overlapping with each bin was calculated. of individuals by IBD segments in the UK Biobank data for chromo-
Then, the number of bins overlapping with at least 1, 5, some 1. Figure S11. Number of relatives sharing 5-10 cM vs. sharing
and 10 IBD segments were calculated and divided by the 10 cM IBD segments for individuals in UK Biobank after filtering
RaPID results. Figure S12. The distribution of REIN of all UK Biobank
total number of bins. Finally, the average of the genome participants within 1, 5, 10, and 25 km radius. Figure S13. Preference
coverage among all available individuals was computed. of local connectivity as measured by relative enrichment in the
neighborhood (REIN) after filtering RaPID results. Figure S14. Correl-
ation between the preference of local connectivity (enrichment of
Collecting IBD segment counts at different lengths relatives in a 25 km neighborhood, e25) and population density
For each individual, counts of relatives sharing IBD seg- (neighbor count). Table S1. IBD results of Germline, iLash, Refined
ments at different lengths are informative to personal IBD, and RaPID (rows) covered by other tools (columns). Table S2.
Average detection power of different methods. Table S3. Accuracy
genealogical history. We chose the counts of IBD seg- of called IBD segments using MZ twin pairs. Table S4. Average mis-
ments in [5, 10), and [10, 3400). The total sum of IBD match rate and parent coverage of IBDs in trios using different
segments between any two pairs of individuals sharing methods. Average parent coverage denotes the proportion of the
IBD segments from child-other that were overlapping by parent-other
an IBD segment (relative) from all autosomal chromo- segment. Table S5. Parent coverage of IBDs in trios using different
somes in the UKBB was calculated. Subsequently, the methods where parents are not used for phasing the genotype data.
number of relatives of each individual for two bins (5– Table S6. Relative enrichment in different neighborhoods decays
with increasing radius. Table S7. Enrichment of people with different
10 cM and ≥ 10 cM) was computed. local connectivities in UK areas, as indicated by Pearson’s residuals.
Table S8. Parameters and command lines for benchmarking different
Enrichment of relatives in one’s neighborhood IBD detection tools.
The UK Biobank home location fields 22,702_0_0 (east
coordinate) and 22,704_0_0 (north coordinate) were Acknowledgements
This research has been conducted using the UK Biobank Resource under
used to compute the distance between any two individ-
Application Number 24247.
uals. The number of neighbors and relatives within a
neighborhood of 1, 5, 10, and 25 km were calculated as Authors’ contributions
follows: for each individual and the given radius r (e.g., AN, SZ, and DZ conceived and designed the study. All authors conducted
the analyses and interpretation of the results. AN and DZ led the writing of
1 km), all UK participants within a distance r from both the manuscript. All authors contributed to the writing of the manuscript. All
query’s east and north coordinates were extracted. Sub- authors read and approved the final manuscript.
sequently, the Euclidean distances between the query in-
dividual and the extracted individuals were calculated. Funding
AN, KT, SZ, and DZ were supported by the National Institutes of Health grant
R01 HG010086. AN and DZ were supported by the National Institutes of
Designating types of living environment by counting Health grant OT2 OD002751. XL was supported by the National Institutes of
neighbors Health grant R01 HG009524.
By plotting the histogram of the number of neighbors
Availability of data and materials
within 25 km (Fig. 4b), we divided the individuals as The Khazar dataset was downloaded from https://evolbio.ut.ee/khazar/. The
dwellers of regions with very high, high, moderate, low, UK Biobank data are available from the UK Biobank study but restrictionsNaseri et al. BMC Biology (2021) 19:32 Page 12 of 12
apply to the availability of these data, which were used under license for the 15. Durand EY, Eriksson N, McLean CY. Reducing pervasive false-positive
current study, and so are not publicly available. identical-by-descent segments detected by large-scale pedigree analysis.
All other data generated in this study are included in this published article Mol Biol Evol. 2014;31:2212–22.
and its supplementary information files. 16. O’Connell J, Sharp K, Shrine N, Wain L, Hall I, Tobin M, et al. Haplotype
estimation for biobank-scale data sets. Nature Genetics. 2016;48:817–20.
Ethics approval and consent to participate https://doi.org/10.1038/ng.3583.
Not applicable. 17. Abdellaoui A, Hugh-Jones D, Yengo L, Kemper KE, Nivard MG, Veul L, et al.
Genetic correlates of social stratification in Great Britain. Nat Hum Behav.
2019;3:1332–42.
Consent for publication 18. Carmi S, Hui KY, Kochav E, Liu X, Xue J, Grady F, et al. Sequencing an
Not applicable. Ashkenazi reference panel supports population-targeted personal genomics
and illuminates Jewish and European origins. Nat Commun. 2014;5:4835.
Competing interests 19. Panoutsopoulou K, Hatzikotoulas K, Xifara DK, Colonna V, Farmaki A-E,
AN, SZ, and DZ, through their respective universities, have submitted a Ritchie GRS, et al. Genetic characterization of Greek population isolates
patent application related to indexing, updating, and searching haplotypes reveals strong genetic drift at missense and trait-associated variants. Nature
for genetic genealogical discovery in genotype databases. Communications. 2014;5. https://doi.org/10.1038/ncomms6345.
20. Nations U. World population prospects 2019; 2019.
Author details 21. Palamara PF, Lencz T, Darvasi A, Pe’er I. Length distributions of identity by
1
School of Biomedical Informatics, The University of Texas Health Science descent reveal fine-scale demographic history. Am J Hum Genet. 2012;91:
Center at Houston, Houston, TX 77030, USA. 2Department of Computer 809–22.
Science, University of Central Florida, Orlando, FL 32816, USA. 3USF 22. Office for National Statistics. Census aggregate data for National Statistics
Genomics, College of Public Health, University of South Florida, Tampa, FL Office. UK Data Service. 2011:2011.
33612, USA. 4Center for Precision Health, School of Biomedical Informatics, 23. Church GM. The personal genome project. Mol Syst Biol. 2005;1:2005.0030.
School of Public Health, The University of Texas Health Science Center at 24. Naseri A, Holzhauser E, Zhi D, Zhang S. Efficient haplotype matching
Houston, Houston, TX 77030, USA. between a query and a panel for genealogical search. Bioinformatics. 2019;
35:i233–41.
Received: 6 December 2020 Accepted: 19 January 2021 25. Behar DM, Metspalu M, Baran Y, Kopelman NM, Yunusbayev B, Gladstein A,
et al. No evidence from genome-wide data of a Khazar origin for the
Ashkenazi Jews. Hum Biol. 2013;85:859–900.
26. Purcell S, Neale B, Todd-Brown K, Thomas L, Ferreira MAR, Bender D, et al.
References PLINK: a tool set for whole-genome association and population-based
1. Staples J, Qiao D, Cho MH, Silverman EK. University of Washington Center linkage analyses. Am J Hum Genet. 2007;81:559–75.
for Mendelian G, Nickerson DA et al. PRIMUS: rapid reconstruction of 27. Price WN 2nd, Cohen IG. Privacy in the age of medical big data. Nat Med.
pedigrees from genome-wide estimates of identity by descent. Am J Hum 2019;25:37–43.
Genet. 2014;95(5):553–64. 28. Billings PR, Kohn MA, de Cuevas M, Beckwith J, Alper JS, Natowicz MR.
2. Browning SR, Browning BL. Accurate non-parametric estimation of recent Discrimination as a consequence of genetic testing. Am J Hum Genet. 1992;
effective population size from segments of identity by descent. Am J Hum 50:476–82.
Genet. 2015;97:404–18. 29. Erlich Y, Shor T, Pe’er I, Carmi S. Identity inference of genomic data using
3. Ralph P, Coop G. The geography of recent genetic ancestry across Europe. long-range familial searches. Science. 2018;362:690–4. https://doi.org/10.
PLoS Biol. 2013;11:e1001555. 1126/science.aau4832.
4. Martin AR, Karczewski KJ, Kerminen S, Kurki MI, Sarin A-P, Artomov M, et al. 30. Bradburd GS, Ralph PL. Spatial population genetics: it’s about time. Annual
Haplotype sharing provides insights into fine-scale population history and Review of Ecology, Evolution, and Systematics. 2019;50:427–49. https://doi.
disease in Finland. Am J Hum Genet. 2018;102:760–75. org/10.1146/annurev-ecolsys-110316-022659.
5. Athanasiadis G, Cheng JY, Vilhjálmsson BJ, Jørgensen FG, Als TD, Le Hellard 31. Halldorsson BV, Palsson G, Stefansson OA, Jonsson H, Hardarson MT,
S, et al. Nationwide genomic study in Denmark reveals remarkable Eggertsson HP, et al. Characterizing mutagenic effects of recombination
population homogeneity. Genetics. 2016;204:711–22. through a sequence-level genetic map. Science. 2019;363. https://doi.org/
6. Dai CL, Vazifeh MM, Yeang C-H, Tachet R, Wells RS, Vilar MG, et al. 10.1126/science.aau1043.
Population histories of the United States revealed through fine-scale 32. UCSC Genome Browser. http://hgdownload.cse.ucsc.edu/admin/exe/linux.
migration and haplotype analysis. Am J Hum Genet. 2020;106:371–88. x86_64/liftOver, Accessed 04/16/2019. Accessed 16 Apr 2019.
7. Belbin GM, Wenric S, Cullina S, Glicksberg BS, Moscati A, Wojcik GL, et al. 33. Durbin R. Efficient haplotype matching and storage using the positional
Towards a fine-scale population health monitoring system. bioRxiv. 2019. Burrows–Wheeler transform (PBWT). Bioinformatics. 2014;30:1266–72.
doi:https://doi.org/10.1101/780668. 34. Office for National Statistics. Population Estimates for UK, England and
8. Bycroft C, Freeman C, Petkova D, Band G, Elliott LT, Sharp K, et al. The UK Wales, Scotland and Northern Ireland. 2019. https://www.ons.gov.uk/
Biobank resource with deep phenotyping and genomic data. Nature. 2018; peoplepopulationandcommunity/populationandmigration/
562:203–9. populationestimates/datasets/
9. Naseri A, Liu X, Tang K, Zhang S, Zhi D. RaPID: ultra-fast, powerful, and populationestimatesforukenglandandwalesscotlandandnorthernireland.
accurate detection of segments identical by descent (IBD) in biobank-scale Accessed Jul 2019.
cohorts. Genome Biol. 2019;20:143. 35. The Personal Genome Project. Accessed 12/1/2019. https://my.pgp-hms.org/
10. Han E, Carbonetto P, Curtis RE, Wang Y, Granka JM, Byrnes J, et al. public_genetic_data, 12/1/2019.
Clustering of 770,000 genomes reveals post-colonial population structure of 36. Danecek P, Auton A, Abecasis G, Albers CA, Banks E, DePristo MA, et al. The
North America. Nat Commun. 2017;8:14238. variant call format and VCFtools. Bioinformatics. 2011;27:2156–8.
11. Manichaikul A, Mychaleckyj JC, Rich SS, Daly K, Sale M, Chen W-M. Robust
relationship inference in genome-wide association studies. Bioinformatics.
2010;26:2867–73. Publisher’s Note
12. Gusev A, Lowe JK, Stoffel M, Daly MJ, Altshuler D, Breslow JL, et al. Whole Springer Nature remains neutral with regard to jurisdictional claims in
population, genome-wide mapping of hidden relatedness. Genome Res. published maps and institutional affiliations.
2009;19:318–26.
13. Browning BL, Browning SR. Improving the accuracy and efficiency of
identity-by-descent detection in population data. Genetics. 2013;194:459–71.
14. Shemirani R, Belbin GM, Avery CL, Kenny EE, Gignoux CR, Ambite JL. Rapid
detection of identity-by-descent tracts for mega-scale datasets. bioRxiv.
2019;:749507. doi:https://doi.org/10.1101/749507.You can also read