Honey Bee Diversity Is Swayed by Migratory Beekeeping and Trade Despite Conservation Practices: Genetic Evidences for the Impact of Anthropogenic ...
←
→
Page content transcription
If your browser does not render page correctly, please read the page content below
ORIGINAL RESEARCH
                                                                                                                                                published: 15 April 2021
                                                                                                                                        doi: 10.3389/fevo.2021.556816

                                             Honey Bee Diversity Is Swayed by
                                             Migratory Beekeeping and Trade
                                             Despite Conservation Practices:
                                             Genetic Evidences for the Impact of
                                             Anthropogenic Factors on
                                             Population Structure
                                             Mert Kükrer 1,2* , Meral Kence 1 and Aykut Kence 1†
                                             1
                                              Biology Department, Middle East Technical University, Ankara, Turkey, 2 Molecular Biology and Genetics Department, Kilis 7
                                             Aralik University, Kilis, Turkey

                                             The intense admixture of honey bee (Apis mellifera L.) populations at a global scale is
                                             mostly attributed to the widespread migratory beekeeping practices and replacement
                                             of queens and colonies with non-native races or hybrids of different subspecies. These
                          Edited by:
                                             practices are also common in Anatolia and Thrace, but their influence on the genetic
                  Rosanna Giordano,
     Puerto Rico Science, Technology         make-up of the five native subspecies of honey bees has not been explored. Here,
     and Research Trust, Puerto Rico         we present an analysis of 30 microsatellite markers from honey bees from six different
                        Reviewed by:         regions in Anatolia and Thrace (N = 250 samples), with the aim of comparing the
                           Mauro Fois,
             University of Cagliari, Italy   impact of: (1) migratory beekeeping, (2) queen and colony trade, and (3) conservation
                       Zachary Huang,        efforts on the genetic structure of native populations. Populations exposed to migratory
             Michigan State University,
                                             beekeeping showed less allegiance than stationary ones. We found genetic evidence
                         United States
                                             for migratory colonies, acting as a hybrid zone mobile in space and time, becoming
                  *Correspondence:
                          Mert Kükrer        vectors of otherwise local gene combinations. The effect of honey bee trade leaves
                mertkukrer@gmail.com         very high introgression levels in native honey bees. Despite their narrow geographic
                             † Deceased
                                             range, introgression occurs mainly with the highly commercial Caucasian bees. We
                   Specialty section:
                                             also measured the direction and magnitude of gene flow associated with bee trade.
         This article was submitted to       A comparison between regions that are open and those closed to migratory beekeeping
    Biogeography and Macroecology,
                                             allowed the evaluation of conservation sites as centers with limited gene flow and
                a section of the journal
    Frontiers in Ecology and Evolution       demonstrated the importance of establishing such isolated regions. Despite evidence
           Received: 28 April 2020           of gene flow, our findings confirm high levels of geographically structured genetic
        Accepted: 26 February 2021           diversity in four subspecies of honey bees in Turkey and emphasize the need to develop
           Published: 15 April 2021
                                             policies to maintain this diversity. Our overall results are of interest to the wider scientific
                               Citation:
    Kükrer M, Kence M and Kence A
                                             community studying anthropogenic effects on the population diversity of honey bees
(2021) Honey Bee Diversity Is Swayed         and other insects. Our findings on the effects of migratory beekeeping, replacement
  by Migratory Beekeeping and Trade
                                             of queens and colonies have implications for the conservation of honey bees, other
     Despite Conservation Practices:
    Genetic Evidences for the Impact         pollinators, and invertebrates, in general, and are informative for policy-makers and other
         of Anthropogenic Factors on         stakeholders in Europe and beyond.
                  Population Structure.
           Front. Ecol. Evol. 9:556816.      Keywords: queen and colony trade, gene flow, population structure, biodiversity conservation, microsatellite
      doi: 10.3389/fevo.2021.556816          markers, Apis mellifera subspecies, isolated regions, migratory beekeeping

Frontiers in Ecology and Evolution | www.frontiersin.org                            1                                             April 2021 | Volume 9 | Article 556816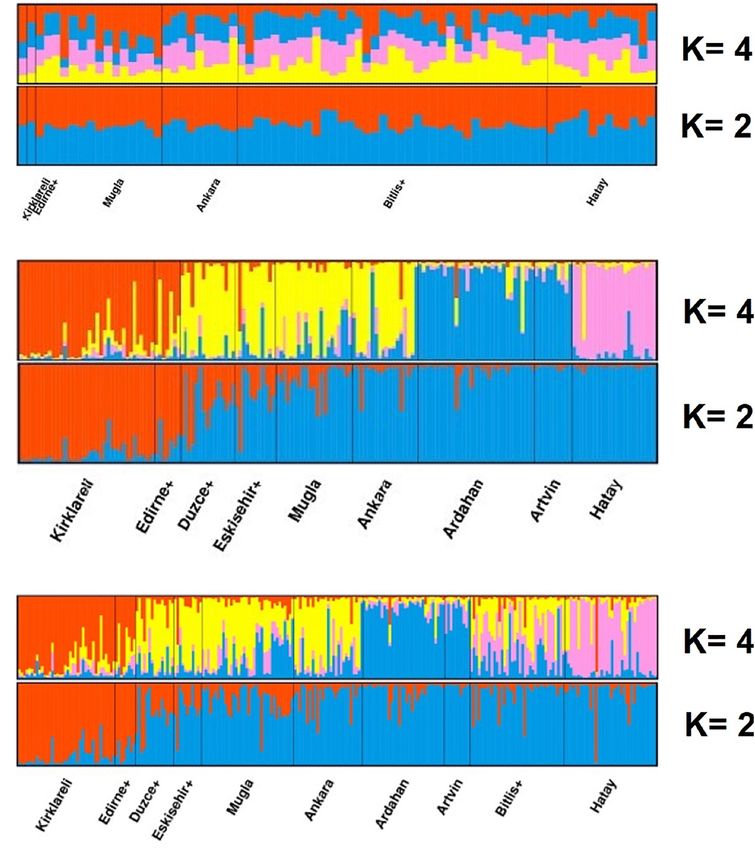
Kükrer et al.                                                                                          Anthropogenic Factors and Honeybee Diversity

INTRODUCTION                                                                  Honey bees may be able to adapt to this new challenge by
                                                                          relying on the adaptations and genetic diversity they accumulated
The Western honey bee, Apis mellifera L., plays an important role,        over their evolutionary history. Honey bee subspecies perform
together with other pollinators, in the pollination of wild and           differently in different environments and some locally adapted
cultivated plants. Likewise, honey bees have significant economic         populations may display greater resistance to anthropogenic
importance due to their production of honey and other products            threats (Büchler et al., 2014). Hence, research on honey bee
(Morse, 1991; Breeze et al., 2011). In addition to their ecological       genetic diversity at the individual, colony, population, ecotype,
and economic importance, honey bees serve as model organisms              and subspecies level is of great importance for safeguarding the
for the study of fundamental questions on sociality and on                species, the ecosystem, and the economic services they provide.
cognition (Weinstock et al., 2006).                                           Recent research conducted on European honey bee population
   The natural distribution of A. mellifera includes Central              structure has shown that past distribution patterns have been
and Southwest Asia, Europe, and Africa but the species was                disturbed (Dall’Olio et al., 2007; Bouga et al., 2011; Cánovas et al.,
also introduced to East and Southeast Asia, Australia, and the            2011). In Africa, introgression of non-native DNA was detected
Americas, mainly for its economic benefits (Ruttner, 1988).               in wild populations of Sudan (El-Niweiri and Moritz, 2010). The
Morphological and molecular studies point to four major                   causes for these disturbances have been attributed mainly to
lineages of numerous—more than 20—subspecies (Ruttner, 1988;              queen and colony trade, replacement of native honey bees with
Whitfield et al., 2006). The four widely recognized lineages are          non-natives as well as migratory beekeeping. However, there are
A (Africa), M (western and northern Europe), O (Near East and             very few studies on the direct genetic consequences of human
Central Asia), and C (Eastern Europe) lineages.                           practices on honey bee diversity.
   In the past decade, various molecular-based studies have                   Turkey has five subspecies of honey bees within its borders and
garnered support for the hypothesis that A. mellifera originated          beekeepers practice a variety of strategies, thus it provides an ideal
in the African tropics or subtropics and colonized its present            environment to test the impact of anthropogenic factors on one
European range by two main routes: through the strait of                  of the most important pollinators of crops and wild plants.
Gibraltar and through the Suez and then Bosporus regions, with                Beekeeping in the region of Anatolia is a practice dating back
a subsequent contact between the highly divergent M and C                 to 6600 BC when the Hittite civilization presided over this region
lineages in the region surrounding the Alps (Whitfield et al.,            (Akkaya and Alkan, 2007). Beekeeping has been persevered and
2006; Han et al., 2012; Harpur et al., 2014; Wallberg et al., 2014;       continues to be intensively practiced in Turkey where there are
Cridland et al., 2017).                                                   more than eight million hives distributed throughout the country.
   Honey bees and wild pollinators are experiencing a worldwide           This is the third-highest number of hives in a single country. It is
decline due to factors closely related to human activities. Levels        three times higher than the number of hives in the United States
of decline vary and are related to species and geographic region.         and reaches half of the EU countries total (European Parliament,
Some of the anthropogenic factors implicated in the decline are           2017; USDA NASS, 2019).
the destruction and fragmentation of natural habitats, toxicity               As a reflection of the long association of the genus Apis with
caused by pollution and pesticides—such as the widely used                the region of Anatolia, one-fourth to one-fifth of the recognized
neonicotinoids—and diseases. The latter is being facilitated by the       subspecies of A. mellifera, namely, A. m. meda, A. m. syriaca,
spread of invasive species (Meffe, 1998; Brown and Paxton, 2009;          A. m. caucasica, and A. m. anatoliaca from the O-lineage and an
Van Engelsdorp and Meixner, 2010; Blacquiere et al., 2012). Wild          ecotype from the C subspecies group occur in Turkey (Kandemir
populations of honey bee species including feral populations in           et al., 2005). In addition, A-lineage genetic material was also
the genus Apis also have been negatively affected, namely, Apis           detected in native bees from the Levantine coast of Turkey
cerana, Apis florea, Apis dorsata, and other native bees of Asia          (Kandemir et al., 2006) bringing together genetic elements from
(Oldroyd, 2007; Dietemann et al., 2009; Van Engelsdorp et al.,            three continents, Africa, Europe, and Asia. The major subspecies
2009; Genersch, 2010; Evans and Schwarz, 2011).                           found in and around Anatolia are shown in Figure 1A.
   In addition, native honey bees are experiencing local                      Together, Anatolia and Thrace harbor a vast diversity of honey
losses, extinction, and/or genetic swamping as a result of                bees belonging to three different lineages. In this region, they
genetic admixture due to bee trade, including the replacement             meet, exchange genes, and adapt to local conditions determined
of local bees with non-native strains and the beekeeping                  by local diverse climatic, topographical, and floristic variations
practice of moving colonies between geographic areas                      (Bouga et al., 2011). The refugial status of Anatolia during the ice
(De la Rúa et al., 2009).                                                 ages contributed to the enhanced levels of the present floral and
   The above genetic and environmental factors, and their                 faunal biodiversity (Hewitt, 1999). Studies of Turkish honey bee
interaction, have a cumulative adverse effect on honey bees and           populations (Bodur et al., 2007; Kence et al., 2009) demonstrated
likely contribute to continuous or discrete events of sudden              high genetic structuring and confirmed the presence of divergent
colony losses. This Colony Collapse Disorder (CCD) or Colony              populations pointing to different subspecies. These researchers
Depopulation Syndrome (CDS) (Van Engelsdorp et al., 2009;                 pointed to the rich diversity of honey bee populations in Anatolia
Neumann and Carreck, 2010) as it is referred to, is characterized         and Thrace, and highlighted that they are under threat and that
by rapid depletion of worker bees while the queen continues               there is an urgent need to take steps for their conservation.
egg laying and is accompanied by a lack of dead bees in and                   However, despite the above research, arguments prevail in the
around the hive.                                                          beekeeping environment that locally adapted honey bee ecotypes

Frontiers in Ecology and Evolution | www.frontiersin.org              2                                        April 2021 | Volume 9 | Article 556816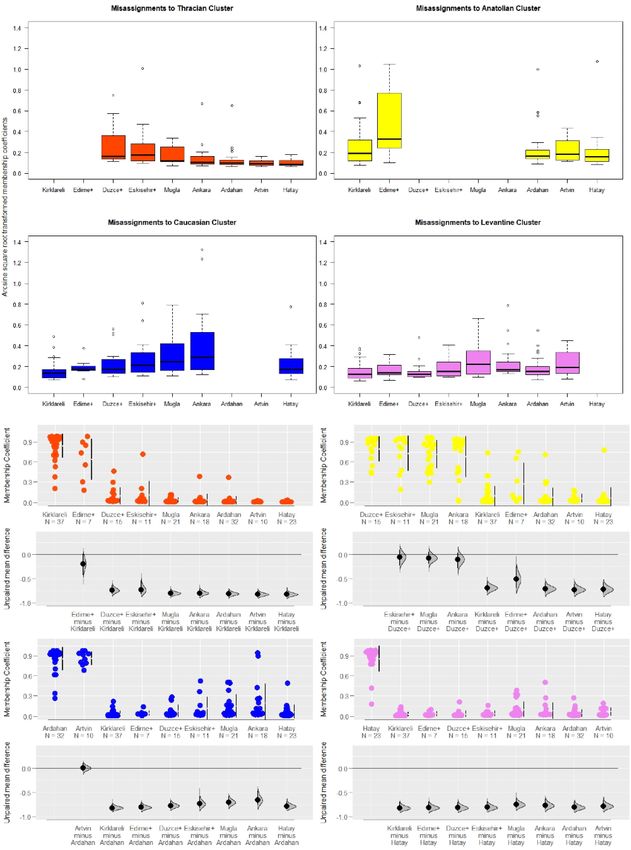
Kükrer et al.                                                                                                          Anthropogenic Factors and Honeybee Diversity

  FIGURE 1 | Geographic distribution of (A) major honey bee (A. mellifera) subspecies in and around Anatolia (B) sampling sites and sample sizes.

have been irrevocably lost, due to gene flow, and thus steps                          compared patterns of genetic diversity of honey bees between
to safeguard locally adapted honey bee variants do not have                           migratory and stationary colonies; and (iii) determined the
merit. This argument is further strengthened since queen bee                          degree, origin, and direction of introgression in the Turkish
trade is not currently subject to any restrictions or regulations                     honey bee populations to assess the consequences of unregulated
in Turkey. There are few pioneering measures of conservation                          queen and colony trade.
within the natural distribution range of the subspecies, likely
not enough to guarantee the preservation of genetic structure in
the next decades.                                                                     MATERIALS AND METHODS
   The aim of this study is to investigate the impact of
anthropogenic factors and conservation efforts on the current                         Sampling
pattern of genetic diversity of honey bee populations in Turkey.                      We sampled a single honey bee each from 250 colonies located in
Should genetic structure be identified, this could inform policies.                   18 Turkish provinces during the period of March 2010 through
Conservation measures could avoid extinction of native races,                         August 2012. Of the 250 honey bees sampled, 174 were from
ecotypes, and diversity to be found in these populations.                             stationary and 76 from migratory colonies. Beekeepers who
Genetic similarity of donor and recipient populations may be                          participated in this study declared that they used honey bees from
considered in recommending migration routes for migratory                             stocks native to their area and that they had not purchased non-
beekeepers and bee sales.                                                             native queens or colonies in the last 10 years. Honey bee samples
   The research herein tested hypotheses regarding the                                were stored at −80◦ C prior to genetic analysis.
occurrence of recent admixture in Turkish honey bee populations                          We grouped samples from provinces with small sample
across the subspecies of A. m. syriaca, A. m. caucasica, A. m.                        sizes with nearby provinces to form 10 major localities:
anatoliaca, and the C-lineage ecotype in Thrace using 30                              (1) Kırklareli; (2) Edirne + (Edirne and Tekirdağ); (3)
microsatellite markers. In addition, we: (i) investigated the                         Muğla; (4) Eskişehir + (Eskişehir, Kütahya, and Bilecik); (5)
robustness of genetic diversity of honey bees in geographic areas                     Düzce + (Düzce, Zonguldak, and Bolu); (6) Ankara; (7) Hatay;
where migratory beekeeping is restricted for varied reasons; (ii)                     (8) Bitlis + (Bitlis, Elazığ, Erzurum, and Ordu); (9) Ardahan;

Frontiers in Ecology and Evolution | www.frontiersin.org                          3                                              April 2021 | Volume 9 | Article 556816
Kükrer et al.                                                                                             Anthropogenic Factors and Honeybee Diversity

and (10) Artvin. The localities sampled correspond to the                     Statistical Analyses
natural distribution range of the five subspecies that occur in               To test the hypotheses regarding beekeeping practices,
Turkey: A. m. syriaca in Hatay, A. m. caucasica in Ardahan                    conservation sites, and queen/colony trade, we used membership
and Artvin, A. m. anatoliaca in Düzce, Eskişehir +, Muğla, and              coefficients. We first applied the arcsine square-root (angular)
Ankara from the O lineage as well as the ecotype from the C                   transformation to the coefficients since the data were composed
subspecies group that occurs in Kırklareli and Edirne + and                   of proportions and not normally distributed (Rohlf and Sokal,
A. m. meda. Geographic locations were considered based on                     1995). Then we performed Shapiro, Mann–Whitney U, Kruskal–
geographical proximity, and similarities in climate, topography,              Wallis, Dunn’s, F, ANOVA, Tukey’s, and t-tests wherever
and floral profiles as well as preliminary data from previous                 necessary and applicable to compare mean membership
studies. Sampling sites and sample sizes are listed in Figure 1B.             coefficients and estimated Cohen’s d to determine effect sizes.
                                                                              The above tests were carried out with R statistical software using
Genotyping                                                                    packages pwr, effsize, dunn.test, and dabestr (R Core Team,
We isolated DNA from bee heads using the DNeasy Blood                         2013; Torchiano, 2016; Dinno, 2017; Champely et al., 2018; Ho
and Tissue Kit (Qiagen, Ankara) following the manufacturer’s                  et al., 2019). The associated code is provided as Supplementary
instructions, with slight modifications for insect samples. For               Material (R code).
polymerase chain reactions (PCR), we grouped a set of 30                          Estimation plots were used to visualize untransformed data for
microsatellite loci into four clusters for two 7-plex (set 1: AP218,          membership coefficients and the impact of experimental factors.
A113, AB024, AP249, A088, AP001, AP043; set 2: AP049, AP238,                  This is a less conventional method than bar or boxplots and the
AC006, AP243, AP288, HBC1602, A107) and two 8-plex (set 3:                    reporting of significance tests but more convenient and powerful
A079, AC306, AP226, A007, HBC1601, AP068, A014, AP223; set                    to summarize all the data in an unbiased manner by displaying all
4: AP019, AB124, A043, A076, AP273, AP289, HBC1605, A028)                     measurements and effect sizes as well as the precision of estimates
(Estoup et al., 1995; Solignac et al., 2003; Bodur et al., 2007; Shaibi       and distribution of mean differences (Ho et al., 2019).
et al., 2008; Tunca, 2009). The program, Multiplex Manager 1.2
(Holleley and Geerts, 2009) was used to determine the multiplex
                                                                              Beekeeping Practice: Migratory vs.
groups. Information on primer pairs, fluorescent dyes, and PCR
conditions are provided in Supplementary Tables 1, 2.                         Stationary
   The microsatellite allele sizes were determined by capillary               To test the hypothesis of whether beekeeping practice affects
electrophoresis with the ABI 3730XL sequencing machine                        population structure and subspecies identity, we compared
(Applied Biosystems, Foster City CA). Locus A076 did not                      membership coefficients of migratory and stationary colonies in
consistently amplify across samples; thus, it was excluded from               Ankara, Muğla, and Hatay separately, combined, and for the
the data and the downstream analysis.                                         total data set. We propose that if migratory colonies acted as
                                                                              a potential vector of foreign honey bee alleles, then samples
Population Structure                                                          would have much lower probabilities of being assigned to the
We calculated pairwise FST values using Arlequin 3.5 (Excoffier               clusters of origin.
and Lischer, 2010); the Mantel test with 10,000 permutations was                 We used all samples (N = 250) to quantify the differences in
used to test for isolation by distance. Pairwise population                   membership coefficients for migratory and stationary colonies.
distances were calculated (Reynolds et al., 1983) using                       For the remaining analysis, we used a subset of the samples
Populations 1.2.32 software (Langella, 2011) and visualized                   from stationary colonies (n = 174) since this can give a better
with the online tool Interactive Tree of Life v4 (Letunic and                 perspective of the population structure.
Bork, 2019). We used PAST4 and PCAgen software to plot
relationships of populations on a two-dimensional space using                 Isolated Regions as Conservation Sites
a correlation matrix between groups (Goudet, 1999; Hammer                     If isolated regions preserve genetic diversity by preventing gene
et al., 2001).                                                                flow, we predict higher membership coefficients for samples that
    Population structure was estimated by Structure 2.3.3                     originate from isolated regions compared with those from regions
(Pritchard et al., 2000), K-values of distinct populations were               exposed to migratory beekeeping.
analyzed by Structure Harvester software (Earl and von Holdt,                     Kırklareli is officially declared as an isolated region. This
2012), and we used the Clumpp software (Jakobsson and                         is due to local beekeepers’ long-standing negative attitude and
Rosenberg, 2007) to permute the membership coefficients of                    resistance to migratory beekeepers. As a result, they have not
individuals determined by Structure 2.3.3 and Distruct software               accessed this region for many years. This region is home
(Rosenberg, 2004) to visualize the results obtained by Clumpp.                to a C-lineage honey bee ecotype, carefully maintained by
    Other population genetic parameters and diversity indicators              local beekeepers. Ardahan is legally declared as a conservation
were calculated and include the frequency of null alleles, allelic            and breeding area for A. m. caucasica, therefore migratory
richness and diversities, inbreeding and prevalence of close                  beekeepers cannot enter the province, and queen import from
relatives, number of effective alleles, levels of heterozygosity,             other subspecies is forbidden. Parts of Artvin province are also
deviations from Hardy–Weinberg, linkage disequilibrium,                       officially declared as isolated regions for the conservation of
bottlenecks, effective population sizes, and microsatellite                   A. m. caucasica as a pure race. The province, in general, is rarely
information index (Supplementary Tables 3–10).                                visited by migratory beekeepers because of the difficulties in

Frontiers in Ecology and Evolution | www.frontiersin.org                  4                                       April 2021 | Volume 9 | Article 556816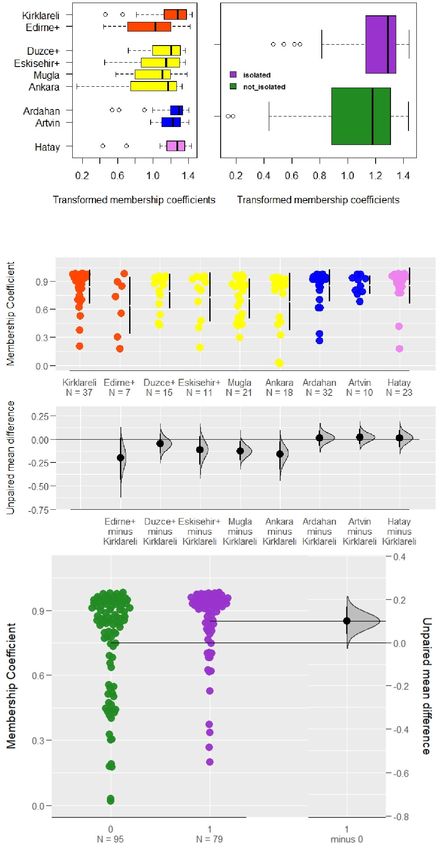
Kükrer et al. Anthropogenic Factors and Honeybee Diversity
transportation in the rough terrain. Moreover, local beekeepers
often engage in commercial queen sales so, they only use
native-bred queens. We compared the above three provinces
with restricted inflow of migratory beekeepers with the other
six regions (Edirne +, Muğla, Düzce +, Eskişehir +, Ankara,
and Hatay) where migratory beekeeping and bee trade are
freely exercised.
Effect of Queen and Colony Trade
Using all samples, we compared membership coefficients in non-
native clusters between each other to determine which groups
contributed most to other populations’ gene pools.
Ardahan and Artvin provinces host the A. m. caucasica
subspecies, which is widely used for commercial purposes. A. m.
caucasica queens and their hybrids are sold throughout Turkey.
However, these provinces are limited to a very narrow range
in the Northeast of the country and are declared isolated
regions. Therefore, a high introgression of caucasica alleles from
these regions would mostly, if not completely, be due to the
replacement of queens and colonies.
We also tested for the presence of other genetic patterns
within the Turkish honey bee population to understand the
magnitude and direction of gene flow within and across the
sampled localities.
RESULTS
Population Genetic Structure
We calculated FST values by using the frequencies obtained
in the study and the null allele corrected frequencies. We
calculated an FST of 0.065 for all samples and an FST of
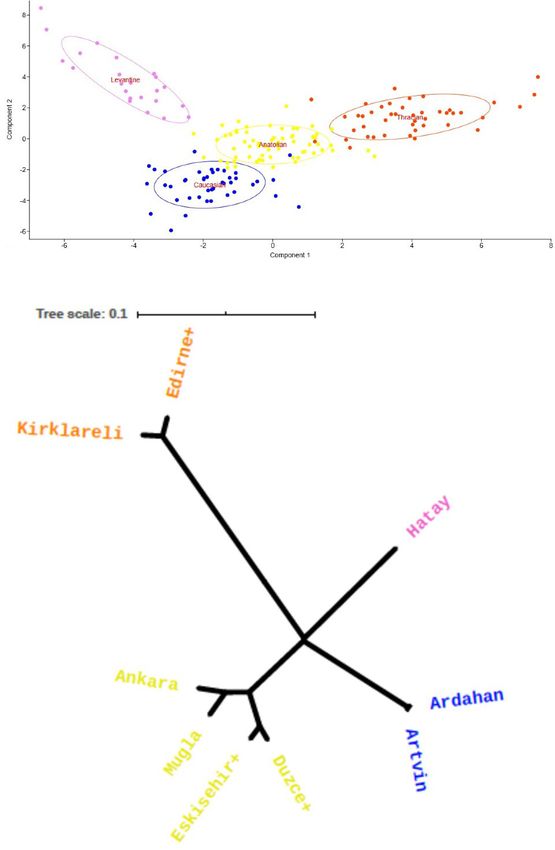
FIGURE 2 | (A) Principal component analysis (PCA) of stationary colonies with
0.067 after correction for the stationary colonies (n = 174).
66% concentration ellipses shown. Component 1 and Component 2 explain
The FST values for migratory colonies were 0.011 and 0.015, 41.8 and 32.1% of the variance within the samples, respectively. The first axis
respectively, and for all the 250 samples, they were 0.046 and differentiated samples in Thrace indicating strong divergence between those
0.047. We plotted stationary colonies on 2D space by carrying and others whereas the second axis differentiated subspecies throughout
out the principal component analysis (PCA) (Figure 2A). Anatolia. Each dot represents an individual (orange: C-lineage subspecies in
Thrace; O-lineage subspecies: yellow: anatoliaca, blue: caucasica, violet:
The x and y axes explained, respectively, 41.8 and 32.1% syriaca). (B) UPGMA tree of honey bee populations based on Reynolds, Weir,
of the variance within the samples. For stationary colonies, and Cockerham’s genetic distances. Tree resolves four distinct branches
the phylogenetic tree constructed using pairwise population corresponding to four subspecies. Thracian populations constitute the
distances resolved four distinct branches (Figure 2B). Using extreme end of the unrooted tree. The other end is divided into three almost
the Structure Harvester clustering program, we determined that equidistant branches of Caucasian, Levantine, and Anatolian populations.
K = 2 and K = 4 gave similar outcomes with the latter being
more likely as this mirrors the number of subspecies present in
the regions sampled.
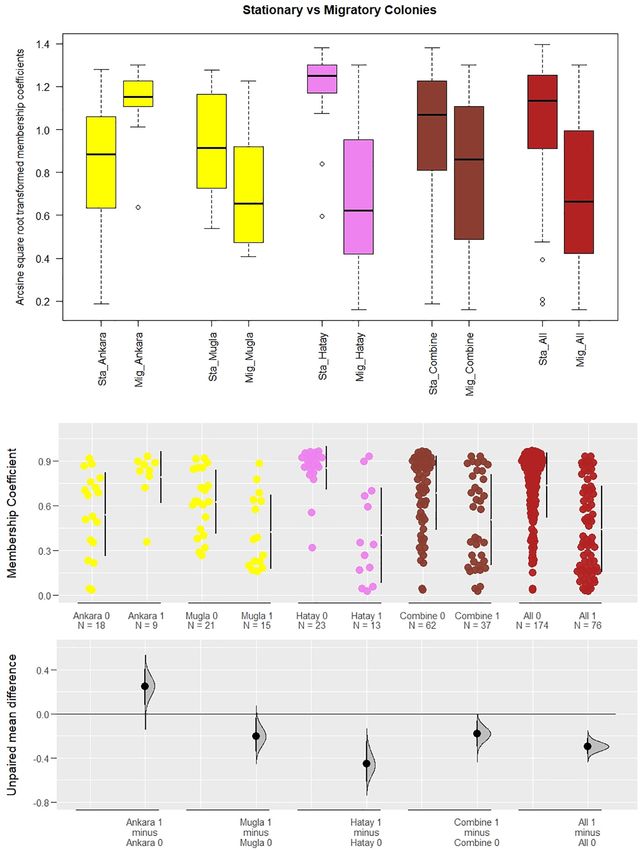
A significant difference was detected in a comparison of
We calculated membership coefficients of individuals to the
membership coefficients of individuals from stationary and
observed clusters in K = 4 and found no population structure
migratory colonies (Figure 4A). Stationary colonies from Muğla
for migratory colonies (Figure 3A) in contrast to samples from
and Hatay had a higher likelihood to be assigned to their own
stationary colonies and the entire data set (Figures 3B,C).
clusters than migratory colonies sampled from these provinces
(p < 0.05 and p < 0.001, respectively, Mann–Whitney U and
Effects of Beekeeping Practices and t-tests). The same pattern was observed when the combined
Conservation data from the three provinces (p < 0.01), or all the migratory
Results from the Mantel test showed a significant correlation with and stationary colonies (p < 0.001) were considered. However,
geographic distance between populations (r = 0.60, p < 0.01) the situation was reversed in Ankara (p < 0.05). In all the
for stationary but not migratory colonies. Distance matrices comparisons but one, 95% CI of the mean differences between the
and test results are provided in Supplementary Tables 11, 12. membership coefficients of migratory and stationary colonies lie
Frontiers in Ecology and Evolution | www.frontiersin.org 5 April 2021 | Volume 9 | Article 556816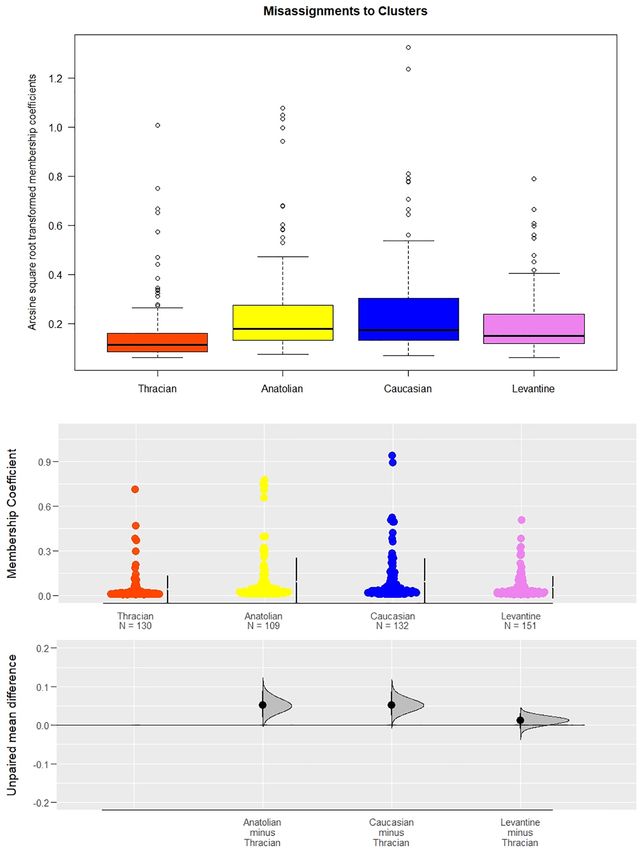
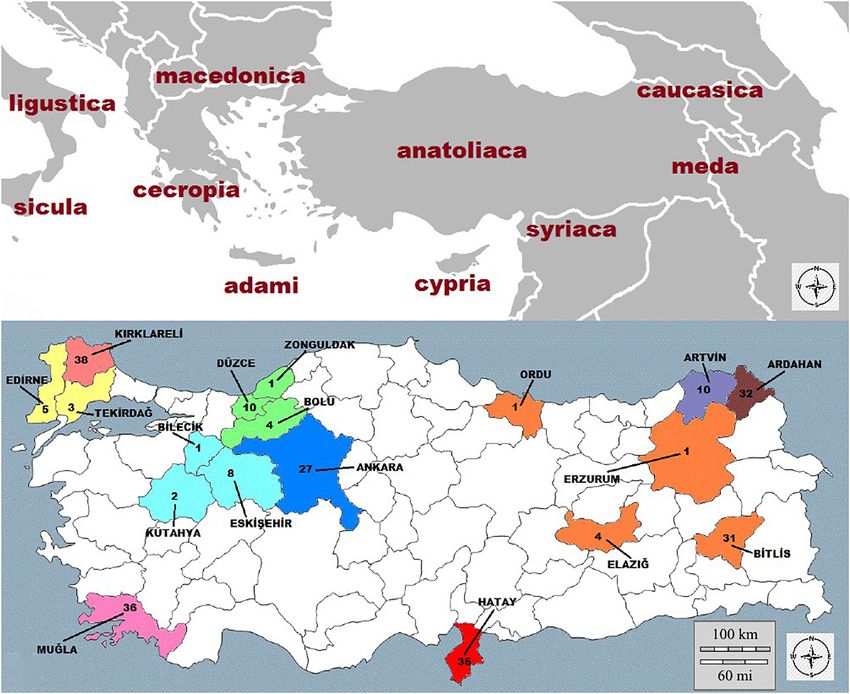
Kükrer et al.                                                                                                                Anthropogenic Factors and Honeybee Diversity

  FIGURE 3 | Estimated population structure and clustering of honeybees in Anatolia and Thrace for (A) migratory colonies, (B) stationary colonies, and (C) the whole
  sample. Structure analysis is based on microsatellite data and suppose either K = 2 (orange: C-lineage, blue: O-lineage) or K = 4 (orange: Thracian, yellow:
  Anatolian, blue: Caucasian, violet: Levantine) hypothetical populations. Each individual is represented by a vertical bar and colored according to membership
  coefficients belonging to each cluster. K = 2 is found to be slightly likelier than K = 4. For stationary colonies at K = 2, the transition from C-lineage to O-lineage is
  gradual. No population structure is observed in migratory colonies in contrast to stationary ones and the overall data where four different subspecies are evident.
  Note the higher admixture levels in the overall data in comparison to stationary colonies.

below the zero-line (Figure 4B). The mean values, effect size, and                        are lower and fall beyond the 95% confidence interval of the
significance level of the differences are summarized in Table 1.                          estimated mean of the difference between the two groups. In
   The comparison of isolated regions with those open to                                  addition, despite the lack of conservation efforts, samples from
migratory beekeeping (Table 1 and Figure 5A) showed that                                  Hatay and Düzce + showed membership coefficients comparable
stationary colonies within isolated regions have significantly                            with those of Kırklareli, Ardahan, and Artvin (Figure 5B).
higher fidelity to their original clusters (p < 0.001, Mann–
Whitney U and t-tests). This can also be seen in the estimation                           Impact of Queen and Colony Trade
plot (Figure 5C) where the mean membership coefficients of                                If an individual is assigned with high probability to its own
samples that are from regions open to migratory beekeeping                                cluster, i.e., 90% probability, there remains a 10% chance that

Frontiers in Ecology and Evolution | www.frontiersin.org                              6                                                April 2021 | Volume 9 | Article 556816
Kükrer et al.                                                                                                                 Anthropogenic Factors and Honeybee Diversity

  FIGURE 4 | Comparison between stationary (Sta_) and migratory (Mig_) colonies in Ankara (p < 0.05), Muğla (p < 0.05), and Hatay (p < 0.001), as well as these
  three provinces combined (p < 0.01) and the whole data set (p < 0.001). (A) Boxplot display of arcsine square-root transformed membership coefficients used in
  significance testing of comparisons. (B) Scatter plot with estimations of mean differences based on raw individual membership coefficients (yellow: Ankara and
  Muğla belonging to the Anatolian cluster, violet: Levantine cluster, coral: for a combination of three provinces, firebrick: whole data). Stationary colonies are annotated
  as < Group name > 0 and migratory colonies as < Group name > 1. Bars right to the data points refer to the 25 and 75% quartiles and the gap between them is
  the median value for the sample. The zero-line below corresponds to the mean membership coefficients of stationary colonies in each pairwise comparison. The
  Euclidean distances from those means for the migratory colonies are shown as dots with a 95% confidence interval bar around. Also, distributions of the estimation
  statistics are included to comprehensively compare the strength of the drift for different populations and subsets of the data. Stationary colonies exhibit higher mean
  membership coefficients than migratory ones except for Ankara where the vice versa is true.

it can be assigned to other clusters. Given four clusters, we                              (p < 0.001) followed by a Tukey’s test, showed that mis-
investigated whether these mis-assignment probabilities were                               assignments to A. m. caucasica and A. m. anatoliaca clusters
enriched for any particular cluster. The mean transformed                                  were significantly more frequent than to the other subspecies
values of cluster mis-assignments among individuals of other                               (p < 0.001 for both subspecies against C-lineage Thracian bees
populations were as follows: Thracian 0.16, Anatolian 0.25,                                and p < 0.05 against syriaca group). The effect sizes according
Caucasian 0.26, and Levantine 0.20 (Figure 6A).                                            to Cohen’s d varied from 0.34 to 0.54 with estimation plots
   A significant Kruskal–Wallis test (p < 0.001) and a post hoc                            verifying the precision of the difference observed (Figure 6B).
Dunn’s test, accompanied by a significant ANOVA result                                     Despite the observation of the highest values in A. m. caucasica

Frontiers in Ecology and Evolution | www.frontiersin.org                               7                                                April 2021 | Volume 9 | Article 556816
Kükrer et al.                                                                                                         Anthropogenic Factors and Honeybee Diversity

TABLE 1 | Genetic impact of beekeeping and conservation practices on (arcsine square-root transformed) membership coefficients to native clusters (*p < 0.05,
**p < 0.01, and ***p < 0.001).

                        n Migratory             n Stationary           Stationary             Migratory            Cohen’s d              U and t-test significance

Beekeeping practice
Ankara                        9                       18                  0.82                   1.11                −1.00                             *
Muğla                       15                       21                  0.93                   0.70                  0.89                            *
Hatay                        13                       23                  1.20                   0.66                  2.01                           ***
Combined                     37                       62                  1.00                   0.79                  0.66                           **
Overall                      76                      174                  1.06                   0.72                  1.22                           ***
Conservation practice
Isolated                     NA                       79                  1.21                   NA                    0.49                           ***
Not-isolated                 NA                       95                  1.08                   NA

mis-assignments, the results between A. m. caucasica and A. m.                       together with higher values for pairwise comparisons among
anatoliaca clusters were not significant. We tested whether these                    populations. This may indicate recent increased gene flow and
differences were due to many individuals with high admixture                         may signal an alarming trend toward greater movement of honey
levels, but such data only constituted 7.5% of all the observations.                 bees in the regions sampled. Long-term studies are needed to
This figure is obtained by a threshold of 0.5 for the transformed                    determine if this is a persistent trend.
values, which corresponds to a second hybrid, implying a 25%
contribution of non-native origin.                                                   Structure of Bee Populations in Turkey
   We also investigated if these small drifts in admixture                           PCA results confirmed the four different clusters inferred from
proportions were more prominent in some localities and if                            the UPGMA tree topology (Figure 2). The first axis designating
populations differed as to the identity of the subspecies from                       the first principle component differentiated Thracian samples,
which they receive gene flow. This led us to learn the extent,                       whereas the second axis, corresponding to the second component
magnitude, and direction of gene flow among the subspecies with                      differentiated subspecies in Anatolia (syriaca, anatoliaca, and
a particular sensitivity to specific populations (Figure 7). Results                 caucasica). Bitlis + samples clustered with Central and West
of Dunn’s test for each pairwise comparison between populations                      Anatolian populations in both phylogenetic tree and PCA results
are in Supplementary Tables 13–16 (12 significant differences                        (Supplementary Figures 1, 3, 4). However, all samples from
out of 80 comparisons in total).                                                     this locality were from migratory colonies thus resampling this
                                                                                     area with the inclusion of stationary colonies from East Anatolia
                                                                                     would render a clearer picture of the phylogenetic relationship of
DISCUSSION                                                                           these populations.
Given the promiscuous nature of the honey bee mating system, it                         The two most likely K-values in structure analysis for all
has been suggested that large-scale migratory beekeeping and bee                     samples and the stationary colonies were K = 2 and K = 4,
trade have exposed local populations to introgression (De la Rúa                     both results support the hypotheses of the sampled populations
et al., 2009). Although there is evidence that management actually                   belonging to two separate lineages (C and O) in line with
increased genetic diversity (Harpur et al., 2012), admixture can                     (Kandemir et al., 2005) and four distinct subspecies (a Carniolan
also drive the loss of valuable local adaptations (De la Rúa et al.,                 ecotype in Thrace, A. m. caucasica in Artvin and Ardahan,
2013). Since the global environment alters with an increasing                        A. m. syriaca in Hatay and A. m. anatoliaca, widely distributed,
pace, honey bees face new challenges in which they need to rely                      covering the rest of the country) (Figure 3). In contrast to the
on adaptations and genetic diversity they accumulated over the                       belief that migratory beekeepers make use of native stocks for
course of their evolutionary history (Kükrer and Bilgin, 2020).                      their operations, our results showed the absence of structuring in
    The main finding of this study is that there are distinct                        these samples, and support the conclusion that migratory apiaries
populations of subspecies of bees, isolated by distance, yet                         are highly hybridized.
migratory colonies and bee trade likely cause gene flow across
these populations in Turkey. The differences in FST values                           Distinct Phylogeographic Patterns in
between stationary and migratory colonies indicate that the latter,                  Stationary Bees
with lower FST values, experience a high degree of gene flow. This                   Stationary apiaries, as expected, yielded highly structured groups
conclusion is also reflected by the absence of positive correlation                  where all the subspecies could be detected. When K was 2,
between genetic and geographic distances in migratory colonies                       the structure analysis of two distinct clusters showed that there
in contrast to stationary colonies where an isolation by distance                    was a transition zone between Thracian and Anatolian samples
pattern was observed (Supplementary Tables 11, 12). Overall,                         around the Marmara Sea and Aegean. Ruttner’s analysis based
FST values obtained were highly significant but lower than those                     on morphometry (1988) distinguished bees in Western Anatolia
from Bodur et al. (2007), estimated for samples collected 10 years                   from the rest of the anatoliaca group. Contributions from
prior to the study herein, that showed total levels of FST of 0.077                  the Thracian cluster are significantly high in Düzce + and

Frontiers in Ecology and Evolution | www.frontiersin.org                         8                                             April 2021 | Volume 9 | Article 556816
Kükrer et al. Anthropogenic Factors and Honeybee Diversity
Eskişehir + located southeast of the Sea of Marmara across the
Bosporus. Also, there are some non-significant overabundant
Thracian contributions in Muğla province on the Aegean coast
(Figure 3). This may constitute a hybrid zone between the C
and O lineages and resemble the hybrid zones identified between
M and C lineages in the Alps and the Apennine Peninsula
and between A and M lineages in the Iberian Peninsula and
Mediterranean islands (De la Rúa et al., 2009). An expected
symmetrical introgression might be the reason behind the East–
West cline observed by Muñoz and De la Rúa (2020) in four
distinct ecotypes of A. m. carnica and A. m. macedonica in the
Balkan Peninsula.
When K was considered as 4, all four subspecies were easily
differentiated from each other. The significance of two distinct
clusters (K = 2) was higher than four (K = 4) indicating the
evolutionarily greater differences between the lineages belonging
to C (in Thrace) and O (in Anatolia).
Thracian samples form a clade in the unrooted phylogenetic
tree while the other three populations, Caucasian, Levantine, and
Anatolian are equidistant from each other and form a separate
clade. These results indicate that the Thracian population is
distinct from the others and likely has experienced limited gene
flow in allopatry, supporting the hypothesis for a Carniolan
(C-lineage) descent of Thracian bees in Turkey. A direct
comparison with honey bee samples of the major C-lineage
subspecies would confirm the subspecies of these bees which
are highly differentiated from Anatolian samples. This finding is
in contrast to the conclusions of Ruttner (1988) that Thracian
bees are part of the anatoliaca subspecies groups and merits
further investigation.
A. m. anatoliaca samples formed a distinct cluster in structure
analysis, yet fell in the middle of the other subspecies in
ordinations according to FST values. This similarity may point
to a significant historical contribution to A. m. anatoliaca
populations from the neighboring regions. Another explanation
is that the putative basal position of anatoliaca for O-lineage
honey bees places this group at the center of genetic diversity.
In contrast to anatoliaca bees forming a distinct group, all-
migratory Bitlis + samples were a mixture of different clusters
FIGURE 5 | Samples within isolated regions assigned to their clusters with and did not form a separate group.
higher probabilities in contrast to samples from regions open to migratory A greater understanding of phylogenetic relationships of the
beekeeping. (A) The first boxplot displays the arcsine square-root transformed
populations of bees in Turkey can be achieved only if neighboring
membership coefficients for nine populations, whereas the second one
presents a comparison of samples within isolated regions and those are not populations in the Balkans, Iran, Caucasus, and Southwest Asia
(p < 0.001). (B) Scatter plot based on a comparison of raw individual are also sampled. This future research direction may clarify the
membership coefficients to their native clusters for nine populations against complex taxonomic relations within and between the C and O
Thracian samples. Bars right to the data points refer to the 25 and 75% lineages, and delimit distributions and transition zones of the
quartiles and the gap between them is the median value for the sample. Note
that despite lacking a conservation status, samples from Hatay and
subspecies in this region.
Düzce + have membership coefficients comparable to those of Kırklareli,
Ardahan, and Artvin which are isolated regions. (C) Scatter plot contrasting
individual raw membership coefficients with an estimation of the mean Homogenizing Effect of Migratory
difference between isolated regions and those are not (orange: Thracian, Beekeeping
yellow: Anatolian, blue: Caucasian, violet: Levantine clusters; orchid and “1”:
isolated regions, green and “0”: regions open to migratory beekeeping). The
Migratory colonies are acting as a hybrid zone mobile in space
zero-line corresponds to the mean membership coefficient of colonies in and time. The colonies are in one region in spring and in others in
regions open to migratory beekeeping. The Euclidean distance of the colonies summer and fall. As such, these bees serve as vectors of otherwise
in isolated regions from that mean is shown as a dot with a 95% confidence local gene combinations. Statistical comparison of migratory and
interval bar around. The distribution of the estimation statistic is included to
stationary colonies confirms the significant gene flow toward the
account for the precision.
migrants from local bees (Figure 4). Likewise, a significant gene
Frontiers in Ecology and Evolution | www.frontiersin.org 9 April 2021 | Volume 9 | Article 556816Kükrer et al. Anthropogenic Factors and Honeybee Diversity
FIGURE 6 | Mis-assignment of individuals to caucasica and anatoliaca clusters were significantly more frequent than the others (p < 0.001 for both subspecies
against C-lineage Thracian bees and p < 0.05 against syriaca group). (A) Boxplot display of arcsine square-root transformed membership coefficients mis-assigned
to each cluster. (B) Scatter plot with estimations of mean differences against Thracian mis-assignments based on raw individual membership coefficients (orange:
C-lineage Thracian cluster, yellow: anatoliaca, blue: caucasica, violet: syriaca). Bars right to the data points refer to the 25 and 75% quartiles and the gap between
them is the median value.
flow toward local stationary bees was also observed outside the to use queen bees native to the region. The second factor
conservation sites. These results, derived from direct comparison is that this region is a principal queen breeding area. The
of two distinct contrasts, demonstrate the vitality of establishing Kazan apiary of TKV (Development Foundation of Turkey)
areas away from migratory beekeeping for the preservation of uses hundreds of colonies of Caucasian bees and raised
honey bee genetic diversity. This conclusion is in agreement with queens are sold around the country for over 30 years.
other studies on conservation practices (Oleksa et al., 2011; Pinto Many independent queen bee breeders in the Kazan region
et al., 2014). continue the same practice. Gene flow from these queen
An exception that proves the point is the lower assignment breeders’ apiaries may contribute to the admixture observed
probability of bees sampled from Ankara to their province, in stationary colonies in Ankara. The high mis-assignment
even in comparison to migratory bees in the same location. probability of colonies in Ankara to the Caucasian cluster
There are two factors: First, the region’s beekeepers prefer supports this hypothesis.
Frontiers in Ecology and Evolution | www.frontiersin.org 10 April 2021 | Volume 9 | Article 556816Kükrer et al. Anthropogenic Factors and Honeybee Diversity FIGURE 7 | Patterns of gene flow between populations. (A) Boxplot displays of arcsine square-root transformed membership coefficients mis-assigned to each cluster (12 significant differences out of a total of 80 comparisons are provided in the Supplementary Material). (B) Scatter plots with estimations of mean differences based on raw individual membership coefficients to each cluster (orange: Thracian, yellow: Anatolian, blue: Caucasian, violet: Levantine clusters) contrasted against Kırklareli, Düzce +, Ardahan, and Hatay populations representative of four subspecies. Bars right to the data points refer to the 25 and 75% quartiles and the gap between them is the median value. Frontiers in Ecology and Evolution | www.frontiersin.org 11 April 2021 | Volume 9 | Article 556816
Kükrer et al.                                                                                             Anthropogenic Factors and Honeybee Diversity

Direction and Magnitude of Introgression                                    A gap analysis aiming for complementarity in the planning of
Determined by Bee Trade                                                     systematic conservation efforts is urgently needed globally.
                                                                               In such isolated regions, naturally, migratory beekeeping,
It is hard to directly quantify the effect of queen and colony trade
                                                                            as well as replacement of queen bees with non-native ones,
on genetic mixing. The availability of several naturally occurring
                                                                            must be strictly prohibited and checked by relevant molecular
subspecies in Anatolia and Thrace helps in understanding the
                                                                            monitoring techniques. However, these isolated regions should
relative role of queen and colony trade in gene flow. Honey
                                                                            also be wide enough involving additional buffer zones where
bees from stationary colonies were assigned more often to their
                                                                            further restrictions on migratory beekeeping and bee trade are
native clusters, yet they were also assigned to other clusters with
                                                                            applied for efficient isolation and for fulfilling sufficient effective
lower probabilities. Samples in the whole range of the study mis-
                                                                            population sizes.
assigned to the Caucasian cluster more often than they were
                                                                               Thanks to increasing awareness in the last decade within the
mis-assigned to others (Figure 6). This is most likely due to the
                                                                            industry, now there are at least 11 isolated regions in service or
wide distribution of Caucasian queen bees by queen trade.
                                                                            being established in Turkey. These conservation sites make ideal
    Migratory beekeeping is not practiced in Ardahan and Artvin
                                                                            places for breeding purposes. The establishment of such sites is
where highly commercial Caucasian bees are native. Hence,
                                                                            achieved through the significant efforts of scientists and their
no bees go in or leave out the region as migratory colonies.
                                                                            collaboration with the Turkish Beekeepers Association (Kükrer
We infer that the observed introgression of Caucasian alleles
                                                                            and Bilgin, 2020). There is an ever-growing need for establishing
to the stationary colonies elsewhere could mainly be attributed
                                                                            closer links with decision makers and stakeholders and the
to the frequent purchase of caucasica queen bees and colony
                                                                            necessity of investing more efforts in communicating the results
replacements in neighboring apiaries within those regions.
                                                                            of scientific studies to all involved.
Practices of neighboring beekeepers become important because
even if beekeepers included in this study within a region do not
purchase caucasica queens, their colonies may be subject to queen
supersedure and natural mating in that region.                              CONCLUSION
    Central and western Anatolian populations suffer heavily from
                                                                            Overall results of this study clearly show that the genetic structure
gene flow from Caucasian populations as demonstrated by our
                                                                            of honeybee populations in Turkey is highly conserved. This,
results (Figure 7). Muğla, which receives millions of migratory
                                                                            however, does not mean that the structure and the diversity
colonies during the honeydew season, and Ankara showed high
                                                                            observed are secure. Rather the honey bee genetic diversity in
levels of significant gene flow from other subspecies, especially
                                                                            Turkey should be considered under threat. We demonstrated
the caucasica. This is especially alarming because Muğla (in the
                                                                            continued gene flow and admixing of populations, likely due to
southwest) and the Caucasus region (in the northeast) lie at the
                                                                            anthropogenic factors.
diagonal extremes of the country, some 1,500 km apart.
                                                                                The preservation of population structure despite movement of
    A. m. anatoliaca alleles also showed high introgression
                                                                            the high number of colonies and unregulated and frequent queen
especially in the Thrace region but also at average levels
                                                                            and colony sales is biologically interesting. Future research may
in other regions. These high levels may be related to the
                                                                            also need to focus on how this biodiversity and its structuring
geographical proximity of this subspecies to other populations.
                                                                            were preserved and its relation to natural selection. The relative
The proximity may explain historical and recent gene exchanges.
                                                                            effects of natural selection and gene flow should be compared; the
Alternatively, widespread practice of migratory beekeeping by
                                                                            former could significantly counterbalance the latter.
Western and Central Anatolian beekeepers throughout Turkey
                                                                                Genetic variation eventually leading to local adaptations with
may have contributed to observed introgression. In this case,
                                                                            such a significant outweighing effect can be considered as a
queen replacement could be a minor contributor since there
                                                                            valuable resource for honey bee populations in the global context
are very few commercial queen breeders within the distribution
                                                                            at this time of unusual bee losses as well as global climate
range of A. m. anatoliaca.
                                                                            change. A better understanding of present adaptation to both
                                                                            local climate and geographic conditions as well as adaptive
Conservation Sites                                                          capacity to future changes is important for bees and stakeholders.
The importance of establishing isolated regions was highlighted             A fair amount of effort should be invested in more studies
with genetic data. The results of the statistical tests showed a            focusing on candidate functional variants at the genome level that
significant difference between the conservation of identity in and          play role in due process in different parts of the world. Novel
out of isolated regions with isolated regions staying purer in terms        and innovative ways of coping with environmental and climatic
of subspecies composition (Figure 5). Such regions were proven              stressors developed by honey bee populations or exploration of
to be effective in the conservation of unique diversity present             interesting patterns of convergent evolution are waiting ahead to
within (Requier et al., 2019).                                              be yet discovered.
   In the light of this study, we propose a renewed effort to                   Our overall results are restricted to the present situation
address the need for massive establishing of such regions for               of honey bee subspecies in Turkey, yet they highlight the
conserving locally adapted native bees throughout the whole                 significance of local populations and provide a preliminary
natural distribution of the species. This especially holds for              quantification of human impact. We expect our findings on
underrepresented regions in terms of local diversity hotspots.              migratory beekeeping, trading of queens and colonies as well as

Frontiers in Ecology and Evolution | www.frontiersin.org               12                                         April 2021 | Volume 9 | Article 556816
Kükrer et al. Anthropogenic Factors and Honeybee Diversity
conservation implications to be of use for the decision makers strongly to draw the attention of researchers, decision makers,
and other stakeholders. and beekeepers to the conservation of locally adapted native bees
as a precious legacy of our kind. He will be remembered also
for defending the theory of evolution to be taught in the science
DATA AVAILABILITY STATEMENT curriculum and for training many valuable young evolutionary
biologists under very harsh conditions. He passed away on
The original contributions presented in the study are included February 1, 2014 after the completion of the study and at the very
in the article/Supplementary Material, further inquiries can be beginning of the manuscript preparation.
directed to the corresponding author/s.
AUTHOR CONTRIBUTIONS ACKNOWLEDGMENTS
We would like to thank the numerous beekeepers who provided
MKü carried out the experiments and statistical analyses and took
samples to the study and the Turkish Beekeepers Association.
the lead in writing the manuscript. AK was in charge of overall
We thank to Devrim Oskay for his contribution in the form
direction and planning. All authors conceived and planned the
of consumables. We would also like to thank Mustafa Nail
experiments and contributed to the fieldwork, contributed to
Cırık, Mehmet Ali Döke, Okan Can Arslan, Cansu Özge Tozkar,
the interpretation of the results, provided critical feedback and
Mehmet Kayım, and Eda Gazel Karakaş for the fieldwork and
helped shape the research, analysis, and manuscript.
Esin Öztürk and Ezgi Ersin as well as Batuhan Çağrı Yapan,
Ayshin Ghalici, Gizem Kars, and Batuhan Elçin for contributing
FUNDING lab sessions. We thank to Çiğdem Akın Pekşen, Cemal Can
Bilgin, Tuğrul Giray, and Felipe Soto for their advice on the
This study was funded by the Scientific and Technological manuscript. This manuscript has been released as a pre-print
Research Council of Turkey (project no: 109T547), Republic at https://www.biorxiv.org/content/10.1101/154195v2 (Kükrer
of Turkey Ministry of Agriculture and Forestry (project no: et al., 2020) and includes elements from the corresponding
TAGEM/11/AR-GE/13), and Middle East Technical University author’s thesis (Kükrer, 2013).
Revolving Funds (project no: 2007-16-12-00-3008).
SUPPLEMENTARY MATERIAL
DEDICATION
The Supplementary Material for this article can be found
This article is dedicated to the memory of the late AK who spent online at: https://www.frontiersin.org/articles/10.3389/fevo.2021.
his last 20 years studying honey bee diversity in Turkey trying 556816/full#supplementary-material
REFERENCES in Europe. J. Apicultural Res. 53, 205–214. doi: 10.3896/IBRA.1.
53.2.03
Akkaya, H., and Alkan, S. (2007). Beekeeping in Anatolia from the Hittites Cánovas, F., de la Rúa, P., Serrano, J., and Galián, J. (2011). Microsatellite variability
to the present days. J. Apicultural Res. 46, 120–124. doi: 10.3896/ibra.1.46. reveals beekeeping influences on Iberian honeybee populations. Apidologie 42,
2.10 235–251. doi: 10.1007/s13592-011-0020-1
Blacquiere, T., Smagghe, G., Van Gestel, C. A., and Mommaerts, V. (2012). Champely, S., Ekstrom, C., Dalgaard, P., Gill, J., Weibelzahl, S., Anandkumar, A.,
Neonicotinoids in bees: a review on concentrations, side-effects and et al. (2018). Package ‘pwr’. R package version, 1–2.
risk assessment. Ecotoxicology 21, 973–992. doi: 10.1007/s10646-012- Cridland, J. M., Tsutsui, N. D., and Ramírez, S. R. (2017). The complex
0863-x demographic history and evolutionary origin of the western honey
Bodur, C., Kence, M., and Kence, A. (2007). Genetic structure of honey bee, bee, Apis Mellifera. Genome Biol. Evol. 9, 457–472. doi: 10.1093/gbe/
Apis mellifera L. (Hymenoptera:apidae) populations of Turkey inferred from evx009
microsatellite analysis. J. Apicultural Res. 46, 50–56. doi: 10.1080/00218839. Dall’Olio, R., Marino, A., Lodesani, M., and Moritz, R. F. (2007). Genetic
2007.11101366 characterization of Italian honeybees, Apis mellifera ligustica, based on
Bouga, M., Alaux, C., Bienkowska, M., Buchler, R., and Carreck, N. L. microsatellite DNA polymorphisms. Apidologie 38, 207–217. doi: 10.1051/
(2011). A review of methods for discrimination of honey bee apido:2006073
populations as applied to European beekeeping. J. Apicultural Res. 50, De la Rúa, P., Jaffé, R., Dall’Olio, R., Muñoz, I., and Serrano, J. (2009). Biodiversity,
51–84. conservation and current threats to European honey bees. Apidologie 40,
Breeze, T. D., Bailey, A. P., Balcombe, K. G., and Potts, S. G. (2011). Pollination 263–284.
services in the UK: how important are honey bees? Agric. Ecosyst. Environ. 142, De la Rúa, P., Jaffé, R., Muñoz, I., Serrano, J., Moritz, R. F., and Kraus,
137–143. F. B. (2013). Conserving genetic diversity in the honeybee: comments
Brown, M. J. F., and Paxton, R. J. (2009). The conservation of bees: a global on Harpur et al. (2012). Mol. Ecol. 22, 3208–3210. doi: 10.1111/mec.
perspective. Apidologie 40, 410–416. doi: 10.1051/apido/2009019 12333
Büchler, R., Costa, C., Hatjina, F., Andonov, S., Meixner, M. D., Conte, Dietemann, V., Pirk, C. W. W., and Crewe, R. (2009). Is there a need for
Y. L., et al. (2014). The influence of genetic origin and its interaction conservation of honey bees in Africa? Apidologie 40, 285–295.
with environmental effects on the survival of Apis mellifera L. colonies Dinno, A. (2017). Package ‘dunn. test’. CRAN Repos.
Frontiers in Ecology and Evolution | www.frontiersin.org 13 April 2021 | Volume 9 | Article 556816Kükrer et al. Anthropogenic Factors and Honeybee Diversity Earl, D. A., and von Holdt, B. M. (2012). Structure Harvester: a website and evidences for the impact of anthropogenic factors on population structure. program for visualizing STRUCTURE output and implementing the Evanno bioRxiv [preprint] doi: 10.1101/154195v2 method. Conserv. Genet. Resour. 4, 359–361. doi: 10.1007/s12686-011-9548-7 Langella, O. (2011). Population Genetic Software: Individuals or Populations El-Niweiri, M. A., and Moritz, R. F. (2010). The impact of apiculture on the genetic Distances Based on Allelic Frequencies, Phylogenetic Trees, File Conversions. structure of wild honeybee populations (Apis mellifera) in Sudan. J. Insect Massachusetts, MA: Bioinformatics Organization, Inc. Conserv. 14, 115–124. doi: 10.1007/s10841-009-9231-4 Letunic, I., and Bork, P. (2019). Interactive Tree Of Life (iTOL) v4: recent updates Estoup, A., Garnery, L., Solignac, M., and Cornuet, J. M. (1995). Microsatellite and new developments. Nucleic Acids Res. 47, W256–W259. doi: 10.1093/nar/ variation in honey bee (Apis mellifera L.) populations: hierarchical genetic gkz239 structure and test of the infinite allele and stepwise mutation models. Genetics Meffe, G. K. (1998). The potential consequences of pollinator declines on the 140, 679–695. doi: 10.1093/genetics/140.2.679 conservation of biodiversity and stability of food crop yields. Conserv. Biol. 12, European Parliament (2017). The EU’s Beekeeping Sector. At a Glance. Available 8–17. doi: 10.1111/j.1523-1739.1998.97154.x online at: https://www.europarl.europa.eu/RegData/etudes/ATAG/2017/ Morse, R. A. (1991). Honey bees forever. Trends Ecol. Evol. 6, 337–338. 608786/EPRS_ATA%282017%29608786_EN.pdf (accessed April 28, 2020) Muñoz, I., and De la Rúa, P. (2020). Wide genetic diversity in Old World honey Evans, J. D., and Schwarz, R. S. (2011). Bees brought to their knees: microbes bees threaten by introgression. Apidologie 52, 200–217. doi: 10.1007/s13592- affecting honey bee health. Trends Microbiol. 19, 614–620. doi: 10.1016/j.tim. 020-00810-0 2011.09.003 Neumann, P., and Carreck, N. L. (2010). Honey bee colony losses. J. Apicultural Excoffier, L., and Lischer, H. E. L. (2010). Arlequin suite ver 3.5: a new series of Res. 49, 1–6. doi: 10.3896/ibra.1.49.1.01 programs to perform population genetics analyses under Linux and Windows. Oldroyd, B. P. (2007). What’s killing American honey bees? PLoS Biology 5:e168. Mol. Ecol. Resour. 10, 564–567. doi: 10.1111/j.1755-0998.2010.02847.x doi: 10.1371/journal.pbio.0050168 Genersch, E. (2010). Honey bee pathology: current threats to honey bees and Oleksa, A., Chybicki, I., Tofilski, A., and Burczyk, J. (2011). Nuclear and beekeeping. Appl. Microbiol. Biotechnol. 87, 87–97. doi: 10.1007/s00253-010- mitochondrial patterns of introgression into native dark bees (Apis mellifera 2573-8 mellifera) in Poland. J. Apicultural Res. 50, 116–129. doi: 10.3896/IBRA.1.50. Goudet, J. (1999). PCAGEN, A Computer Package Which Performs Principal 2.03 Component Analysis (PCA) on Gene Frequency Data. Lausanne: Université de Pinto, M. A., Henriques, D., Chávez-Galarza, J., Kryger, P., Garnery, L., van der Lausanne. Zee, R., et al. (2014). Genetic integrity of the Dark European honey bee (Apis Hammer, Ø, Harper, D. A. T., and Ryan, P. D. (2001). PAST: paleontological mellifera mellifera) from protected populations: a genome-wide assessment statistics software package for education and data analysis. Palaeontologia using SNPs and mtDNA sequence data. J. Apicultural Res. 53, 269–278. doi: Electronica 4:9. 10.3896/IBRA.1.53.2.08 Han, F., Wallberg, A., and Webster, M. T. (2012). From where did the Western Pritchard, J. K., Stephens, M., and Donnelly, P. (2000). Inference of population honeybee (Apis mellifera) originate? Ecol. Evol. 2, 1949–1957. doi: 10.1002/ structure using multilocus genotype data. Genetics 155, 945–959. ece3.312 R Core Team (2013). R: A Language and Environment for Statistical Computing. Harpur, B. A., Kent, C. F., Molodtsova, D., Lebon, J. M., Alqarni, A. S., Owayss, Vienna: R Core Team. A. A., et al. (2014). Population genomics of the honey bee reveals strong Requier, F., Garnery, L., Kohl, P. L., Njovu, H. K., Pirk, C. W., Crewe, R. M., et al. signatures of positive selection on worker traits. Proc. Natl. Acad. Sci. U.S.A. (2019). The conservation of native honey bees is crucial. Trends Ecol. Evol. 34, 111, 2614–2619. doi: 10.1073/pnas.1315506111 789–798. doi: 10.1016/j.tree.2019.04.008 Harpur, B. A., Minaei, S., Kent, C. F., and Zayed, A. (2012). Management increases Reynolds, J., Weir, B. S., and Clark Cockerham, C. (1983). Estimation of the genetic diversity of honey bees via admixture. Mol. Ecol. 21, 4414–4421. doi: coancestry coefficient: basis for a short-term genetic distance. Genetics 105, 10.1111/j.1365-294x.2012.05614.x 767–779. doi: 10.1093/genetics/105.3.767 Hewitt, G. M. (1999). Post-glacial re-colonization of European biota. Biol. J. Rohlf, F. J., and Sokal, R. R. (1995). Statistical Tables. New York, NY: Macmillan. Linnean Soc. 68, 87–112. doi: 10.1111/j.1095-8312.1999.tb01160.x Rosenberg, N. A. (2004). DISTRUCT: a program for the graphical display of Ho, J., Tumkaya, T., and Aryal, S. (2019). Moving beyond P values: data analysis population structure. Mol. Ecol. Notes 4, 137–138. doi: 10.1046/j.1471-8286. with estimation graphics. Nat. Methods 16, 565–566. doi: 10.1038/s41592-019- 2003.00566.x 0470-3 Ruttner, F. (1988). Biogeography and Taxonomy of Honey Bees. New York, NY: Holleley, C. E., and Geerts, P. G. (2009). Multiplex Manager 1.0: a crossplatform Springer V editor. computer program that plans and optimizes multiplex PCR. BioTechniques 46, Shaibi, T., Lattorff, H. M. G., and Moritz, R. F. A. (2008). A microsatellite 511–517. doi: 10.2144/000113156 DNA toolkit for studying population structure in Apis mellifera. Jakobsson, M., and Rosenberg, N. A. (2007). CLUMPP: a cluster matching and Mol. Ecol. Resour. 8, 1034–1036. doi: 10.1111/j.1755-0998.2008. permutation program for dealing with label switching and multimodality in 02146.x analysis of population structure. Bioinformatics 23, 1801–1806. doi: 10.1093/ Solignac, M., Vautrin, D., Loiseau, A., Mougel, F., Baudry, E., Estoup, A., et al. bioinformatics/btm233 (2003). Five hundred and fifty microsatellite markers for the study of the Kandemir, I., Kence, M., and Kence, A. (2005). Morphometric and electrophoretic honeybee (Apis mellifera L.) genome. Mol. Ecol. Notes 3, 307–311. doi: 10.1046/ variation in different honey bee (Apis mellifera L.) populations. Turkish J. j.1471-8286.2003.00436.x Veterinary Animal Sci. 29, 885–890. Torchiano, M. (2016). Effsize—a package for efficient effect size computation. Kandemir, I., Kence, M., Sheppard, W. S., and Kence, A. (2006). Mitochondrial Zenodo doi: 10.5281/zenodo.196082 DNA variation in honey bee (Apis mellifera L.) populations from Turkey. Tunca, R. I. (2009). Determination and Comparison of Genetic Variation in Honey J. Apicultural Res. 45, 33–38. doi: 10.3896/ibra.1.45.1.08 Bee (Apis Mellifera L.) Populations of Turkey by Random Amplified Polymorphic Kence, M., Farhoud, H. J., and Tunca, R. I. (2009). Morphometric and genetic DNA and Microsatellite Analyses. Ph.D. Thesis. Ankara: Middle East Technical variability of honey bee (Apis mellifera L.) populations from northern Iran. University. J. Apicultural Res. 48, 247–255. doi: 10.3896/ibra.1.48.4.04 USDA NASS (2019). Statistical Summary: Honey Bees. NASS Highlights. Kükrer, M. (2013). Genetic Diversity of Honey Bee Populations in Turkey Based Available online at: https://www.nass.usda.gov/Publications/Highlights/2019/ on Microsatellite Markers: a Comparison Between Migratory Versus Stationary 2019_Honey_Bees_StatisticalSummary.pdf (accessed April 28, 2020). Apiaries and Isolated Regions Versus Regions Open to Migratory Beekeeping. Van Engelsdorp, D., Evans, J. D., Saegerman, C., Mullin, C., Haubruge, E., Nguyen, Master’s thesis. Ankara: Middle East Technical University. B. K., et al. (2009). Colony collapse disorder: a descriptive study. PLoS One Kükrer, M., and Bilgin, C. (2020). Climate change prompts monitoring and 4:e6481. doi: 10.1371/journal.pone.0006481 systematic utilization of honey bee diversity in Turkey. Bee Stud. 12, 17–23. Van Engelsdorp, D., and Meixner, M. D. (2010). A historical review of doi: 10.51458/bstd.2021.4 managed honey bee populations in Europe and the United States Kükrer, M., Kence, M., and Kence, A. (2020). Honey bee diversity is swayed and the factors that may affect them. J. Invertebrate Pathol. 103, by migratory beekeeping and trade despite conservation practices: genetic S80–S95. Frontiers in Ecology and Evolution | www.frontiersin.org 14 April 2021 | Volume 9 | Article 556816
You can also read