Examining Tweet Content and Engagement of Canadian Public Health Agencies and Decision Makers During COVID-19: Mixed Methods Analysis
←
→
Page content transcription
If your browser does not render page correctly, please read the page content below
JOURNAL OF MEDICAL INTERNET RESEARCH                                                                                                         Slavik et al

     Original Paper

     Examining Tweet Content and Engagement of Canadian Public
     Health Agencies and Decision Makers During COVID-19: Mixed
     Methods Analysis

     Catherine E Slavik1, MPH; Charlotte Buttle1; Shelby L Sturrock2, MSc; J Connor Darlington3, MSc; Niko
     Yiannakoulias1, PhD
     1
      School of Earth, Environment and Society, McMaster University, Hamilton, ON, Canada
     2
      Division of Epidemiology, Dalla Lana School of Public Health, University of Toronto, Toronto, ON, Canada
     3
      School of Geography and Environmental Management, University of Waterloo, Waterloo, ON, Canada

     Corresponding Author:
     Niko Yiannakoulias, PhD
     School of Earth, Environment and Society
     McMaster University
     General Science Building
     1280 Main Street West, Room 204
     Hamilton, ON, L8S 4K1
     Canada
     Phone: 1 905 525 9140 ext 20118
     Email: yiannan@mcmaster.ca

     Abstract
     Background: Effective communication during a health crisis can ease public concerns and promote the adoption of important
     risk-mitigating behaviors. Public health agencies and leaders have served as the primary communicators of information related
     to COVID-19, and a key part of their public outreach has taken place on social media platforms.
     Objective: This study examined the content and engagement of COVID-19 tweets authored by Canadian public health agencies
     and decision makers. We propose ways for public health accounts to adjust their tweeting practices during public health crises
     to improve risk communication and maximize engagement.
     Methods: We retrieved data from tweets by Canadian public health agencies and decision makers from January 1, 2020, to
     June 30, 2020. The Twitter accounts were categorized as belonging to either a public health agency, regional or local health
     department, provincial health authority, medical health officer, or minister of health. We analyzed trends in COVID-19 tweet
     engagement and conducted a content analysis on a stratified random sample of 485 tweets to examine the message functions and
     risk communication strategies used by each account type.
     Results: We analyzed 32,737 tweets authored by 118 Canadian public health Twitter accounts, of which 6982 tweets were
     related to COVID-19. Medical health officers authored the largest percentage of COVID-19–related tweets (n=1337, 35%) relative
     to their total number of tweets and averaged the highest number of retweets per COVID-19 tweet (112 retweets per tweet). Public
     health agencies had the highest frequency of daily tweets about COVID-19 throughout the study period. Compared to tweets
     containing media and user mentions, hashtags and URLs were used in tweets more frequently by all account types, appearing in
     69% (n=4798 tweets) and 68% (n=4781 tweets) of COVID-19–related tweets, respectively. Tweets containing hashtags also
     received the highest average retweets (47 retweets per tweet). Our content analysis revealed that of the three tweet message
     functions analyzed (information, action, community), tweets providing information were the most commonly used across most
     account types, constituting 39% (n=181) of all tweets; however, tweets promoting actions from users received higher than average
     retweets (55 retweets per tweet). When examining tweets that received one or more retweet (n=359), the difference between mean
     retweets across the message functions was statistically significant (P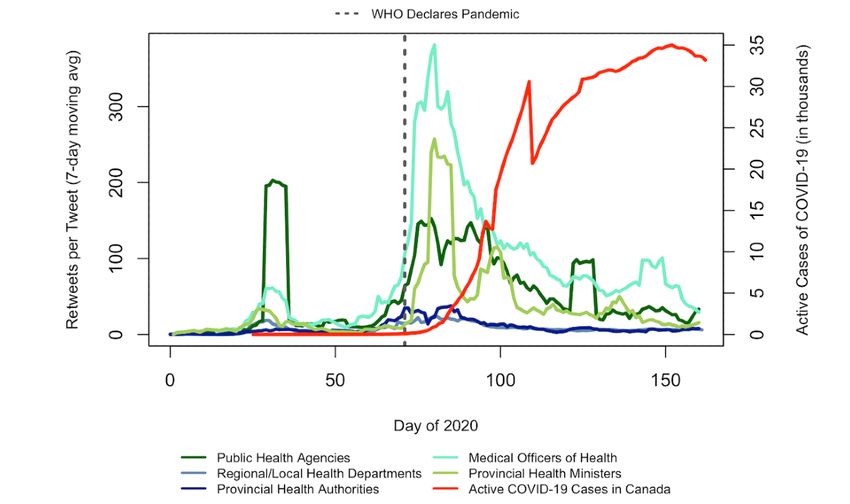
JOURNAL OF MEDICAL INTERNET RESEARCH                                                                                                  Slavik et al

     Conclusions: Public health agencies and decision makers should examine what messaging best meets the needs of their Twitter
     audiences to maximize sharing of their communications. Public health accounts that do not currently employ risk communication
     strategies in their tweets may be missing an important opportunity to engage with users about the mitigation of health risks related
     to COVID-19.

     (J Med Internet Res 2021;23(3):e24883) doi: 10.2196/24883

     KEYWORDS
     COVID-19; coronavirus; pandemic; public health; Twitter; social media; engagement; risk communication; infodemiology;
     content analysis

                                                                         and screening practices [6]. Some provinces also operate
     Introduction                                                        regional and/or local-level public health units, which
     Background                                                          communicate information about local public health measures
                                                                         they have set and enforced based on provincial emergency
     On January 25, 2020, the first case of COVID-19 was reported        orders. In addition to provincial health ministries, Ontario,
     in Canada in a man who had recently traveled to Wuhan, China,       British Columbia, and Quebec also have separate
     where the virus was first identified [1]. By mid-March, in the      provincial-level public health agencies to provide scientific and
     days after the World Health Organization (WHO) declared             technical advice on public health matters, conduct specialized
     COVID-19 to be a pandemic, Canadian public health officials         data analytics, and provide updates on provincial testing capacity
     began to issue warnings against all nonessential travel, and soon   or other expert advice related to infectious disease control. Each
     local community transmission was confirmed to be the primary        of the levels of government described (federal, provincial, and
     source of the transmission of cases in the country. By March        regional/local where they exist) also appoints a medical officer
     22, all Canadian provinces entered a state of emergency, ordered    of health to lead public health efforts in their respective
     all nonessential businesses to close, and restricted public         jurisdiction, who often holds degrees and training in both
     gatherings [2].                                                     medicine and public health.
     During this time, public health agencies and officials emerged      The diversity in public health responses and responsibilities
     as the de facto leaders and primary decision makers for setting     between institutions and individuals led virtually every Canadian
     evidence-based public health policies, practices, and norms.        province to take a different approach to crisis communications
     Daily updates from medical officers of health and other public      and information dissemination related to COVID-19. For
     health experts would set the course for how each jurisdiction       example, provinces such as British Columbia have put their
     would respond to COVID-19 and outline the public’s role in          provincial medical officers of health in the spotlight, while
     “flattening the curve.” Some early research suggests that           others, including Ontario, have opted to have elected officials
     Canadians listened to these messages and followed public health     such as local premiers or health ministers lead some of the
     recommendations [3], and also stayed home, particularly in the      response. Occasionally this has resulted in contradictory
     early weeks of the pandemic, as demonstrated by decreases in        messaging from multiple spokespeople, leaving the public
     the levels of people’s movements tracked through Google’s           confused and unsure whose guidance to follow [7]. This issue
     Community Mobility Reports [4].                                     is particularly relevant on social media platforms like Twitter,
     Public Health Administration in Canada                              where an abundance of information and misinformation has
                                                                         resulted in an infodemic [8], which can produce uncertainty and
     The roles and responsibilities of Canadian public health
                                                                         anxiety for individuals navigating an information overload [9].
     institutions and individuals differ across the country and by
                                                                         Inconsistencies in health messaging can also erode public trust
     levels of government. As a result, it is not always clear where
                                                                         in the competence and credibility of public health agencies and
     the public should go to access and retrieve information during
                                                                         decision makers [10].
     a health crisis. For example, the federal government’s main role
     is to communicate national case numbers to all Canadians,           Role of Public Health Agencies on Twitter
     coordinate control measures across provinces, and provide           One of the ways in which the public has stayed informed on
     updates on national issues such as travel and the delivery of       key information and updates on COVID-19 has been through
     medical supplies. These activities are undertaken mostly by the     the use of social media applications. Twitter in particular
     Public Health Agency of Canada (PHAC), which was                    reported its biggest ever annual gain in daily users globally
     established as a separate agency of the federal department of       during the pandemic, which was up by 24% year over year
     health specifically to improve responses to infectious disease      during the first 3 months of 2020 [11]. On the one hand, an
     outbreaks after the severe acute respiratory syndrome (SARS)        increase in Twitter users can lead to a more informed public as
     outbreak of 2003 [5].                                               past research has suggested that a high proportion of users have
     Conversely, Canadian provinces are responsible for leading the      identified Twitter as a major source of news for them [12]. On
     emergency response, whereby ministries of health are tasked         the other hand, an increase in Twitter users may also increase
     with communicating provincial updates on case counts,               exposure to incorrect information or outright misinformation
     conducting surveillance and monitoring, providing guidance          about COVID-19 [13]. Although the mass media have
     on infectious disease control measures and policies, and testing    historically played a major role in the flow of information

     https://www.jmir.org/2021/3/e24883                                                           J Med Internet Res 2021 | vol. 23 | iss. 3 | e24883 | p. 2
                                                                                                                (page number not for citation purposes)
XSL• FO
RenderX
JOURNAL OF MEDICAL INTERNET RESEARCH                                                                                                     Slavik et al

     between public officials and the public during crises, the             study of tweet engagement strategies used by 25 federal health
     increased use of social media applications like Twitter has            agencies in the United States, it was found that hashtags, URLs,
     allowed members of the public to connect with governmental             and user mentions were associated with an increased frequency
     organizations and individuals more directly, largely                   of retweets [22]. In prior content analyses of tweets by state
     circumventing the need to follow other unofficial communicators        and/or local health departments in the United States, studies
     [14].                                                                  classifying the purpose of tweets (eg, whether tweets served to
                                                                            inform users or prompted them to perform some activity) have
     During a health crisis such as a pandemic, the role of public
                                                                            found that health departments mostly use Twitter to share health
     health agencies and officials as communicators of timely and
                                                                            information [23-26]. However, other research has suggested
     accurate information is especially crucial in helping the public
                                                                            that tweets whose function was to promote an action received
     form accurate perceptions of health risks and adapt their
                                                                            more retweets than those with other functions [21]. Our work
     behaviors in ways that are necessary to mitigate risks [15]. In
                                                                            is also guided by research about prior pandemics such as
     fact, social media platforms like Twitter have enabled users to
                                                                            tweeting trends during the H1N1 outbreak [27] and tweets
     seek and share information and news updates during past crises
                                                                            covering Ebola health risks [28-30].
     to help reduce feelings of uncertainty and cope with threats [16].
     Some early studies of the COVID-19 pandemic have highlighted           Previous work summarizing best practices in risk
     the need for public health officials to utilize more                   communication during broader risk events [31,32], as well as
     communication channels and exert their influence as risk               previous public health crises [33-35], underscore the importance
     communicators in a time when the global need for expert                of incorporating effective risk communication elements in
     information and advice has peaked [17]. Information posted to          messaging in order to reduce harm, clarify facts, and address
     social media especially at the early stages of any crisis or risk      public concerns. Beyond simply providing accurate descriptions
     event tends to garner more traction online as users seek out           of risks about the likelihood and consequences of harms,
     updates. As such, it is critical for risk communicators to establish   effective risk communication practices on Twitter may also
     an early online presence and engage those users from the               include the use of messages promoting self-efficacy (ie, an
     beginning [18].                                                        individuals’ beliefs that they have the ability to take action),
                                                                            providing reassurances, acknowledging concerns and
     One way to assess the online influence of Twitter accounts is
                                                                            uncertainties surrounding the situation, and indicating
     to examine the engagement that their tweets receive. This can
                                                                            coordination of actions between experts. These strategies are
     indicate how much an account’s communications are being
                                                                            viewed as important tools for organizations to augment their
     seen, studied, and shared. Tweet engagement can be indicated
                                                                            credibility and diffuse public fears [36]. Some literature has
     by various measures including the number of retweets (ie, shares
                                                                            also noted the importance of applying strategic risk messaging
     of a tweet), likes (ie, number of times a user has seen and
                                                                            across different outbreak phases by first focusing on information
     acknowledged or agreed with a tweet), or replies (ie, number
                                                                            accuracy, then moving to reassurances to reduce uncertainty,
     of times a tweet has been commented on or responded to).
                                                                            and lastly, by emphasizing self-efficacy through individual
     Retweets in particular have been identified as an effective
                                                                            actions and preventive measures [37].
     measure of engagement as they can indicate both the level of
     user agreement with a message and also the level of diffusion          Study Goal
     that message has undergone based on how many shares it has             The goal of our study was to characterize the content and level
     amassed from the original tweeter [19]. Beyond providing               of engagement of COVID-19 tweets made by Canadian public
     confirmation that some information or message has been                 health agencies and decision makers. Further, we propose
     disseminated to the public, quantifying tweet engagement based         recommendations for ways through which health agencies and
     on retweets can provide a direct measure of the impact of that         decision makers could adjust their tweeting practices about
     tweet on users. Some research has suggested that source                COVID-19 and other future health crises to improve risk
     credibility plays a role in garnering engagement; health agencies      communication and maximize engagement. Our study seeks to
     or individuals who appear to provide trustworthy information           answer four primary research questions (RQs):
     may be able to leverage their perceived legitimacy to gain more
     retweets and disseminate their information more broadly [20].          •   RQ1: which types of Canadian public health agencies and
     Researchers have also identified engagement strategies that can            decision makers tweeted the most about COVID-19 and
     be used to increase user engagement to tweets. These strategies            when?
     include the use of hashtags, URLs, user mentions (ie, direct           •   RQ2: how much engagement did tweets by Canadian public
     mention of other Twitter user accounts), and media (eg, images             health agencies and decision makers receive during
     or videos) [21].                                                           COVID-19? How did engagement change over time by
                                                                                account type?
     Prior Work                                                             •   RQ3: did tweets containing Twitter engagement strategies
     Our study builds on past research that has examined the use of             receive more retweets than those that did not? How did the
     Twitter specifically by public health departments, agencies, and           use of engagement strategies vary by account type?
     organizations. Most studies tend to focus on either examining          •   RQ4: did tweets from Canadian public health agencies and
     the relationship between tweet features and levels of engagement           decision makers that employed a particular message
     and/or analyzing the content of the tweets to characterize the             function and risk communication strategy receive more
     tweeting practices of particular accounts. For example, in a               retweets than others? How did the use of risk

     https://www.jmir.org/2021/3/e24883                                                              J Med Internet Res 2021 | vol. 23 | iss. 3 | e24883 | p. 3
                                                                                                                   (page number not for citation purposes)
XSL• FO
RenderX
JOURNAL OF MEDICAL INTERNET RESEARCH Slavik et al
communication strategies in tweets from Canadian public and tweet threads (n=32,737) will be referred to simply as tweets
health agencies and decision makers change over time? throughout the remainder of this paper. The tweets were then
classified by whether they were about COVID-19 or not, based
Methods on whether they contained any of the following keywords:
“covid*,” “coronavirus,” “ncov,” “distanc*,” “pand*,” “tracing,”
Data Collection “testandtrace,” “curve,” “stayhome,” “handwashing,” “mask,”
A comprehensive list of Canadian public health institutions, and “masque.” These keywords were identified by scanning
agencies, and leaders was compiled after conducting a scoping tweets within the sample and noting commonly used words in
review of provincial government websites. The resulting list of French- and English-language tweets describing COVID-19.
agencies and decision makers from this initial search was During this scan, it was found that most French-language tweets
cross-referenced with the “Structural Profile of Public Health about COVID-19 used #COVID19 to denote the tweet’s topic
in Canada,” a resource published by the National Collaborating relevant to COVID-19, which was a less common practice
Centre for Healthy Public Policy [38] that summarizes how among English-language tweets. Hence, a larger number of
public health is organized federally, provincially, and regionally English-language keywords were required to classify whether
across Canada. The names of each of these agencies and an English-language tweet was about COVID-19. This selection
individuals were then manually searched using the Twitter process resulted in 6982 tweets about COVID-19.
interface to narrow the list to include only those that had a Additionally, we downloaded the publicly available COVID-19
Twitter account (n=128). This list of agencies and decision data set from the Government of Canada [1] to plot active case
makers was then used to pull tweets for the identified key counts over time alongside tweeting trends by public health
players in Canadian public health communication on Twitter. accounts. The national COVID-19 data set aggregated case
Twitter data were downloaded using the Twitter API accessed counts by the date that the case data were submitted to PHAC
through R using the rtweet package (The R Foundation) [39]. rather than the date that the cases were confirmed by the local
An R script was created to go through the list of 128 identified health authority that collected the data.
Twitter accounts and download the most recent 3200 tweets of Data Analysis
each account, which reflects the maximum number of tweets
allowed for account-specific searches as imposed by the To classify the public health accounts by type, each account
application programming interface for Twitter. Data were was categorized as belonging to either an agency or a decision
originally collected on May 23 but were recollected every day maker. If the Twitter account belonged to an agency, it was
from June 1 to July 10 using an automated script that iteratively classified as being one of 3 types: public health agency (ie, a
updated the number of interactions with past tweets (such as federal or provincial public health agency, distinct from a health
likes or retweets) and collected new tweets published during ministry due to its focus on public health), a regional or local
the month of June. The Twitter data set contained tweet-level health department (ie, a public health department that offers
data including the author’s account name, Twitter handle, public health programs or services to communities at a scale
number of followers at the time of download; the date and time smaller than the province), or a provincial health authority (ie,
the tweet was published; whether the tweet was an original provincial health ministries or health authorities). If the account
tweet or a retweet; the tweet’s text, hashtags, user mentions, belonged to a decision maker, it was classified as being one of
URLs, favorite and retweet count; and whether the tweet 2 types: medical officer of health (ie, the chief medical health
contained media (eg, image). officer of Canada and of each province, and regional or local
medical health officers responsible for public health in smaller
The Twitter data collected between May 23 and July 10 yielded communities) or provincial minister of health (ie, elected
303,428 tweets from February 2010 to July 10, 2020. The data government official who oversees health and public health
were then narrowed down to only include tweets authored agencies).
between January 1, 2020, and June 30, 2020, resulting in 71,014
tweets. This time period was selected as China first reported Tweet engagement was measured using retweet count. For tweet
the outbreak of the novel coronavirus to the WHO on January threads that contained multiple tweets, the maximum number
1, 2020. Of the 128 Twitter accounts we sampled, 118 had of retweets obtained for any single tweet in the thread was used
authored tweets between this period. Finally, retweeted tweets to measure engagement (rather than the average or total number
were excluded, resulting in 45,310 tweets. of retweets for all tweets in the thread) to avoid double-counting
or high-biased engagement.
Most tweets in the sample were single standalone tweets within
the tweet character limit, but some comprised longer tweet Next, accounts were classified based on province, where
threads. In these cases, tweets were turned into threads using applicable, or were otherwise identified as a “national” account
the following procedure. First, all tweets were sorted by (eg, PHAC and Canada’s chief medical officer). This was done
publisher and date and time. Next, all tweets that were identified to select a stratified random sample of 501 tweets about
as self-replies (based on the “reply_to_screen_name” variable) COVID-19 for a qualitative content analysis (see Multimedia
were treated as part of a tweet thread. The start of a tweet thread Appendix 1 for process flow chart). Since public health services
was the tweet that immediately preceded the chain of tweets and policies are primarily administered at the provincial level
that were self-replies. This starting tweet, and all subsequent in Canada, we wanted our subset of tweets to capture enough
self-replies, were combined into a tweet thread. These tweets geographic variation in the accounts across various provinces.
We also wanted our subset of tweets to capture enough variation
https://www.jmir.org/2021/3/e24883 J Med Internet Res 2021 | vol. 23 | iss. 3 | e24883 | p. 4
(page number not for citation purposes)
XSL• FO
RenderXJOURNAL OF MEDICAL INTERNET RESEARCH Slavik et al
in tweeting by account type. Therefore, we used a stratified function are consistent with those first proposed by Lovejoy
random sample with replacement using proportional weighting and Saxton [40] for classifying the three main functions of
to randomly select tweets across various strata based on the organizations’ Twitter use and have been used in similar
number of tweets each stratum contributed to the total sample. research [21,23,25].
These comprised of 8 regional strata, which included British
The final variable, use of a risk communication strategy, was
Columbia, Alberta, the Prairies (Saskatchewan and Manitoba),
coded using 6 nonmutually exclusive coding variables:
Ontario, Quebec, the Maritimes (Nova Scotia, New Brunswick,
corrective, risk, efficacy, concern, uncertainty, and experts.
Prince Edward Island, and Newfoundland and Labrador), the
Tweets were classified as “corrective” if they corrected some
Territories (Yukon and Northwest Territories), and Canada. No
incorrect information about COVID-19 or aimed to prevent the
public health Twitter accounts from the Canadian territory of
spread of misinformation. Tweets were classified as “risk” if
Nunavut were identified. Additionally, we randomly selected
they contained information that would help a reader make a
tweets across the two broad account types (ie, agencies and
judgment about the risk of contracting COVID-19 or
decision makers). The resulting stratified random sample of 501
experiencing health complications from COVID-19. This
tweets about COVID-19 contained 58 tweets from Canadian
included tweets containing information regarding absolute risks,
national-level accounts, 52 from Alberta, 66 from British
relative risks, as well as the identification of high-risk
Columbia, 50 from the Maritimes, 199 from Ontario, 47 from
subpopulations. Tweets were classified as “efficacy” if they
the Prairies, 17 from Quebec, and 12 from territorial accounts.
referenced an individual’s or community’s ability to execute
The sample of 501 tweets about COVID-19 also contained 377
an action or activity successfully resulting in some tangible
tweets from agencies and 124 tweets from decision makers.
benefit to health or a reduction of harm related to COVID-19.
Before beginning the content analysis, 3 researchers (CS, CB, Tweets were classified as “concern” if they acknowledged the
SS) were trained on a set of 50 tweets randomly selected from fears, concerns, worry, or anxiety associated with COVID-19.
the overall sample of 6982 COVID-19 tweets. This was done Tweets were classified as “uncertainty” if they acknowledged
so that the researchers could familiarize themselves with the uncertainty, confusion, or a lack of available information about
various variables for coding and troubleshoot any issues with COVID-19. Finally, tweets were classified as “experts” if they
the definitions of the coded variables. To distribute the 501 implicitly or explicitly mentioned some agreement, coordination
tweets for the content analysis equally among the three or collaboration between public health experts or other credible
researchers, the French-language tweets (n=27) were first health organizations or individuals. The presence of any one of
identified and allocated to the researcher with fluency in French. these 6 variables was used to indicate the use of any risk
Among the remaining English-language tweets, 50 were communication strategy in the tweet and were based in part on
randomly selected and allocated to each of the 3 researchers so best practices in communication identified by Seeger [31] used
that these overlapping tweets could be used to calculate the to improve organizational and individual responses during crisis
Krippendorff α value for interrater reliability. This resulted in events (see Multimedia Appendix 2 for dataset of 501 manually
one researcher coding 201 tweets (including the 27 French coded Tweets).
tweets), and the other two coding 200 tweets each. To integrate
the 50 tweets that all 3 researchers had coded into the overall
Statistical Analysis
sample, one researcher’s code was randomly selected from the Each of the 3 coders worked independently through the same
3 possible codes for each variable, such that the probability of randomly selected 50 tweets, where each tweet had 10 variables
selection was proportional to the frequency of that answer (eg, to be codified. Krippendorff α [41] was used to measure the
if two-thirds of coders agreed on a code, there was a 2 in 3 interrater agreement among coders, which was calculated using
chance of that code being selected). the R package irr [42]. Overall, interrater reliability was
considered high (α=.829), with all 3 coders reporting total
There were 10 coding variables in total. The first variable, agreement on 453 out of the 500 answers (90.6%). Any
media, captured the presence of media in the tweet and the type codification of unstructured phenomena can have subjective
of media present (ie, image, video or document), if applicable. biases, including when there is only one coder. However, the
The next variable, message function, was coded using 3 mutually computed level of reliability suggests that there was largely
exclusive coding variables: information, action, or community. internal agreement amongst the classification of variables within
“Information” tweets included those whose main purpose was the sample such that results are less likely to be an artifact of
to inform, educate, or update the reader on case counts, disease internal disagreement or bias.
transmission dynamics, policy changes, and COVID-19
symptoms. “Action” tweets included those whose main purpose To assess whether differences in the mean number of retweets
was intended to prompt changes in the behaviors or actions of per tweet across each message function category were
readers, such as encouraging social distancing, hygiene statistically significant, the nonparametric Kruskal-Wallis
practices, or other harm-reducing behaviors. Finally, tweets one-way ANOVA (analysis of variance) test was used since our
were coded as “community” if their main purpose was data were not normally distributed.
community-building, identifying community supports and We used the nonparametric Mann–Whitney–Wilcoxon Test to
programs, or highlighting stories from or about the local assess differences in the mean number of retweets per tweet
community. Since threaded tweets could contain multiple between tweets containing at least one risk communication
message purposes, coding was based on the most prominent strategy and tweets containing no risk communication strategy.
theme for the entire tweet thread. These variables for message
https://www.jmir.org/2021/3/e24883 J Med Internet Res 2021 | vol. 23 | iss. 3 | e24883 | p. 5
(page number not for citation purposes)
XSL• FO
RenderXJOURNAL OF MEDICAL INTERNET RESEARCH Slavik et al
percentage of tweets about COVID-19 relative to their total
Results tweets (n=1337, 35%), representing the largest contribution of
COVID-19 Tweets by Account Type any account type. Conversely, accounts that belonged to
provincial health ministers authored the smallest percentage of
Our sample comprised 32,737 tweets, which included individual their tweets about COVID-19 (n=350, 18%). Accounts
tweets and threads authored by 118 Canadian public health corresponding to Canadian medical officers of health also had
Twitter accounts (agencies and decision makers) between the highest average number of retweets for COVID-19–related
January 1, 2020, to June 30, 2020. Approximately 21% (n=6982) tweets, as well as the largest total follower count (summed
of all tweets contained content about COVID-19. Table 1 across accounts in this category) at 416,611 total users (range
summarizes the characteristics of tweets in our sample by 213–206,288 followers).
account type. Medical officers of health authored the largest
Table 1. Number of tweets and follower counts by account type, January 1, 2020, to June 30, 2020.
Account type Twitter ac- Total Mean tweets Tweets about Mean retweets per Total follower countb, n
counts, n tweetsa, n per account COVID-19, n (%) tweet about COVID-19 (range)
Public health agencies 4 2272 568 524 (23) 60 407,546 (10,201-325,112)
Regional and local 69 19,919 289 3832 (19) 10 406,108 (194-82,347)
health departments
Provincial health author- 15 4778 319 939 (20) 13 170,387 (23-41,779)
ities
Medical officers of 22 3859 175 1337 (35) 112 416,611 (213-206,288)
health
Provincial health minis- 8 1909 239 350 (18) 52 134,019 (908-53,325)
ters
a
Equals the number of tweets and/or tweet threads authored by Twitter accounts per type between January 1 and June 30, 2020.
b
Corresponds to the number of followers the accounts had at the end of the study period on June 30, 2020.
Figure 1 displays longitudinal trends in the daily rate of this trend was observed shortly after the WHO declared
COVID-19 tweets stratified by account type using a 7-day COVID-19 a pandemic, when the other account types increased
moving average. All account types had an increase in their daily their frequency of tweets about the disease. In the time between
rate of COVID-19–related tweets after January 25 (day 25), the WHO’s declaration (day 70) and when Canada’s COVID-19
when Canada’s first case of COVID-19 was reported (Figure cases first peaked (day 108), the daily number of COVID-19
1). Compared to the other account types, public health agencies tweets per account for regional and local health departments,
authored the highest number of COVID-19–related tweets per provincial health authorities, and medical health officers
account through most of the period studied. An exception to appeared to converge (Figure 1).
https://www.jmir.org/2021/3/e24883 J Med Internet Res 2021 | vol. 23 | iss. 3 | e24883 | p. 6
(page number not for citation purposes)
XSL• FO
RenderXJOURNAL OF MEDICAL INTERNET RESEARCH Slavik et al
Figure 1. Daily rate of COVID-19 tweets by account type, January 1, 2020, to June 30, 2020. WHO: World Health Organization.
belonging to medical officers of health; importantly, this was
Engagement the day that Canada announced it would be closing its border
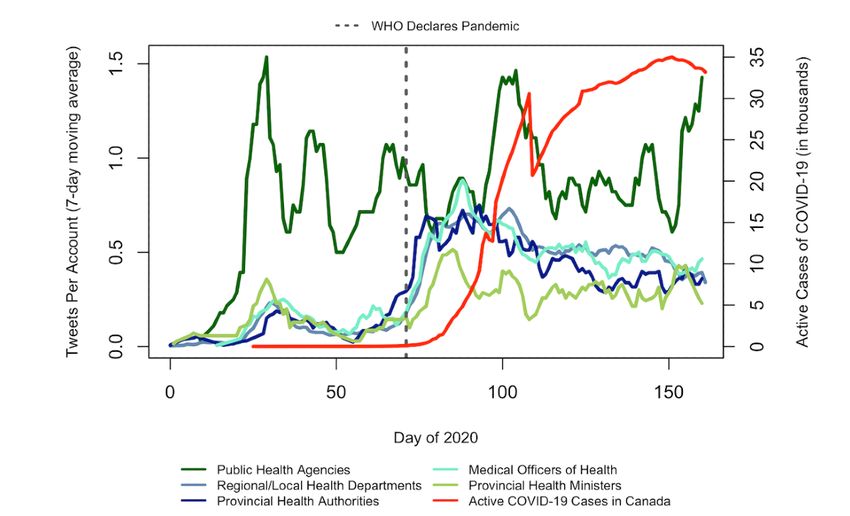
Figure 2 displays trends in the average number of retweets for to most noncitizens and nonpermanent residents. In contrast to
COVID-19–related tweets over time by account type. Around other account types, medical officers of health maintained
day 28, 3 days after the first case of COVID-19 was confirmed relatively high engagement (average of 50 or more retweets per
in Canada, there was a large spike in the average number of COVID-19–related tweet) for a sustained period, beginning
retweets for public health agencies that lasted a few days before shortly before the WHO’s pandemic declaration on day 70 and
returning to baseline. For all account types, the next period of lasting until the second peak in COVID-19 cases in Canada on
increase in retweets per tweet occurred around the time of the day 150. For accounts corresponding to provincial health
WHO’s pandemic declaration (day 70). However, a few weeks ministers, daily retweets peaked on the same day as they did
after the pandemic was declared, retweets appeared to trend for medical health officers (day 80) but trended downwards
downward, even before COVID-19 cases peaked in Canada shortly thereafter (Figure 2). Trends in retweets over time were
(Figure 2). The maximum daily average in retweets (381 similar for provincial health authorities and regional or local
retweets per tweet) was seen on day 80 among accounts health departments (Figure 2).
https://www.jmir.org/2021/3/e24883 J Med Internet Res 2021 | vol. 23 | iss. 3 | e24883 | p. 7
(page number not for citation purposes)
XSL• FO
RenderXJOURNAL OF MEDICAL INTERNET RESEARCH Slavik et al
Figure 2. Daily retweets per COVID-19 tweet by account type, January 1, 2020, to June 30, 2020. Avg: average; WHO: World Health Organization.
Table 2 summarizes the total number of tweets containing each retweets on tweets containing media (18 retweets per tweet).
engagement strategy, stratified by account type, as well as the Although accounts corresponding to regional and local health
sum and mean number of retweets by Twitter engagement departments also incorporated URLs in more tweets than the
strategy. User mentions were used less frequently than other other strategies (n=2766), they received the highest average
engagement strategies and received the lowest mean retweets retweets for tweets that contained hashtags (13 retweets per
across all accounts. The most frequently used engagement tweet). Tweets by regional and local health departments on
strategies across all account types were hashtags (n=4798) and average received fewer retweets per tweet compared to the other
URLs (n=4781). These two engagement strategies appeared account types. Tweets by medical health officers that contained
equally as frequently in tweets authored by public health hashtags on average received the highest number of retweets
agencies; however, the use of media (eg, images and videos) per tweet compared to any engagement strategy and any account
was associated with the highest average retweet count (67 (134 retweets per tweet). Both medical officers of health and
retweets per tweet) for this account type. Similar findings were provincial health ministers used tweets containing media in
observed for provincial health authorities, which also used URLs fewer than half of their tweets, while the other three account
most frequently (n=669) and received the highest average types used media in more than half of their tweets.
https://www.jmir.org/2021/3/e24883 J Med Internet Res 2021 | vol. 23 | iss. 3 | e24883 | p. 8
(page number not for citation purposes)
XSL• FO
RenderXJOURNAL OF MEDICAL INTERNET RESEARCH Slavik et al
Table 2. Summed tweet (n=6982) and retweet frequencies and percentages by engagement strategy and account type, January 1, 2020, to June 30,
2020.
Account type and engagement strategy Number of tweetsa containing each Summed retweets for all tweets Mean retweets per tweet contain-
engagement strategy, n (%) containing each strategy, n ing each strategy
Public health agencies
Media 350 (67) 23,291 67
Hashtags 451 (86) 29,418 65
URLs 451 (86) 24,788 55
User mentions 139 (27) 2654 19
Regional and local health departments
Media 2640 (69) 30,223 11
Hashtags 2462 (64) 30,824 13
URLs 2766 (72) 27,136 10
User mentions 753 (20) 4648 6
Provincial health authorities
Media 477 (51) 8555 18
Hashtags 614 (65) 8333 14
URLs 669 (71) 6671 10
User mentions 326 (35) 1644 5
Medical officers of health
Media 342 (26) 25,924 76
Hashtags 1058 (79) 141,841 134
URLs 681 (51) 61,697 91
User mentions 396 (30) 15,098 38
Provincial health ministers
Media 157 (45) 5015 32
Hashtags 213 (61) 14,261 67
URLs 214 (61) 8134 38
User mentions 135 (39) 3756 28
a
Equals the number of tweets and/or tweet threads authored by Twitter accounts per type between January 1 and June 30, 2020.
regional and local health departments were most often classified
Content Analysis as action tweets (n=101, 47%), and on average these received
During the content analysis of 501 tweets, 16 tweets were the highest number of retweets per tweet for this account type
identified by the 3 researchers as not being directly related to (10 retweets per tweet). Tweets corresponding to provincial
content about COVID-19, resulting in a data set of 485 tweets health authorities, medical health officers, and provincial health
about COVID-19. When coding the tweets for message function, ministers were mostly classified as information (n=47, 47%;
21 tweets were found to not have a classifiable purpose and n=56, 58%; and n=10, 53%, respectively); however, action
were omitted from this part of the analysis. Table 3 summarizes tweets authored by each of these account types received more
the frequency and percentage of tweets identified as information, retweets per tweet on average compared to their information
action, and community for each of the five account types in the tweets (12, 259, and 44 retweets per tweet, respectively). The
sample. More than half of all coded tweets authored by public difference in mean retweets across the three message functions
health agencies were classified as information tweets (n=17, was not statistically significant (P=.18). However, when
52%), which received the highest average number of retweets examining only those tweets that received one or more retweet
per tweet (56 retweets per tweet) compared to action (43 (n=359), the difference between mean retweets across the three
retweets per tweet) and community tweets (12 retweets per message functions was statistically significant (PJOURNAL OF MEDICAL INTERNET RESEARCH Slavik et al
Table 3. Summed tweet (n=464) and retweet frequencies and percentages by message function and account type, January 1, 2020, to June 30, 2020.
Account type and message function Number of tweetsa with each Summed retweets for all Mean retweets per tweet of
message function, n (%) tweets of each function, n each function
Public health agencies
Information 17 (52) 957 56
Action 13 (39) 554 43
Community 3 (9) 36 12
Regional and local health departments
Information 51 (24) 325 6
Action 101 (47) 1043 10
Community 64 (30) 223 3
Provincial health authorities
Information 47 (47) 393 7
Action 33 (33) 388 12
Community 19 (19) 142 7
Medical officers of health
Information 56 (58) 6172 103
Action 30 (31) 7765 259
Community 11 (11) 223 20
Provincial health ministers
Information 10 (53) 293 27
Action 5 (26) 221 44
Community 4 (21) 90 23
a
Equals the number of tweets and/or tweet threads authored by Twitter accounts per type between January 1 and June 30, 2020.
Table 4 summarizes the frequencies and percentages of risk that was authored by PHAC (which addressed misinformation
communication strategies used by account type for the stratified on COVID-19) received the most retweets (134 retweets per
random sample of COVID-19 tweets that were coded during tweet). Among regional and local health departments, the second
the content analysis. Overall, the risk communication strategies most frequently used risk communication strategy after efficacy
that we examined were not very widely used and appeared only was addressing concern about COVID-19; however, their tweets
in 262 tweets out of our sample of 485 tweets. Since some tweets containing corrective information received the most retweets
in our sample contained more than one type of risk on average (30 retweets per tweet). Provincial health authorities
communication strategy, as a result, there were 334 strategies and medical health officers used risk statements at similar
used across the 262 tweets. Efficacy statements were the most frequencies (n=12, 23% and n=24, 22%, respectively); however,
commonly used strategy (efficacy accounted for more than tweets containing this strategy had fewer retweets on average
one-third of the strategies used by each account type), and this among both account types when compared to tweets containing
strategy appeared in 163 of 262 tweets containing any risk other risk communication strategies. Although medical health
communication strategy. For accounts corresponding to public officers only authored 4 tweets containing statements that
health agencies, efficacy (n=12, 46%) and risk (n=8, 31%) acknowledged the uncertainty around COVID-19, these tweets
statements were the most frequently used strategy; however, received the highest number of retweets per tweet compared to
tweets containing these strategies were not the most retweeted. the other strategies used by that account type (358 retweets per
Instead, a single tweet thread containing corrective information tweet).
https://www.jmir.org/2021/3/e24883 J Med Internet Res 2021 | vol. 23 | iss. 3 | e24883 | p. 10
(page number not for citation purposes)
XSL• FO
RenderXJOURNAL OF MEDICAL INTERNET RESEARCH Slavik et al
Table 4. Summed risk communication strategies (n=334) and percentages and retweet frequencies by strategy and account type, January 1, 2020, to
June 30, 2020.
Account type and risk communication strategya Number of risk communication Summed retweets for all tweets Mean retweets per tweet con-
strategiesb used by account type, containing each risk communica- taining each strategy
n (%) tion strategy, n
Public health agencies
Corrective 1 (4) 134 134
Risk 8 (31) 112 14
Efficacy 12 (46) 845 70
Concern 2 (8) 154 77
Uncertainty 1 (4) 67 67
Experts 2 (8) 18 9
Regional and local health departments
Corrective 4 (3) 119 30
Risk 5 (4) 20 4
Efficacy 81 (60) 711 9
Concern 24 (18) 236 10
Uncertainty 10 (7) 90 9
Experts 12 (9) 35 3
Provincial health authorities
Corrective 1 (2) 0 0
Risk 12 (23) 38 3
Efficacy 18 (34) 129 7
Concern 10 (19) 220 22
Uncertainty 3 (6) 5 2
Experts 9 (17) 38 4
Medical officers of health
Corrective 4 (4) 767 192
Risk 24 (22) 2709 113
Efficacy 49 (45) 12,413 253
Concern 13 (12) 3928 302
Uncertainty 4 (4) 1433 358
Experts 15 (14) 1695 113
Provincial health ministers
Corrective 0 (0) N/Ac N/A
Risk 2 (20) 123 62
Efficacy 3 (30) 175 58
Concern 1 (10) 43 43
Uncertainty 0 (0) N/A N/A
Experts 4 (40) 53 13
a
Risk communication strategies were not mutually exclusive; therefore, a single tweet could contain multiple strategies.
b
Equals the number of tweets and/or tweet threads authored by Twitter accounts per type between January 1 and June 30, 2020.
c
N/A: not applicable.
Figure 3 displays the weekly frequency of COVID-19 tweets containing no strategy across all account types for the stratified
containing any risk communication strategy and tweets random sample of COVID-19 tweets that were coded during
https://www.jmir.org/2021/3/e24883 J Med Internet Res 2021 | vol. 23 | iss. 3 | e24883 | p. 11
(page number not for citation purposes)
XSL• FO
RenderXJOURNAL OF MEDICAL INTERNET RESEARCH Slavik et al
the content analysis. When examining trends across all account strategy shortly after the pandemic was declared. The use of
types, the use of risk communication strategies appeared to any risk communication strategy by all account types appeared
increase in tweets produced after the WHO’s pandemic to increase again a little after the second peak of COVID-19
declaration (week 10) but decreased in the period of time cases in Canada after week 22. Tweets using at least one risk
between the first and second peaks of COVID-19 cases in communication strategy (n=262) received an average of 61
Canada (weeks 15 and 22, respectively). Tweets that did not retweets per tweet, while tweets using no risk communication
contain a risk communication strategy were not tweeted as strategies received an average of 13. This nearly 5-fold
frequently as tweets that did contain a risk communication difference was statistically significant (PJOURNAL OF MEDICAL INTERNET RESEARCH Slavik et al
those by medical health officers; however, this trend was less likely to share information from sources perceived as more
evident by the time Canada’s COVID-19 cases peaked. trusted or more “expert” (eg, physicians and medical
researchers) [45].
It is also interesting to note that daily rates of COVID-19 tweets
authored by public health agencies seemed to peak around the RQ3: Use of Engagement Strategies
same time that key moments related to COVID-19 took place The frequent use of hashtags and URLs in the majority of
in Canada (ie, after Canada’s first case, just before the first peak COVID-19 tweets that we analyzed is consistent with other
in COVID-19 cases, and shortly after the second peak in studies examining engagement to tweets authored by health
COVID-19 cases), which suggests that trends in case counts agencies [22], and suggests that many Canadian public health
may have at least partially informed this account type’s tweeting agencies and decision makers are aware of and incorporate
practices. This trend was not seen for medical officers of health, common Twitter engagement strategies in their tweeting
whose daily rates of COVID-19 tweets trended downward after practices. However, the use of these metrics was not always
the WHO declared COVID-19 a pandemic, despite subsequent associated with higher engagement, suggesting that there is no
peaks in Canadian COVID-19 cases. This is important because single strategy to garner engagement. Hence, each account type
increasing COVID-19 case counts partially inform the public may need to tailor their approach. Although user mentions were
about their risk of contracting COVID-19 and thus may lead to among the least used engagement metric, and received the
increased information seeking. As a result, more public health lowest average retweets per tweet, the value of these types of
accounts should respond to increasing case numbers with tweets extends beyond engagement. In fact, user mentions are
increased daily tweeting about COVID-19, not less. viewed as a way to establish dialogue between a tweeter and
Unfortunately, information seeking cannot be indicated by their audience, build relationships between users, and improve
engagement metrics such as retweet counts; therefore, our results transparency and trust in tweeting institutions [46]. Other studies
do not reflect which tweets were most seen or read by Twitter have also noted that organizations that do not fully utilize
users. However, other research has noted that frequently updated Twitter engagement strategies may be missing important
social media feeds are perceived by audiences as more relevant opportunities to craft more interactive and engaging
during crises and should be updated enough so as to be noticed communications during a crisis [47].
by users, regardless of whether they receive engagement [20].
RQ4: Tweet Message Functions and Use of Risk
Despite having lower daily COVID-19 tweet rates compared
Communication Strategies
to public health agencies, medical officers of health and
provincial health ministers received the highest daily retweets In our content analysis of a stratified random sample of tweets
per tweet on day 80, 10 days after the WHO declared COVID-19 by Canadian public health agencies and decision makers, we
a pandemic. This finding was somewhat surprising given that found that of the three message functions that we examined,
past research has identified health agencies (especially at the information tweets were most common across all account types,
federal level) as being able to garner more retweets than other except regional and local public health departments, which used
public health accounts during past pandemics, largely due to action tweets more frequently. This finding was consistent with
their recognition and influence over online information sharing other studies that have found tweets conveying information to
[33]. This finding may reflect a Twitter audience shift from be the most frequently tweeted by health organizations during
governmental institutions to individuals, consistent with some other pandemics [26,48]; however, action tweets were most
research that has identified a spokesperson effect during public frequently produced in a study by Wahbeh et al [49] of
health crises, whereby people seek out a leading voice that is physicians’ tweets on COVID-19. Despite information tweets
credible and relatable as their primary source of information being the most frequently used by the accounts in our sample,
[43]. action tweets received on average more retweets per tweet for
all account types except for public health agencies, which
One reason that medical officers of health may have been able received on average more retweets for information tweets. Other
to maintain a higher average retweet count for the remainder of research has also found that action tweets receive the most
the study period is that Twitter users may have perceived their engagement compared to tweets with other message functions
content as more medically or scientifically relevant during the [21]. Our findings suggest that users may seek out and engage
pandemic, which other studies have found can lead to more with different messages from different account types, relying
retweets [14,44], likely because expert accounts are perceived more on public health agencies for information about COVID-19
as highly authoritative and trustworthy information sources. and relying on the other accounts for instructions on actions
Perhaps unsurprisingly, Twitter accounts corresponding to and preventative measures they should be taking. During regular
provincial health ministers had the lowest percentage of tweets noncrisis periods, community tweets can help a public health
about COVID-19, and the number of retweets that their tweets agency build an online community and initiate a sense of
received decreased significantly after peaking on day 80. Given togetherness [25]; however, the lack of engagement that these
that provincial health ministers are elected public officials, often tweets received in our study suggest that the public’s need for
with little to no expertise in public health, our findings suggest information and direct actions during the COVID-19 pandemic
that these individuals likely relegated responsibilities around may require public health agencies and decision makers to shift
COVID-19 communications to other accounts more focused on away from community-type tweets during a crisis to meet the
public health. These results are also consistent with prior needs of their audiences.
research that found that the public may be more likely to distrust
information from governments or elected officials and more
https://www.jmir.org/2021/3/e24883 J Med Internet Res 2021 | vol. 23 | iss. 3 | e24883 | p. 13
(page number not for citation purposes)
XSL• FO
RenderXJOURNAL OF MEDICAL INTERNET RESEARCH Slavik et al
Furthermore, the results of our content analysis demonstrated Strengths, Limitations, and Future Work
that the risk communication strategies that we examined were One methodological advantage that sets our study apart from
not very widely used by any account type, appearing in just others is the use of tweet threads, in addition to individual
over half of the tweets that we analyzed. For example, our study tweets, as the unit of analysis, rather than analyzing each tweet
found very few tweets provided corrective information that from a thread on its own. Analyzing threads allowed for a more
could be used to tackle misinformation about COVID-19, which accurate examination of tweeting practices by recreating the
is consistent with work by Guidry et al [28] that found only 1% message as it would have been viewed originally to a Twitter
of tweets by health organizations in their sample addressed user. This was a major strength of our content analysis as it
misinformation on Ebola. These findings suggest that a lack of allowed for the entire message to be coded and analyzed, rather
corrective tweets could represent a missed opportunity for public than a small segment of it. Since threads are commonly used to
health agencies and officials to combat misinformation spread craft messages that would otherwise be impossible to fit within
during a pandemic. It is also worth noting that risk tweets a tweet’s character limit, analyzing them individually would
containing statements that would aid users in making a judgment have provided an incomplete picture.
about their risk of contracting COVID-19 or the harms
associated with COVID-19 only appeared in approximately This research has several limitations related, in large part, to its
11% of the tweets in our sample (n=51). In fact, only one reliance on Twitter data. First, we analyzed the tweets of public
category of the risk communication strategies that we examined health agencies and decision makers in Canada who had tweeted
(efficacy) appeared in at least one-third of the tweets authored between January 1 and June 30, 2020; however, there are
by all account types, a frequency that was similar to the numerous other authoritative health-related Twitter accounts
percentage of tweets containing efficacy statements about the and other official government accounts that tweeted about
Zika virus in a study of tweets authored by US public health COVID-19 during this period (eg, physicians, health
agencies [33]. On the other hand, tweets that acknowledged nongovernmental organizations, etc), which the public may
concerns about COVID-19 tended to receive among the highest have also engaged with. Moreover, not all members of the public
retweets per tweet in our study, which is consistent with risk use Twitter; therefore, engagement as measured by counts of
communication literature identifying concern as an important retweets does not offer insights into which public health agencies
strategy that aids the public in developing faith in or decision makers the broader Canadian public may consider
communicators that demonstrate compassion [31]. most important. Additionally, our results may not reflect today
or tomorrow’s Twitter landscape, and therefore only indicate
Despite the overall lack of risk communication strategies tweeting practices at a snapshot in time. However, our study
employed in the tweets in our sample, our findings demonstrate can offer a glimpse into trends on information sharing during
that including one or more strategies was associated with more the first 6 months of the COVID-19 pandemic based on what
engagement on average compared to tweets that did not contain Canadian public health agencies and decision makers were
any risk communication strategies (61 retweets per tweet versus tweeting and how Twitter users engaged with this content. Our
13 retweets per tweet, respectively). We also found that risk study’s findings can be useful to those public health accounts
communication strategies tended to be used at key moments that we included in our analysis as well as to other health
during the COVID-19 pandemic. The use of risk communication organizations or individuals that may be looking for ways to
strategies appeared to peak in the weeks just after the WHO better utilize Twitter to engage with users seeking health
declared COVID-19 a pandemic and trended slightly upward information on this platform.
after each of the two peaks of COVID-19 cases in Canada. This
finding is consistent with other studies that have found that risk The findings from our study could be improved through
communication becomes less prevalent over the course of a additional analysis of content authored by public health accounts
crisis [50], since this information is considered most valuable on other social media platforms (eg, Instagram, Facebook, etc)
at the beginning of a crisis when uncertainty is high [35]. or additional refinement of the categories we used for classifying
However, given that our understanding of COVID-19 the Twitter accounts and tweet content. For example, future
transmission and health impacts is still developing, a lack of work examining public health communications in Canada could
sustained risk communication in tweets by Canadian public build on our work by contrasting tweeting practices by province
health agencies and decision makers could be problematic if it or other geographic elements, which could uncover more trends
leads to inaccurate perceptions of personal health risks or in information sharing and engagement given the region-specific
indifference toward public health measures. administration of Canada’s public health policies. In addition,
future work in this area could explore patterns in retweeted
With so much discussion of the pandemic online, supplying tweets and perform a network analysis to examine the Twitter
information users with high-quality, consistent messaging on interactions between various public health accounts.
the health risks associated with COVID-19 is critical for
improving health literacy in the population [51]. Therefore, Conclusions
while the use of these risk communication strategies at key This study analyzed tweets by Canadian public health agencies
moments could be viewed as promising, more risk and decision makers between January 1, 2020, and June 30,
communication overall should be undertaken by all public health 2020, to examine their tweeting practices during the early stages
Twitter accounts to ensure that their audience continuously of the pandemic. We also aimed to identify ways that tweets
receives relevant, accurate, and up-to-date information on could be improved to effectively communicate risk and
potential health risks related to COVID-19. maximize engagement on this platform. Using a mixed methods
https://www.jmir.org/2021/3/e24883 J Med Internet Res 2021 | vol. 23 | iss. 3 | e24883 | p. 14
(page number not for citation purposes)
XSL• FO
RenderXYou can also read