Deriving rainfall thresholds for landsliding at the regional scale: daily and hourly resolutions, normalisation, and antecedent rainfall - NHESS
←
→
Page content transcription
If your browser does not render page correctly, please read the page content below
Nat. Hazards Earth Syst. Sci., 20, 2905–2919, 2020
https://doi.org/10.5194/nhess-20-2905-2020
© Author(s) 2020. This work is distributed under
the Creative Commons Attribution 4.0 License.

Deriving rainfall thresholds for landsliding at the regional scale:
daily and hourly resolutions, normalisation, and antecedent rainfall
Elena Leonarduzzi1,2 and Peter Molnar1
1 Institute of Environmental Engineering, ETH Zurich, Zurich, Switzerland
2 Swiss   Federal Institute for Forest, Snow and Landscape Research WSL, Birmensdorf, Switzerland

Correspondence: Elena Leonarduzzi (leonarduzzi@ifu.baug.ethz.ch)

Received: 15 April 2020 – Discussion started: 27 April 2020
Revised: 17 July 2020 – Accepted: 31 August 2020 – Published: 3 November 2020

Abstract. Rainfall thresholds are a simple and widely used         1   Introduction
method to forecast landslide occurrence. We provide a com-
prehensive data-driven assessment of the effects of rainfall       Landslides are a natural hazard that affects alpine regions
temporal resolution (hourly versus daily) on rainfall thresh-      worldwide, resulting in substantial economic losses and hu-
old performance in Switzerland, with sensitivity to two other      man casualties (Kjekstad and Highland, 2009). Landslides
important aspects which appear in many landslide studies –         can be initiated by different triggering factors but mainly
the normalisation of rainfall, which accounts for local cli-       rainfall and earthquakes. Economic losses connected to land-
matology, and the inclusion of antecedent rainfall as a proxy      sliding are estimated to be between USD 0.5 billion and 5 bil-
of soil water state prior to landsliding. We use an extensive      lion annually for the European Alps region (e.g. Salvati et al.,
landslide inventory with over 3800 events and several daily        2010; Trezzini et al., 2013; Klose, 2015; Kjekstad and High-
and hourly, station, and gridded rainfall datasets to explore      land, 2009), and similar losses are also reported for Canada
different scenarios of rainfall threshold estimation. Our re-      and the United States (e.g. Kjekstad and Highland, 2009;
sults show that although hourly rainfall did show the best         Schuster, 1996; Mirus et al., 2020). Petley (2012) carried out
predictive performance for landslides, daily data were not far     a global study over a 7-year period (2004–2010) and found
behind, and the benefits of hourly resolutions can be masked       a total of 2620 non-seismically triggered landslides causing
by the higher uncertainties in threshold estimation connected      32 322 fatalities. Clearly, the socio-economic impact of land-
to using short records. We tested the impact of several typ-       slides is large and this natural hazard requires attention in the
ical actions of users, like assigning the nearest rain gauge       form of risk mapping, better prediction, and early warning
to a landslide location and filling in unknown timing, and         systems.
we report their effects on predictive performance. We find            The focus in this work is on rainfall-induced shallow
that localisation of rainfall thresholds through normalisation     landslides, which are the predominant type of landslides in
compensates for the spatial heterogeneity in rainfall regimes      Switzerland and other alpine environments. These are land-
and landslide erosion process rates and is a good alternative      slides where the entire soil (upper regolith) fails along a
to regionalisation. On top of normalisation by mean annual         weathered bedrock interface, and they develop quickly, lead-
precipitation or a high rainfall quantile, we recommend that       ing to mass failure following soil-saturating rainfall (e.g.
non-triggering rainfall be included in rainfall threshold esti-    Highland and Bobrowsky, 2008). Despite their smaller size,
mation if possible. Finally, while antecedent rainfall thresh-     these landslides can be widespread and have the poten-
old approaches used at the local scale are not successful at the   tial to damage infrastructure (railways, roads), homes, and
regional scale, we demonstrate that there is predictive skill in   even lead to fatalities. For instance, in Switzerland, a total
antecedent rain as a proxy of soil wetness state, despite the      of EUR 520 million in damage was recorded in the period
large heterogeneity of the study domain.                           1972–2007 and 32 people lost their life due to shallow land-
                                                                   slides (Hilker et al., 2009).

Published by Copernicus Publications on behalf of the European Geosciences Union.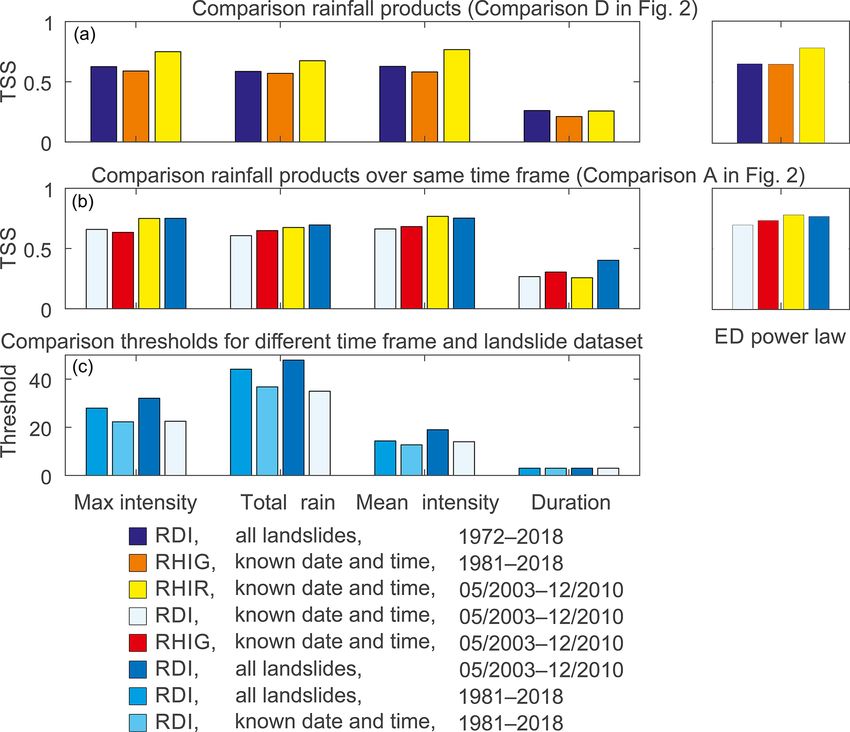
2906                      E. Leonarduzzi and P. Molnar: Deriving rainfall thresholds for landsliding at the regional scale

   One of the most widespread approaches for the prediction        able for Switzerland from MeteoSwiss. We expand the im-
of triggering conditions leading to rainfall-induced landslides    pact of temporal resolution (hourly versus daily) on land-
is that of rainfall thresholds (e.g. Stevenson, 1977; Caine,       slide prediction with sensitivity to two other important as-
1980; Guzzetti et al., 2007), which are used operationally in      pects which appear in many landslide studies: the normal-
many countries (e.g. see reviews in Guzzetti et al., 2020; Pici-   isation of rainfall, which accounts for local meteorological
ullo et al., 2018). These can be based on any rainfall property    properties (e.g. Marc et al., 2019), and the inclusion of an-
but most frequently are assumed to be power law curves in          tecedent rainfall, which provides additional information on
the intensity-duration (ID) or the total rainfall-duration (ED)    soil state prior to landsliding, typically studied at local scales
space. The reasoning behind this choice is that two differ-        (Glade et al., 2000; Godt et al., 2006; Mirus et al., 2018a,b).
ent storm types may be responsible for the initiation of land-     The objectives of the paper therefore are (a) to provide an
slides: short and intense, or long-lasting and typically less      extensive comparison between hourly and daily rainfall data
intense. Many approaches exist to formulate and estimate ID        for the definition of rainfall thresholds, considering several
or ED curves, and they differ in the accuracy of the landslide     practical consequences of choosing a higher temporal res-
inventory, the rainfall records used, the definition of rainfall   olution; (b) to compare different strategies for the normali-
events, the statistical methodology for threshold definition,      sation of rainfall thresholds; and (c) to explore whether an-
and the validation technique, among others (see review in          tecedent rainfall does provide added predictive power at the
Segoni et al., 2018).                                              regional/national scale.
   One of the main aspects in which the approaches differ
is the choice of rainfall temporal resolution, typically forced
by data availability. The short and intense events responsi-       2     Data and methods
ble for local soil saturation and triggering of landslides are
usually associated with convective activity, which can last        We use several rainfall datasets and a landslide inventory
for just a few hours (e.g. Molnar and Burlando, 2008). For         (Hilker et al., 2009) (Sect. 2.1) to derive objective landslide-
this reason, hourly thresholds are expected to be more appro-      triggering rainfall thresholds at the daily and hourly scale us-
priate for landslide prediction. There is some evidence for        ing two different statistical methods (true skill statistic max-
this in the literature. For example, Marra (2019) shows the        imisation and frequentist approach) (Sect. 2.2) and to address
underestimation of rainfall thresholds as the temporal reso-       some of the issues associated with higher temporal resolution
lution of rainfall is coarsened with a numerical experiment,       data, such as the absence of accurate timing information for
while Gariano et al. (2020) demonstrate a similar effect on        landslide occurrence (Sect. 2.3) and the lower quality (den-
a real case dataset where reported landslides are combined         sity) of rainfall data (Sect. 2.4). We follow up with methods
with rain gauge records aggregated to different temporal res-      which quantify the impact of rainfall threshold normalisa-
olutions. At the same time, daily rainfall thresholds or ID        tion (Sect. 2.5) and the added power of antecedent rainfall on
curves may also exhibit good predictive power for landslid-        landslide prediction (Sect. 2.6).
ing, e.g. as shown in a comprehensive analysis in Switzerland
(Leonarduzzi et al., 2017). So the following question arises:      2.1    Rainfall and landslide data
how does the temporal resolution of the rainfall data actually
affect landslide prediction?                                       The rainfall datasets used differ by type of measurement, du-
   We address this question with a data analysis experiment,       ration of record, and temporal and spatial resolutions (Fig. 1
where we take into account realistic conditions and conse-         and Table 1). The daily product (rainfall daily interpolated,
quences of different temporal resolutions of data. For exam-       RDI) is the longest record (1972–2018), containing daily
ple, choosing a higher resolution (e.g. hourly) has several        sums (06:00 to 06:00 am) over 1 km × 1 km cells covering
undesirable consequences: (a) rainfall records are typically       Switzerland. It is obtained by interpolating daily measure-
shorter (hourly records are only available in automatic net-       ments from approximately 420 rain gauges, using the cli-
works in more recent decades); (b) rainfall records are likely     matology (intended here as anomaly relative to the monthly
to be less dense in space, leading to poorer matching with         mean precipitation over the reference period 1971–1990),
landslide locations; and (c) landslide inventories are typically   and regionally varying precipitation–topography relationship
less rich (requiring timing and not only date of occurrence) or    (procedure explained in detail in Frei and Schär, 1998).
more uncertain, especially for older events that were recon-          The hourly station rainfall dataset (rainfall hourly gauges,
structed from newspaper articles or other indirect sources.        RHG) is the collection of the hourly rainfall time series
All these aspects have to be taken into consideration in an        measured continuously since 1981 at 45 gauges across the
objective analysis of the effects of temporal resolution on        country (green dots in Fig. 1). We use two different hourly
rainfall thresholds.                                               datasets that were derived by disaggregating the RDI such
   In this paper we undertake such an analysis with the high-      that the daily sums match that of the corresponding RDI cell
quality landslide database available in Switzerland (Hilker        at the same 1 km × 1 km resolution. The first dataset (rainfall
et al., 2009) and several high-quality rainfall records avail-     hourly interpolated gauges, RHIG) is computed by disaggre-

Nat. Hazards Earth Syst. Sci., 20, 2905–2919, 2020                                 https://doi.org/10.5194/nhess-20-2905-2020
E. Leonarduzzi and P. Molnar: Deriving rainfall thresholds for landsliding at the regional scale                                        2907

Table 1. Description of the different rainfall datasets used.

                                Rainfall daily interpo-     Rainfall hourly gauges    Rainfall hourly interpo-   Rainfall hourly interpo-
                                lated                                                 lated gauges               lated radar
    Abbreviation                RDI                         RHG                       RHIG                       RHIR
    Data source                 rain gauges                 rain gauges               rain gauges                rain gauges + radar
    Type of product             gridded (1 km2 )            gauges (Fig. 1)           gridded (1 km2 )           gridded (1 km2 )
    Temporal resolution         daily                       hourly                    hourly                     hourly
    Time frame                  1972–2018                   1981–2018                 1981–2018                  May 2003–
                                                                                                                 December 2010
    Methods                     interpolation of rain       measured                  disaggregation of RDI      disaggregation of RDI
                                gauges using climatol-                                using temporal evolu-      using temporal evolu-
                                ogy and topography                                    tion of RHG                tion of radar data
                                relationships
    Reference                   Frei and Schär (1998)       –                         –                          Wüest et al. (2010)
    Number of landslides in     2271                        1842 (634 with known      1842 (634 with known       501 (237 with known
    time frame                                              date and time)            date and time)             date and time)

Figure 1. Map and scheme of the different rainfall datasets used in the analysis. The daily interpolated product (RDI), the hourly rain gauges
(RHG), and the two derived hourly gridded products, which preserve the daily sums from RDI, but use the sub-daily temporal variability of
a radar composite (RHIR) or of the hourly rain gauges (RHIG).

gating the daily sum RDI into hourly intensities by using the             ing continuously since 1981 is quite sparse (see Fig. 1, ca. 1
hourly fractions recorded at the nearest hourly gauge (RHG).              rain gauge per 900 km2 ), and it is likely to miss heavy rainfall
The second dataset (rainfall hourly interpolated radar, RHIR)             intensities especially during convective storms.
instead uses an hourly composite of radar measurements                       The four different rainfall records (RDI, RHG, RHIG, and
NASS (Joss et al., 1998; Germann and Joss, 2004; Germann                  RHIR) are combined with the landslides extracted from the
et al., 2006) for the disaggregation (procedure explained in              Swiss flood and landslide damage database (Hilker et al.,
detail in Wüest et al., 2010). Due to the quality of the radar            2009). This databases collects floods, debris flows, land-
composite, we expect RHIR to be more accurate than RHIG                   slides, and rockfalls that produced damage in Switzerland
between stations. In fact, the hourly gauge network measur-               since 1972. Of the total reported landslides in the period

https://doi.org/10.5194/nhess-20-2905-2020                                       Nat. Hazards Earth Syst. Sci., 20, 2905–2919, 2020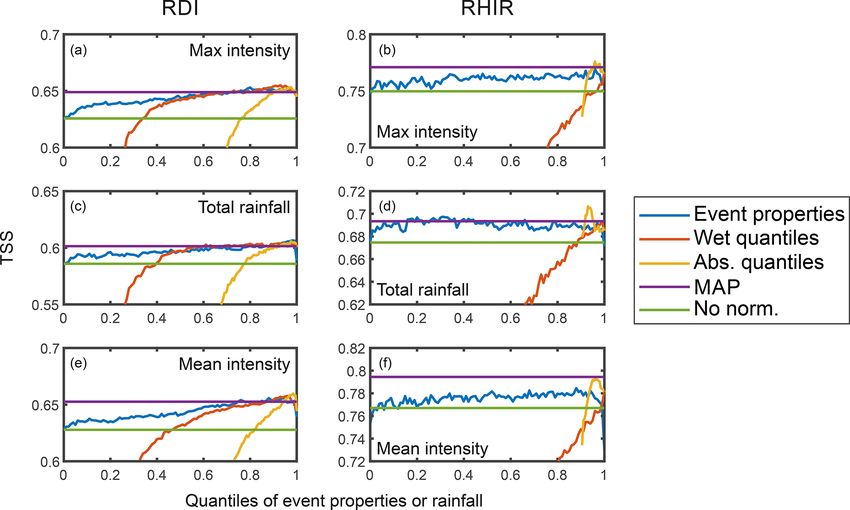
2908                      E. Leonarduzzi and P. Molnar: Deriving rainfall thresholds for landsliding at the regional scale

1972–2018 we selected those with known location and date.           2.3   Inaccurate landslide timing: triggering and peak
Then, depending on the rainfall dataset used, the time frame              intensities
is modified, and for hourly analysis a further selection is
made of the entries with known timing (number of landslides         One problem we face when utilising hourly rainfall records is
per rainfall dataset is reported in Table 1).                       that the actual timing of historical landslides is typically not
                                                                    available or very uncertain/inaccurate. For instance, Guzzetti
2.2    Rainfall thresholds
                                                                    et al. (2007) report that, out of the 2626 rainfall events asso-
The methodology for the definition of rainfall thresholds fol-      ciated with shallow slope failures globally, only 26.3 % had
lows the statistical procedure introduced in Leonarduzzi et al.     information about the date of occurrence and only 5.1 % also
(2017). First we separate the rainfall time series into events,     had information about the timing. Although a common ap-
by considering a minimum amount of dry hours between                proach to compensate for the lack of accurate landslide tim-
events. We choose 24 h for daily rainfall data and 6 h for          ing is to assign the landslide to the rainiest hour within a cer-
hourly rainfall data. The hourly inter-storm period of 6 h sep-     tain time window, the effect of this approximation is not well
arating events is selected as the one leading to the best per-      known. Peres et al. (2018) showed the potential impact of
formance (highest true skill statistic; see methodology ex-         timing and date uncertainty using synthetic databases by cou-
plained hereafter), within a range of 2–12 h, which is the          pling stochastic weather generation and a physically based
amount of dry hours expected to separate individual storms.         hydrological and slope stability model. Staley et al. (2013)
This is longer than the requirement of statistical indepen-         showed, using a precise debris-flow database, that using peak
dence between events, which Gaál et al. (2014) showed to be         rainstorm intensity instead of the actual triggering intensity
at least 2 h. This difference reflects the role that antecedent     results in an overestimation of the ID threshold.
rain plays in landslide generation.                                    We study the wrong timing effect similarly to Staley et al.
   Then we classify rainfall events as triggering events            (2013) by introducing two scenarios as alternatives to the ac-
if a landslide happens during or immediately after the              tual landslide database: one in which we assume that when
event, and non-triggering otherwise. We compute the event           the day of a landslide is known its timing is assigned to the
duration, total rainfall, mean, and maximum rainfall in-            most intense rainy hour within the day (this is the case of
tensity for each event. We then define optimal thresh-              Staley et al., 2013) and a second alternative in which the
olds for each of the precipitation characteristics by find-         timing is assigned to the rainiest hour within a 48 h window
ing the threshold that maximises the true skill statistic           centred on the actual timing recorded in the database (this
TSS = specificity + sensitivity − 1, where sensitivity is the       is a hypothetical case which considers the fact that we may
rate of true positives and specificity is the rate of true neg-     not have the right date recorded in the landslide database).
atives. Additionally we also define total rainfall E versus du-     Once the timing is altered accordingly, the modified landslide
ration D (ED) thresholds in the form of a power law func-           databases are used for the definition of ED thresholds follow-
tion, E = a · D b , by optimising the two parameters a and b        ing the same procedure as with the original true database. We
through TSS maximisation. As a reference, we provide also           carry out this exercise utilising landslides with known time of
the results for the thresholds defined following the frequen-       occurrence recorded between May 2003 and December 2010
tist approach, first introduced in Brunetti et al. (2010), which    (time frame of RHIR).
is one of the most widely used methods for ED fitting (e.g.
Peruccacci et al., 2012; Vennari et al., 2014; Gariano et al.,      2.4   Rainfall quality: gauge density and interpolation
2015; Iadanza et al., 2016; Melillo et al., 2018; Roccati et al.,
2018). The optimum threshold in this case is based on trig-         In most studies where regional rainfall thresholds are de-
gering events only. The exponent b is obtained by fitting the       fined, landslides in a region are assigned to the closest rain
ED pairs with a line in log–log space. The intercept a is ad-       gauge, sometimes taking into consideration not only distance
justed to match a chosen exceedance probability (in this pa-        (Finlay et al., 1997; Godt et al., 2006), but also similarities
per we use the 5 % exceedance probability as a reference).          in topography or other aspects important for precipitation
   For all analyses based on the gridded rainfall products, we      (e.g. Aleotti, 2004; Berti et al., 2012; Gariano et al., 2012;
consider the rainfall time series for each susceptible cell, for    Rossi et al., 2012; Melillo et al., 2018; Vennari et al., 2014).
which we define rainfall events following the procedure ex-         Nikolopoulos et al. (2015) showed that, decreasing the den-
plained above. Susceptible cells are those rainfall cells in        sity of the rain gauge network, the b parameter of the power
which at least one landslide was recorded in the respective         law ID curve on average decreases, depending on whether the
time frame of each dataset in Table 1.                              closest rain gauge is considered (nearest neighbour) or sim-
                                                                    ple interpolation methods such as inverse distance weighting
                                                                    or ordinary kriging are used. In the context of comparing the
                                                                    impacts of daily and hourly rainfall resolutions on landslide
                                                                    thresholds, we recognise that gauge density is very impor-

Nat. Hazards Earth Syst. Sci., 20, 2905–2919, 2020                                  https://doi.org/10.5194/nhess-20-2905-2020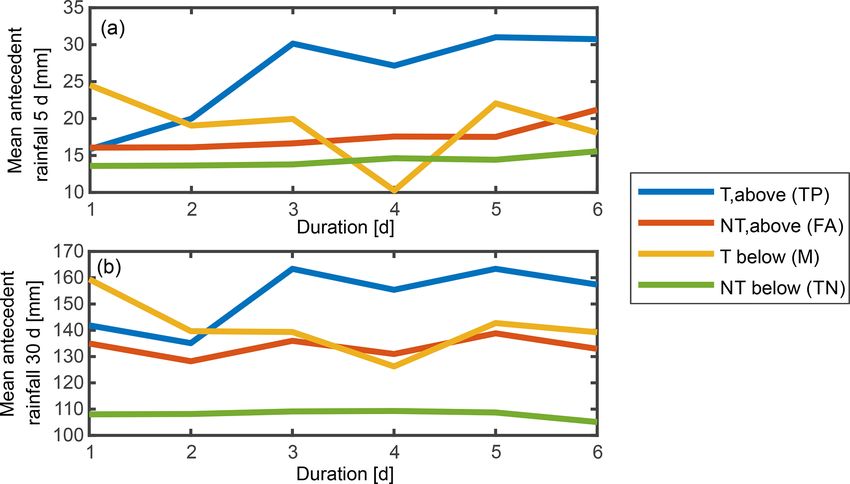
E. Leonarduzzi and P. Molnar: Deriving rainfall thresholds for landsliding at the regional scale                              2909

tant, and we construct an experiment to test the effects of        2.6   Antecedent rainfall
gauge density and accuracy of spatial interpolation.
   To do this, we define rainfall thresholds with the closest      The main criticism raised against rainfall thresholds for land-
rain gauge based on the very sparse station-based hourly rain-     sliding in general is that they only consider recent/event rain-
fall record RHG and compare it to the spatially distributed        fall, without taking into account the soil status prior to it
disaggregated dataset RHIG. The comparison shows the ef-           (e.g. Bogaard and Greco, 2018). To include this antecedent
fect of improving an hourly record obtained with a very            soil moisture state into rainfall thresholds, several ad hoc ap-
sparse network, by taking advantage of a daily dataset based       proaches have been introduced with varying levels of com-
on a much denser network and an advanced interpolation             plexity and data demand. The simplest of these consists in ac-
method in RDI (Frei and Schär, 1998), merged with hourly           cumulating rainfall over a fixed duration prior to the trigger-
station data. We propose two versions of the closest-rain-         ing event rainfall (e.g. Chleborad, 2003; Frattini et al., 2009).
gauge approach used in many studies. First we assign each          In other studies the fixed duration has been modified to ac-
landslide to the geographically closest rain gauge and then        count for vanishing memory in rainfall using the antecedent
extract rainfall events for each of the gauges which have at       precipitation index (API), which gives less weight to rainfall
least one landslide (maximum 45 rain gauges) from the RHG          contributions further back in time (e.g. Crozier and Eyles,
dataset. Second we assign to each susceptible rainfall cell (as    1980; Crozier, 1986), often relating the decay coefficient to
defined for the gridded rainfall products) the rainfall of the     the recession curves of storm hydrographs, as first suggested
closest rain gauge, and the event definition is carried out for    by Glade et al. (2000). A further development of the API
each of these cells (maximum as many cells as the number of        is the so-called antecedent wetness index, which accounts
landslides) from the RHIG dataset.                                 also for other hydrological variables by removing from an-
                                                                   tecedent rainfall the potential evapotranspiration and then
2.5   Rainfall normalisation                                       following the same approach as API (e.g. Godt et al., 2006).
                                                                   Finally, a few studies use estimates of the real antecedent soil
One of the methods suggested to improve the predictive             wetness which are based on the soil water balance (Ponziani
power of regional rainfall thresholds is to localise them. This    et al., 2012) or hydrological modelling (e.g. Segoni et al.,
can be done through regionalisation by dividing the area into      2009; Thomas et al., 2018), or obtained from on-site (e.g.
homogeneous regions and defining a different threshold for         Mirus et al., 2018b; Wicki et al., 2020) or remote sensing
each of them (e.g. Peruccacci et al., 2012; Leonarduzzi et al.,    measurements (e.g. Brocca et al., 2012; Thomas et al., 2019).
2017; Peruccacci et al., 2017) or by normalisation, which is          Here, we follow a new approach to assess the informa-
defining thresholds based on the ratio between the precipita-      tion content of antecedent rainfall, with the goal of testing
tion parameters and a local scaling value, considered to be        whether it is still recognisable over such a large and hetero-
representative of local rainfall characteristics. Typically, the   geneous area. To do this, we follow an approach opposite
property chosen is the mean annual precipitation, MAP (e.g.        to what is normally done, where events are separated into
Dahal and Hasegawa, 2008; Aleotti, 2004; Guzzetti et al.,          with and without antecedent rainfall a priori (e.g. Frattini
2007; Leonarduzzi et al., 2017; Peruccacci et al., 2017); the      et al., 2009). We start from the rainfall events, as described
rainy-day normal, RDN = MAP    n , where n is the number of        in Sect. 2.2. For each of those, we compute the antecedent 5
rainy days in a year (Guidicini and Iwasa, 1977; Wilson and        and 30 d rainfall, which is simply the sum of rainfall over
Jayko, 1997; Guzzetti et al., 2007; Postance et al., 2018); or     the N days prior to the beginning of the rainfall event it-
other precipitation characteristics (e.g. anomaly relative to      self. All these events were either observed as triggering, if a
10-year return period rainfall in Marc et al., 2019).              landslide happened during them, or non-triggering. Accord-
   In this paper we test in addition to the well established       ing to the optimised ED threshold, we can also separate them
MAP and RDN normalisations also quantiles of event prop-           into predicted triggering, above the ED power law curve, or
erties and of daily/hourly rainfall as scaling parameters. We      predicted non-triggering, below it. The intersection of these
consider both wet quantiles, which are computed only con-          predictions/observations gives us four groups of events: false
sidering rainy days/hours, and absolute quantiles, which con-      alarms, true positives, misses, and true negatives. If the an-
sider all days/hours. Note that there are fundamental differ-      tecedent rainfall is the parameter explaining the failures of
ences between scaling with MAP and absolute quantiles or           the ED threshold, we would expect that misses were asso-
RDN, event properties quantiles, and wet quantiles, in that        ciated with high antecedent rainfall and false alarms with
the former ignore intermittency of rainfall, while the latter      very low antecedent rainfall. We investigate this by aver-
are computed only from the rainy hours/days of the rainfall        aging within each of the four groups the antecedent rain-
dataset.                                                           fall for each event duration (all events of duration 1 d, all
                                                                   events of duration 2 d, etc.). We decide to do it separately for
                                                                   each event duration because we suspect there could be dif-
                                                                   ferences related to the duration, as a proxy of storm/weather
                                                                   system type. Averaging antecedent rainfall over these groups

https://doi.org/10.5194/nhess-20-2905-2020                                Nat. Hazards Earth Syst. Sci., 20, 2905–2919, 2020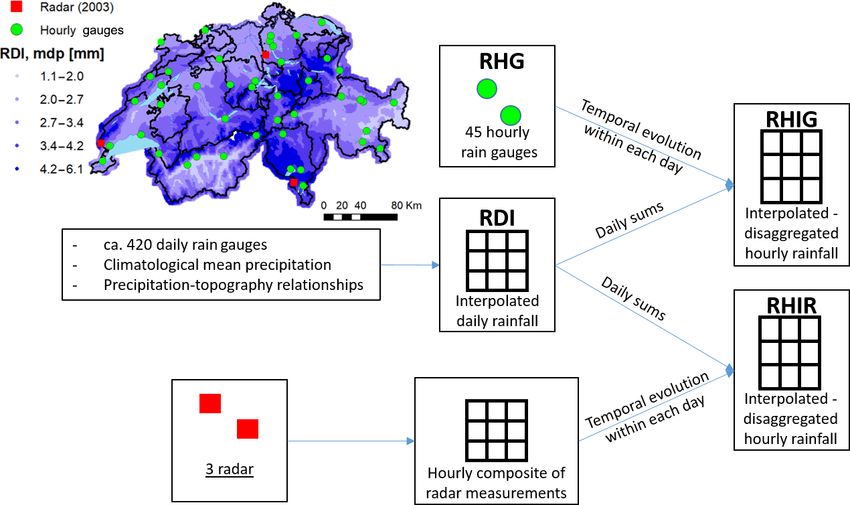
2910 E. Leonarduzzi and P. Molnar: Deriving rainfall thresholds for landsliding at the regional scale
of events and durations allows us to study the general ten- tant and that results based on shorter records are likely to be
dencies (i.e. whether antecedent wetness is generally higher less robust as they are more susceptible to individual events,
or lower) and possibly reduce the effect of heterogeneities years, outliers, or mistakenly reported landslides. This short-
unavoidable at such a regional scale. record bias is also evident when comparing daily thresh-
olds obtained using the 1981–2018 time frame or the shorter
time frame of May 2003–December 2010 for which RHIR is
3 Results available (first and third bars in Fig. 3c). The thresholds ob-
tained with the latter are higher. The reason is that in 2005,
3.1 Daily and hourly thresholds 187 landslides occurred, most of them due to a single intense
summer storm in August. Considering all 38 years (1981–
We define several rainfall thresholds by maximising TSS for 2018) the effect of that outlier year is reduced as it amounts
the different rainfall datasets, as well as the associated time to ca. 10 % of the total number of landslides available with
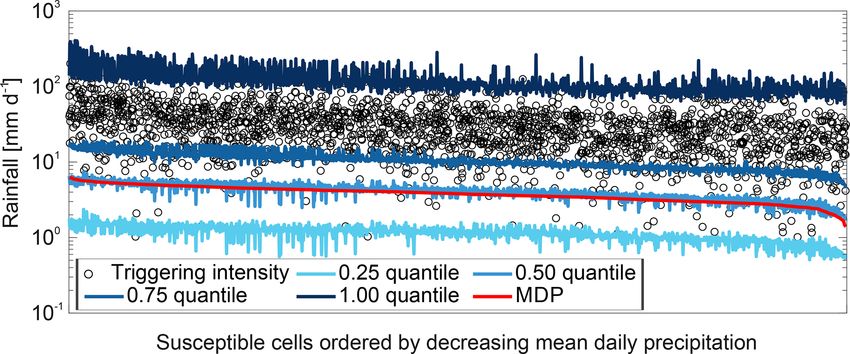
frames (Fig. 2). Comparing the results for the three differ- known timing (almost 40 % within the period May 2003–
ent rainfall products (comparison D in Fig. 2 and Fig. 3a) December 2010).
it can be seen as expected that performance is best with Final visual evidence of the lower robustness of thresh-
the high-quality hourly rainfall product which uses high- olds defined using hourly rainfall data is found in the rel-
resolution radar information for the disaggregation of daily ative frequency plots of triggering events for hourly rainfall
sums (RHIR). Disaggregation using the closest hourly rain data, compared to daily (Fig. 4b and d). The triggering events
gauge (RHIG) seems to lead to worse performance than at the hourly resolutions (634 events) are much more sparse
the corresponding daily analysis RDI (red and blue bars in than the corresponding daily events (2117 events).
Fig. 3a). However, this may be deceptive, as the time peri-
ods as well as the number of landslides behind the rainfall 3.2 Inaccurate landslide timing: triggering and peak
datasets are different. This is a critical point we investigate intensities
below.
A fairer comparison would be to compare performance Results of two different approaches are presented here to il-
over the same time period (May 2003–December 2010) and lustrate the case when historical landslide inventories have
considering the same landslide events (comparison A in no timing information available. The landslides are assigned
Fig. 2 and Fig. 3b). In this case, the differences in perfor- to the actual timing in the database, the most intense hour
mance across the different rainfall datasets become smaller. within the actual day, or the most intense hour within a 48 h
The hourly disaggregated product using radar (RHIR) still window centred around the actual timing.
leads to the best performance, but the performance with daily We defined ED thresholds using each of these modified
data (RDI) is improved even with the simple disaggregation landslide datasets (comparison B in Fig. 2). Searching for
using the closest rain gauge (RHIG), for all rainfall proper- the most intense hour within the actual day of the landslides
ties except maximum intensity. Remarkably, the daily rainfall (no. 6 in Fig. 2) leads to optimal thresholds that are not far
dataset RDI retains reasonably good predictive power despite off from the ones defined using the actual timing (no. 3 in
its coarser temporal resolution. Fig. 2). Instead, when the hour with the maximum intensity
One additional comparison that can be made in the over- is found within a 48 h window centred on the actual timing
lapping time frame (May 2003–December 2010) is with all (no. 7 in Fig. 2), the threshold changes, leading to a higher
landslide events, regardless of whether the timing is also coefficient a and smaller slope b.
known or only the date. The performance obtained with daily This observation is true for both threshold optimisation us-
data and all these events is now comparable to the one with ing TSS or following the frequentist approach, for which the
the high-quality hourly product (RHIR). The differences be- change in the threshold parameters is present also when lim-
tween the two are even more evident looking at the thresholds iting the time to the day of the landslides. The explanation
associated with the performance shown here (Fig. 3c). The for this difference is that the TSS maximisation approach
daily thresholds considering only events with known tim- for the definition of ED thresholds is relatively robust, as
ing rather than all landslides decrease to 22.5 mm d−1 for altering the timing of the landslides some triggering events
the maximum intensity (32.0 mm d−1 considering all land- might change their total rainfall and duration values, but non-
slides within the time frame), 35.0 mm for the total rainfall triggering events are unaffected. What is important is that for
(47.9 mm considering all landslides within the time frame), the TSS maximisation in both scenarios of unknown adjusted
and 14.0 mm d−1 for the mean intensity (19.0 mm d−1 con- timing, the TSS value associated with the best threshold is
sidering all landslides within the time frame). higher than if the timing was known.
While the decrease in the thresholds and performance is All the observations presented here are valid also when
consistent for all rainfall properties as the landslide dataset carrying out the same analysis over the 1981–2018 time pe-
is reduced, this is not a general result. Rather it demonstrates riod using RHIG. The TSS maximisation leads to basically
that the size and accuracy of the landslide dataset is impor- identical thresholds in the three scenarios but the TSS in-
Nat. Hazards Earth Syst. Sci., 20, 2905–2919, 2020 https://doi.org/10.5194/nhess-20-2905-2020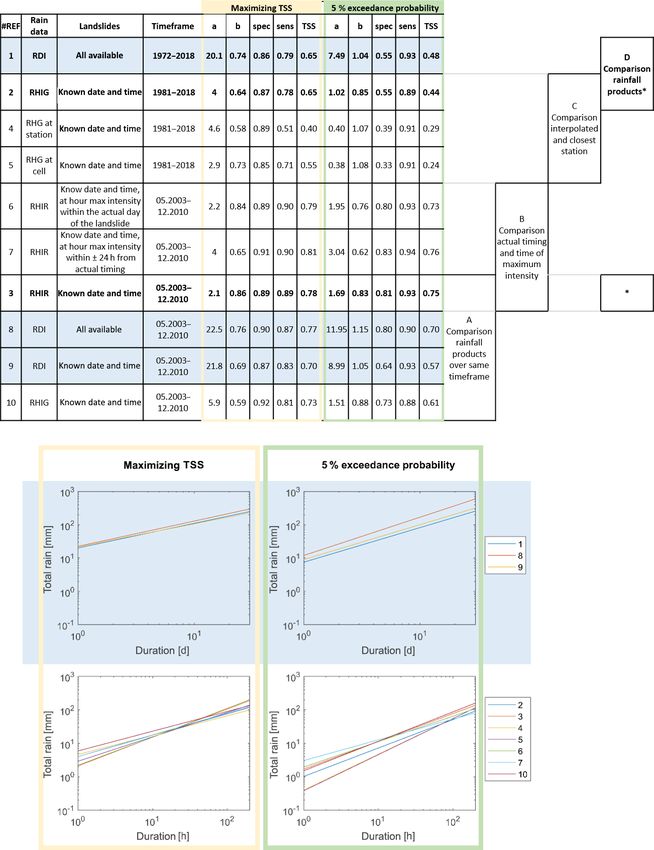
E. Leonarduzzi and P. Molnar: Deriving rainfall thresholds for landsliding at the regional scale                                        2911

Figure 2. Table containing the coefficients of the threshold power law curve in the total rainfall–duration plane obtained by maximising
the TSS, or selecting the 5 % exceedance probability line following the frequentist approach, for all the different time frames and rainfall
records. To facilitate reading, the different comparisons carried out are indicated, matching the respective results. In the bottom panel, all
the ED threshold curves are shown, separated into daily (above) and hourly (below), obtained with TSS maximisation (left) or following the
frequentist approach (right). The numbers in the legend match the “#REF” entry in the Table above.

https://doi.org/10.5194/nhess-20-2905-2020                                       Nat. Hazards Earth Syst. Sci., 20, 2905–2919, 2020
2912                        E. Leonarduzzi and P. Molnar: Deriving rainfall thresholds for landsliding at the regional scale

Figure 3. True skill statistic for the different precipitation characteristics and all the different rainfall dataset considered. (a) Comparison of
rainfall products using for each rainfall dataset the entire time frame available. (b) Comparison of the overlapping time frame (May 2003–
December 2010). The right subpanels in panels (a) and (b) show the performance of the ED power law threshold for the corresponding
datasets as reference. (c) The optimum thresholds obtained with daily rainfall data and considering all time frames and landslides with
known date and timing (known timing) or at least date (all landslides).

creases from 0.65 (actual timing) to 0.67 (most intense hour                fected. For both threshold definition methods, the threshold
within the actual date) or 0.70 (most intense hour within a                 in this case gets higher (higher a) and less steep (smaller b).
48 h window). Following the frequentist approach, the TSS
also increases from 0.44 (actual timing) to 0.51 (most intense              3.3   Rainfall quality: gauge density and interpolation
hour within the actual date) or 0.60 (most intense hour within
a 48 h window).                                                             To test the importance of the general quality of the rainfall
   This means that if we do not know the timing of landslides               dataset in the context of the daily–hourly temporal resolu-
accurately and assign them to some a priori decided rainfall                tion comparison, we use here the hourly gauge measure-
event property, then we are overestimating the landslide pre-               ments (RHG) in a sparse network and the hourly gridded
diction skill of our ED curves. Extending this to a situation               rainfall dataset (RHIG). The latter takes advantage of the
in which the actual timing is unknown and this technique is                 high-quality daily record (RDI), which is based on a denser
applied to compensate for it, while the threshold might not                 daily rain gauge network and accounts for climatology and
be very far off, the user would overestimate model perfor-                  topography (Comparison C in Fig. 2).
mance, leading to a false overconfidence in the threshold’s                    As before, the comparison between the different rainfall
predictions.                                                                datasets should not be based on the thresholds obtained,
   Nevertheless, having to make a choice between the two                    since both triggering and non-triggering events can poten-
methods of correcting timing, limiting the search of the raini-             tially change, but rather on the landslide prediction perfor-
est hour to the actual date, seems to be slightly better, with              mance associated with them. When the rain gauge rainfall
smaller overestimation of the performance (TSS) and thresh-                 record is used directly (RHG) at each (closest) landslide lo-
old curve parameters more similar to the ones obtained using                cation (no. 5 in Fig. 2) or just using one time series per
the actual timing. Considering a 48 h window not only leads                 gauge (no. 4 in Fig. 2), the sensitivity drops, and so does the
to overestimation of the TSS, but the thresholds are also af-               TSS. The two rainfall datasets (RHIG and RHG) have ex-
                                                                            actly identical hourly rainfall fractions and differ only by the

Nat. Hazards Earth Syst. Sci., 20, 2905–2919, 2020                                           https://doi.org/10.5194/nhess-20-2905-2020
E. Leonarduzzi and P. Molnar: Deriving rainfall thresholds for landsliding at the regional scale 2913
Figure 4. Total rainfall–duration (ED) plots with colour scale representing the relative frequency (a, c) of non-triggering and (b, d) of
triggering events. The lines represent the best power law curve thresholds obtained by maximising TSS, (a, b) with hourly (RHIR) and (c, d)
with daily (RDI) rainfall data.
daily sum, which for RHIG is forced to match the RDI daily corresponding event characteristic, a certain quantile of
rainfall of the corresponding cell. When using the station daily/hourly precipitation, or the mean annual precipitation is
hourly time series, the triggering rainfall events have gen- shown in Fig. 5 for the daily RDI and hourly RHIR datasets.
erally smaller event characteristics than the corresponding When searching for the event property thresholds, it seems
RHIG events. Out of total 634 events, 423 have smaller max- to be irrelevant which quantile is chosen, as the TSS seems
imum intensity, 382 have smaller mean intensity, 447 have to be only slightly fluctuating around a value somewhere be-
smaller total rainfall, and 461 have shorter duration. This re- tween the no normalisation and the mean annual precipita-
sults in a decrease in the maximum TSS of up to 0.07, mostly tion lines. Completely different behaviour is observed for the
due to a lower sensitivity (for total rain, the sensitivity drops normalisation using quantiles of hourly/daily rainfall. In that
from 0.72 to 0.63). case, performance comparable to the other cases is achieved
The same drop in performance is observed when following only for the highest quantiles, especially for absolute quan-
the frequentist approach (comparison C in Fig. 2). The TSS, tiles and for hourly data (Fig. 5b, d, and f).
which is 0.44 for the analysis using the hourly time series ad- In general, the best performance is obtained with normali-
justed with the daily product (RHIG), drops to 0.29 or 0.24, sation by mean annual precipitation. In fact, with hourly data,
depending on whether the susceptible cells or rain gauge lo- this level of performance can only be reached/exceeded for
cations are used. In this case the effect on the threshold (ED few very high rainfall quantiles of the total rainfall (wet or
curve) is also very consistent: the curves are lower (smaller absolute quantiles, Fig. 5d) or maximum intensity (absolute
a) and slightly steeper (higher b). This is a consequence of quantiles, Fig. 5b). With daily data instead, performance is
the fact that it is especially the short (intense) events that comparable with the mean daily precipitation over a wider
are missed (underestimated) when considering rainfall mea- range of quantiles (q > 0.4 for wet quantiles) of daily rain-
surements further away from the actual location of landslides fall and event properties. The performance seems to be only
(RHG rather than RDI). slightly better for the highest quantiles.
With daily rainfall, the performance of wet, which only
3.4 Rainfall normalisation considers rainy days, and absolute quantiles is only in the
range of quantiles for which performance is comparable
The improvement achieved by defining thresholds not based to the other normalisations (q > 0.4 for wet quantiles and
directly on the values of the different precipitation char- q > 0.9 for absolute quantiles). Instead, for hourly rainfall,
acteristics, but scaling them by a certain quantile of the the normalisation with the absolute quantiles peaks around
https://doi.org/10.5194/nhess-20-2905-2020 Nat. Hazards Earth Syst. Sci., 20, 2905–2919, 20202914 E. Leonarduzzi and P. Molnar: Deriving rainfall thresholds for landsliding at the regional scale
Figure 5. True skill statistic (TSS) values for the best threshold for the different normalisations, (a, c, e) for the daily (RDI) and (b, d, f) for
hourly (RHIR) rainfall data, (a, b) for maximum rainfall, (c, d) for total rain, and (e, f) for mean intensity. For the normalisation by event
properties (event properties) and quantiles of rainfall (wet and absolute), the TSS is computed for each 0.01 quantile value (x axis). For the
normalisation by mean annual precipitation (MAP) and the TSS value of the variable without normalisation (no normalisation), the constant
value of the TSS is indicated as a straight line across all x values.
a very high quantile value (q = 0.95–0.97), reaching per-
formance similar (mean intensity, Fig. 5f) or even superior
(maximum and mean intensity, Fig. 5b and d) to the MAP
normalisation.
The results for the RDN normalisation (not shown here)
are basically indistinguishable from the MAP, not in terms
of value of optimum threshold but of performance, with dif-
ferences in the TSS of the normalised optimum threshold of
less than 0.01.
The improvement of landslide prediction with normalised Figure 6. Wet quantiles of daily intensities, mean daily precipitation
rainfall thresholds is statistically demonstrated, but it de- (MDP = mean annual precipitation / 365) and maximum daily trig-
mands a physical explanation. We hypothesise that the reason gering intensities for all the susceptible cells (rainfall cells with at
lies in the fact that the rainfall regime (climate) and the lands- least one landslide). The cells are sorted (x axis) by value of MDP,
liding process (erosion) are connected through the landscape left to right from the cell with the highest to lowest MDP. Markers
balance between weathering and soil formation, as well as show the daily rainfall intensities of triggering events for each cell.
the rainfall-driven erosion of the top soil by landsliding and
other processes (e.g. Norton et al., 2014). In climates with a
highly erosive rainfall regime and high topography, the rate
of landsliding has on the long term adjusted to match the ing the differences in triggering intensities to those of mean
lower soil formation rates. Consequently, we need on aver- daily precipitation values in our data (Fig. 6). Here cells in
age higher rainfall intensities to generate landslides there. which the mean daily precipitation is higher also have gen-
The scaling of rainfall thresholds by a high-intensity rain- erally higher triggering intensities. Accounting for this in the
fall quantile corrects for landscape-scale differences between threshold definition, for example dividing the values of max-
these process rates and leads to better prediction of landslide imum intensity by the MAP of the corresponding cell, results
occurrence regionally. Evidence for this hypothesis can be in an improvement in the performance.
found in some studies (e.g. Leonarduzzi et al., 2017; Pe- It is interesting to note that most of the rainfall-
ruccacci et al., 2017) and can also be observed by compar- triggering intensities are indeed among the strongest inten-
sities recorded. Most of the triggering intensities (circles in
Nat. Hazards Earth Syst. Sci., 20, 2905–2919, 2020 https://doi.org/10.5194/nhess-20-2905-2020E. Leonarduzzi and P. Molnar: Deriving rainfall thresholds for landsliding at the regional scale 2915
Fig. 6) lie between the 0.75 and 1 wet quantiles of rainfall. 4 Discussion
This is the foundation for the success of rainfall thresholds
for landslide prediction. In the work presented here we show that the choice of the op-
timal temporal resolution for the definition of rainfall thresh-
3.5 Antecedent rainfall olds might not be a straightforward exercise and that many
more aspects should be taken into consideration before con-
Including antecedent wetness or rainfall on a re- cluding that the highest temporal resolution is best for land-
gional/national scale is not a simple task. In fact, while slide prediction.
antecedent-triggering rainfall thresholds are successful in Previous studies (e.g. Marra, 2019; Gariano et al., 2020)
many local studies (e.g. for the Seattle area, Chleborad, have focused on the effect of temporal resolution and showed
2003), the results shown in Sect. 3.4 are indicative of the that using lower temporal resolutions leads to the underesti-
heterogeneity at the regional/national scale which will make mation of the thresholds. From a theoretical point of view,
antecedent rainfall signals difficult to detect. For example, we argue that hourly rainfall data are superior to daily data
the approach suggested in Chleborad (2003) of defining as they can capture the short convective events lasting a few
thresholds based on the 3 and the 15 d prior cumulative hours, which are known to trigger landslides and which get
rainfall applied to the RDI data 1972–2018 shows no pattern averaged out in the daily sum. Also in the work presented
useful for the definition of thresholds. Nevertheless, the here, when we consider the exact same time period and land-
information content even in the simplest proxy of soil slide events, we see that performance at the hourly temporal
wetness, that is the antecedent rainfall, is clear (Bogaard and resolution is superior to that at the daily resolution, especially
Greco, 2018). for high-quality datasets (RHIR). On the other hand, we show
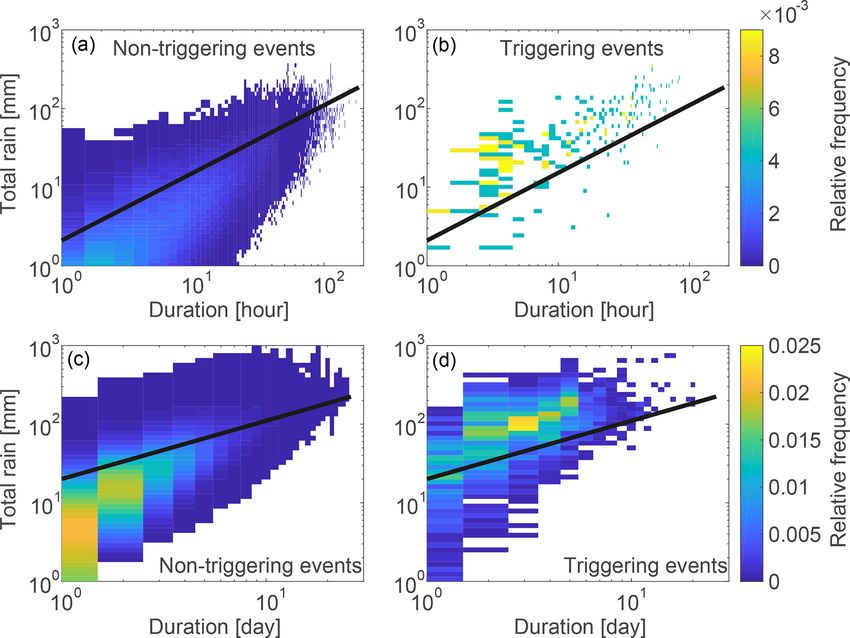
In our experiment where we separate the events into ob- with this work that there are several additional factors that
served triggering or non-triggering as well as predicted trig- should be taken into consideration.
gering or not-triggering (above or below the ED threshold Choosing hourly rainfall data usually implies dealing with
obtained by maximising TSS) and plot the mean antecedent shorter historical records, lower quality (sparser) rainfall
rainfall for 5 and 30 d periods, we can see that antecedent datasets, and less rich landslide databases. Typically, in the
rainfall can explain some of the misclassifications gener- past rain gauges were mostly recording precipitation daily,
ated by the ED threshold (Fig. 7). We expect that some of which means that the daily datasets go further back in time,
the misses (triggering events below ED curve) were actually allowing for an analysis spanning over many more years.
landslides caused by low rainfall amounts on very wet soil. Taking the example of Switzerland, since 1961 ca. 420
At the same time some false alarms (non-triggering events gauges are available for generating the RDI rainfall prod-
above ED curve) were wrongly predicted as triggering, but uct. The first hourly gauges start to appear around 1981, and
no landslide was observed due to the very low antecedent only 45 of those are consistently measuring until 2018. The
rainfall. These are exactly the patterns we observe in Fig. 7. much lower density of hourly rain gauges makes the quality
Higher intensity events are generally associated with higher of the interpolated product lower, or the distance between ob-
antecedent rainfall, due to seasonality effects (typically in the served landslide and measured rainfall locations greater, and
wetter periods of the year); the false alarms are associated therefore less representative. In recent years (ca. since 2012)
with clearly smaller antecedent rainfall than the true posi- the number of hourly gauges has increased dramatically, with
tives; and, even more importantly, the misses have, for almost 270 stations at the moment, but this would allow an analysis
all durations, higher antecedent rainfall than the false alarms. of a maximum 7 years (compared to the 48 years available
As expected, the true negative events have on average the at the daily resolution). The variability in the optimal thresh-
smallest antecedent rainfall for most durations. old for the different time periods is proof of the risk of using
The highest antecedent rainfall for misses (triggering shorter time frames (see Fig. 3c).
events below ED curve) for events of duration of 1 d could At the hourly resolution also the richness of the landslide
be indicative of the importance of antecedent conditions, ei- database is affected, as not only the date but also the tim-
ther because the wrong event has been identified as trigger- ing of the landslide must be known. Staley et al. (2013) ad-
ing or because those are really triggered due to previous high dressed this issue and showed the overestimation of thresh-
soil wetness conditions rather than the event rainfall itself. olds when considering peak rainstorm instead of triggering
However, we cannot provide evidence that this is the case. intensity. This is common practice when the actual timing of
The patterns for the 5 and 30 d antecedent rainfall look very the landslides is unknown. It generally leads to overestima-
similar, showing that the antecedent conditions are consis- tion of the triggering events’ maximum intensity but poten-
tent over longer periods. The only difference is in the true tially also other triggering events’ parameters. Here, the op-
negatives, which for the 30 d, have a much smaller mean an- timum threshold does not seem to change much, especially
tecedent rainfall than the other events. when the threshold is obtained by maximising TSS. This is
true if at least the landslide date is known. Constraining the
timing of landslides on the actual date seems a better choice
https://doi.org/10.5194/nhess-20-2905-2020 Nat. Hazards Earth Syst. Sci., 20, 2905–2919, 20202916 E. Leonarduzzi and P. Molnar: Deriving rainfall thresholds for landsliding at the regional scale Figure 7. Mean antecedent rainfall over (a) 5 or (b) 30 d before the date beginning of the event. All the rainfall events are separated into true positives (observed triggering events, T , which are above the cumulative rainfall-duration, ED, threshold), false alarms (observed non- triggering, NT, events which are above the ED threshold), misses (observed triggering events which are below the ED threshold), and true negatives (observed non-triggering which are below the ED thresholds), and the mean antecedent rainfall is computed for each of these for each rainfall event duration (1–6 d). Results are based on the RDI rainfall dataset, 1972–2018. whenever possible. Allowing a larger window (48 h centred the robustness of the obtained threshold. In fact, while the on the actual timing) leads to bigger threshold changes, both performance and the parameters of the ED curves are af- if maximising TSS or following the frequentist approach. fected using both methods, the frequentist approach seems to Nevertheless, in both cases, the performance is overestimated be more sensitive, with greater differences in optimal thresh- if the peak intensity is used to time the landslide, giving the olds and greater variability in performance (e.g. see vari- user overconfidence in the threshold values themselves. ability of the optimum ED thresholds in Fig. 2). Neverthe- Some last factors to take into consideration when choos- less, there might be conditions in which rainfall records are ing the temporal resolution are that in many countries hourly not available and only triggering events can be reconstructed records of rainfall could be even shorter and of lower qual- from newspaper and other historical records. In those condi- ity than in Switzerland, and choosing to work with daily tions, a method based only on triggering events would be the data might be even more important. Furthermore, thinking only option. of utilising rainfall thresholds in an operational setting, daily Lastly, we demonstrate the benefits of normalising the forecasts are usually more reliable than hourly forecasts (e.g. rainfall thresholds using high quantiles of rainfall intensi- Shrestha et al., 2013). ties, quantiles of event properties, MAP or RDN. These are In all the comparisons between hourly and daily rainfall, all particularly useful when using daily data, but we suggest we purposely refrained from comparing the value of the op- MAP as it is general and a widely available climatological timal thresholds and of the ED curves between hourly and variable. daily analyses. In fact, to allow this comparison, strong as- sumptions must be made, which are clearly not realistic, such as assuming that the daily intensity is 24 times the corre- 5 Conclusions sponding hourly intensity. This is in agreement with the rec- ommendation in Gariano et al. (2020) and other studies to not We define and test rainfall thresholds for triggering of land- extend daily ED or ID rainfall thresholds into the sub-daily slides by taking advantage of a rich landslide database and domain. several rainfall products available in Switzerland with the Two methods for rainfall threshold estimation were pre- main objective of providing a comparison between hourly sented here (TSS maximisation and frequentist approach) to and daily rainfall resolutions, which considers data limita- show that the threshold optimisation method used does not tions associated with choosing a higher temporal resolution. impact the main conclusions. While our work does not intend We explore the impacts of other issues, like shorter datasets, to compare the two methods, the results presented here show unknown landslide timing, and more sparse rain gauge net- clearly that accounting for non-triggering events also in the works that usually accompany higher temporal resolution definition of the threshold (e.g. maximising TSS) increases data, and we test the impacts of two typical analysis steps in Nat. Hazards Earth Syst. Sci., 20, 2905–2919, 2020 https://doi.org/10.5194/nhess-20-2905-2020
E. Leonarduzzi and P. Molnar: Deriving rainfall thresholds for landsliding at the regional scale                                      2917

threshold definition: normalisation of the threshold and an-          Author contributions. EL conducted the analysis and interpreted
tecedent rainfall.                                                    the results. PM and EL conceived the research and prepared the
   Our main findings are:                                             paper.

  – Although hourly rainfall is more appropriate for fore-
    casting landslides since it better captures triggering in-        Competing interests. The authors declare that they have no conflict
    tensities, several other aspects should be taken into con-        of interest.
    sideration before utilising it exclusively for threshold
    definition. Generally, hourly rainfall records are shorter
    (only available in recent years) and of lower quality (e.g.       Financial support. This research has been supported by the Swiss
                                                                      National Science Foundation (grant no. 165979).
    based on sparser rain gauge networks); the landslide
    database only seldom contains accurate timing.
                                                                      Review statement. This paper was edited by Thomas Glade and re-
  – In ideal conditions, hourly datasets do show the best             viewed by Francesco Marra and Ben Mirus.
    predictive performance for landslides, but daily data are
    not far behind, potentially since they tend to capture cu-
    mulative storm totals that may also be relevant for land-         References
    slide triggering. The benefits of hourly resolutions can
    be masked by the higher uncertainties in threshold es-            Aleotti, P.: A warning system for rainfall-induced shallow failures,
    timation connected to using short records and unknown                Eng. Geol., 73, 247–265, 2004.
    timing.                                                           Berti, M., Martina, M., Franceschini, S., Pignone, S., Simoni, A.,
                                                                         and Pizziolo, M.: Probabilistic rainfall thresholds for landslide
  – Whenever continuous rainfall records are available to-               occurrence using a Bayesian approach, J. Geophys. Res.-Earth,
                                                                         117, F04006, https://doi.org/10.1029/2012JF002367, 2012.
    gether with a landslide inventory, our work underscores
                                                                      Bogaard, T. and Greco, R.: Invited perspectives: Hydrological
    the importance of including non-triggering events in the             perspectives on precipitation intensity-duration thresholds
    definition of optimal rainfall thresholds, not only be-              for landslide initiation: proposing hydro-meteorological
    cause false alarms are an essential factor in warning sys-           thresholds, Nat. Hazards Earth Syst. Sci., 18, 31–39,
    tems, but also to increase the robustness of the threshold           https://doi.org/10.5194/nhess-18-31-2018, 2018.
    estimates.                                                        Brocca, L., Ponziani, F., Moramarco, T., Melone, F., Berni, N.,
                                                                         and Wagner, W.: Improving landslide forecasting using ASCAT-
  – Localisation of rainfall thresholds through normalisa-               derived soil moisture data: A case study of the Torgiovannetto
    tion is a useful procedure, which allows us to compen-               landslide in central Italy, Remote Sensing, 4, 1232–1244, 2012.
                                                                      Brunetti, M. T., Peruccacci, S., Rossi, M., Luciani, S., Valigi, D.,
    sate for the spatial heterogeneity in rainfall regimes and
                                                                         and Guzzetti, F.: Rainfall thresholds for the possible occurrence
    landslide erosion process rates. We recommend using                  of landslides in Italy, Nat. Hazards Earth Syst. Sci., 10, 447–458,
    mean annual precipitation or a high quantile of rainfall             https://doi.org/10.5194/nhess-10-447-2010, 2010.
    intensity as a normalisation factor as an alternative to          Caine, N.: The Rainfall Intensity: Duration Control of Shallow
    regionalisation.                                                     Landslides and Debris Flows, Geogr. Ann. A, 62, 23–27, 1980.
                                                                      Chleborad, A. F.: Preliminary evaluation of a precipitation thresh-
  – Antecedent rainfall as a proxy of soil wetness state can             old for anticipating the occurrence of landslides in the Seattle,
    explain some of the false alarms in rainfall thresholds,             Washington, Area, US Geological Survey open-file report, 3, 39,
    associated with lower antecedent rainfall, and some of               2003.
                                                                      Crozier, M. J. and Eyles, R. J.: Assessing the probability of rapid
    the misses, preceded by heavy rainfall, even when con-
                                                                         mass movement, in: Third Australia-New Zealand conference on
    sidering an entire (heterogeneous) country. Although                 Geomechanics: Wellington, May 12–16, 1980, Institution of Pro-
    we did not formulate new rainfall-duration curves in-                fessional Engineers New Zealand, p. 2, 1980.
    cluding antecedent rainfall, it is likely that these would        Crozier, M. J.: Landslides: Causes, Consequences & Environment,
    increase predictive skill.                                           Croom Helm, London, 1986.
                                                                      Dahal, R. K. and Hasegawa, S.: Representative rainfall thresholds
                                                                         for landslides in the Nepal Himalaya, Geomorphology, 100, 429–
Data availability. The rainfall products were provided by the Swiss      443, 2008.
Federal Office of Meteorology and Climatology MeteoSwiss (avail-      Finlay, P., Fell, R., and Maguire, P.: The relationship between the
able for research purposes upon request). The gauge time series          probability of landslide occurrence and rainfall, Can. Geotech.
were downloaded from https://gate.meteoswiss.ch/idaweb/ (Me-             J., 34, 811–824, 1997.
teoSwiss, 2019). The Swiss Federal Research Institute WSL pro-        Frattini, P., Crosta, G., and Sosio, R.: Approaches for defining
vided the landslide data (available for research purposes upon re-       thresholds and return periods for rainfall-triggered shallow land-
quest).                                                                  slides, Hydrol. Process., 23, 1444–1460, 2009.

https://doi.org/10.5194/nhess-20-2905-2020                                   Nat. Hazards Earth Syst. Sci., 20, 2905–2919, 2020
You can also read