Exposure-based risk assessment and emergency management associated with the fallout of large clasts at Mount Etna - NHESS
←
→
Page content transcription
If your browser does not render page correctly, please read the page content below
Nat. Hazards Earth Syst. Sci., 19, 589–610, 2019
https://doi.org/10.5194/nhess-19-589-2019
© Author(s) 2019. This work is distributed under
the Creative Commons Attribution 4.0 License.

Exposure-based risk assessment and emergency management
associated with the fallout of large clasts at Mount Etna
Sara Osman1 , Eduardo Rossi2 , Costanza Bonadonna2 , Corine Frischknecht2 , Daniele Andronico3 , Raffaello Cioni4 ,
and Simona Scollo3
1 School   of Earth and Environmental Sciences, University of Portsmouth, Burnaby Road, Portsmouth PO1 3QL, UK
2 Département    des Sciences de la Terre, Université de Genève, 13, Rue des Maraîchers, 1205 Geneva, Switzerland
3 Istituto Nazionale di Geofisica e Vulcanologia, Osservatorio Etneo, Piazza Roma 2, 95125 Catania, Italy
4 Dipartimento di Scienze della Terra, Università di Firenze, Via G. La Pira 4, 50121 Florence, Italy

Correspondence: Costanza Bonadonna (costanza.bonadonna@unige.ch)

Received: 28 March 2018 – Discussion started: 3 April 2018
Revised: 20 December 2018 – Accepted: 22 February 2019 – Published: 20 March 2019

Abstract. Fallout of ballistic blocks and bombs ejected from      from the umbrella cloud and the top of buoyant plumes and,
eruptive vents represents a well-known hazard in areas prox-      unless aggregated, can reach distances of hundreds of kilo-
imal to volcanoes (mostly < 5 km from the vent). However,         metres from the vent. Lapilli mostly fall out from the plume
fallout of large clasts sedimenting from plume margins that       margins within tens of kilometres from the vent, while blocks
extend to medial areas and have the potential to produce se-      and bombs ejected directly from the vent can fall ballistically
vere injuries to people and cause damage to infrastructure,       within a few kilometres or be entrained within the plume and
is often overlooked. Recent eruptive events at Mount Etna         sediment from its margins together with the coarsest lapilli
(Italy) provide a clear example where large-clast fallout from    (e.g. Bursik et al., 1992). The hazard associated with the sed-
plume margins (>5 cm) has posed a real threat both to the         imentation of ash and fine to medium lapilli (i.e. particles
many visitors reaching the summit area and to local infras-       16 mm; hereon defined as “large clasts”) has
roads, as well as 15 buildings. Evacuation on foot to a safe      never been characterized. The risk associated with the sedi-
area was estimated at almost 4 h, but this could be reduced to    mentation of large clasts from plume margins is more local-
less than 3 h if two shelters were provided. Our results show     ized than for ash and fine to medium lapilli, where the area
the importance of integrating probabilistic hazard analysis of    affected can extend over hundreds of kilometres and the im-
large-clast fallout within effective strategies of risk manage-   pact can be felt across several economic sectors, including
ment and reduction, especially in the case of volcanoes where     agriculture and transport (Jenkins et al., 2015). However, the
visitors can reach the summit areas.                              physical impact associated with ash and lapilli is rarely dan-
                                                                  gerous for people, with the exception of eye irritation and
                                                                  long-term respiratory health issues (e.g. Horwell and Bax-
                                                                  ter, 2006). The impact area associated with the sedimentation
1   Introduction                                                  of large clasts from plume margins is, however, potentially
                                                                  much larger than the area at risk of ballistic impact, which
Tephra sedimentation associated with explosive volcanic           extends no more than 5 km from the vent (e.g. Bertin, 2017;
eruptions includes particles ranging from ash (64 mm). Ash mostly falls out

Published by Copernicus Publications on behalf of the European Geosciences Union.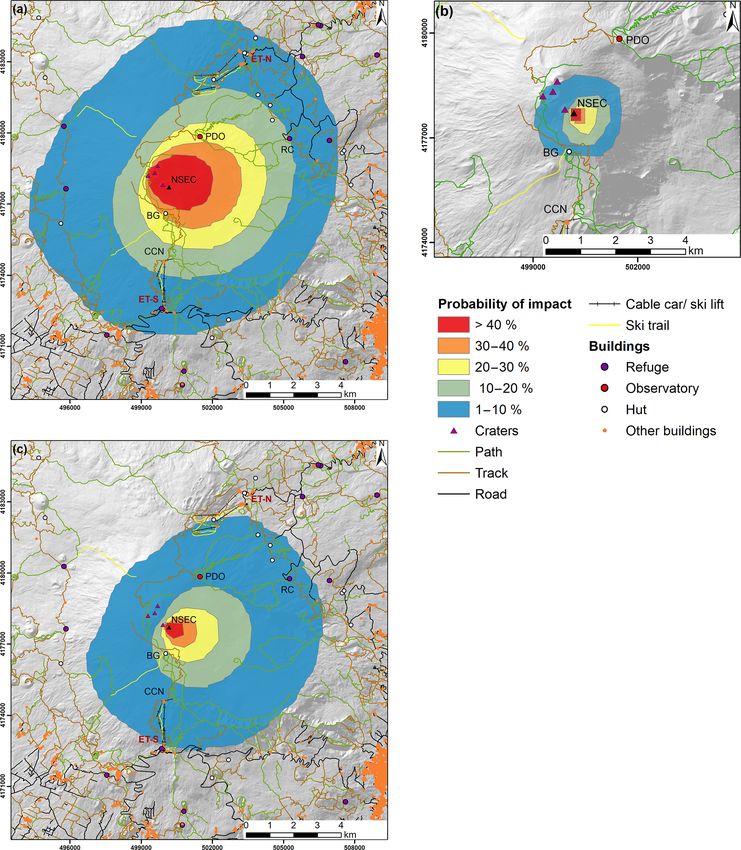
590                                            S. Osman et al.: Exposure-based risk assessment and emergency management

explosive eruptions (e.g. large lava fountains and small Vul-        published and are listed in Table S1. In order to explore the
canian events), ballistic blocks are confined in very proximal       variability of lava fountain events during which large clasts
areas (1–2 km from vent) (Calvari and Pinkerton, 2002), but          sedimented out from plume margins, two reference events
large clasts can fall out some 10 km from the eruptive vent          have been considered for which data on clast type and dis-
(Andronico et al., 2015, 2008), and this poses a particular          persal are available.
risk at Mount Etna, where many people visit the summit area             A sequence of eight eruptive events occurred between
throughout the year. This also implies a risk of damage to in-       October and December 2013 at the New Southeast Crater
frastructure, including buildings and roads (e.g. Andronico et       (NSEC). The paroxysm of 23 November 2013 was unusu-
al., 2015; Wardman et al., 2012). Impact from large clasts (up       ally explosive although the total erupted dense-rock equiva-
to tens of centimetres) is particularly evident for small explo-     lent (DRE) volume was similar to previous events (∼ 0.6 ×
sions that do not generate thick and widely dispersed tephra         106 m3 ; Bonaccorso et al., 2014). A lava fountain from 09:30
deposits, but it has also been reported for higher-intensity         to 10:10 UTC reached a height of around 1 km above the
eruptions (e.g. the Vesuvius 79 CE, 472 CE, 1631 and 1906            vent (Andronico et al., 2015) and large scoria clasts damaged
eruptions: Cioni et al., 1992; Barsotti et al., 2015; Rosi et al.,   cars at Rifugio Citelli, around 5 km from the crater (shown in
1993; Sulpizio et al., 2005; and the Soufrière Saint Vincent         Fig. 1). Large clasts were sedimented from the rising plume,
1902 eruption: Zuccaro et al., 2015). It is therefore important      with the average diameter of scoria collected near Rifugio
to assess the hazard models and probabilistic strategies.            Citelli being over 10 cm (Andronico et al., 2015).
   As an example, we present the assessment of the hazard               Deposits from a lower-intensity eruptive event on 12
associated with the sedimentation of 5 cm clasts from lava-          January 2011 were also extensively surveyed (Andronico
fountain-fed plumes at Mount Etna using the sedimentation            et al., 2014). A lava fountain from 21:50 to 23:30 UTC
model of Rossi et al. (2019). Explosive activity occurs fre-         reached around 800 m height, with an ash plume estimated
quently at the summit craters of Mount Etna, often consisting        at 9 km a.s.l. and lapilli up to 5 cm in diameter collected 5 km
of Strombolian eruptions and lava fountains (e.g. Andron-            from the vent (Andronico et al., 2014; Calvari et al., 2011;
ico et al., 2015; Corsaro et al., 2017; De Beni et al., 2015;        Donnadieu et al., 2016). Large-clast deposition from the
Vulpiani et al., 2016). Tephra fallout is a well-documented          eruptive plume is also described for many smaller lava foun-
hazard from these explosive eruptions (e.g. Donnadieu et al.,        tains, which produced less extensive ash plumes with fallout
2016; Scollo et al., 2013), and proximal to the vent there is        of large clasts confined to a small area proximal (
S. Osman et al.: Exposure-based risk assessment and emergency management 591
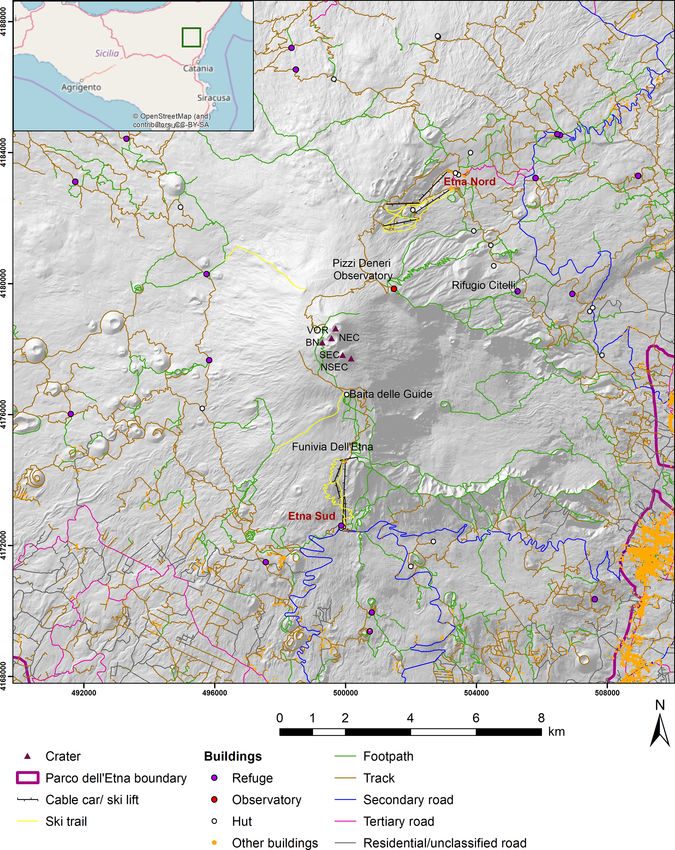
Figure 1. Infrastructure within 10 km of the summit area of Mount Etna (data from OpenStreetMap Foundation, 2017a, b). BN: Bocca
Nuova; NEC: Northeast Crater; NSEC: New Southeast Crater; SEC: Southeast Crater; VOR: Voragine.
the waiting area for tourists using four-wheel drive buses). 3 Plume modelling
The Pizzi Deneri Observatory (2847 m a.s.l.; a building used
by volcanologists for field schools, research and monitoring
We make use of the particle sedimentation model of Rossi et
activities) and Rifugio Citelli (at the end of a no-through sec-
al. (2019) in order to simulate the transport of clasts within
ondary road, used by hundreds of people especially at week-
a volcanic plume and their sedimentation. This model mod-
ends and during the ski season) are on the northern slope.
ifies the well-known methodology introduced by Carey and
Furthermore, our study also covers the infrastructure in two
Sparks (1986) in order to take into account the effects of wind
main tourist areas, i.e. Etna Sud (at 1920 m) and Etna Nord
on the eruptive column. Particles are first released into the
(at 1810 m), commonly known as Rifugio Sapienza (an area
atmosphere from the clast support envelope, a region of the
visited by up to thousands of visitors during the day) and Pi-
plume where the velocity of the gas mixture equals the termi-
ano Provenzana (a very popular ski station), respectively. Fi-
nal velocity of the clast. Clast trajectories are then computed
nally, several secondary mountain huts are also located along
solving the second law of motion in a windy atmosphere. The
tracks at mid-slopes, especially on the western and northern
model applies best to centimetre-scale particles that show a
slopes of the volcano (Fig. 1).
reduced, but not negligible, coupling with the gas mixture of
www.nat-hazards-earth-syst-sci.net/19/589/2019/ Nat. Hazards Earth Syst. Sci., 19, 589–610, 2019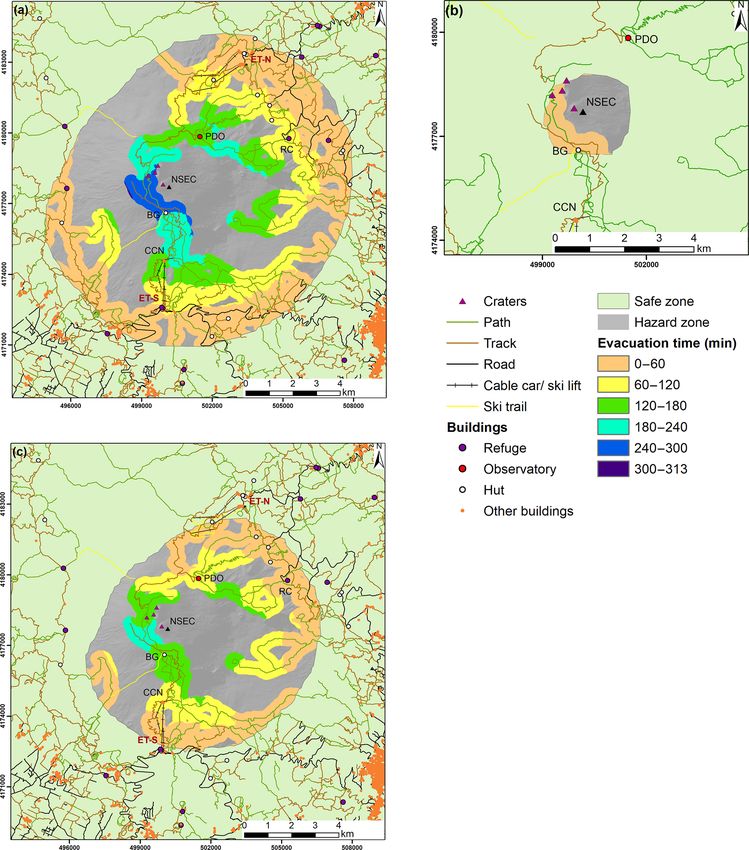
592                                             S. Osman et al.: Exposure-based risk assessment and emergency management

Table 1. Infrastructure within 10 km of the summit craters of Mount    model is run several times, with one or more of the initial
Etna (OpenStreetMap Foundation, 2017a, from 2017b). The build-         parameters selected randomly from a statistical distribution.
ings include an observatory and huts, as well as industrial, commer-   At the end of each simulation, a contour is created from the
cial and residential buildings.                                        most external points of ground impact and all grid cells in-
                                                                       side that contour are assumed to be impact locations for that
        Infrastructure type    Quantity                                simulation. When all the simulations are complete, the num-
        Footpaths              337 km                                  ber of times each grid cell has been impacted is counted and
        Unpaved tracks         589 km                                  divided by the total number of simulations, to give the prob-
        Paved roads            464 km                                  ability of impact for each cell in the grid, which can then be
        Ski trails             21 km                                   mapped.
        Cable car              1
        Ski lifts              4 (Etna Nord); 5 (Etna Sud)
        Buildings (number)     4612                                    3.2     Input data
        Buildings (area)       620 300 m2
                                                                       3.2.1    Wind data

the plume. Plume dynamics are described based on the model             Daily wind profiles taken four times a day from the National
of Degruyter and Bonadonna (2012).                                     Oceanographic and Atmospheric Administration (NOAA,
   The main inputs to the model are particle parameters, erup-         2017) were analysed for the period 1997–2015 using the
tion parameters, wind profiles and a digital elevation model           MATLAB package TephraProb (Biass et al., 2016c). Wind
(DEM) for the area being considered. The particle parame-              conditions were found to be very similar for 1 year (2013),
ters include size, density, the Stokes drag coefficient kS (for        10 years (2006–2015) and the full dataset (19 years, from
particles falling in random orientation) and the Newtonian             1997 to 2015) (see Figs. S1 to S6, for full wind analysis). Re-
drag coefficient kN (for particles falling in a gas). kS and kN        sults are also in agreement with those of Scollo et al. (2013).
are as described in Bagheri and Bonadonna (2016b). Erup-               Little seasonal difference was found for the expected plume
tion parameters include the mass eruption rate (MER) and               heights up to 15 km a.s.l., with prevailing winds towards the
the number of particles to be sedimented (described further            northeastern to south-southeastern sector. The 2006–2015
in Sect. 3.4.1). Three-dimensional wind profiles are used to           dataset was selected for the probability assessment and, given
define the wind field, which can vary with distance from the           the limited extent of large-clast fallout (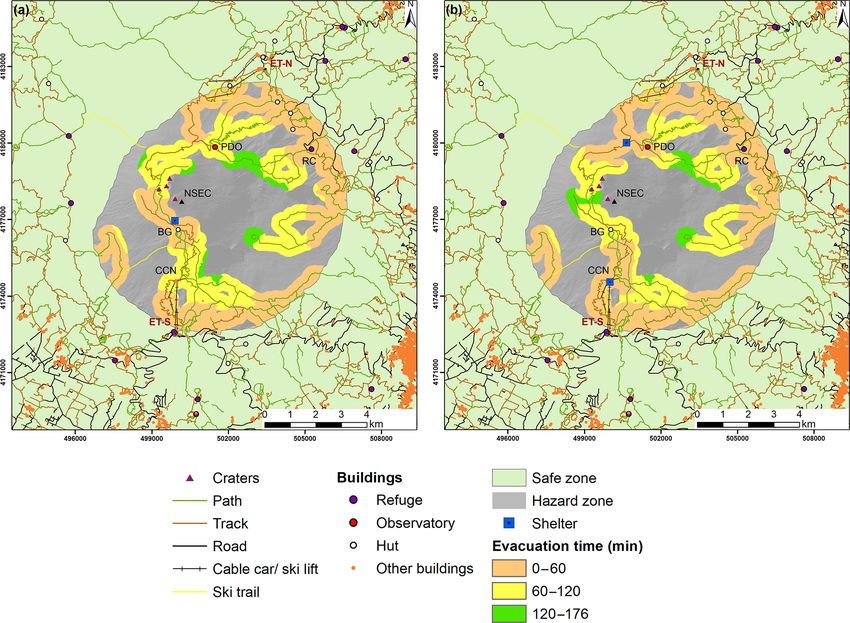
S. Osman et al.: Exposure-based risk assessment and emergency management                                                       593

3.3     Model validation and calibration                           an important variable for the hazard analysis: the lower the
                                                                   density, the larger the impacted area.
The model was validated and calibrated to the 23 Novem-
ber 2013 lava fountain by varying the modelled MER to pro-         3.4.3   Number of simulations
duce the observed plume height of 11 km a.s.l. (Corradini et
al., 2016), using wind conditions for the time of the erup-        The stability of the results in terms of the impacted area is
tion. Table B1 summarizes the model input parameters that          dependent on the number of runs used, and to test this dif-
were fixed for this study and Table B2 lists the input parame-     ferent numbers of runs were compiled for a 5 cm clast. More
ters used for the model calibration. During an eruption MER        simulations give a more stable result but, as each additional
will vary but because reported plume heights are usually the       simulation takes time, a balance must be found between con-
maximum height achieved by the plume and MER is esti-              fidence in the output and a realistic timescale for the simu-
mated based on plume height (Degruyter and Bonadonna,              lations. For very low impact probabilities (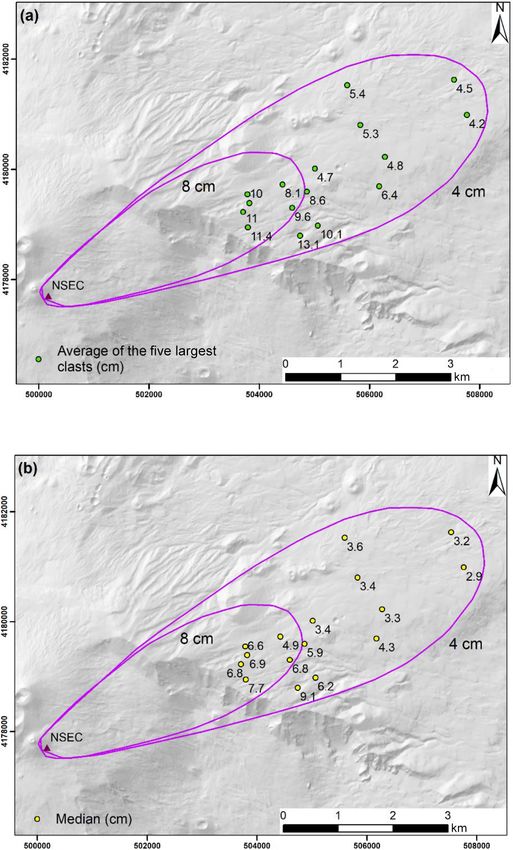
594                                         S. Osman et al.: Exposure-based risk assessment and emergency management

  – A OES for a low mass eruption rate event (OES–
    LMER) based on the 12 January 2011 lava fountain
    (MER = 2.5 × 10⁵ kg s−1 ).
  – An eruption range scenario (ERS) using a Monte Carlo
    approach where values of particle density and MER
    were randomly sampled from within a statistical distri-
    bution based on previous activity at Mount Etna (MER
    = 2.5 × 10⁵ − 5.4 × 10⁶ kg s−1 ).
   For the OESs, eruptive parameters are fixed but the wind
is selected randomly from the available dataset, while for the
ERS the eruptive parameters are also randomly selected from
an associated probability density function. The OES–HMER
event was selected as being the largest MER so far expe-
rienced from a lava fountain at Mount Etna and the OES–           Figure 2. Modelled kinetic energy on impact of 5 cm particles.
LMER event was the smallest MER likely to cause signif-
icant hazard beyond the immediate proximal area. For the
ERS, a uniform distribution was chosen for particle density,      ing the area where the probability of impact was >40 %,
but to account for small eruptions occurring more frequently      30 %–40 %, 20 %–30 %, 10 %–20 % and 1 %–10 % (Fig. 3).
than large ones, a logarithmic distribution of MER was used       Areas with probability of impact 5 cm are         fallout is unlikely to pose a risk to people or infrastructure.
defined as hazardous clasts. The damage caused by a par-
ticle on impact depends on its kinetic energy and the mod-
elled particles showed a bimodal distribution of kinetic ener-    5   Exposure analysis
gies, with peaks at 15 and 21 J and a maximum value of 46 J
(shown in Fig. 2). Biomechanical experiments have shown           The amount of infrastructure at risk was calculated for
that a dynamic load (such as a falling clast) can cause skull     each scenario. Table 3 summarizes the infrastructure ex-
fractures at energies of around 28 J (Yoganandan et al., 1995)    posed within each hazard zone for each scenario and Fig. 3
and 2 % of modelled clasts had energies above this value. A       shows the infrastructure within the hazard zone for the OES–
total of 98 % of clasts had impact energies >10 J and hence       HMER, the OES–LMER and the ERS (for the NSEC sce-
may cause building damage, as impact energies of 2 J can          nario). In order to investigate how this exposure varies for
damage glass windows and energies >10 J can penetrate roof        lava fountains from different eruption vents, the probability
tiles (Jenkins et al., 2014).                                     map for the OES–HMER at the NSEC was translated to be
   Table B3 summarizes the variable input parameters for          centred on Voragine, which is at the same height as the NSEC
each scenario, with the fixed parameters listed in Table B1.      and thus we expect particle sedimentation to follow similar
For each simulation a wind profile was randomly selected          trends (Table 3 and Supplement: Fig. S11).
from the 14 608 (four times daily for 10 years) available
in the 2006–2015 year NOAA dataset (NOAA, 2017) (Ap-
pendix C). The hazard zone, defined as the model grid cells
with a probability of impact ≥ 1 %, was classified into five
categories and for each scenario a map was produced show-

Nat. Hazards Earth Syst. Sci., 19, 589–610, 2019                           www.nat-hazards-earth-syst-sci.net/19/589/2019/
S. Osman et al.: Exposure-based risk assessment and emergency management 595
Table 2. Area within each probability category in the hazard zone (in km2 ) for the OES–HMER, OES–LMER and ERS. The hazard zone is
the area with a probability of impact from 5 cm clast ≥ 1 %.
Probability of impact OES–HMER OES–LMER ERS
for a 5 cm clast
>40 % 4.9 0.1 0.4
30 %–40 % 6.6 0.1 0.9
20 %–30 % 11.2 0.3 3.0
10 %–20 % 23.8 1.0 9.4
1 %–10 % 82.7 3.3 58.6
Total area/km2 129.2 4.8 72.3
Figure 3. Probability map showing exposure of infrastructure to impact from a 5 cm clast for (a) the OES–HMER, (b) the OES–LMER and
(c) the ERS. NSEC: New Southeast Crater. Ski areas: ET-N: Etna Nord; ET-S: Etna Sud. BG: Baita delle Guide; CCN: top station of the
Funivia dell’Etna cable car; PDO: Pizzi Deneri Observatory; RC: Rifugio Citelli.
www.nat-hazards-earth-syst-sci.net/19/589/2019/ Nat. Hazards Earth Syst. Sci., 19, 589–610, 2019596 S. Osman et al.: Exposure-based risk assessment and emergency management
Table 3. Infrastructure within the hazard zone for the OES–HMER (from the NSEC and Voragine), OES–LMER (from the NSEC) and ERS
(from the NSEC). The hazard zone is the area with a probability of impact from 5 cm clast ≥ 1 %.
Probability of impact Number of Area of Number of
of a 5 cm clast Length of different road types (km) buildings buildings (m2 ) ski lifts
Paths Tracks Roads Ski trails
OES–HMER from the NSEC
>40 % 0 0.7 0 0 0 0 0
30 %–40 % 2.5 2.3 0 0 0 0 0
20 %–30 % 16.3 2.0 0 0.7 1 7.5 0
10 %–20 % 35.3 10.1 0.9 3.8 7 1323 3
1 %–10 % 80.6 82.6 40.9 15.8 110 16 081 6
Total 134.7 97.7 41.8 20.3 118 17 411.5 9
OES–HMER from Voragine
>40 % 0.6 0 0 0 0 0 0
30 %–40 % 4.5 3.4 0 0.1 1 7.5 0
20 %–30 % 17.1 5.4 0 0.9 1 429 0
10 %–20 % 23.4 8.0 0.6 4.3 6 215 2
1 %–10 % 83.4 76.0 30.1 16.0 96 16 178 7
Total 129.0 92.8 30.7 21.3 104 16 829.5 9
OES–LMER from the NSEC
>20 % 0 0 0 0 0 0 0
10 %–20 % 0 0.2 0 0 0 0 0
1 %–10 % 3.2 2.5 0 0.2 1 7.5 0
Total 3.2 2.7 0 0.2 1 7.5 0
ERS from the NSEC
>30 % 0 0 0 0 0 0 0
20 %–30 % 0 1.5 0 0 0 0 0
10 %–20 % 7.9 3.1 0 0.1 1 7.5 0
1 %–10 % 75.0 32.6 4.5 14.3 14 2652 6
Total 82.9 37.2 4.5 14.4 15 2659.5 6
For the OES–HMER from the NSEC, no buildings are in For the OES–LMER scenario, very little infrastructure is
areas with >30 % probability of impact and the only build- at risk, with only 0.2 km roads in the 10 %–20 % probability
ing in the 20 %–30 % area is a hut (Baita delle Guide). The area and a further 5.7 km plus the Baita delle Guide hut in
seven buildings in the area with 10 %–20 % probability in- the 1 %–10 % probability area. For the ERS, no infrastruc-
clude Rifugio Citelli, the Pizzi Deneri Observatory and the ture is within the area having a probability of impact >30 %.
top station of the Funivia dell’Etna cable car. The Baita delle A total of 1.5 km of roads are in the 20 %–30 % probability
Guide hut and the observatory are both in a higher hazard area, with a further 11 km plus the Baita delle Guide hut in
category for this scenario from Voragine, although overall the 10 %–20 % probability area. A total of 112 km of roads,
fewer roads and buildings are within the total hazard zone 14 buildings, 14 km of ski trails, 6 ski lifts and the Funivia
(roads: 252.5 km compared to 274.2 km; buildings: 104 com- dell’Etna cable car are in the 1 %–10 % probability area.
pared to 118 for fountains vented from Voragine compared to
the NSEC). All the ski lifts are in the hazard zone, with two
fully within the 10 %–20 % probability area for the NSEC 6 Pedestrian evacuation analysis
eruption and only one within the same zone for the Voragine
The USGS Pedestrian Evacuation Analyst (PEA) tool (Jones
eruption. In both cases one lift crosses the 10 %–20 % and
et al., 2014) was used to estimate how long it would take for
1 %–10 % areas, as does the Funivia dell’Etna cable car, and
people at the summit to descend to a safe area for each of the
the remaining ski lifts are fully in the 1 %–10 % area.
hazard scenarios. The main inputs are as follows.
Nat. Hazards Earth Syst. Sci., 19, 589–610, 2019 www.nat-hazards-earth-syst-sci.net/19/589/2019/S. Osman et al.: Exposure-based risk assessment and emergency management 597
– A digital elevation model of the area was used (90 m 199 min with two shelters (Fig. S13). Increasing the buffer
resolution Shuttle Radar Topography Mission (SRTM) zone around footpaths to 500 m, evacuation times increased
data). to 238 and 207 min, respectively (Fig. S12). For the OES–
LMER, adding a shelter did not reduce the maximum evacu-
– The hazard area is defined here as the hazard zone de- ation time below 30 min (Fig. S14).
scribed in Sect. 4.
– The safe zone is defined as the area outside the hazard
area. 7 Discussion
– The land cover within the hazard area was used. Each 7.1 Risk assessment
land cover type is assigned a speed conservation value
(SCV) which compares the ease of walking on the vari- Large-clast fallout from plumes generated by the frequent
ous surfaces. Values vary from 0 (building) to 1 (road). lava fountains at Mount Etna poses a substantial risk to peo-
All roads, paths and tracks were assigned a value of ple and infrastructure (e.g. Andronico et al., 2015; De Beni et
1 and ski trails were not included as they are likely to al., 2015). It is therefore important to identify the area likely
be too steep to walk down. Moreover, we assumed that to be impacted and to understand how long it would take peo-
most visitors to the summit area will be within a maxi- ple to evacuate to a safe area. For large eruptions, an area of
mum distance (buffer) from a path or track. The “buffer” up to 130 km2 is in the hazard zone; roads have a probability
was set to 300 m, but to investigate sensitivity to the of impact of up to 40 % and the Funivia dell’Etna cable car is
maximum distance the OES–HMER scenario was also also at risk. The area affected depends on the eruptive vent,
run with a buffer of 500 m. As there is no detailed infor- with lava fountains at Voragine, Bocca Nuova and the NEC
mation on the terrain around each path and track, but it resulting in a hazard zone shifted further north and impacting
is likely to be slower to walk on than a road, an SCV of fewer roads and buildings, compared to events from the SEC
0.65 was assigned. and NSEC. It is important to bear in mind that even though
the majority of lava fountains over the past 5 years have oc-
– The walking speed, taken as 3.3 km h−1 , is defined as a
curred from the NSEC, more than 80 % of the eruptions oc-
slow walking speed within the PEA tool.
curring at Voragine in the past 20 years have been character-
Figure 4 shows evacuation times to reach the safe zone ized by large plumes (>10 km a.s.l.) (Andronico et al., 2015;
for each scenario, assuming people are a maximum of 300 m Bonaccorso and Calvari, 2017; Calvari and Pinkerton, 2002;
from any path. For the OES–HMER, people near to the Vulpiani et al., 2016; see also Table S1). The probabilistic
craters who are furthest from the path will take more than analysis took account of the range of MER observed in the
5 h (313 min) to reach the safe zone. The maximum evacu- recent lava fountains at Mount Etna (detailed in Table S1),
ation time for the OES–LMER is 30 min and for the ERS it but it cannot be excluded that a future event could have a
is 236 min (about 4 h). Sensitivity to the buffer size is low higher MER. However, our analysis has identified the small-
when increased to 500 m for the OES–HMER, as the max- est MER that could produce hazardous impact from 5 cm
imum time to reach the safe zone increased by only 1 min clasts (i.e. 2.5 × 10⁵ kg s−1 ), as the hazardous clast fallout
(Fig. S12). from lava fountains smaller than the OES–LMER will only
This analysis shows that for large events, people near the affect the area very proximal (≤ 2 km) to the eruptive vent.
summit would, in many cases, be several hours from safety. As well as the hazard from large-clast fallout, it is also
In addition, given that even relatively minor impact to the important to consider impact from ballistic projectiles and
skull can cause concussion, escape can be difficult (Baxter hazard from tephra fallout which may all occur simultane-
and Gresham, 1997). Hence, possible locations for one or ously during an eruption. Probabilistic modelling based on
two shelters were selected and the analysis was rerun to in- the large explosive eruption at Mount Etna on 5 January 1990
vestigate how that would reduce the time taken to reach a safe showed that tephra accumulations over 200 kg m−2 occurred
location (considering the shelters as additional safe zones). up to 10 km from the eruptive vent (Scollo et al., 2013). The
For one shelter, the location was chosen to be within the haz- area around the Funivia dell’Etna cable car had a 10 %–20 %
ard zone for the OES–LMER, so that it could be used for the probability of tephra deposit density ≥ 100 kg m−2 , and this
whole range of expected events. For two shelters, one was is the same area that had a 1 %–10 % probability of fallout of
chosen as the top station of the Funivia dell’Etna cable car 5 cm clasts in the current study. Ballistic projectiles ejected
and the second shelter was located towards the north. Fig- from the vent could also pose a hazard on the paths very close
ure 5 shows that, for the ERS, provision of one shelter re- to the summit, as happened on the Tongariro Alpine Crossing
duced the maximum evacuation time to 176 min, with only hiking trail in New Zealand in August 2012 (Fitzgerald et al.,
a minor further reduction (18 min) for two shelters. For the 2014). Modelling at La Fossa, Vulcano, Italy, also indicated
OES–HMER, the maximum evacuation time was reduced to a range of around 3 km for projectiles with sufficient impact
just under 4 h (233 min) when one shelter is provided and to energy to cause injury (Biass et al., 2016a). Large ballistic
www.nat-hazards-earth-syst-sci.net/19/589/2019/ Nat. Hazards Earth Syst. Sci., 19, 589–610, 2019598 S. Osman et al.: Exposure-based risk assessment and emergency management Figure 4. Evacuation times to reach the safe zone based on walking speed of 3.3 km h−1 , assuming people start a maximum of 300 m from any path for (a) OES–HMER, (b) OES–LMER, (c) ERS. The hazard zone is the area with a probability of impact from 5 cm clast ≥ 1 %. The safe zone includes areas with a probability of impact
S. Osman et al.: Exposure-based risk assessment and emergency management                                                            599

Figure 5. Evacuation times to reach the safe zone (for ERS) based on walking speed of 3.3 km h−1 , assuming people start a maximum of
300 m from any path, with (a) one shelter and (b) two shelters. The hazard zone is the area with a probability of impact from 5 cm clast
≥ 1 %. The safe zone includes areas with a probability of impact 5 cm) clasts from lava-fountain-
only lasts around an hour (Table S1), provision of short-term          fed plumes at Mount Etna was assessed using a new dedi-
emergency shelters near the summit could limit potential ca-           cated plume sedimentation model. The model was calibrated
sualties. The results for the ERS show that shelters could re-         using field and wind data for the largest eruption to date of
duce evacuation times by more than an hour, and further in-            a lava fountain at Mount Etna, and a probabilistic hazard as-

www.nat-hazards-earth-syst-sci.net/19/589/2019/                                  Nat. Hazards Earth Syst. Sci., 19, 589–610, 2019
600                                        S. Osman et al.: Exposure-based risk assessment and emergency management

sessment was then carried out using three scenarios. Hazard       6. The impact of an eruption from Voragine, Bocca Nuova
scenarios were based on events with high and low MER plus            or the NEC is of similar magnitude but with the affected
one scenario which sampled both a range of eruptive param-           area slightly shifted to the north (Table 3 and Fig. S11).
eters (e.g. MER, particle density) and wind conditions. The          Future work is needed to confirm how land cover (and
area at risk of impact from sedimentation of hazardous clasts        hence likely walking speed) varies across the area and
(>5 cm in diameter) was mapped for each scenario, the ex-            to understand how evacuation routes change in winter,
posed infrastructure was quantified and pedestrian evacua-           when paths may be covered in snow. The proposed ap-
tion times from the summit were investigated. From the haz-          proach could also help in locating the shelters; their
ard analysis of the NSEC we can make the following conclu-           structure and capacity should be decided by the Italian
sions.                                                               Civil Protection authorities, based on information pro-
                                                                     vided by the private companies that manage tourist ex-
 1. For the OES–HMER, the hazard zone (area with prob-               cursions to the summit, i.e. ski lifts, four-wheel drive
    ability of impact ≥ 1 %) covered an area of 129 km2              vehicles and hiking. A communication strategy would
    and extended up to 8 km from the vent. Exposed infras-           also be important to ensure that shelters do not encour-
    tructure for an eruption from the NSEC included some             age reckless behaviour, with people feeling safer about
    274 km of paths and 118 buildings, while for an erup-            going into the hazard zone when the paroxysmal phase
    tion from Voragine 235 km of paths and 104 buildings             of an eruption has started. The model has already been
    were exposed.                                                    implemented within the operational platform of Istituto
 2. For the OES–LMER, the hazard zone covered 5 km2                  Nazionale di Geofisica e Vulcanologia, Osservatorio Et-
    and extended up to 1.4 km from the vent. Exposed in-             neo (INGV-OE) for rapid daily hazard assessment for
    frastructure included 6 km of paths and only one build-          Italian Civil Protection use. The proposed methodology
    ing (a mountain hut).                                            can be easily applied to other volcanoes and results ob-
                                                                     tained for Mount Etna show how the assessment of the
 3. For the ERS, the hazard zone covered 72 km2 and ex-              hazard associated with hazardous clasts (>5 cm) from
    tended up to 6.5 km from the vent. Exposed infrastruc-           eruptive plumes should be accurately characterized, par-
    ture included some 125 km of paths and 15 buildings,             ticularly for volcanoes that are a popular destination for
    including mountain huts, an observatory and Rifugio              tourists and where visitors can reach the summit areas.
    Citelli.

 4. The maximum evacuation time for people walking              Data availability. Most of the data are made available in main ta-
    down from the summit was just under 5 h for the OES–        bles and the Supplement. Additional data are available upon re-
    HMER, almost 4 h for the ERS and 30 min for the OES–        quest, based on a collaborative agreement.
    LMER.
 5. For large eruptions, provision of one or two shelters
    could reduce maximum evacuation times by up to 2 h.

Nat. Hazards Earth Syst. Sci., 19, 589–610, 2019                         www.nat-hazards-earth-syst-sci.net/19/589/2019/
S. Osman et al.: Exposure-based risk assessment and emergency management 601
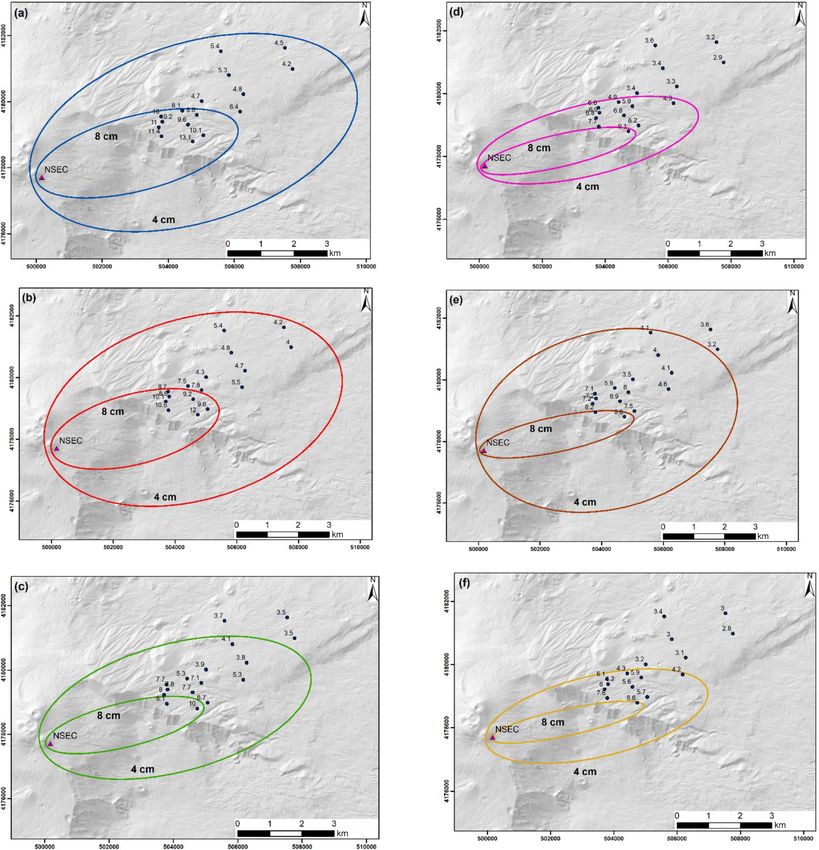
Appendix A: Field survey analysis: median versus the
average of the five largest clasts
1/3 −1/3
kS = 0.5(FS + FS ), (A4)
A detailed field survey was carried out by Russo (2016), who )]0.99
kN = 100.45[− log(FN . (A5)
measured the three axes of 10 to 15 clasts in three different
areas, each of 25 m2 , at 16 locations at different distances At individual field locations, median values were found to be
from the vent. The equivalent diameter of each clast, deq , more stable than values using the average of the largest five
was calculated using the following equation (Bagheri and clasts, confirming the results of Bonadonna et al. (2013) (Ta-
Bonadonna, 2016a): ble A1); however, over the whole sampling area both meth-
ods produced widely varying values of crosswind and down-
deq = 0.887(LI S)1/3 , (A1) wind ranges (Fig. A1 and Table A2) indicating that the use
of the median values does not improve the stability of iso-
where L, I and S are the three axes of the clasts (large, inter- pleth maps at the scale of the deposit. In addition, Fig. A2
mediate and small). Both the median and the average of the shows that modelled contours contain the median values but
largest five clasts were derived for each of the three areas and more closely match the values calculated using the average
for the three areas together in each of the 16 locations. Shape of the five largest clasts. Based on this analysis, we conclude
descriptors FS and FN were also calculated: that the use of the average of the five largest clasts for the
comparison of field data with clast sedimentation modelling
FS = f e1/3 , (A2) (e.g. Burden et al., 2011; Carey and Sparks, 1986; Rossi et
2 al., 2019) is the most appropriate and induces a variability at
FN = f e. (A3)
the level of the deposit (i.e. isopleth map) similar to that in-
duced by the median values (even though median values are
where flatness, f = S/I and elongation, e = I /L (Bagheri more stable at the level of the outcrop).
et al., 2015). The Stokes drag coefficient, kS (for particles
falling in random orientation), and the Newtonian drag co-
efficient, kN (for particles falling in a gas), were then calcu-
lated for use in the hazard analysis (Bagheri and Bonadonna,
2016b):
Table A1. Variance across the three areas of 10 to 15 clasts for each
outcrop and across the whole deposit for locations from Fig. A2.
Deposit variance indicates the average of the outcrop variance.
Median Average of the
largest five clasts
Field location Outcrop variance (%)
1 5.9 20.3
2 2.6 18.4
3 4.8 17.6
4 7.1 18.3
5 5.1 15.8
6 6.9 12.8
7 10.9 20.6
8 11.3 22.4
9 0.6 13.6
10 3.9 13.5
11 3.1 15.6
12 10.1 13.9
13 10.8 17.6
14 8.3 19.1
15 5.7 12.7
16 8.3 13.3
Deposit variance (%)
6.6 16.6
www.nat-hazards-earth-syst-sci.net/19/589/2019/ Nat. Hazards Earth Syst. Sci., 19, 589–610, 2019602 S. Osman et al.: Exposure-based risk assessment and emergency management
Table A2. Percentage discrepancy amongst downwind and crosswind distances of individual contours (as defined by Carey and Sparks,
1986) for the isopleth maps of Fig. A1. All: median or average of five clast values calculated considering all clasts from the three areas of
individual outcrops (30–45 clasts). Largest: largest median or average of five clast values of the three areas (with 10–15 clasts within each
area). Smallest: smallest median or average of five clast values of the three areas (with 10–15 clasts within each area).
Downwind Crosswind
(% discrepancy) (% discrepancy)
8 cm 4 cm 8 cm 4 cm
Median
(All – largest)×100/all −0.99 −20.00 −28.89 −149.57
(All – smallest)×100/all 0.79 0.83 3.33 −12.07
Average of the largest 5
(All – largest)×100/all 13.25 3.60 −0.89 −8.49
(All – smallest)×100/all 20.35 15.45 36.89 27.49
(Median all – average of largest 5 all)×100/median all −25.30 −41.93 −150.00 −133.62
Nat. Hazards Earth Syst. Sci., 19, 589–610, 2019 www.nat-hazards-earth-syst-sci.net/19/589/2019/S. Osman et al.: Exposure-based risk assessment and emergency management 603 Figure A1. Isopleth maps showing the contours of 4 and 8 cm clasts using different averaging strategies of field data. Note that values indicate average (a, b, c) and median (d, e, f). (a) Average of the five largest clasts, combining all three sampling areas at each location. (b) The largest value of the average of the five largest clasts out of the three sampling areas of each location. (c) The smallest value of the average of the five largest clasts out of the three sampling areas of each location. (d) The median value of the combination of all three sampling areas at each location. (e) The largest value of the median of the combination of the three sampling areas of each location. (f) The smallest value of the median of the combination of the three sampling areas of each location. www.nat-hazards-earth-syst-sci.net/19/589/2019/ Nat. Hazards Earth Syst. Sci., 19, 589–610, 2019
604                                               S. Osman et al.: Exposure-based risk assessment and emergency management

Figure A2. Comparison of modelled contours for 4 and 8 cm (compiled using the model of Rossi et al., 2019) and field data values calculated
using (a) the average of the five largest clasts (considering all three sampling areas at each location) and (b) the median values (considering all
three sampling areas at each location). Note that to facilitate the comparison, model contours are the same in both figures, while observation
data are different, i.e. average of five largest clasts and median values, respectively.

Nat. Hazards Earth Syst. Sci., 19, 589–610, 2019                                      www.nat-hazards-earth-syst-sci.net/19/589/2019/
S. Osman et al.: Exposure-based risk assessment and emergency management                                                    605

Appendix B: Model parameters

Table B1. Fixed model input parameters.

                       Radial entrainment                                       0.1
                       Wind entrainment                                         0.5
                       Relative humidity [%]                                    0
                       Brunt–Väisälä frequency of the troposphere [s−1 ]        0.01
                       Brunt–Väisälä frequency of the stratosphere [s−1 ]       0.02
                       Plume temperature [K]                                    1400
                       Mass fraction solid phase                                0.97
                       Mass fraction vapour phase                               0.03
                       Mass fraction dry-air phase                              0
                       Density of liquid water in the plume [kg m−3 ]           2000
                       Condensation                                             0.0098
                       Drag coefficient                                         Bagheri and Bonadonna (2016b)
                       Eccentricity of the ellipse for sedimentation            0.5
                       Shape factor for a gravitationally spreading plume (λ)   0.8
                       Ellipse descriptor (ε)                                   3.9
                       Specific heat capacity: dry air [J K−1 ]                 998
                       Specific heat capacity: water vapour [J K−1 ]            1952
                       Specific heat capacity: liquid water [J K−1 ]            4190
                       Specific heat capacity: solid fraction [J K−1 ]          1250
                       Latent heat of vaporization [J kg−1 ]                    2.26 × 10⁶
                       Specific gas constant: dry air [J kg−1 K−1 ]             287
                       Specific gas constant: water vapour [J kg−1 K−1 ]        461
                       Gravitational acceleration [m s−2 ]                      9.81
                       Boltzmann constant [J K−1 ]                              1.38 × 10⁻²³

www.nat-hazards-earth-syst-sci.net/19/589/2019/                                 Nat. Hazards Earth Syst. Sci., 19, 589–610, 2019
606 S. Osman et al.: Exposure-based risk assessment and emergency management
Table B2. Input parameters used to calibrate the model. NSEC: New Southeast Crater. Particle density, kS and kN are median values calcu-
lated from field data.
Vent NSEC
Eruption date 23 November 2013
Eruption start time 09:30
Eruption end time 10:10
Particle density (kg m−3 ) 865
kS 1.003803782
kN 1.320755187
Table B3. Input parameters for hazard analysis scenarios, each run with 500 particles. For all simulations vent was set to the New Southeast
Crater, particle size was 5 cm and drag coefficient values were kS = 1.003803782 and kN = 1.320755187.
Scenario Particle density MER Number of
(kg m−3 ) (kg s−1 ) simulations
OES–HMER 865 5.4 × 10⁶ 8000
OES–LMER 1000 2.5 × 10⁵ 4000
ERS 760–1000 2.5 × 10⁵ –5.4 × 10⁶ 8000
Nat. Hazards Earth Syst. Sci., 19, 589–610, 2019 www.nat-hazards-earth-syst-sci.net/19/589/2019/S. Osman et al.: Exposure-based risk assessment and emergency management 607 Appendix C: Eruption and atmospheric parameters sampled for the eruption range scenario (ERS) Figure C1. Parameters sampled for the ERS. (a) Particle density, (b) mass eruption rate, (c) plume height, (d) wind speed and direction (created in TephraProb) (Biass et al., 2016c; NOAA, 2017). Plume height depends on mass eruption rate and wind speed. Wind direction is the direction towards which the wind blows, which is indicated in degrees from north. www.nat-hazards-earth-syst-sci.net/19/589/2019/ Nat. Hazards Earth Syst. Sci., 19, 589–610, 2019
608                                              S. Osman et al.: Exposure-based risk assessment and emergency management

Supplement. The supplement related to this article is available            lava fountain, J. Volcanol. Geotherm. Res., 304, 118–125,
online at: https://doi.org/10.5194/nhess-19-589-2019-supplement.           https://doi.org/10.1016/j.jvolgeores.2015.08.007, 2015.
                                                                         Bagheri, G. and Bonadonna, C.: Aerodynamics of volcanic parti-
                                                                           cles: characterization of size, shape, and settling velocity, in: Vol-
Author contributions. SO carried out all the analysis and prepared         canic ash: hazard observation, edited by: Mackie, S., Cashman,
the manuscript. ER adapted the plume model of Rossi et al. (2019)          K., Ricketts, H., Rust, A., and Watson, M., 39–52, Elsevier, Lon-
to this case study and assisted SO in result analysis. CB designed the     don, 2016a.
project in collaboration with INGV-OE and RC and assisted SO and         Bagheri, G. and Bonadonna, C.: On the drag of freely
ER in the application of the plume model and probabilistic analysis        falling non-spherical particles, Powder Technol., 301, 526–544,
to the case study. CF assisted SO for the use of GIS and application       https://doi.org/10.1016/j.powtec.2016.06.015, 2016b.
of the USGS Pedestrian Evacuation Analyst tool as well as for the        Bagheri, G., Bonadonna, C., Manzella, I., and Vonlan-
analysis of potential impact. DA, RC and SS provided field obser-          then, P.: On the characterization of size and shape
vations and assisted in the application to the case study. All authors     of irregular particles, Powder Technol., 270, 141–153,
participated in the interpretation of results and finalization of the      https://doi.org/10.1016/j.powtec.2014.10.015, 2015.
manuscript.                                                              Barsotti, S., Neri, A., Bertagnini, A., Cioni, R., Mulas, M., and
                                                                           Mundula, F.: Dynamics and tephra dispersal of Violent Strombo-
                                                                           lian eruptions at Vesuvius: insights from field data, wind recon-
Competing interests. The authors declare that they have no conflict        struction and numerical simulation of the 1906 event, Bull. Vol-
of interest.                                                               canol., 77, 58, https://doi.org/10.1007/s00445-015-0939-6, 2015.
                                                                         Baxter, P. J. and Gresham, A.: Deaths and injuries in the eruption
                                                                           of Galeras Volcano, Colombia, 14 January 1993, J. Volcanol.
                                                                           Geotherm. Res., 77, 325–338, https://doi.org/10.1016/S0377-
Acknowledgements. The authors are grateful to Mauro Rosi and
                                                                           0273(96)00103-5, 1997.
Peter Baxter for discussion of the potential impact of large clasts
                                                                         Bertin, D.: 3-D ballistic transport of ellipsoidal volcanic projectiles
from volcanic plumes. Wim Degruyter is thanked for discussion
                                                                           considering horizontal wind field and variable shape-dependent
about plume modelling, while Sebastien Biass is thanked for
                                                                           drag coefficients, J. Geophys. Res.-Solid Earth, 122, 1126–1151,
assistance in the wind analysis. The authors are grateful to Salvo
                                                                           https://doi.org/10.1002/2016JB013320, 2017.
Spina from Ente Parco dell’Etna for providing the data on buildings
                                                                         Biass, S., Scaini, C., Bonadonna, C., Folch, A., Smith, K., and
and paths. The work formed part of an MSc project (SO). Thanks
                                                                           Höskuldsson, A.: A multi-scale risk assessment for tephra fall-
to project supervisor Malcolm Whitworth and to the University
                                                                           out and airborne concentration from multiple Icelandic volcanoes
of Geneva Swiss European Mobility Program. The work was
                                                                           – Part 1: Hazard assessment, Nat. Hazards Earth Syst. Sci., 14,
supported in the framework of the Dipartimento della Protezione
                                                                           2265–2287, https://doi.org/10.5194/nhess-14-2265-2014, 2014.
Civile–Istituto Nazionale di Geofisica e Vulcanologia Agreement
                                                                         Biass, S., Falcone, J.-L., Bonadonna, C., Di Traglia, F., Pis-
2012–2021 and by the Swiss National Science Foundation (no.
                                                                           tolesi, M., Rosi, M., and Lestuzzi, P.: Great Balls of
200021_163152). The contents of this paper represent the authors’
                                                                           Fire: A probabilistic approach to quantify the hazard re-
ideas and do not necessarily correspond to the official opinion and
                                                                           lated to ballistics – a case study at La Fossa volcano, Vul-
policies of the Italian Department of Civil Protection.
                                                                           cano Island, Italy, J. Volcanol. Geotherm. Res., 325, 1–14,
                                                                           https://doi.org/10.1016/j.jvolgeores.2016.06.006, 2016a.
Edited by: Giovanni Macedonio
                                                                         Biass, S., Bonadonna, C., di Traglia, F., Pistolesi, M., Rosi, M.,
Reviewed by: three anonymous referees
                                                                           and Lestuzzi, P.: Probabilistic evaluation of the physical im-
                                                                           pact of future tephra fallout events for the Island of Vulcano,
                                                                           Italy, Bull. Volcanol., 78, 37, https://doi.org/10.1007/s00445-
References                                                                 016-1028-1, 2016b.
                                                                         Biass, S., Bonadonna, C., Connor, L. J., and Connor, C.
Andronico, D., Cristaldi, A., and Scollo, S.: The 4–5 Septem-              B.: TephraProb: a Matlab package for probabilistic hazard
  ber 2007 lava fountain at South-East Crater of Mt                        assessments of tephra fallout, J. Appl. Volcanol., 5, 10,
  Etna, Italy, J. Volcanol. Geotherm. Res., 173, 325–328,                  https://doi.org/10.1186/s13617-016-0050-5, 2016c.
  https://doi.org/10.1016/j.jvolgeores.2008.02.004, 2008.                Bonaccorso, A. and Calvari, S.: A new approach to investigate
Andronico, D., Scollo, S., Cristaldi, A., and Ferrari, F.: Moni-           an eruptive paroxysmal sequence using camera and strain-
  toring ash emission episodes at Mt. Etna: The 16 November                meter networks: lessons from the 3–5 December 2015 activ-
  2006 case study, J. Volcanol. Geotherm. Res., 180, 123–134,              ity at Etna volcano, Earth Planet. Sc. Lett., 475, 231–241,
  https://doi.org/10.1016/j.jvolgeores.2008.10.019, 2009.                  https://doi.org/10.1016/J.EPSL.2017.07.020, 2017.
Andronico, D., Scollo, S., Cristaldi, A., and Lo Castro, M. D.:          Bonaccorso, A., Calvari, S., Linde, A., and Sacks, S.: Eruptive pro-
  Representivity of incompletely sampled fall deposits in estimat-         cesses leading to the most explosive lava fountain at Etna vol-
  ing eruption source parameters: a test using the 12–13 January           cano: the 23 November 2013 episode, Geophys. Res. Lett., 41,
  2011 lava fountain deposit from Mt. Etna volcano, Italy, Bull.           4912–4919, https://doi.org/10.1002/2014GL060623, 2014.
  Volcanol., 76, 861, https://doi.org/10.1007/s00445-014-0861-3,         Bonadonna, C.: Probabilistic modelling of tephra dispersion, in:
  2014.                                                                    Statistics in volcanology, edited by: Mader, H. M., Coles, S. G.,
Andronico, D., Scollo, S., and Cristaldi, A.: Unexpected haz-
  ards from tephra fallouts at Mt Etna: the 23 November 2013

Nat. Hazards Earth Syst. Sci., 19, 589–610, 2019                                   www.nat-hazards-earth-syst-sci.net/19/589/2019/
S. Osman et al.: Exposure-based risk assessment and emergency management 609 Connor, C. B., and Connor, L. J., 243–259, Geological Society, Donnadieu, F., Freville, P., Hervier, C., Coltelli, M., Scollo, London, 2006. S., Prestifilippo, M., Valade, S., Rivet, S., and Cacault, Bonadonna, C., Cioni, R., Pistolesi, M., Connor, C., Scollo, S., Pi- P.: Near-source Doppler radar monitoring of tephra oli, L., and Rosi, M.: Determination of the largest clast sizes plumes at Etna, J. Volcanol. Geotherm. Res., 312, 26–39, of tephra deposits for the characterization of explosive erup- https://doi.org/10.1016/j.jvolgeores.2016.01.009, 2016. tions: a study of the IAVCEI commission on tephra hazard mod- Fitzgerald, R. H., Tsunematsu, K., Kennedy, B. M., Breard, E. C. elling, Bull. Volcanol., 75, 680, https://doi.org/10.1007/s00445- P., Lube, G., Wilson, T. M., Jolly, A. D., Pawson, J., Rosenberg, 012-0680-3, 2013. M. D., and Cronin, S. J.: The application of a calibrated 3D bal- Burden, R. E., Phillips, J. C., and Hincks, T. K.: Es- listic trajectory model to ballistic hazard assessments at Upper timating volcanic plume heights from depositional Te Maari, Tongariro, J. Volcanol. Geotherm. Res., 286, 248–262, clast size, J. Geophys. Res.-Solid Earth, 116, B11206, https://doi.org/10.1016/j.jvolgeores.2014.04.006, 2014. https://doi.org/10.1029/2011JB008548, 2011. Horwell, C. J. and Baxter, P. J.: The respiratory health hazards Bursik, M. I., Sparks, R. S. J., Gilbert, J. S., and Carey, S. of volcanic ash: a review for volcanic risk mitigation, Bull. N.: Sedimentation of tephra by volcanic plumes: I. Theory Volcanol., 69, 1–24, https://doi.org/10.1007/s00445-006-0052-y, and its comparison with a study of the Fogo A plinian de- 2006. posit, Sao Miguel (Azores), Bull. Volcanol., 54, 329–344, Jenkins, S. F., Spence, R. J. S., Fonseca, J. F. B. D., https://doi.org/10.1007/BF00301486, 1992. Solidum, R. U., and Wilson, T. M.: Volcanic risk as- Calvari, S. and Pinkerton, H.: Instabilities in the summit region of sessment: quantifying physical vulnerability in the built Mount Etna during the 1999 eruption, Bull. Volcanol., 63, 526– environment, J. Volcanol. Geotherm. Res., 276, 105–120, 535, https://doi.org/10.1007/s004450100171, 2002. https://doi.org/10.1016/j.jvolgeores.2014.03.002, 2014. Calvari, S., Salerno, G. G., Spampinato, L., Gouhier, M., La Spina, Jenkins, S. F., Wilson, T., Magill, C., Miller, V., Stewart, C., Blong, A., Pecora, E., Harris, A. J. L., Labazuy, P., Biale, E., and Boschi, R., Marzocchi, W., Boulton, M., Bonadonna, C., and Costa, A.: E.: An unloading foam model to constrain Etna’s 11–13 January Volcanic ash fall hazard and risk, in: Global volcanic hazards and 2011 lava fountaining episode, J. Geophys. Res.-Solid Earth, risk, edited by: Loughlin, S. C., Sparks, R. S. J., Brown, S. K., 116, B11207, https://doi.org/10.1029/2011JB008407, 2011. Jenkins, S. F., and Vye-Brown, C., Cambridge University Press, Carey, S. and Sparks, R. S. J.: Quantitative models of the fallout and Cambridge, 2015. dispersal of tephra from volcanic eruption columns, Bull. Vol- Jones, J. M., Ng, P., and Wood, N. J.: The Pedestrian Evacuation canol., 48, 109–125, https://doi.org/10.1007/BF01046546, 1986. Analyst – geographic information systems software for modeling Cioni, R., Marianelli, P., and Sbrana, A.: Dynamics of the AD 79 hazard evacuation potential, available at: https://pubs.usgs.gov/ eruption: stratigraphic, sedimentological and geochemical data tm/11/c09/ (last access: 8 March 2019), 2014. on the successions from the Somma-Vesuvius southern and east- NOAA: NCEP reanalysis data, available at: https://www.esrl.noaa. ern sectors, Acta Vulcanol., 2, 109–123, 1992. gov/psd/data/gridded/data.ncep.reanalysis.pressure.html (last ac- Corradini, S., Montopoli, M., Guerrieri, L., Ricci, M., Scollo, S., cess: 8 March 2019), 2017. Merucci, L., Marzano, F., Pugnaghi, S., Prestifilippo, M., Ven- OpenStreetMap Foundation: OpenSnowMap shapefiles [geospatial tress, L., Grainger, R., Carboni, E., Vulpiani, G., and Coltelli, data], aAvailable at: http://www.opensnowmap.org/ (last access: M.: A multi-sensor approach for volcanic ash cloud retrieval 8 March 2019), 2017a. and eruption characterization: the 23 November 2013 Etna lava OpenStreetMap Foundation: OpenStreetMap shapefiles [geospa- fountain, Remote Sens., 8, 8, https://doi.org/10.3390/rs8010058, tial data], available at: http://download.geofabrik.de/europe.html 2016. (last access: 8 March 2019), 2017b. Corsaro, R. A., Andronico, D., Behncke, B., Branca, S., Caltabi- Parco dell’Etna: Nomination of Mount Etna for inscription in the ano, T., Ciancitto, F., Cristaldi, A., De Beni, E., La Spina, World Natural Heritage List UNESCO, available at: http://whc. A., Lodato, L., Miraglia, L., Neri, M., Salerno, G., Scollo, unesco.org/uploads/nominations/1427.pdf (last access: 8 March S., and Spata, G.: Monitoring the December 2015 sum- 2019), 2013. mit eruptions of Mt. Etna (Italy): Implications on erup- Perricone, G.: “Mount Etna”: dopo il riconoscimento Un- tive dynamics, J. Volcanol. Geotherm. Res., 341, 53–69, esco del 2013, cinquanta per cento di turisti in più, avail- https://doi.org/10.1016/j.jvolgeores.2017.04.018, 2017. able at: http://ilvulcanico.it/mount-etna-dopo-il-riconoscimento- Costa, A., Dell’Erba, F., Di Vito, M. A., Isaia, R., Macedonio, G., unesco-del-2013-cinquanta-per-cento-di-turisti-in-piu/ (last ac- Orsi, G., and Pfeiffer, T.: Tephra fallout hazard assessment at cess: 8 March 2019), 2017. the Campi Flegrei caldera (Italy), Bull. Volcanol., 71, 259–273, Rosi, M., Principe, C., and Vecci, R.: The 1631 Vesuvius https://doi.org/10.1007/s00445-008-0220-3, 2009. eruption: a reconstruction based on historical and strati- De Beni, E., Behncke, B., Branca, S., Nicolosi, I., Carluccio, graphical data, J. Volcanol. Geotherm. Res., 58, 151–182, R., D’Ajello Caracciolo, F., and Chiappini, M.: The continu- https://doi.org/10.1016/0377-0273(93)90106-2, 1993. ing story of Etna’s New Southeast Crater (2012–2014): evo- Rossi, E., Bonadonna, C., and Degruyter, W.: A new strategy for lution and volume calculations based on field surveys and the estimation of plume height from clast dispersal in various aerophotogrammetry, J. Volcanol. Geotherm. Res., 303, 175– atmospheric and eruptive conditions, Earth Planet. Sc. Lett., 505, 186, https://doi.org/10.1016/j.jvolgeores.2015.07.021, 2015. 1–12, https://doi.org/10.1016/j.epsl.2018.10.007, 2019. Degruyter, W. and Bonadonna, C.: Improving on mass flow rate es- Russo, A.: I prodotti dell’eruzione dell’Etna del 23 novembre 2013, timates of volcanic eruptions, Geophys. Res. Lett., 39, L16308, M.S. dissertation, Università degli Studi di Firenze, Florence, https://doi.org/10.1029/2012GL052566, 2012. Italy, 247 pp., 2016. www.nat-hazards-earth-syst-sci.net/19/589/2019/ Nat. Hazards Earth Syst. Sci., 19, 589–610, 2019
610                                           S. Osman et al.: Exposure-based risk assessment and emergency management

Scollo, S., Coltelli, M., Bonadonna, C., and Del Carlo, P.:         Wardman, J., Sword-Daniels, V., Stewart, C., and Wilson, T.: Im-
  Tephra hazard assessment at Mt. Etna (Italy), Nat. Hazards          pact assessment of the May 2010 eruption of Pacaya volcano,
  Earth Syst. Sci., 13, 3221–3233, https://doi.org/10.5194/nhess-     Guatemala, GNS Science, Lower Hutt, N.Z., Report 2012/09, 90
  13-3221-2013, 2013.                                                 pp., 2012.
Sulpizio, R., Mele, D., Dellino, P., and Volpe, L. La: A com-       Yoganandan, N., Pintar, F. A., Sances, A., Walsh, P. R., Ew-
  plex, Subplinian-type eruption from low-viscosity, phonolitic       ing, C. L., Thomas, D. J., and Snyder, Ri. G.: Biome-
  to tephri-phonolitic magma: the AD 472 (Pollena) erup-              chanics of skull fracture, J. Neurotrauma, 12, 659–668,
  tion of Somma-Vesuvius, Italy, Bull. Volcanol., 67, 743–767,        https://doi.org/10.1089/neu.1995.12.659, 1995.
  https://doi.org/10.1007/s00445-005-0414-x, 2005.                  Zuccaro, G., De Gregorio, D., and Baxter, P.: Human and structural
Tsunematsu, K., Chopard, B., Falcone, J.-L., and Bonadonna,           vulnerability to volcanic processes, in: Volcanic hazards, risks
  C.: A numerical model of ballistic transport with colli-            and disasters, edited by: Papale, P. and Shroder, J. F., Elsevier,
  sions in a volcanic setting, Comput. Geosci., 63, 62–69,            2015.
  https://doi.org/10.1016/j.cageo.2013.10.016, 2014.
Vulpiani, G., Ripepe, M., and Valade, S.: Mass discharge rate
  retrieval combining weather radar and thermal camera ob-
  servations, J. Geophys. Res.-Solid Earth, 121, 5679–5695,
  https://doi.org/10.1002/2016JB013191, 2016.

Nat. Hazards Earth Syst. Sci., 19, 589–610, 2019                             www.nat-hazards-earth-syst-sci.net/19/589/2019/
You can also read