Assessing the impact of acid rain and forest harvest intensity with the HD-MINTEQ model - soil chemistry of three Swedish conifer sites from 1880 ...
←
→
Page content transcription
If your browser does not render page correctly, please read the page content below
SOIL, 5, 63–77, 2019

                                                                                                      SOIL
https://doi.org/10.5194/soil-5-63-2019
© Author(s) 2019. This work is distributed under
the Creative Commons Attribution 4.0 License.

           Assessing the impact of acid rain and forest harvest
          intensity with the HD-MINTEQ model – soil chemistry
             of three Swedish conifer sites from 1880 to 2080
       Eric McGivney1,a , Jon Petter Gustafsson1,2 , Salim Belyazid3 , Therese Zetterberg4 , and Stefan Löfgren5
                    1 Department  of Sustainable Development, Environmental Science and Engineering,
                    KTH Royal Institute of Technology, Teknikringen 10B, 100 44 Stockholm, Sweden
                   2 Department of Soil and Environment, Swedish University of Agricultural Sciences,

                                            P.O. Box 7014, 750 07 Uppsala, Sweden
                 3 Department of Physical Geography, Stockholm University, 106 91 Stockholm, Sweden
                                       4 IVL Swedish Environmental Research Institute,

                                           P.O. Box 53021, 400 14 Göteborg, Sweden
             5 Department of Aquatic Sciences and Assessment, Swedish University of Agricultural Sciences,

                                            P.O. Box 7050, 750 07 Uppsala, Sweden
                     a current address: Department of Environmental Science and Analytical Chemistry

                                 (ACES), Stockholm University, 106 91 Stockholm, Sweden
                                Correspondence: Jon Petter Gustafsson (gustafjp@kth.se)

                                    Received: 8 June 2018 – Discussion started: 20 June 2018
                      Revised: 11 December 2018 – Accepted: 18 January 2019 – Published: 5 February 2019

      Abstract. Forest soils are susceptible to anthropogenic acidification. In the past, acid rain was a major contrib-
      utor to soil acidification, but, now that atmospheric levels of S have dramatically declined, concern has shifted
      towards biomass-induced acidification, i.e. decreasing soil solution pH due to tree growth and harvesting events
      that permanently remove base cations (BCs) from forest stands. We use a novel dynamic model, HD-MINTEQ
      (Husby Dynamic MINTEQ), to investigate possible long-term impacts of two theoretical future harvesting sce-
      narios in the year 2020, a conventional harvest (CH, which removes stems only), and a whole-tree harvest (WTH,
      which removes 100 % of the above-ground biomass except for stumps) on soil chemistry and weathering rates at
      three different Swedish forest sites (Aneboda, Gårdsjön, and Kindla). Furthermore, acidification following the
      harvesting events is compared to the historical acidification that took place during the 20th century due to acid
      rain. Our results show that historical acidification due to acid rain had a larger impact on pore water chemistry
      and mineral weathering than tree growth and harvesting, at least if nitrification remained at a low level. However,
      compared to a no-harvest baseline, WTH and CH significantly impacted soil chemistry. Directly after a harvest-
      ing event (CH or WTH), the soil solution pH sharply increased for 5 to 10 years before slowly declining over
      the remainder of the simulation (until year 2080). WTH acidified soils slightly more than CH, but in certain soil
      horizons there was practically no difference by the year 2080. Even though the pH in the WTH and CH scenario
      decreased with time as compared to the no-harvest scenario (NH), they did not drop to the levels observed around
      the peak of historic acidification (1980–1990), indicating that the pH decrease due to tree growth and harvesting
      would be less impactful than that of historic atmospheric acidification. Weathering rates differed across locations
      and horizons in response to historic acidification. In general, the predicted changes in weathering rates were very
      small, which can be explained by the net effect of decreased pH and increased Al3+ , which affected the weath-
      ering rate in opposite ways. Similarly, weathering rates after the harvesting scenarios in 2020 remained largely
      unchanged according to the model.

Published by Copernicus Publications on behalf of the European Geosciences Union.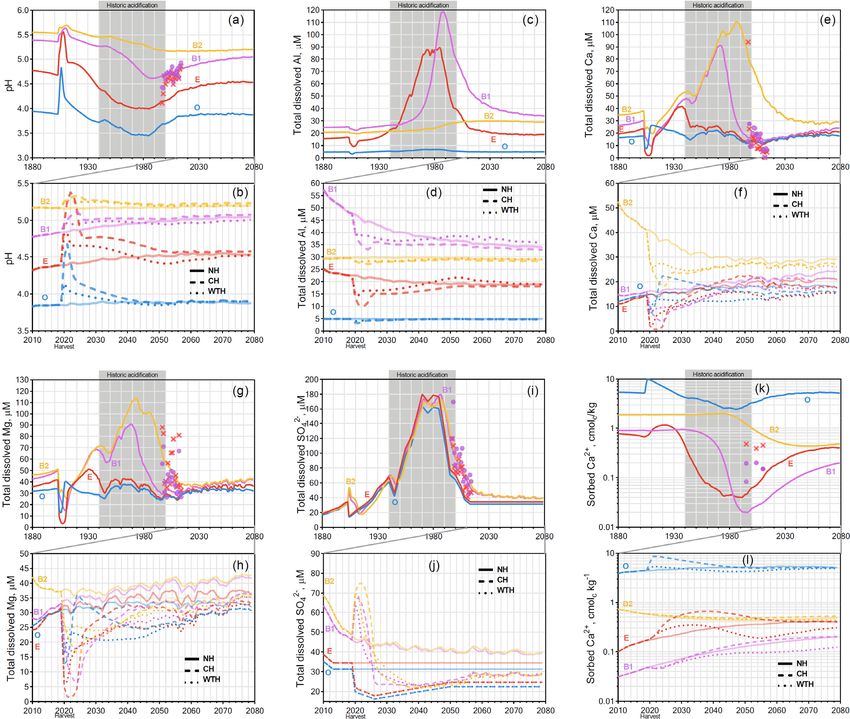
64                                          E. McGivney et al.: Assessing the impact of acid rain and forest harvest intensity

1    Introduction                                                     The objectives of this paper are to (i) investigate pos-
                                                                   sible long-term impacts of two theoretical future harvest-
                                                                   ing scenarios on the acidification and base cation status
Anthropogenic acidification has an impact on soils, streams,       using a novel dynamic model, HD-MINTEQ (Husby Dy-
organisms, agriculture, and forestry. The acidification of soils   namic MINTEQ), and (ii) compare biomass-induced acidi-
is influenced by both vegetation growth and atmospheric            fication to the historical acidification that took place during
deposition. During the 20th century, sulfur (S) deposition,        the 20th century due to acid rain. Specifically, we describe
which peaked in the 1980s, was the primary source of acidi-        the soil chemical dynamics of three different Swedish for-
fication in the acidic forest soils of the Northern Hemisphere     est stands – Aneboda, Gårdsjön, and Kindla – using HD-
(van Breemen et al., 1984). However, now that S deposition         MINTEQ (Löfgren et al., 2017) for the period 1880–2080.
has dropped to around the 1930s level throughout Western              An advantage of using the HD-MINTEQ model over,
Europe (Bertills et al., 2007; Engardt et al., 2017), focus        for example, ForSAFE and MAGIC is that the former is
has shifted towards understanding forest soil dynamics in re-      based on state-of-the-art descriptions of aluminium (Al) and
sponse to forest biomass production and different harvesting       base cation chemistry, which are probably more accurate
scenarios (Akselsson et al., 2007; Iwald et al., 2013; de Jong     (Gustafsson et al., 2018). The version used in this paper in-
et al., 2017).                                                     corporates the BC release kinetics from the PROFILE weath-
   Tree growth acidifies the soil through the net uptake of        ering model (Sverdrup and Warfvinge, 1993).
cations over anions, which results in an accumulation of H+           In the following, we first use historical data to model the
in the form of organic acids (Nilsson et al., 1982). Forests       soil chemistry dynamics from 1880 through 2080 assuming
that are recurrently harvested for lumber and paper produc-        that there are no harvesting events in the future. Modelled re-
tion are especially susceptible to biomass-induced acidifica-      sults are compared to measured soil water data for the period
tion, such as those in northern Europe. Mass balance cal-          1993 to 2010. Next we modelled the effects of two differ-
culations show considerable losses of base cations Ca2+ ,          ent harvesting intensities in 2020: conventional harvest (CH),
Mg2+ , Na+ , and K+ (BCs) due to forest management prac-           which removes stems only, and a whole-tree harvest, which
tices, which may have strong acidifying effects on soils of        in addition to stems also removes tops and branches. The pa-
base-poor mineralogy (Akselsson et al., 2007; Iwald et al.,        rameters in focus are soil solution pH, soil solution BC con-
2013). Therefore, there is a need to develop sustainable           centration, Ca2+ sorption, and weathering rates.
forestry practices in which the net losses of BCs are mini-
mized to avoid acidification and long-term depletion of BCs
                                                                   2     Methods
(Vadeboncoeur et al., 2014).
   Models that can accurately predict forest soil chemistry
                                                                   2.1    HD-MINTEQ
based on uptake trends, plant growth, mineral weathering,
harvesting scenarios, and deposition rates are powerful in as-     Simulations were run using the Husby Dynamic MINTEQ
sessing the susceptibility of soils to biomass-induced acid-       model (HD-MINTEQ), which connects the equilibrium cal-
ification. Dynamic soil chemistry models such as MAGIC             culations of Visual MINTEQ version 3.1 (Gustafsson, 2018);
(Cosby et al., 1985, 2001) and ForSAFE (Wallman et al.,            the simple mass balance model (Sverdrup and De Vries,
2005) have been used in the past, where both models were           1994); and the PROFILE model for soil chemical weath-
applied to Swedish forest stands. Due to historic data collec-     ering (Sverdrup and Warfvinge, 1993). The details of HD-
tion and well-documented forestry practices, Swedish forests       MINTEQ have previously been described by Löfgren et
provide an excellent setting to develop and validate such          al. (2017) and in a companion paper by Gustafsson et
models. For example, Belyazid et al. (2006) used ForSAFE           al. (2018). In brief, it relies on the Stockholm Humic
to simulate changes in soil chemistry relative to atmospheric      Model (SHM) for organic complexation (Gustafsson, 2001;
deposition at 16 different forest sites across Sweden and          Gustafsson and Kleja, 2005). The model assumes that the
showed that enhanced tree growth due to elevated nitrogen          equilibria for ferrihydrite and Al(OH)3 provide the upper
deposition could delay or even reverse the recovery of soils       limit for the solubility of Fe3+ and Al3+ in mineral soil hori-
from acidification caused by the historical acid deposition.       zons. Further, it uses an extended Freundlich model to simu-
In another study, Zetterberg et al. (2014) used MAGIC to           late SO4 adsorption (Gustafsson et al., 2015). HD-MINTEQ
simulate changes in soil Ca2+ pools and stream acid neutral-       does not simulate N chemistry; instead dissolved NH+    4 and
izing capacity at multiple harvest scenarios for three differ-     NO− 3  in the  different horizons are given as input data  and
ent Swedish forest stands. In a complementing study, based         are held constant (Table 1). The soil pools of organic C
on data from three Swedish experimental sites with stem-           and geochemically active Al were assumed to be constant
only and whole-tree harvest (WTH) treatments, it was found         over the simulated time period. To deal with water transport,
that MAGIC exaggerated the Ca2+ loss due to harvesting be-         HD-MINTEQ uses a 1-D advective–dispersive equation, al-
tween 1990 and 2013 (Zetterberg et al., 2016).                     though the actual dispersion is often governed by the thick-

SOIL, 5, 63–77, 2019                                                                           www.soil-journal.net/5/63/2019/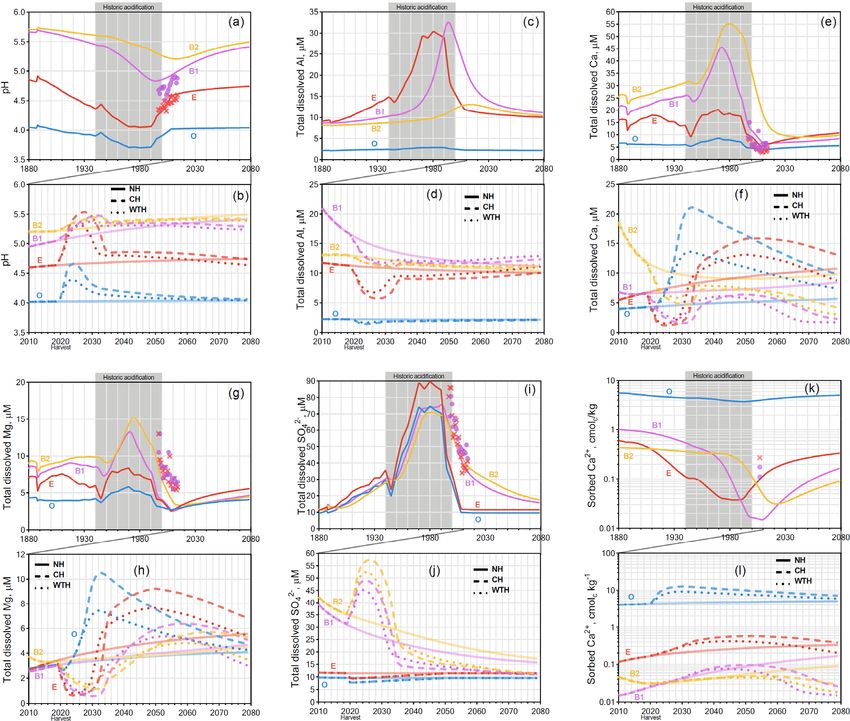
E. McGivney et al.: Assessing the impact of acid rain and forest harvest intensity                                             65

ness of the modelled soil layers. Vertical flow is assumed,      used (Ferm and Hultberg, 1995, 1999). Reductions of the to-
which should be a reasonable approximation for the studied       tal deposition as a result of harvesting were considered using
soils, as they were located in recharge areas where the soil     functions of Zetterberg et al. (2014). CH and WTH scenarios
surface was nearly flat. The plant uptake is distributed over    used the same deposition profiles, represented by the dotted
the two or three uppermost layers, as in the SAFE model of       lines in Fig. S2. In the NH scenario, deposition values were
Warfvinge et al. (1993).                                         maintained at 2019 levels from 2020 through 2080. The rel-
                                                                 atively high levels of Na and Cl deposition at Gårdsjön were
2.2   Model setup                                                due to its proximity to the sea. The dips in deposition at Gård-
                                                                 sjön in the early 1900s and Kindla around 1890 were due to
In the current application of the HD-MINTEQ model, the           historical harvesting events. The dips that occur in 2020 were
soils were compartmentalized into four different discrete        due to the simulated harvest scenarios. Following the rise and
horizons: an organic horizon (O), an eluvial layer (E), and      fall of SO4 throughout the 20th century (grey shaded and la-
two illuvial subsoil horizons (B1 and B2). Simulations were      belled “historical acidification”) at all three sites, the influ-
run over a 200-year period from 1880 to 2080, with a 1-week      ence of industrial emissions and subsequent regulations can
time step. Three different forest stands were simulated –        be clearly seen. Currently, the SO4 deposition is similar to
Aneboda (57◦ 050 N 12◦ 320 E), Gårdsjön (58◦ 400 N 12◦ 300 E),   the levels observed in the 1930s.
and Kindla (59◦ 050 N 12◦ 010 E) (Fig. S1 in the Supplement)
– under three different harvest scenarios:
                                                                 2.4   Plant uptake
 1. conventional harvest (stem-only removal),
                                                                 BC uptake trends at Kindla and Aneboda (Fig. S3) were
 2. whole-tree harvest (100 % removal of above-ground
                                                                 calculated as described previously (Zetterberg et al., 2014).
    logging residues), and
                                                                 Briefly, biomass at any given time point was used to al-
 3. no-harvest control (NH).                                     locate the cation amount over time according to classical
                                                                 growth curves and information regarding any natural event
At all three cites, the harvest events occurred in the           (e.g. storms and fire) or silvicultural measures (e.g. clear-
year 2020.                                                       cutting and thinning) that have taken place during the rota-
   The input data for each site and soil horizon are presented   tion period. The final uptake curves were created by multi-
in Table 1 and were based on climate and soil profile (Pod-      plying the biomass increments by the nutrient concentrations
zol) data collected in earlier work. For the most part, these    for various tree parts. BC uptake rates are based on current
are given in Löfgren et al. (2011). The bulk densities were      biomass (hindcast scenario) and future biomass predictions
estimated as a function of organic C and soil depth using        by the Swedish forest growth model ProdMod, version 2.2
the empirical relationships of Nilsson and Lundin (2006).        (Ekö, 1985). BC uptake values were finally corrected for lit-
The volumetric water content was set to a common value of        terfall (which returns BCs to the soil) and remineralization
0.3 m3 m−3 . The extent of sulfate adsorption in the B1 hori-    estimates. The net BC uptake at Gårdsjön was estimated us-
zon of Kindla was assumed to be strongly sorbing (“strong”       ing the ForSAFE model, by dynamically simulating photo-
in Table 1), similar to that of another Podzol in the same       synthesis, growth, and gross uptake in response to environ-
area of Sweden (Gustafsson et al., 2015). The other two soils    mental drivers and subtracting litterfall that was physiolog-
from south-western Sweden were assumed to have less (Ta-         ically simulated in response to light saturation, respiration,
ble 1) sulfate adsorption, in agreement with other soils from    and water availability (Belyazid and Moldan, 2009).
this area (Karltun, 1995); the relevant Freundlich parameters       The highest rates of net uptake occur in young growing
were taken from the Tärnsjö soil of Gustafsson et al. (2015).    forests, and as the forest stands age, less BCs are taken up.
The mineral soil horizons were assumed to be in equilibrium      The stack of graphs in the left column of Fig. S3 represents
with ferrihydrite, whereas Fe(III) was assumed to be negli-      the NH scenario, which means that for Aneboda and Kindla,
gible in the O horizons. Dissolved organic C (DOC) was as-       uptake trends after 2019 were modelled using an exponen-
sumed to be constant throughout the simulation period, and       tial decay and essentially approach zero as time goes on. The
the values were calculated from the mean DOC concentra-          stack of graphs in the central and right columns (Fig. S3) rep-
tions in soil solution (lysimeter data) between 1993 and 2014.   resents the uptake trends that were used from 2020 and on-
                                                                 wards under the CH and WTH scenarios, respectively. The
2.3   Deposition
                                                                 negative values in uptake that occur after harvesting events
                                                                 are due to net influx of BCs originating from mineralization
Historical wet deposition data for the three sites (Fig. S2)     of leftover debris. The CH scenarios produce more negative
were taken from Löfgren et al. (2011) and from Zetterberg        values than WTH scenarios because there is more debris left
et al. (2014). To calculate the contribution from dry deposi-    on the soil. It should also be noted that the assumed 100 %
tion, results from measurements of a surrogate surface were      removal of harvest residuals in the WTH scenario is an over-

www.soil-journal.net/5/63/2019/                                                                          SOIL, 5, 63–77, 2019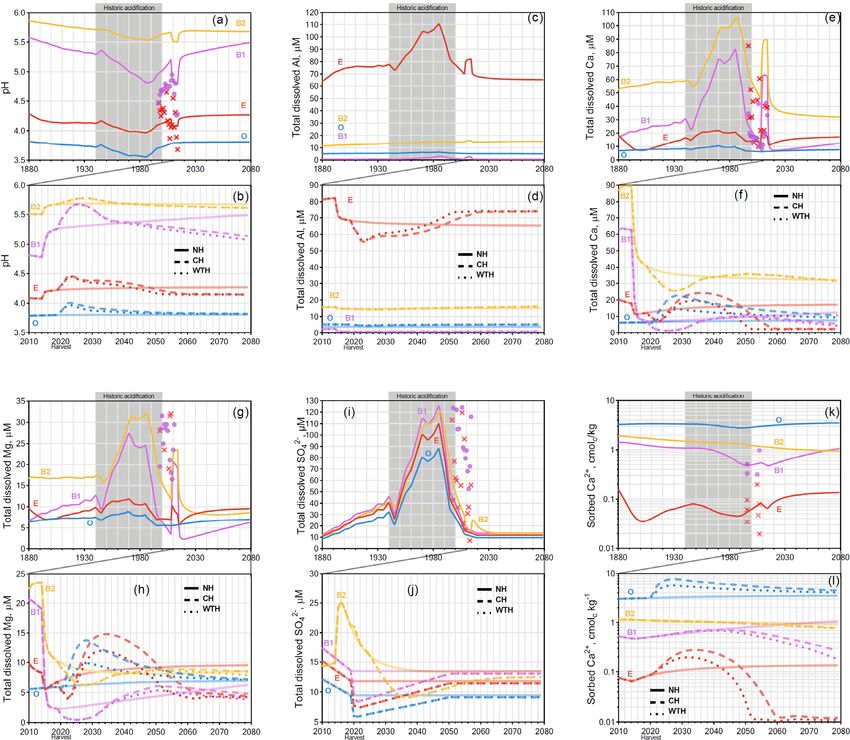
66 E. McGivney et al.: Assessing the impact of acid rain and forest harvest intensity
Table 1. Parameter values and assumptions used for the HD-MINTEQ simulations of all three sites.
Site Aneboda Gårdsjön Kindla
Horizon O E Bs1 Bs2 O E Bs1 Bs2 O E Bs1 Bs2
Thickness (m) 0.1 0.1 0.15 0.15 0.05 0.05 0.2 0.15 0.1 0.1 0.15 0.15
Bulk density (kg m−3 ) 118 837 980 1122 156 773 749 836 118 1004 980 1237
Volumetric water content (m3 m−3 ) 0.3 0.3 0.3 0.3 0.3 0.3 0.3 0.3 0.3 0.3 0.3 0.3
Dispersivity (m) 0.01 0.01 0.01 0.01 0.01 0.01 0.01 0.01 0.01 0.01 0.01 0.01
Discharge (mm) 500 400 350 350 550 500 450 450 600 500 450 450
Winter soil temp (◦ C) 3 4 6 8 3 4 6 8 3 4 5 6
Summer soil temp (◦ C) 12 11 9 8 12 11 9 8 10 8 7 6
Dissolved NH+ 4 (µM) 14 14a 5.5a 5.5a 0.5 2.6 4.2 4.2 0.5 2.9 3.9 3.9
Dissolved NO− 3 (µM) 0.5 0.5a 0.3a 0.3a 0.5 0.4 0.4 0.4 0.5 0.3 0.5 0.5
Organic C (%) 40 4 2.5 1.5 40 5 6 5 40 2 2.5 0.8
Sulfate adsorption no no no some no no some some no no strong some
Equilibrium with ferrihydrite no yes yes yes no yes yes yes no yes yes yes
Geochemically active Al (mmol kg−1 ) 30 40 40 30 40 50 100 121 30 15 60 60
Partial CO2 pressure (atm) 0.001 0.003 0.007 0.01 0.001 0.002 0.007 0.01 0.001 0.002 0.007 0.01
DOC (mg L−1 ) 50 48.5 7.7 7.7 35 12.6 9.8 9.8 25 13.7 3.7 3.7
Base cation uptake (% of total) 20 50 30 0 50 30 20 0 20 50 30 0
Start of growth period (week of the year) 15 15 15 15 15 15 15 15 20 20 20 20
Duration of growth period (weeks) 30 30 30 30 30 30 30 30 20 20 20 20
Mineral composition
K feldspar 100 (%) 5.76 5.76 7.52 14.11 – – – – 12.20 12.20 10.75 10.74
K feldspar (%) – – – – – 15.0 18.0 19.0 – – – –
Plagioclase (%) – – – – – 14.0 15.0 16.0 – – – –
Anorthite (%) 3.62 3.63 2.24 4.20 – – – – 1.63 1.63 0.64 1.10
Albite (%) 22.41 22.41 25.69 27.49 – – – – 27.81 27.81 21.22 23.08
Hornblende (%) 1.11 1.11 1.01 1.62 – 0.1 1.5 1.5 1.76 1.76 0.33 0.95
Epidote (%) 4.56 4.56 4.07 4.13 – 0.1 0.75 1.0 2.14 2.14 0.61 1.30
Garnet (%) – – – – – 0.1 0.1 0.1 – – – –
Biotite (%) – – – – – 0.5 0.5 0.5 – – – –
Apatite (%) 0.09 0.09 0.24 0.24 – 0.1 0.2 0.3 0.21 0.21 0.09 0.15
Fe-Chlorite (%) – 0.4 0.4 0.4 – – – –
Chlorite (%) 0.50 0.50 0.40 0.88 – – – – 0.81 0.81 0.19 0.33
Illite1 (%) 2.07 2.07 3.53 1.77 – – – – 1.43 1.43 1.24 4.35
Mg-Vermiculite (%) – – – – – 3.0 15.0 5.0 – – – –
Vermiculite 1 (%) 1.21 1.21 2.16 2.78 – – – – 1.64 1.64 0.48 0.84
Vermiculite 2 (%) 0.50 0.50 0.38 0.84 – – – – 0.99 0.99 0.16 0.31
Muscovite (%) 6.92 6.92 10.67 3.65 – – – – 1.56 1.56 1.36 8.06
Rutile (%) 0.56 0.56 0.49 0.49 – – – – – – 0.21 0.28
Hematite (%) 2.33 2.33 0.73 0.73 – – – – 0.43 0.43 0.08 2.11
Chlorite1 (%) 0.73 0.73 0.63 1.72 – – – – 1.35 1.35 0.33 0.49
Specific surface area (m2 g−1 ) 1.14 1.04 0.95 0.95 – 1.2 1.1 1.98 – 1.29 1.18 1.18
a These values were adjusted for calibration to account for elevated N concentrations detected in lysimeter data from 2011 onwards. This was due to storm damage (Gudrun) in
the region, which brought down many trees in 2005.
estimation; in practice, ∼ 70 % is removed (Nilsson et al., tionships of Sverdrup and Warfvinge (1993) were used. The
2015). only modification in the current work was the way in which
the organic anion concentrations [R − ] (mol L−1 ) were calcu-
lated, as HD-MINTEQ uses the SHM, whereas the original
2.5 Mineralogy and weathering
PROFILE model used the Oliver equation. Thus, the main
For Aneboda and Kindla, the mineralogy used in the PRO- equation to calculate the weathering rate is
FILE submodel was calculated from data on total elemen-
tal analysis using the A2M model (Posch and Kurz, 2007). {H+ }nH kH2 O nCO [R − ]nR
r = kH+ · + + kCO2 · PCO2 2 + kR · , (1)
For Gårdsjön, the mineralogy was taken directly from Mar- fH fH 2 O fR
tinson et al. (2003). The specific surface area used by PRO-
FILE was estimated from the particle-size distribution using where r is the weathering rate (keq m−2 s−1 ) for an individual
the relationship of Sverdrup (1996). The mineralogy data are mineral; kH+ , kH2 O , and kR are the rate coefficients for the
presented in Table 1. To calculate weathering rates, the rela- reaction with H+ , H2 O, and DOC, respectively (m s−1 ); nH ,
SOIL, 5, 63–77, 2019 www.soil-journal.net/5/63/2019/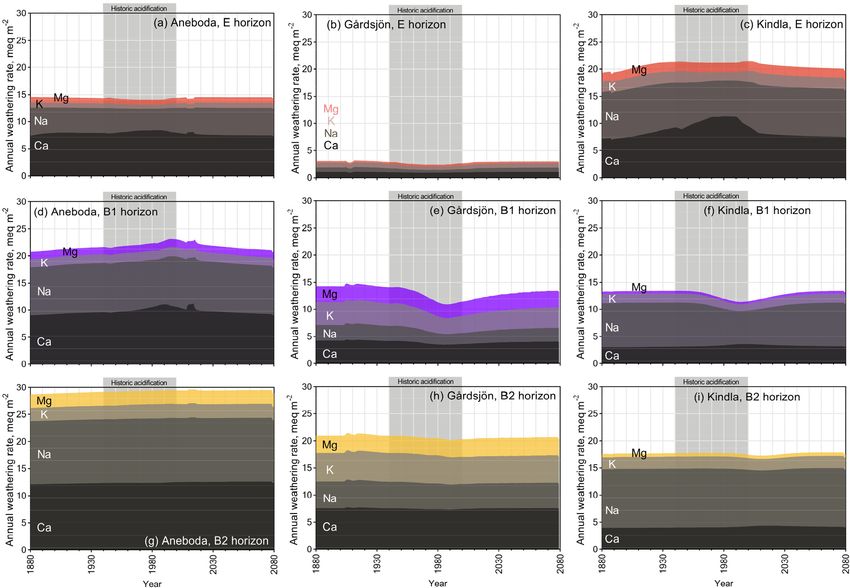
E. McGivney et al.: Assessing the impact of acid rain and forest harvest intensity                                               67

nCO2 , and nR are the reaction orders of individual reactions;     of the plant uptake distribution could be made for the next
PCO2 is the partial CO2 pressure (atm); and fH , fH2 O , and fR    iteration.
are the retardation factors (“brakes”). The latter are defined        During the initial model runs, it was found that the mod-
as                                                                 elled drop in pH after 2020 at Aneboda and Kindla was lim-
                      !xAl                                         ited by the amount of sorbed Ca2+ , restricting Ca2+ available
           [Al3+ ]                                                 for vegetation uptake. In the harvesting scenarios the sorbed
  fH = 1 +                                                         Ca2+ pool was not replenished in spite of the increased pH
             kAl
                                                    !xBC           after historic acidification, which is similar to what was ob-
            2[Ca2+ ] + 2[Mg2+ ] + [K+ ] + [Na+ ]                   served in the MAGIC simulations of Zetterberg et al. (2014).
       · 1+                                                , (2)
                           kBC                                     This in turn led to extremely low levels of dissolved Ca2+ and
                     !zAl                                          to occasional model errors due to negative concentrations in
             [Al3+ ]                                               preliminary model runs. To stop this from happening, the net
fH 2 O = 1 +
               kAl                                                 Ca2+ uptake was decreased as dissolved Ca2+ decreased, ac-
                                                    !zBC           cording to the following relationships taken from the “old”
           2[Ca2+ ] + 2[Mg2+ ] + [K+ ] + [Na+ ]                    SAFE model (Alveteg, unpublished):
     · 1+                                                    (3)
                          kBC
            − 0.5                                                Caupt,real = fupt · Caupt,init ,                             (5)
            [R ]
  fR = 1 +            ,                                      (4)   where Caupt,real is the adjusted net Ca uptake, Caupt,init is the
             kR
                                                                   assumed Ca uptake according to Table 1, and fupt is defined
where kAl , kBC , and kR are saturation coefficients for dis-      by
solution reductions, whereas xAl , xBC , zAl , and zBC are re-
                                                                              [Ca2+ ]n
action orders. Values of all coefficients and reaction orders      fupt =                   ,                                   (6)
were taken from Sverdrup and Warfvinge (1993).                              [Ca2+ ]n + cn
                                                                   where n = 4 and c = 1.5 × 10⁻⁶ . These equations pre-
2.6   Calibration                                                  vented dissolved Ca2+ concentrations from falling below
                                                                   5 µmol L−1 , but they also limited the acidification effect due
To initialize the model, dissolved concentrations of major         to Ca uptake. To what extent trees will adjust their BC uptake
cations, anions, and DOC were provided for the first time          in response to lower availability in the soil is still debated
step (in 1880) and for the solid-phase geochemically active        (Zetterberg et al., 2014). In plot experiments in which the
Al (Table 1). Based on this input, HD-MINTEQ then calcu-           effects of harvesting were studied, the depletion of sorbed
lated the start pH and the corresponding sorbed concentra-         Ca2+ was less severe than that predicted by mass balance
tions of major ions as well as dissolved Al.                       calculations and models (Zetterberg et al., 2014). Possible
   The model was calibrated in an iterative process in which       reasons include both a lower Ca2+ uptake to trees and min-
geochemically active Al and the plant uptake percentages of        eralization of strongly bound Ca2+ in litter, which is other-
the different layers were adjusted. Further, it was assumed        wise not geochemically active. However, because the HD-
that the soil water chemistry was in a steady state with respect   MINTEQ simulations here produced stronger effects on soil
to the environmental conditions in 1880, i.e. with respect to      Ca compared to those observed in the field (Zetterberg et
the assumed values for atmospheric deposition, plant uptake,       al., 2016), it seems probable that the acidification effect as
weathering, etc. Before calibration, an initial guess was made     predicted by HD-MINTEQ may be regarded as a worst-case
of geochemically active Al and of the base cation uptake per-      scenario and that the real acidification, at least over the first
centages. During each iteration, the first step was to run the     rotation period, may be even smaller. However, at this point it
model for 1000 years with the 1880 parameters to obtain ini-       needs to be added that these conclusions may not be relevant
tial (start-state) values of dissolved ions. Final values pro-     in cases when nitrification following harvest is substantial,
duced after a 1000-year simulation were then used to initi-        in which case the acidification effect could be considerably
ate the model, which was rerun with historical disturbances        larger; this possibility was not considered in our simulations.
and changes in atmospheric deposition. The modelled values         Most Swedish forests are N limited (Högberg et al., 2017),
of pH, dissolved inorganic Al, and other BC concentrations         but increased nitrate concentrations are found in soil solution
from 1993 to 2014 were then compared to soil solution data         for some years after final felling. Nitrification is dependent
from the same period taken from various depths and binned          on site productivity, which is between 4 and 8 m3 ha−1 yr−1
into either horizon E or B before being plotted (Löfgren et al.,   in the sites studied. According to the estimates of Futter et
2011). Further, it was checked that the assumed BC uptake          al. (2010), the total accumulated harvest effect should gener-
percentages did not result in uneven depletion rates in the        ally not exceed 220 and 500 meq NO−    3 m
                                                                                                               −2 for site produc-
                                                                                           3  −1 −1
different layers; if so, the percentages were adjusted. Based      tivities of 4 and 8 m ha yr , respectively (Futter et al.,
on the above, refined guesses of geochemically active Al and       2010), indicating rather modest nitrification effects on the

www.soil-journal.net/5/63/2019/                                                                            SOIL, 5, 63–77, 2019
68 E. McGivney et al.: Assessing the impact of acid rain and forest harvest intensity
long-term acid–base status of the soils. As an example, this decades for strongly SO4 -adsorbing soil systems (Cosby et
value represents between 5 % and 15 % of the atmospheri- al., 1986).
cally deposited BCs over a full rotation period; hence nitri- The dissolved aluminium profiles at all three sites show
fication is a relatively minor proton source as compared to that most of the mobilization of dissolved Al occurred in the
other processes in the forest soils under study. E horizon. This was likely due to the higher pH of the B
horizons (pH > 5), where the precipitation of aluminium hy-
droxide and/or allophane removed soluble Al (Gustafsson et
3 Results and discussion al., 1995; Karltun et al., 2000). This inverse relationship with
pH is demonstrated clearly for Kindla’s B1 horizon, where
3.1 Historic acidification soluble Al concentration peaked as pH decreased below 5
(Fig. 3). The low levels of soluble Al in the O horizon are
Historic acidification of forest soils from atmospheric depo- attributed to complexation with organic ligands.
sition of S took place from 1940 through 2000 and can be For the Gårdsjön and Kindla sites, the modelled results
seen in the modelled soil solution pH profiles at Aneboda align well with the lysimeter data, with a few exceptions. In-
(Fig. 1a), Gårdsjön (Fig. 2a), and Kindla (Fig. 3a). At Ane- terestingly, the model underestimated Mg2+ concentrations
boda, the lowest soil solution pH for each horizon occurred at both sites. This could be caused by the use of A2M esti-
around 1990, about the same time that atmospheric S deposi- mates, i.e. that the normalization model underestimated the
tion began to decline (Fig. S2). The most dramatic decrease presence of easily weathered Mg-containing minerals. In a
in pH at Aneboda occurred within the B1 horizon, drop- recent study, Casetou-Gustafson et al. (2018) compared A2M
ping from pH 5.29 in 1940 to pH 4.81 in the late 1980s, a with the mineralogy obtained by X-ray powder diffraction
total pH decline of 0.48 units in 47 years. The other hori- (XRPD) for two soils that were similar to the soils studied
zons (O, E, and B2) at Aneboda saw milder changes in pH here. They found that trioctahedral mica and hydrobiotite
(< 0.20 units) over the same time period. The effects of his- were consistently underestimated by A2M, which is con-
torical acid rain can also be seen in the BC profiles of Ca2+ sistent with our modelling results as these Mg-containing
and Mg2+ , most significantly in the B1 and B2 horizons of minerals have relatively high weathering rates. Moreover
Aneboda. An increase in dissolved BCs occurred in order at Kindla, SO2−4 concentrations were underestimated. There
to balance the charge created by increasing levels of anions may be several explanations, but one possibility is miner-
(SO2− −
4 and NO3 ) being deposited from the atmosphere; i.e. alization and oxidation of organically bound S (Löfgren et
these BCs were exchangeable and responsive to anion con- al., 2001, 2014). The delay in SO2− 4 decrease at Kindla was,
centrations. Between 1940 and 1980, dissolved Ca2+ con- however, predicted well in the B1 horizon of the model.
centrations increased by 275 % and 94 % in the B1 and B2 For the Aneboda site, the discrepancies between model
horizon, respectively. The anomalous blip in pH (and BCs) and observations were more substantial. For example, while
at Aneboda occurring between 2008 and 2018 is the result of SO2−4 and pH were grossly underestimated, Ca
2+
and Mg2+
a large storm that downed many trees in 2005, followed by a were overestimated. It is important to note that the lysime-
bark beetle infestation, resulting in mineralization, acidifica- ter data plotted in Figs. 1, 2, and 3 are averages based on
tion, and increased dissolved Ca2+ (Löfgren et al., 2014). data from several lysimeters, and it has previously been ob-
Of the three sites studied, the strongest effect of historic served that there are large variations in the results of individ-
acid rain was seen at Gårdsjön (Fig. 2a), which experienced ual lysimeters at the Aneboda site (Löfgren et al., 2010, 2011,
an average decline of 0.39 pH units across all four horizons. 2014). As an example, for the B horizon the averaged re-
This is likely due to the higher S (as sulfuric acid) deposi- sults are based on eight lysimeters. Three of these, nos. 7102,
tion at Gårdsjön (Fig. S2). The horizon subject to the most 7104, and 7105, had results that were clearly divergent from
drastic acidification was the E horizon, which experienced the others (Fig. S4). Dissolved SO2− 2+
4 , Ca , and Mg
2+ were
a sharp decline from pH 4.81 in 1940 to pH 4.02 by 1985 (a all considerably higher, whereas the pH was lower. Possi-
drop of 0.70 pH units in 45 years). Similar to Aneboda, Gård- ble reasons include a net mineralization and oxidation of or-
sjön experienced its most acidic soil conditions in the mid ganically bound sulfur in response to decreased S deposition
1980s. However, the B1 horizon did see a slight delay, expe- (Löfgren et al., 2001, 2014), a process which was not taken
riencing its most acidic conditions in the early 1990s. This into account in the model. It may also be observed that if the
trend in delayed acidification across horizons was even more results from the three lysimeters were removed, there would
pronounced at Kindla (Fig. 3a), where the O and E horizons be a clearly improved agreement between the model and the
reached their most acidic conditions by 1980, the B1 horizon observations.
continued to acidify until 1994, and the B2 horizon did not
reach its most acidic conditions until 2013 (nearly 25 years 3.2 Harvesting-induced acidification
after the S and N deposition began to decline, Fig. S2). The
delayed response was mainly attributed to SO4 adsorption One trend across all horizons at all sites was that, directly af-
and desorption, which is known to delay response times to ter a simulated harvesting event (CH or WTH) in 2020, the
SOIL, 5, 63–77, 2019 www.soil-journal.net/5/63/2019/E. McGivney et al.: Assessing the impact of acid rain and forest harvest intensity 69
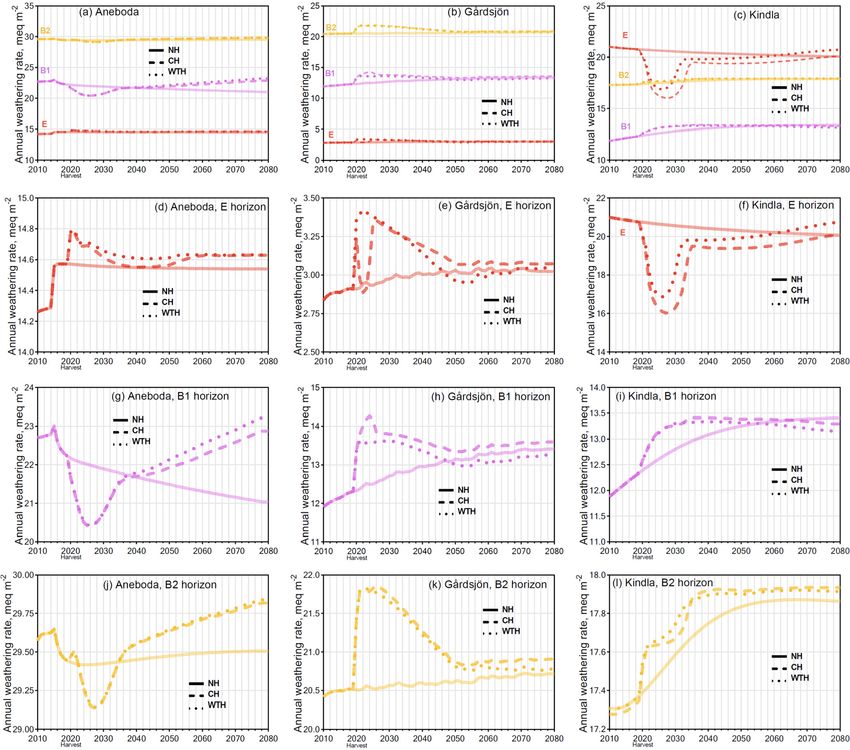
Figure 1. Graphs for Aneboda. Simulated mean annual pH (a, b); total dissolved Al (c, d), Ca (e, f), Mg (g, h), and SO2−
4 (i, j); and sorbed
Ca2+ (k, l). Chemical dynamics in response to historic acidification (a, c, e, g, i, k) are presented above the response to harvesting events (b,
d, f, h, j, l). The solid, dashed, and dotted lines represent the annual averages in the NH, CH, and WTH scenarios, respectively. The grey box
spanning 1940 to 2000 represents the period of acidification due to S deposition. The symbols “×” and “•” represent the annual averages of
empirical measurements in the E and B horizons, respectively.
pH sharply increased for 5–10 years before slowly declining tablished and trees begin to grow, uptake drives a net loss of
over the remainder of the simulation (displayed in Figs. 3b, BCs from the soil, leading to acidification. Across all three
4b, and 5b). The increase in pH immediately following a sites, the B1 horizons became the most acidified by 2080
harvest event is primarily caused by mineralization of BC- compared to the NH scenario. The O horizon experienced
containing harvest residues (Fig. S3), but also marginally by the least change after harvesting events, and at Aneboda and
a decreased dry S deposition. These processes increase the Kindla the pH was slightly more basic compared to the NH
sorption of BCs on the exchange sites (Figs. 1l, 2l, and 3l). scenario by 2080. However, had the simulation been run for
The impact of harvesting on pH and sorbed Ca lasted for a longer time, it appears that the pH would eventually reach
three to four decades at all three sites, eventually converging NH levels or drop below them. In reality a second harvest
towards the NH scenario, before falling below it, which was would likely have occurred after some 80–100 years, yield-
demonstrated previously in long-term experiments (Zetter- ing a new period with a brief pH increase.
berg et al., 2016). However, once new stands have been es-
www.soil-journal.net/5/63/2019/ SOIL, 5, 63–77, 201970 E. McGivney et al.: Assessing the impact of acid rain and forest harvest intensity
Figure 2. Graphs for Gårdsjön. Simulated mean annual pH (a, b); total dissolved Al (c, d), Ca (e, f), Mg (g, h), and SO2−
4 (i, j); and sorbed
Ca2+ (k, l). Chemical dynamics in response to historic acidification (a, c, e, g, i, k) are presented above the response to harvesting events (b,
d, f, h, j, l). The solid, dashed, and dotted lines represent the annual averages in the NH, CH, and WTH scenarios, respectively. The grey box
spanning 1940 to 2000 represents the period of acidification due to S deposition. The symbols “×” and “•” represent the annual averages of
empirical measurements in the E and B horizons, respectively.
Comparing the two harvesting scenarios demonstrates that boda’s B1 horizon also experienced a significant loss of sol-
over the 60-year time frame studied, simulated WTH acid- uble Ca2+ after harvesting, decreasing by 65 % (WTH) and
ified the soil more than CH, but not by much even though 56 % (CH) by 2080 compared to the NH control. However,
100 % of the harvest residues are assumed withdrawn at on a percentage basis, Aneboda’s E horizon experienced the
WTH. At Aneboda, the pH across all horizons dropped by most precipitous loss of soluble Ca2+ after harvesting, de-
an average 0.13 (WTH) and 0.12 units (CH) compared to creasing by 87 % (WTH) and 86 % (CH) by 2080 compared
the NH scenario by the year 2080. The difference between to the NH control. Similar trends were seen in sorbed Ca2+
WTH and CH was more pronounced at Kindla, which saw concentrations at Aneboda by 2080. The E horizon experi-
a mean pH decrease across all horizons of 0.10 (WTH) and enced a 92 % (WTH) and 91 % (CH) decrease compared to
0.04 (CH) units compared to the NH scenario by 2080. The the NH control, while the same figures for the B1 horizon
most sensitive horizon to harvesting at Aneboda was the B1 were 83 % and 75 %, respectively. Neither harvesting sce-
horizon, which dropped in pH by 0.42 (WTH) and 0.36 (CH) nario appeared to have a tangible impact on the Ca2+ con-
units compared to the NH scenario by the year 2080. Ane- centrations (soluble or sorbed) in the B2 horizon at Aneboda.
SOIL, 5, 63–77, 2019 www.soil-journal.net/5/63/2019/E. McGivney et al.: Assessing the impact of acid rain and forest harvest intensity 71
Figure 3. Graphs for Kindla. Simulated mean annual pH (a, b); total dissolved Al (c, d), Ca (e, f), Mg (g, h), and SO2−
4 (i, j); and sorbed
Ca2+ (k, l). Chemical dynamics in response to historic acidification (a, c, e, g, i, k) are presented above the response to harvesting events (b,
d, f, h, j, l). The solid, dashed, and dotted lines represent the annual averages in the NH, CH, and WTH scenarios, respectively. The grey box
spanning 1940 to 2000 represents the period of acidification due to S deposition. The symbols “×” and “•” represent the annual averages of
empirical measurements in the E and B horizons, respectively.
Contrary to the trends in Ca2+ concentrations in horizons E, (CH), while sorbed Ca2+ decreased 91 % (WTH) and 84 %
B1, and B2, after harvesting, the O horizon experienced an (CH) by 2080 compared to the NH scenario. One interesting
increase in soluble and sorbed Ca2+ by 2080 compared to the observation at Kindla was that the delayed acidification with
NH control. increasing soil depth, which was related to SO2−4 adsorption
Compared with the NH scenario, Kindla also experienced and desorption processes and historic acidification, was not
a phase with an increased pH followed by acidification at the observed after harvesting. Our simulations indicate that bio-
end of the simulation period, but to a lesser degree than Ane- logical acidification did not initiate such processes, at least
boda. At Kindla, the mean soil pH at 2080 decreased by an within 60 years after harvest, corresponding to an almost full
average of 0.04 and 0.10 units after CH and WTH, respec- rotation period.
tively. The B1 horizon was the most sensitive to acidification A pH increase after harvesting was also observed at Gård-
in both harvesting scenarios. Of the Kindla horizons, B1 also sjön, with the O and E horizons experiencing the strongest
saw the greatest change in soluble and sorbed Ca2+ after har- response. After increasing for a couple of years after harvest,
vesting. Soluble Ca2+ decreased by 80 % (WTH) and 73 % the pH started to decline, slowly approaching the NH trend
www.soil-journal.net/5/63/2019/ SOIL, 5, 63–77, 201972 E. McGivney et al.: Assessing the impact of acid rain and forest harvest intensity Figure 4. Stack plot of simulated base cation weathering rates in the NH scenario, with subdivisions of elemental components. line. By the end of the simulation (2080), there was almost cantly higher than at the other locations (Fig. S2), resulting no difference between CH, WTH, and the NH scenarios, and, in a higher-ionic-strength pore water, which would result in contrary to the trends at Aneboda and Kindla, it did not ap- quicker transport of soluble ions between the horizons. pear that the soils were trending towards further acidification The absolute magnitude of the model-predicted changes is post-2080. This trend of disturbance immediately following of course uncertain, not least in the light of the mixed success a harvest before slowly approaching the NH trends can also of the model to predict the available lysimeter data, as dis- be seen in BC concentrations. Total dissolved Al, Ca, and cussed in the previous section. Nevertheless, the simulated Mg sharply decreased immediately after CH and WTH for results strongly suggest that the acidification due to a har- several years before meandering towards the NH trend line. vesting event in 2020 would be less impactful, over the time However, by 2080, the concentration of soluble BCs after range studied, than that of historic atmospheric acidification. WTH was significantly lower than after CH, and both har- Even though the pH in the WTH and CH scenario decreased vesting events resulted in less soluble BCs compared to the with time as compared to the NH scenario, the simulated pH NH scenario. Exchangeable Ca2+ concentrations following did not drop to the levels observed around the peak of historic harvesting events at Gårdsjön appeared to oscillate around acidification (1980–1990). As was discussed by Löfgren et the NH trend line: increasing immediately after harvest (sim- al. (2017), this reflects the different acidification mechanisms ilar to Aneboda and Kindla), before slowly decreasing (also involved. Most importantly, the concentration of mobile an- similar to Aneboda and Kindla), but then again increasing ions was much lower in the harvesting scenarios compared to approach the NH levels of sorbed Ca2+ . There are sev- to the levels around the 1980s and 1990s, and this limits the eral possible explanations for the Ca2+ profiles at Gårdsjön. potential pH decrease. First, Gårdsjön has a relatively high organic carbon content (Table 1), which governs the cation exchange capacity, re- sulting in higher exchangeable Ca2+ to buffer the soil pore water. Also, atmospheric deposition at Gårdsjön is signifi- SOIL, 5, 63–77, 2019 www.soil-journal.net/5/63/2019/
E. McGivney et al.: Assessing the impact of acid rain and forest harvest intensity                                                          73

Figure 5. Simulated effects on base cation weathering rates in the conventional harvest (CH), whole-tree harvest (WTH), and NH scenarios.
The time series starts in 2010 just before harvest and the graphs are scaled in order to demonstrate differences between harvest intensities at
the different sites and soil horizons.

3.3   Weathering and release of base cations                              (Figs. 1, 2, and 3). In other words, the increased weathering
                                                                          rate expected from a decreased pH was offset by the increase
The weathering rates as calculated by the PROFILE sub-                    in dissolved Al and BCs, resulting in a very small net effect,
model in HD-MINTEQ differed across locations and lay-                     which according to PROFILE was negative. However, the ex-
ers in response to historic acidification and the presence of             act patterns varied from site to site and from layer to layer.
weathering brakes such as Ca2+ and Al3+ (Eqs. 2 and 3).                   The low weathering rates in the E horizon at Gårdsjön were
Across all sites and layers, the major BCs released by weath-             likely due to its mineralogy; i.e. minerals other than quartz,
ering were Ca2+ and Na+ (Fig. 4). During the historic acid-               K feldspar, and plagioclase were essentially absent from the
ification period, the annual weathering rates at several sites            E horizon, but they were present further down in the profile.
and horizons (Aneboda: E; Gårdsjön: E, B1, and B2; Kindla:                Another factor leading to low weathering rates in the Gård-
B1 and B2) actually decreased (Fig. S5), although not by                  sjön E horizon was the relatively thin layer thickness.
much. This is due to the brakes in the weathering function                   Contrary to the decrease in weathering rates during the
(i.e. from Al3+ and BCs, Eqs. 2 and 3) and to the fact that to-           historic acidification of the 1970s, the simulated weather-
tal dissolved Al and BCs were much higher during this period

www.soil-journal.net/5/63/2019/                                                                                      SOIL, 5, 63–77, 2019
74 E. McGivney et al.: Assessing the impact of acid rain and forest harvest intensity ing rates after the harvesting scenarios in 2020 generally in- In all other layers (E of Aneboda, all horizons in Gårdsjön, creased compared to NH by 2080 (Fig. 5) although, again, and both B horizons of Kindla) the simulated weathering the net change was very small. However, the dynamics were rates decreased with lower pH, which was due to a relatively quite different across each layer and site. The B1 horizon at high concentration of dissolved Al3+ that caused the Al3+ Aneboda saw the strongest increase in weathering rates after weathering brake to be important. There is a certain threshold harvesting, increasing by 9 % (CH) and 11 % (WTH) by 2080 range in the model where the weathering brake due to Al3+ compared to the NH scenario. The other horizons at Aneboda concentration started to influence weathering rates greatly, (E and B2) had almost unchanged weathering rates (< 2 % rendering H+ concentration less important. The “weathering increase by 2080 compared to a NH scenario). It is worth rate vs. Al” profiles in Fig. S7 show the transition from pH- noting that the difference between harvesting events and NH controlled weathering to Al-controlled weathering – weath- at the Aneboda B1 and B2 horizons would likely continue ering rates increase with increasing Al concentrations until a to diverge beyond 2080. At Aneboda, by the year 2080, the “break point” Al concentration is reached, where weathering sums of weathered BCs for the CH and WTH scenarios were rates begin to level off and decline. There are other weath- 32 meq m−2 (CH) and 46 meq m−2 (WTH) higher, respec- ering brakes as well, such as Ca2+ , that limit the effect of tively, than the BCs weathered in the NH scenario (Fig. S6). pH-induced weathering (Eq. 2), but these were less impor- To put this into perspective, this difference is equivalent to tant. Although not obvious at first, the trends in simulated only 1.1 % and 1.7 %, respectively, of the atmospherically weathering rates within an individual layer were consistent, deposited BCs in the WTH plots over the same period. Such regardless of the source of acidification (be it acid rain or a small change in the weathering rate cannot be experimen- harvesting). tally verified and is unlikely to be of any ecological signifi- As mentioned previously, limitations in the model pre- cance. vented us from addressing possible nitrification effects re- The trends in simulated weathering rates at Gårdsjön after sulting from long-term N deposition, which may influence harvesting mimicked the trends seen in pH; i.e. they rapidly these results. A future task is to upgrade the HD-MINTEQ increased for a couple of years, before declining to approach model to include N transformations, so that the effects arising levels similar to the NH scenario. For all three layers at Gård- from, for example, N deposition and nitrification can be more sjön, the modelled weathering rates appeared to reach steady- accurately assessed. Further, improved estimates of the min- state conditions by the year 2055, whereas the weathering eralogical composition through, for example, X-ray diffrac- rates at Kindla and Aneboda deviated from the NH trend tion would be desirable to avoid the mismatch in individual lines well into 2080. On a mass basis, CH and WTH at Gård- base cations, as was observed for Mg2+ . sjön resulted in amounts of weathered BCs that were 74 and Although the model was parameterized for three Swedish 49 meq m−2 higher than in the NH scenario by the year 2080 forest sites, the main trends are likely to be valid also for for- (Fig. S6). This change is equivalent to 0.6 % and 0.4 %, re- est soils in other parts of the world, i.e. that forest manage- spectively, of the sum of atmospherically deposited BCs in ment practices are not likely to result in strong acidification the WTH plots. effects within one full rotation period. However, these results At Kindla, no horizon saw an increase in simulated weath- should not be extrapolated to longer time perspectives, as ering rate greater than 3.4 % by 2080, compared to the NH certain drivers of the model may be increasingly uncertain scenario. In fact, when weathering of the three mineral soil with time. For example, it is not known to what extent the layers was summed, weathering rates slightly decreased by base cation uptake behaviour will differ between NH, CH, 0.9 % (CH) and 2.0 % (WTH) by 2080 compared to the NH and WTH scenarios over a period of several rotations. scenario, which was equivalent to a decreased amount of weathered BCs of 64 and 26 meq m−2 , respectively, over the simulated time period (Fig. S6). This result was influenced mainly by the large decrease in weathering rates in the E 4 Conclusions horizon in response to the pH increase after harvest (Fig. 3f), and the change is equivalent to 2.0 % and 0.8 % of the atmo- The HD-MINTEQ simulations for three sites indicate that spherically deposited BCs. forest harvesting contributes to long-term soil acidification, Weathering is dictated by both H+ (the lower the pH, the with marginally larger effects for whole-tree harvesting com- more weathering) and by the weathering brakes in the model, pared with stem-only harvesting scenarios. However, acidifi- most importantly dissolved Al3+ (the more Al3+ , the less cation due to harvesting events had much less impact on soil weathering). Some layers followed the generally expected pH compared to historical acid rain, provided that harvesting trend of increased weathering rates with lower pH (B1 and did not cause substantial nitrification. The strongest effect of B2 of Aneboda, and E of Kindla). These same layers were historic acid rain was seen at Gårdsjön, the site that expe- also low in dissolved Al3+ (Fig. S7), so the Al3+ weathering rienced the most sulfuric-acid deposition. Furthermore, our brake (the first terms of Eqs. 2 and 3) was not strong, and as model results suggest that the BC weathering rates remained a result the H+ concentration dictated mineral weathering. largely unchanged during the historic acidification era, as a SOIL, 5, 63–77, 2019 www.soil-journal.net/5/63/2019/
E. McGivney et al.: Assessing the impact of acid rain and forest harvest intensity                                                        75

result of the opposing effects of decreased pH and increased            Edited by: Boris Jansen
levels of dissolved Al3+ .                                              Reviewed by: three anonymous referees
   Although the predicted long-term pH effect of harvesting
is predicted to be small in relation to historical acidifica-
tion, future harvesting simulations did significantly change            References
the soil chemistry compared to a no-harvest scenario. Di-               Akselsson, C., Westling, O., Sverdrup, H., Holmqvist, J., Thelin,
rectly after a harvest, modelled soil solution pH increased                G., Uggla, E., and Malm, G.: Impact of harvest intensity on long-
and remained above the NH baseline for several decades                     term base cation budgets in Swedish forest soils, Water Air Soil
before eventually dropping below the baseline. Mineraliza-                 Pollut. Focus, 7, 201–210, https://doi.org/10.1007/978-1-4020-
tion of harvest residues, which release base cations, and a                5885-1_22, 2007.
decreased dry sulfur deposition were likely responsible for             Belyazid, S. and Moldan, F.: Using ForSAFE-Veg to investigate
the alkalization immediately following a harvesting event.                 the feasibility and requirements of setting critical loads for N
As in the case of historical acidification, the BC weather-                based on vegetation change – pilot study at Gårdsjön. IVL report
ing rates were little affected by harvesting. Over a period of             B1875, Gothenburg, Sweden, 2009.
60 years after simulated harvest events, there were very small          Belyazid, S., Westling, O., and Sverdrup, H.: Modelling changes
                                                                           in forest soil chemistry at 16 Swedish coniferous forest sites
increases in the BC weathering rates as compared to the no-
                                                                           following deposition reduction, Environ. Pollut., 144, 596–609,
harvest simulation for the Aneboda and Gårdsjön sites, as-                 https://doi.org/10.1016/j.envpol.2006.01.018, 2006.
suming that the PROFILE weathering submodel is correct.                 Bertills, U., Fölster, J., and Lager, H.: Natural acidification only –
Over the same time period, Kindla saw a very small decrease                report on in-depth evaluation of the environmental quality ob-
in BC weathering.                                                          jective work, Report 5766, Swedish Environmental Protection
                                                                           Agency, Stockholm, Sweden, 2007.
                                                                        Casetou-Gustafson, S., Hillier, S., Akselsson, C., Simons-
Code and data availability. The raw data, the metadata, and data           son, M., Stendahl, J., and Olsson, B. A.: Comparison
processing codes are stored on data servers and repositories and are       of measured (XRPD) and modeled (A2M) soil mineralo-
available upon request to the corresponding authors.                       gies: a study of some Swedish forest soils in the con-
                                                                           text of weathering rate predictions, Geoderma, 310, 77–88,
                                                                           https://doi.org/10.1016/j.geoderma.2017.09.004, 2018.
Supplement. The supplement related to this article is available         Cosby, B. J., Hornberger, G. M., Galloway, J. N., and Wright, R. E.:
online at: https://doi.org/10.5194/soil-5-63-2019-supplement.              Time scales of catchment acidification. A quantitative model for
                                                                           estimating freshwater acidification, Environ. Sci. Technol., 19,
                                                                           1144–1149, https://doi.org/10.1021/es00142a001, 1985.
Author contributions. SL, JPG, and EMG conceived the idea.              Cosby, B. J., Hornberger, G. M., Wright, R. F., and Galloway,
JPG prepared the HD-MINTEQ code. SL reviewed and prepared                  J. N.: Modeling the effects of acid deposition: control of
the available soil chemical data for all sites. SB supplied estimates      long-term sulfate dynamics by soil sulfate adsorption, Wa-
for the net BC uptake at Gårdsjön, whereas TZ supplied BC uptake           ter Resour. Res., 22, 1283–1291, https://doi.org/10.1111/j.1600-
data for the two other sites. EMG performed all the computer sim-          0536.2012.02097.x, 1986.
ulations, analysed the results, prepared all tables and figures, and    Cosby, B. J., Ferrier, R. C., Jenkins, A., and Wright, R. F.: Mod-
wrote the first version of the manuscript. All authors commented on        elling the effects of acid deposition: refinements, adjustments and
and edited the paper.                                                      inclusion of nitrogen dynamics in the MAGIC model, Hydrol.
                                                                           Earth Syst. Sci., 5, 499–518, https://doi.org/10.5194/hess-5-499-
                                                                           2001, 2001.
                                                                        de Jong, J., Akselsson, C., Egnell, G., Löfgren, S., and Olsson, B.
Competing interests. The authors declare that they have no con-
                                                                           A.: Realizing the energy potential of forest biomass in Sweden –
flict of interest.
                                                                           How much is environmentally sustainable?, For. Ecol. Manage.,
                                                                           383, 3–16, https://doi.org/10.1016/j.foreco.2016.06.028, 2017.
                                                                        Ekö, P. M.: A growth simulator for Swedish forests, based on data
Special issue statement. This article is part of the special issue         from the national forest survey. Report 16, Department of Sil-
“Quantifying weathering rates for sustainable forestry (BG/SOIL            viculture, Swedish University of Agricultural Sciences, Umeå,
inter-journal SI)”. It is not associated with a conference.                Sweden, 1985.
                                                                        Engardt, M., Simpson, D., Schwikowski, M., and Granat, L.: De-
                                                                           position of sulphur and nitrogen in Europe 1900–2050. Model
Acknowledgements. This study was funded by the Swedish                     calculations and comparison to historical observations, Tellus B,
Research Council Formas (reg. no. 2011-1691) within the strong             69, 1328945, https://doi.org/10.1080/16000889.2017.1328945,
research environment Quantifying Weathering Rates for Sustain-             2017.
able Forestry (QWARTS) and by the Swedish Energy Agency                 Ferm, M. and Hultberg, H.: Method to estimate atmospheric depo-
(project no. 31708-3). Carin Sjöstedt is acknowledged for help with        sition of base cations in coniferous throughfall, Water. Air. Soil
the uptake scenarios.                                                      Pollut., 85, 2229–2234, https://doi.org/10.1007/BF01186165,
                                                                           1995.

www.soil-journal.net/5/63/2019/                                                                                    SOIL, 5, 63–77, 2019
76 E. McGivney et al.: Assessing the impact of acid rain and forest harvest intensity Ferm, M. and Hultberg, H.: Dry deposition and internal circula- covery of soil water, groundwater, and streamwater from acidifi- tion of nitrogen, sulphur and base cations to a coniferous forest, cation at the swedish integrated monitoring catchments, Ambio, Atmos. Environ., 33, 4421–4430, https://doi.org/10.1016/S1352- 40, 836–856, https://doi.org/10.1007/s13280-011-0207-8, 2011. 2310(99)00211-3, 1999. Löfgren, S., Grandin, U., and Stendera, S.: Long-term effects on Futter, M. N., Ring, E., Högbom, L., Entenmann, S., and nitrogen and benthic fauna of extreme weather events: Exam- Bishop, K. H.: Consequences of nitrate leaching follow- ples from two Swedish headwater streams, Ambio, 43, 58–76, ing stem-only harvesting of Swedish forests are depen- https://doi.org/10.1007/s13280-014-0562-3, 2014. dent on spatial scale, Environ. Pollut., 158, 3552–3559, Löfgren, S., Ågren, A., Gustafsson, J. P., Olsson, B. A., and Zetter- https://doi.org/10.1016/j.envpol.2010.08.016, 2010. berg, T.: Impact of whole-tree harvest on soil and stream wa- Gustafsson, J. P.: Modeling the Acid–Base Properties and ter acidity in southern Sweden based on HD-MINTEQ sim- Metal Complexation of Humic Substances with the Stock- ulations and pH-sensitivity, For. Ecol. Manage., 383, 49–60, holm Humic Model, J. Colloid Interface Sci., 244, 102–112, https://doi.org/10.1016/j.foreco.2016.07.018, 2017. https://doi.org/10.1006/jcis.2001.7871, 2001. Martinson, L., Alveteg, M., Mörth, C.-M., and Warfvinge, P.: The Gustafsson, J. P.: Visual MINTEQ, version 3.1, available at: https: effect of changes in natural and anthropogenic deposition on //vminteq.lwr.kth.se (last access: 1 February 2019), 2018. modelling recovery from acidification, Hydrol. Earth Syst. Sci., Gustafsson, J. P. and Kleja, D. B.: Modeling salt-dependent pro- 7, 766–776, https://doi.org/10.5194/hess-7-766-2003, 2003. ton binding by organic soils with the NICA-Donnan and Stock- Nilsson, B., Nilsson, D., and Thörnqvist, T.: Distributions and holm Humic models, Environ. Sci. Technol., 39, 5372–5377, losses of logging residues at clear-felled areas during extrac- https://doi.org/10.1021/es0503332, 2005. tion for bioenergy: comparing dry- and fresh-stacked method, Gustafsson, J. P., Bhattacharya, P., Bain, D. C., Fraser, A. R., and Forests, 6, 4212–4227, https://doi.org/10.3390/f6114212, 2015. McHardy, W. J.: Podzolisation mechanisms and the synthesis Nilsson, S. I., Miller, H. G., and Miller, J. D.: Forest growth as a of imogolite in northern Scandinavia, Geoderma, 66, 167–184, possible cause of soil and water acidification: an examination of https://doi.org/10.1016/0016-7061(95)00005-9, 1995. the concepts, Oikos, 39, 40–49, https://doi.org/10.2307/3544529, Gustafsson, J. P., Akram, M., and Tiberg, C.: Predicting sul- 1982. phate adsorption/desorption in forest soils: Evaluation of Nilsson, T. and Lundin, L.: Uppskattning av volymvikten i svenska an extended Freundlich equation, Chemosphere, 119, 83–89, skogsjordar från halten organiskt kol och markdjup, Report 91, https://doi.org/10.1016/j.chemosphere.2014.05.067, 2015. Department of Forest Soils, Swedish University of Agricultural Gustafsson, J. P., Belyazid, S., McGivney, E., and Löfgren, S.: Sciences, Uppsala, Sweden, 2006 (in Swedish). Aluminium and base cation chemistry in dynamic acidifica- Posch, M. and Kurz, D.: A2M-A program to compute all possible tion models – need for a reappraisal?, SOIL, 4, 237–250, mineral modes from geochemical analyses, Comput. Geosci., 33, https://doi.org/10.5194/soil-4-237-2018, 2018. 563–572, https://doi.org/10.1016/j.cageo.2006.08.007, 2007. Högberg, P., Näsholm, T., Franklin, O., and Högberg, M. N.: Tamm Sverdrup, H.: Geochemistry, the key to understanding en- Review: On the nature of the nitrogen limitation to plant growth vironmental chemistry, Sci. Total Environ., 183, 67–87, in Fennoscandian boreal forests, For. Ecol. Manage., 403, 161– https://doi.org/10.1016/0048-9697(95)04978-9, 1996. 185, https://doi.org/10.1016/j.foreco.2017.04.045, 2017. Sverdrup, H. and De Vries, W.: Calculation critical loads for acidity Iwald, J., Löfgren, S., Stendahl, J., and Karltun, E.: Acidifying ef- with the Simple Mass Balance method, Water Air Soil Pollut., fect of removal of tree stumps and logging residues as com- 72, 143–162, https://doi.org/10.1007/BF01257121, 1994. pared to atmospheric deposition, For. Ecol. Manage., 290, 49–58, Sverdrup, H. and Warfvinge, P.: Calculating field weather- https://doi.org/10.1016/j.foreco.2012.06.022, 2013. ing rates using a mechanistic geochemical model PROFILE, Karltun, E.: Acidification of forest soils on glacial till in Sweden. Appl. Geochem., 8, 273–283, https://doi.org/10.1016/0883- Soil chemical status and acidification processes in relation to 2927(93)90042-F, 1993. environmental conditions, Report 4427, Swedish Environmental Vadeboncoeur, M. A., Hamburg, S. P., Yanai, R. D., and Blum, J. D.: Protection Agency, Stockholm, Sweden, 1995. Rates of sustainable forest harvest depend on rotation length and Karltun, E., Bain, D. C., Gustafsson, J. P., Mannerkoski, H., Mu- weathering of soil minerals, For. Ecol. Manage., 318, 194–205, rad, E., Wagner, U., Fraser, A. R., McHardy, W. J., and Starr, M.: https://doi.org/10.1016/j.foreco.2014.01.012, 2014. Surface reactivity of poorly-ordered minerals in podzol B hori- van Breemen, N., Driscoll, C. T., and Mulder, J.: Acidic deposition zons, Geoderma, 94, 265–288, https://doi.org/10.1016/S0016- and internal proton sources in acidification of soils and waters, 7061(98)00141-4, 2000. Nature, 307, 599–604, https://doi.org/10.1038/307599a0, 1984. Löfgren, S., Bringmark, L., Aastrup, M., Hultberg, H., Kindbom, Wallman, P., Svensson, M. G. E., Sverdrup, H., and Belyazid, S.: K., and Kvarnäs, H.: Sulphur balances and dynamics in three ForSAFE – An integrated process-oriented forest model for long- forested catchments in Sweden, Water Air Soil Pollut., 130, 631– term sustainability assessments, For. Ecol. Manage., 207, 19–36, 636, https://doi.org/10.1023/a:1013840309681, 2001. https://doi.org/10.1016/j.foreco.2004.10.016, 2005. Löfgren, S., Gustafsson, J. P., and Bringmark, L.: Decreasing DOC Warfvinge, P., Falkengren-Grerup, U., Sverdrup, H., and Andersen, trends in soil solution along the hillslopes at two IM sites in B.: Modelling long-term cation supply in acidified forest stands, southern Sweden – geochemical modeling of organic matter sol- Environ. Pollut., 80, 209–221, https://doi.org/10.1016/0269- ubility during acidification recovery, Sci. Total Environ., 409, 7491(93)90041-L, 1993. 201–210, https://doi.org/10.1016/j.scitotenv.2010.09.023, 2010. Zetterberg, T., Köhler, S. J., and Löfgren, S.: Sensitivity anal- Löfgren, S., Aastrup, M., Bringmark, L., Hultberg, H., Lewin- yses of MAGIC modelled predictions of future impacts of Pihlblad, L., Lundin, L., Karlsson, G. P., and Thunholm, B.: Re- whole-tree harvest on soil calcium supply and stream acid SOIL, 5, 63–77, 2019 www.soil-journal.net/5/63/2019/
You can also read