Soil Lead Concentration and Speciation in Community Farms of Newark, New Jersey, USA - MDPI
←
→
Page content transcription
If your browser does not render page correctly, please read the page content below
Article
Soil Lead Concentration and Speciation in Community Farms
of Newark, New Jersey, USA
Omanjana Goswami and Ashaki A. Rouff *

                                                Department of Earth & Environmental Sciences, Rutgers University, Newark, NJ 07102, USA;
                                                omanjana.goswami@rutgers.edu
                                                * Correspondence: ashaki.rouff@rutgers.edu; Tel.: +1-973-353-2511

                                                Abstract: Farmed urban soils often bear legacies of historic contamination from anthropogenic and
                                                industrial sources. Soils from seven community farms in Newark, New Jersey (NJ), USA, were ana-
                                                lyzed to determine the concentration and speciation of lead (Pb) depending on garden location and
                                                cultivation status. Samples were evaluated using single-step 1 M nitric acid (HNO3 ) and Tessier
                                                sequential extractions in combination with X-ray absorption fine structure spectroscopy (XAFS)
                                                analysis. Single-step extractable Pb concentration ranged from 22 to 830 mg kg−1 , with 21% of
                                                samples reporting concentrations of Pb > 400 mg kg−1 , which is the NJ Department of Environmental
                                                Protection (NJDEP) limit for residential soils. Sequential extractions indicated lowest Pb concentra-
                                                tions in the exchangeable fraction (0–211 mg kg−1 ), with highest concentrations (0–3002 mg kg−1 )
                                                in the oxidizable and reducible fractions. For samples with Pb > 400 mg kg−1 , Pb distribution was
                                                mostly uniform in particle size fractions of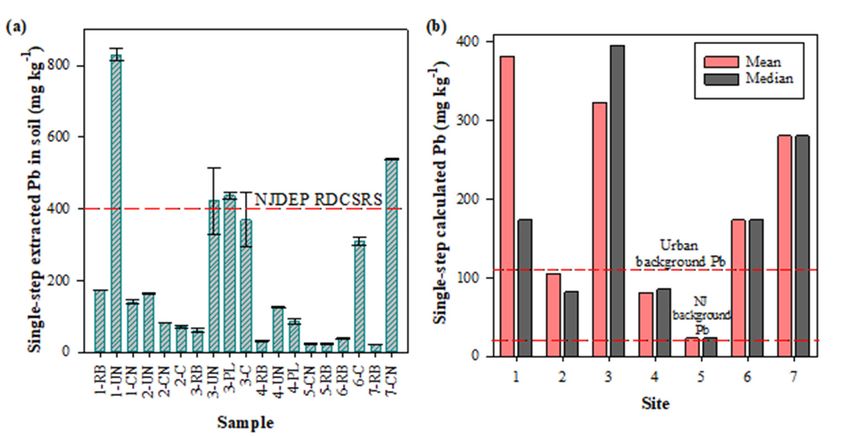
Soil Syst. 2021, 5, 2                                                                                           2 of 16

                        of Pb deposited from the atmosphere, and from sources such as Pb-based paint, persist
                        in soils. The average concentration of Pb in uncontaminated surface soils in the U.S.
                        is ~22 mg kg−1 [9] and increases to >150 mg kg−1 in urban areas, with some soils reporting
                        totals >100,000 mg kg−1 [10–14]. Evaluation of Pb soil concentrations in several U.S. cities
                        detected 175–7935 mg kg−1 Pb in residential soils with a wider range of 1–9540 mg kg−1
                        Pb observed for urban farmed soils [15–28]. Results from select studies showed that Pb
                        was distributed in the organic matter fraction or in association with iron (Fe)-manganese
                        (Mn) oxides [18], and increased Pb concentration was observed in inner city/downtown
                        areas [19,29], around driplines of buildings [19], and was directly proportional to traffic
                        volume and proximity to major roadways [17]. For soils with detected Pb, direct hu-
                        man exposure pathways include unintended ingestion or inhalation of contaminated soil,
                        with additional indirect exposure through consumption of food grown in farmed soils [29].
                        Outdoor exposure through ingestion of contaminated soil because of hand-to-mouth activ-
                        ity can be potentially harmful, especially for young children [30]. A proven neurotoxin,
                        Pb has been shown to impede development in infants and children, resulting in decreased
                        neural function and impairing overall growth and brain development [31].
                              In soils, metal availability, toxicity, and mobility are a function of the bonding envi-
                        ronment and speciation with corresponding soil minerals [32]. Studies of Pb and heavy
                        metals in urban soils, as described above, commonly use sequential extraction techniques
                        to determine metal concentration and macroscopic-scale speciation [32–34]. Spectroscopic
                        techniques, such as X-ray absorption fine structure spectroscopy (XAFS), are less fre-
                        quently used, but can elucidate molecular-scale chemical speciation of Pb in soils [35].
                        XAFS analyses of contaminated soil samples have shown that Pb is usually insolubilized
                        as phosphate minerals in the low-mobility, non-bioavailable residual fractions [35,36],
                        and XAFS can be used to investigate and confirm the dominant species and sinks of soil Pb
                        in contaminated heterogenous soil samples, ultimately predicting the risk of remobiliza-
                        tion [34,35,37]. Though sequential extractions and XAFS analysis provide complementary
                        information, limited studies have implemented both techniques to characterize Pb in
                        soils [34,38,39], with fewer studies applying this approach to urban farmed soils in the
                        Northeastern U.S. [23,28].
                              This study investigates the occurrence and speciation of Pb in soils used for urban
                        farming in the U.S. city of Newark, the most populated city in New Jersey (NJ). Situated
                        at the epicenter of one of the nation’s busiest transportation hubs, Newark is home to the
                        largest port in the Eastern U.S., the busiest airport of the greater New York City (NYC) area,
                        and the largest truck terminal in the country. Like in numerous other post-industrial U.S.
                        cities, there has been a recent increase in urban farming in Newark. As of 2014, 74 plots
                        had been leased out through an Adopt-a-Lot program managed by the City of Newark’s
                        Office of Sustainability. There are an estimated 100 farmers in Newark [40], operating farms
                        ranging in size from ~200 to 12,000 m2 , including many established in school backyards
                        and maintained by students. While urban farming practices to revitalize abandoned
                        and vacant lots in Newark are increasing, there is no central regulation on testing soils
                        before establishing a community farm to determine the soil quality and health. In this
                        study, the occurrence, prevalence, and distribution of heavy metals, with emphasis on Pb,
                        in Newark’s farmed soils is addressed. Sampled soils were subject to sequential extraction
                        and XAFS analysis to determine the concentration and speciation of Pb, and to infer
                        mobility and potential bioavailability. This comprehensive geochemical understanding
                        can be used to address the short and long-term risks of handling and farming in urban
                        soils. This is of paramount importance when considering health risk assessment and in
                        formulating risk management plans, ultimately contributing towards adoption of improved
                        urban farming policies.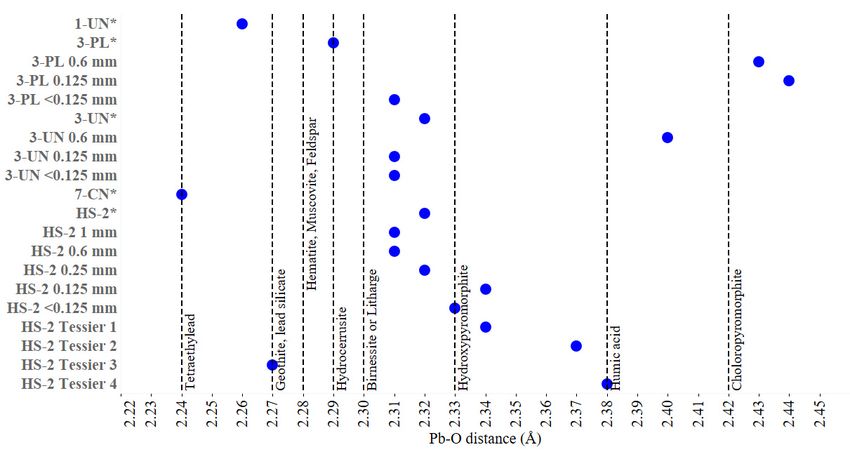
Soil Syst. 2021, 5, 2 3 of 16
yst. 2020, 4, x 3 of 16
2. Materials and Methods
2. Materials and Methods
2.1. Site Description
2.1. Site Description
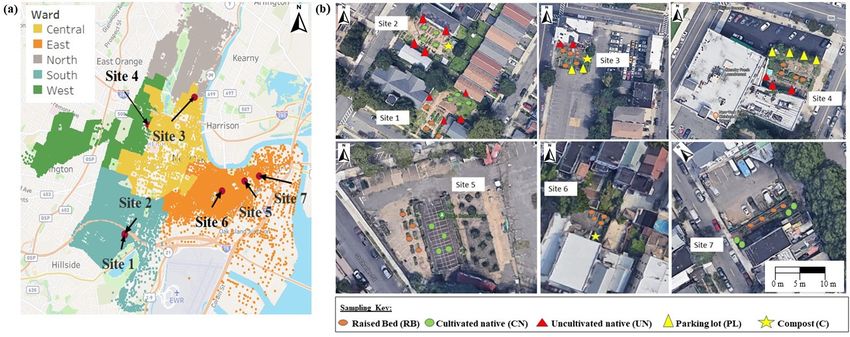
Seven community farms (Sites 1–7) located in four of five wards of the city of Newark,
Seven community farms (Sites
NJ were selected 1–7) located
for sampling in four
(Figure of fiveon
1). Based wards of the
Newark city ofmaps
zoning New-[41], all farms
ark, NJ wereare selected for sampling (Figure 1). Based on Newark zoning maps
in primarily residential zones, with Sites 1–4 in proximity to community [41], all and regional
farms are in commercial
primarily residential zones, with Sites 1–4 in proximity to community and
zones, and Sites 5–7 in proximity to heavy industrial zones. Farms ranged in
regional commercial
size fromzones,
113 toand Sites
5801 m2 ,5–7
within6proximity to heavy
farms practicing industrialinzones.
cultivation raisedFarms
beds, and 4 farms
ranged in sizecultivating
from 113 to 5801 m 2, with 6 farms practicing cultivation in raised beds, and
on native soil. Three farms had on-site composting facilities (Table 1).
4 farms cultivating on native soil. Three farms had on-site composting facilities (Table 1).
Figure 1. Community farm research sites in Newark, NJ, USA represented by (a) ward; (b) sam-
Figure 1. Community farm research sites in Newark, NJ, USA represented by (a) ward; (b) sampling scheme and sample category.
pling scheme and sample category.
Table 1. Select characteristics
Table of Newark, of
1. Select characteristics NJ, USA community
Newark, farms selected
NJ, USA community farmsfor sampling,
selected includinginclud-
for sampling, types of areas
cultivated anding
availability of on-site composting.
types of areas cultivated and availability of on-site composting.
Site Area (m2 ) Type of Location Raised Beds Cultivation in
Cultivation in Native
NativeSoil Composting
Site Area (m2) Type of Location Raised
√ Beds √ Composting
1 474.1 Soil ×
2 1
285.6 474.1 √
× √√ × √
Community and regional
Community and
2 285.6 commercial zone √
× √ √ √
3 112.9 regional commercial ×
3 112.9 √
√ × √
4 242.3 zone × ×
4 242.3 √
√
×√ ×
5 5801.3
5 5801.3 √ √ × ×
√ √
6 6
156.5 156.5 Heavy
Heavy industrial
industrial zone
zone √ ×× √
7 208.1 √
√ √√ ×
7 208.1 ×
2.2. Soil Sampling
2.2. Soil Sampling
Sampling was conducted from 2016 to 2018 in the months of June and July to reflect
Sampling was conducted from 2016 to 2018 in the months of June and July to reflect
periods of maximal use and plant growth. Samples were collected from raised beds (RB),
periods of maximal use and plant growth. Samples were collected from raised beds (RB),
cultivated native soil (CN), uncultivated soil (UN) near houses or buildings adjacent to
cultivated native soil (CN), uncultivated soil (UN) near houses or buildings adjacent to the
the periphery/boundary of the farm, areas adjacent to parking lots (PL) (if present), and
periphery/boundary of the farm, areas adjacent to parking lots (PL) (if present), and com-
compost (C) (where available). Soils were sampled to a depth of 15–20 cm, up to the effec-
post (C) (where available). Soils were sampled to a depth of 15–20 cm, up to the effective
tive depth of crop roots [42]. Composite samples were created by mixing equal amounts
depth of crop roots [42]. Composite samples were created by mixing equal amounts of
of four randomly collected sub-samples from each representative area [43]. Samples were
four randomly collected sub-samples from each representative area [43]. Samples were
labeled according
labeledto according
Site (1–7) and category
to Site of sampling
(1–7) and category (RB, CN, UN,(RB,
of sampling PL, CN,
C, Figure
UN, PL,1b,C, Figure 1b,
Table S1). A second sampling was conducted at Site 1 in July 2018 to identify the location
Table S1). A second sampling was conducted at Site 1 in July 2018 to identify the location of
of Pb hotspotsPb(HS). Samples
hotspots (HS).were
Samplescollected from the from
were collected samethe
locations used to create
same locations used tocom-
create composite
posite samplesample
1-UN, 1-UN,
but each sample was analyzed separately. All samples
but each sample was analyzed separately. All samples were were brought
brought back to
back to the laboratory and air-dried at room temperature for 72–96 h. Samples were
the laboratory and air-dried at room temperature for 72–96 h. Samples were then sievedthen
sieved toSoil Syst. 2021, 5, 2 4 of 16
2.3. Metal Extractions
A single-step 1M nitric acid (HNO3 ) extraction was performed to identify heavy
metals present in the soil and to estimate extractable concentrations [44,45]. A volume
of 10 mL 1 M HNO3 and 1 g of oven-dried soil from the 400 mg kg−1 from Sites 1 and 2. Approximately 20 g of
theSoil Syst. 2021, 5, 2 5 of 16
2.4. X-ray Absorption Fine Structure Spectroscopy (XAFS)
Select soil samples with >400 mg kg−1 Pb were analyzed by XAFS to determine
the molecular-scale speciation. Data were collected at Beamline 6-BMM at the National
Synchrotron Light Source-II (NSLS-II), Brookhaven National Laboratory (BNL), Upton,
New York. All scans were performed at the Pb LIII edge (13.035 keV) from 12.8 to 13.6 keV.
The spectra were collected at room temperature at 298 K (25 ◦ C). Data were collected in
fluorescence mode using a Si (111) monochromator and a 4-element vortex silicon-drift
detector with metal filters to reduce the impact of elastic scattering. Multiple scans (7–20)
were recorded per sample to improve the signal-to-noise ratio. The IFEFFIT software
package was used to perform data reduction, analysis and fitting [49].
3. Results and Discussion
3.1. Single-Step Extraction
The 1M HNO3 single-step extraction is a rapid method for screening and analysis
of heavy metals in soil samples and is a viable alternative to the standard EPA Methods
3050, 3051 and 3052 [10,50,51]. Using this extraction, the most commonly detected metals
in the community farm soils were Pb, Cd, Cu and Zn (Table S2, Figure S1). Given the
absence of health-based soil standards for community farms, the metal concentrations
were compared to the NJDEP RDCSRS (Table S2) [46]. The NJDEP RDCSRS is calculated
to protect human health assuming metal exposure at residential sites, and is defined as
a soil remediation standard for the ingestion–dermal and inhalation exposure pathways
at locations such as homes, schools (pre-K-12) and childcare centers [46]. Concentrations
exceeding the standard were considered to be elevated with respect to the metal. Of the
detected metals, only Pb exceeded the NJDEP RDCSRS in multiple samples (Table S2).
The 1 M HNO3 extractable Pb concentrations likely underestimate total Pb concentrations
by ~33%, and therefore represent a minimum concentration for comparison with the NJDEP
RDCSRS value (Table S2).
Results from single-step 1 M HNO3 extractions are reported in Figure 2a. For all
community farms, samples collected from raised beds (RB) reported the lowest Pb con-
centrations, ranging from 22 to 174 mg kg−1 . This is expected as raised beds contain
clean topsoil purchased annually or every few years to avoid high levels of contaminants.
In comparison, cultivated (CN) and uncultivated (UN) native soils had higher Pb concen-
trations ranging from 24 to 540 mg kg−1 , and 127 to 830 mg kg−1 , respectively, with three
samples exceeding the NJDEP RDCSRS. Of the two sites located adjacent to a parking
lot (PL), only the 3-PL sample reported elevated Pb at 438 mg kg−1 , suggesting historic
accumulation from leaded gasoline vehicular exhaust [52]. Compost samples (2-C, 3-C, 6-C)
had Pb concentrations of 72–369 mg kg−1 . The exact source of Pb in compost is difficult to
identify, as farms usually receive biodegradable waste in large quantities from multiple
commercial and non-commercial sources, that are mixed together prior to composting.
Moreover, the scale and volume of composting operations is different with Site 2 having a
well-established bin-composting and vermicomposting operation, whereas Sites 3 and 6
have smaller-scale operations. However, some probable sources of Pb identified in compost
include plastic, paper and cardboard, and Pb-bearing food waste [53].
To estimate the extent of contamination compared to uncontaminated background
levels [54,55] a contamination factor (CF) was calculated:
CF = Cn / Bn (1)
where Cn is the measured concentration of the element in soil and Bn is the background
value of 22 mg kg−1 for Pb in uncontaminated NJ soils [9]. To determine the extent of
anthropogenic Pb contamination in soil samples, the geoaccumulation index (Igeo ) was
calculated using the formula by Mueller [56]:
Igeo = log2 [Cn /1.5 × Bn ] (2)Soil Syst. 2021, 5, 2 6 of 16
Soil Syst. 2020, 4, x 6 of 16
Single-step
Figure2.2.Single-step
Figure 1 M 1HNO
M HNO 3 extracted
3 extracted Pb for (a)Pb
allfor (a) all
samples samplestoreferenced
referenced to the
the New Jersey De-New Jersey
Department
partment of Environmental
of Environmental Protection Protection (NJDEP) Residential
(NJDEP) Residential Direct ContactDirect Contact Soil Remediation
Soil Remediation
Standard
Standard(RDCSRS)
(RDCSRS)(400 mgmg
(400 kg−1
kg); − 1 );the
(b) (b)calculated mean mean
the calculated and median of all categories
and median for each for each site
of all categories
site referenced
referenced to to
the the background
background Pb Pbin in
New NewJersey
Jersey(22
(22mg
mgkg −1) and urban background Pb (111
kg− 1 ) and urban background Pb (111 mg kg−1 ).
mg kg−1).
The calculated CF and Igeo values were averaged and reported by sample category
To estimate the extent of contamination compared to uncontaminated background
(Table 3, Table S3). Amongst all categories, RB (CF 2.7, Igeo 0.4) and CN (CF 8.9, Igeo 1.8)
levels [54,55] a contamination factor (CF) was calculated:
reported the lowest computed values for both CF and Igeo . While the category average
Igeo of RB classified it as uncontaminated, CF ⁄according to its CF value it is still moderately
(1)
contaminated. The PL, C and UN categories had a very high extent
where Cn is the measured concentration of the element in soil and Bn is the background of contamination
according
value of 22 to
mgtheir CF Pb
kg−1 for values, corroboratingNJ
in uncontaminated a moderate
soils [9]. Totodetermine
strongly the
contaminated
extent of an-classifica-
tion based on
thropogenic Pb their average Iin
contamination . Overall,
geosoil samples,soils which are actively
the geoaccumulation farmed
index showed
(Igeo) was cal- slightly
culated using the formula
lower contamination asbyexpressed
Mueller [56]:by the CF and Igeo values of CN and RB categories,
with the severity of contaminationgeo
increasing
/ .
in non-farmed categories known (2) to have
anthropogenic Pb inputs.
The calculated CF and Igeo values were averaged and reported by sample category
(Table 3, Table S3).
Table 3. Contamination Amongst
factor allgeoaccumulation
(CF) and categories, RB (CF 2.7, (I
index Igeo 0.4) and CN (CF 8.9, Igeo 1.8)
geo ) of samples.
reported the lowest computed values for both CF and Igeo. While the category average Igeo
Sample CF RBAvg
ofCF classified it as Class
CFuncontaminated, according
Igeo to its CF
Igeo Avg it is still moderately
value Igeo Class
con-
taminated. The PL, C and UN categories had a very high extent of contamination accord-
2-C 3.3 1.1
ing to their CF values, corroborating a moderate to strongly contaminated classification
Moderate to strongly
3-C 16.8 based Very high which are actively2.6
11.4on their average Igeo. Overall, soils3.5 farmed showed slightly lower
contaminated
6-C 14.1 contamination as expressed by the CF and 3.2 Igeo values of CN and RB categories, with the
severity of contamination increasing in non-farmed categories known to have anthropo-
1-CN 6.4 2.1
genic Pb inputs.
2-CN 3.7 1.3
To facilitate comparison of Pb distribution amongst soil categories and individual
8.9 the mean andVery high 1.8 (FigureModerately contaminated
5-CN 1.1 farms, median concentration
−0.5 of Pb was calculated 2b, Table S4). The
geogenic soil Pb concentration in the U.S. is 22 mg kg [9] with NJ urban soils reporting a
−1
7-CN 24.5 higher median Pb concentration of 111 mg 4 kg−1 [57]. While the median concentration of
3-PL 19.9 raised bed samples at 34 mg kg was in 3.7
−1 exceedance of naturally occurring ModeratePb levels in
to NJ,
strongly
the11.9 Very highof non-raised beds (comprising UN,
median concentration 2.6 CN, PL and C) ranged from
4-PL 3.9 1.4 contaminated
112 to 310 mg kg−1, exceeding both urban background and geogenic Pb level in NJ. The
1-RB 7.9 median concentration of Pb is lowest in2.4 Site 5 at 24 mg kg−1, and highest in Site 3 at 396
3-RB 2.8 mg kg−1. The median Pb concentration of0.9 four of the sites exceed the background Pb value
for urban soils at 111 mg kg−1, implying higher Pb accumulation as a result of anthropo-
4-RB 1.4 −0.1
genic
2.7influences. Moderate
While trace levels of Pb occur in soils naturally,
0.4 higher concentrations
Uncontaminated
5-RB 1.1 are suggestive of Pb accumulation in urban−0.5soils originating primarily from historic inputs
6-RB 1.7 from a variety of anthropogenic sources. 0.2While soil samples with Pb ≤ 400 mg kg−1 have
been deemed safe for farming by the U.S. Environmental Protection Agency (USEPA),
7-RB 1 −0.6
1-UN 37.7 4.7
2-UN 7.4 2.3
17.5 Very high 3.2 Strongly contaminated
3-UN 9.2 3.7
4-UN 5.8 1.9Soil Syst. 2021, 5, 2 7 of 16
To facilitate comparison of Pb distribution amongst soil categories and individual
farms, the mean and median concentration of Pb was calculated (Figure 2b, Table S4).
The geogenic soil Pb concentration in the U.S. is 22 mg kg−1 [9] with NJ urban soils report-
ing a higher median Pb concentration of 111 mg kg−1 [57]. While the median concentration
of raised bed samples at 34 mg kg−1 was in exceedance of naturally occurring Pb levels in
NJ, the median concentration of non-raised beds (comprising UN, CN, PL and C) ranged
from 112 to 310 mg kg−1 , exceeding both urban background and geogenic Pb level in NJ.
The median concentration of Pb is lowest in Site 5 at 24 mg kg−1 , and highest in Site 3 at
396 mg kg−1 . The median Pb concentration of four of the sites exceed the background
Pb value for urban soils at 111 mg kg−1 , implying higher Pb accumulation as a result of
anthropogenic influences. While trace levels of Pb occur in soils naturally, higher concentra-
tions are suggestive of Pb accumulation in urban soils originating primarily from historic
inputs from a variety of anthropogenic sources. While soil samples with Pb ≤ 400 mg kg−1
have been deemed safe for farming by the U.S. Environmental Protection Agency (USEPA),
good farming practices established at these farms ensures that edible produce is not directly
cultivated in these soils. However, physical interaction with soils with any detectable Pb
might still be problematic, especially when considering Pb exposure through ingestion, in-
halation, or dermal routes. The major pathway of exposure to environmental Pb is through
ingestion of Pb-bearing fine particles causing elevated blood lead levels [58], followed by
inhalation as the second major pathway of exposure, enabling Pb to enter the human body
through the pulmonary route [30,31,45,59].
3.2. Sequential Extraction
Results from the Tessier scheme of sequential extraction of select samples are shown
in Figure 3a, and all samples are reported in Table S5. To facilitate comparison of sequential
extractions between samples, the soil fractions were normalized to the sum of extracted
Pb and represented as a percentage of the total value (Figure 3a). The exchangeable and
acid-soluble fractions represent the most mobile and potentially bioavailable concentration
of metal. The concentration of Pb in the exchangeable fraction is 0–211 mg kg−1 . The ex-
changeable fraction consists of weakly adsorbed and easily soluble Pb and represents the
amount of metal that has the tendency to be readily available for uptake by plants [48,60,61].
Lead in the acid-soluble fraction ranges from 0 to 948 mg kg−1 (Table S5) with 42% of
samples above the NJDEP RDCSRS. Acid-soluble Pb is associated with carbonate minerals,
exhibiting a tendency to mobilize upon changes in soil chemistry and lowering of pH,
and therefore in acidic soils this fraction may contribute to bioavailability [61]. The re-
ducible and oxidizable soil fractions have the largest cumulative Pb contribution in a
majority of the samples with Pb concentrations ranging from 0 to 3002 mg kg−1 and 0 to
2227 mg kg−1 respectively, indicating that Fe-Mn minerals and soil organic matter are the
major repositories of Pb in the soil. This is because the minerals and phases in these low-
mobility fractions have high binding capacities and therefore the potential to sequester a
large concentration of cations [62]. Averaging over the percentage distribution of Pb across
all samples, Pb is partitioned to an extent of 32.5% with Fe-Mn minerals and 33% with
soil organic matter. This is a somewhat typical representation of Pb distribution in urban
and roadside soils, and these results agree with other studies where the majority of ex-
tractable Pb is distributed amongst low-mobility oxidizable and reducible fractions [63–65].
In general, organic soil components exhibit a higher affinity for metal sorption, and results
suggest that soil organic material is an important sink for Pb in community farm soils.
In terms of spatial distribution, Pb concentration in samples collected beneath building
driplines (area directly located underneath the roof overhang or exterior of a building),
and samples collected adjacent to parking lots were high. Samples collected adjacent to
buildings were found to contain higher Pb than those of raised beds, as most buildings
adjacent to these plots are older, and historic use of Pb-based exterior paints is the likely
source of this Pb. For example, analysis of exterior house paint collected from buildings
next to sites reporting high soil Pb in downtown Washington DC reported Pb ranging fromsoils.
In terms of spatial distribution, Pb concentration in samples collected beneath build-
ing driplines (area directly located underneath the roof overhang or exterior of a build-
ing), and samples collected adjacent to parking lots were high. Samples collected adjacent
Soil Syst. 2021, 5, 2
to buildings were found to contain higher Pb than those of raised beds, as most buildings 8 of 16
adjacent to these plots are older, and historic use of Pb-based exterior paints is the likely
source of this Pb. For example, analysis of exterior house paint collected from buildings
next to sites reporting high soil Pb in downtown Washington DC reported Pb ranging
−1 [66]. Another likely source of soil Pb contributing to elevated
from 320,000 320,000 to 380,000
to 380,000 µg gAnother
μg g−1 [66]. likely source of soil Pb contributing to ele-
concentration
vated concentration is automobile
is automobile exhaust
exhaust and and be
this may this
themay
casebe
forthe case one
at least for sample
at least one sample
collected from Site 3 adjacent to a parking lot (3-PL). While the exchangeable
collected from Site 3 adjacent to a parking lot (3-PL). While the exchangeable fraction con- fraction
concentration of sample 3-PL isSoil Syst. 2021, 5, 2 9 of 16
availability of metal in soil and sensitivity to redox and pH conditions, thereby facilitating
prediction of metal cycling and availability with changing environmental conditions [68].
3.3. Metal Hotspot and Pb in Particle Size Fractions
Results from single-step and sequential extractions indicated that Site 1 had the
highest overall Pb concentration amongst all community farms, with composite sample
1-UN exceeding the NJDEP RDCSRS. To determine the area(s) associated with elevated
Pb, samples were taken from each location used to generate composite sample 1-UN
and analyzed separately (Figure S2). The 1 M HNO3 extractable Pb concentration of the
hotspot (HS) samples ranged from 73 to 3405 mg kg−1 (Figure 4a, Table S7). Site 1 is
surrounded by three buildings and has four locations with possible anthropogenic inputs
of Pb to the soil (Figure S2). The HS-2 sample collected adjacent to the residential building
reported the highest concentration of single-step extracted Pb at 3405 mg kg−1 and was
identified as the Pb hotspot. High Pb concentration, especially in the mobile fractions
is an indication of anthropogenic influences [45,66]. The Pb in HS-2 is likely due to the
accumulation from Pb-based paints from the exterior of the adjoining building. Results of
the sequential extraction showed that while all samples reported low concentrations of Pb
in the exchangeable fraction, HS-2 exceeded 400 mg kg−1 in acid-soluble, reducible and
oxidizable fractions (Figure 4a). The majority of measured Pb in HS-2 is associated with
the reducible fraction dominated by Fe-Mn oxides, and this Pb therefore has low mobility.
However, handling this soil physically and without protective gear can be potentially
problematic when considering exposure to Pb through ingestion, inhalation, or absorption
yst. 2020, 4, x through the skin barrier. 10 of 16
(a) (b)
Exchangeable 2 mm
4000
3000 Acid-soluble 1 mm
Single-step extractable Pb (mg kg-1)
Reducible 0.6 mm
Oxidizable 0.25 mm
Extractable Pb (mg kg )
-1
Single step 0.125 mm
3000Soil Syst. 2021, 5, 2 10 of 16
historic accumulation from anthropogenic sources. A possible explanation for uniform
Pb distribution in particle size fractions of 1-UN is similarities in organic matter content
(that sequesters considerable soil Pb) across different particle sizes [70]. For samples
HS-2, 3-UN and 3-PL the Pb concentration in theSoil Syst. 2021, 5, 2 11 of 16
2.24 Å, which corresponds to organometallic or tetraethyl Pb (2.24 Å), which is the form in
which Pb was added to gasoline [76].
The samples recovered from sequential extraction of HS-2 were also analyzed. The spe-
ciation of residual Pb changes after each subsequent extraction. The residual Pb speciation
after extractions yield Pb-O distances of 2.34 Å (HS-2 Tessier 1), 2.37 Å (HS-2 Tessier 2),
2.27 Å (HS-2 Tessier 3), and 2.38 Å (HS-2 Tessier 4); these distances indicate the dominance
of hydroxypyromorphite (2.34 Å), humic acid (2.37 Å), geothite (2.27 Å) and humic acid
(2.38 Å), respectively in these samples. These observations indicate the association of Pb
with phosphate, iron oxide and organic matter, and is consistent with the residual phases
that should be present in the sample after the relevant Tessier extraction.
The Pb speciation with particle-size fractions was assessed for HS-2, 3-UN and 3-PL
samples. For HS-2 (2 mm), the Pb-O bond length is consistent with mixed sorption with
birnessite and hydroxypyromorphite (2.32 Å). For particlesSoil Syst. 2021, 5, 2 12 of 16
fractions of the soil have an increased tendency to sequester Pb, and ultimately reduce
its bioavailability. Furthermore, Pb speciation was found to change with particle size,
with birnessite, pyromorphite (hydroxy and chloro), and humic acid substrates dominating
in the smaller particles. The XAFS analysis combined with results of sequential extraction
provide evidence that multiple Pb species are present in Newark’s urban soils, and multiple
soil minerals serve as sinks for sequestering environmental Pb.
The majority of soil Pb in urban areas is anthropogenic in origin. Inaction in terms
of remediation efforts of contaminated soil has the potential to transform soils from sinks
to sources. Studies have demonstrated that Pb-contaminated soil has the potential to be
air-borne as particulate Pb, thereby enhancing atmospheric Pb levels and increasing overall
exposure to the contaminant [79,80]. The presence of Pb in Newark’s urban community
farms is a sign of its pervasiveness in urban soils, and levels of accumulation reflect that Pb
emissions could have occurred from both point and non-point sources [81]. This makes it
challenging to identify an exact source of the Pb in the soil and trace its origin. The Pb in
Newark community farm soils is clearly anthropogenic, with potential sources including
Pb-based paints, gasoline, and industrial fallout. The presence of New Jersey’s largest
waste incinerator in the east ward of Newark places an additional environmental burden
on the community [82]. With the capacity to burn 2800 tons of waste per day [83], Pb fallout
from exhaust has been speculated as an additional source of environmental Pb [82,84].
Newark has a long history of exposure to elevated Pb through drinking water in homes,
schools and commercial buildings. This came to the forefront in Newark’s 2019 water crisis
where Pb concentrations up to four times above EPA limits of 15 µg L−1 were detected
in drinking water [85,86]. The use of this Pb-rich tap water for watering crops may be an
additional source of Pb contamination to soils, amplifying the problem of Pb exposure in
the community.
Urban agriculture has numerous advantages for communities such as generating
local food sources (especially in low-income communities) to reduce dependency on food
imports and creating localized supply chains, shortening the farm-to-table journey thereby
cutting emissions from food transportation and reducing the carbon footprint, and usage of
vacant land-parcels generating alternative land use options [87]. Newark’s long industrial
history and environmental injustice has prepared the urban farmers to establish good
farming practices like using raised beds, buying clean topsoil, and avoiding native soil for
cultivation. While the urban farming community in Newark remains small, the overall
Pb exposure from community farm soils also remains low. However, personal gardening
practices are expanding in Newark, with a growing interest in farming in backyard soils.
This can be problematic especially if growers are unaware of contaminants present in
their soils and are not knowledgeable about safe farming practices to avoid urban soil
contaminants. Limited by the area of their backyards, residents often farm along building
driplines or in native soils, which can be concerning, especially for houses with historic
use of Pb-based paints or other anthropogenic footprints. To address this gap in public
awareness regarding soil health and quality, there is a need to establish safe farming
workshops in conjunction with local farming organizations, expand screening of soils
for contaminants, and establish citizen education and awareness programs in the greater
Newark area.
Supplementary Materials: The following are available online at https://www.mdpi.com/2571-8
789/5/1/2/s1. Figure S1: Single-step (1 M HNO3 ) extractable concentration of (a) Cd, (b) Cu,
and (c) Zn in samples. Figure S2: Sampling scheme implemented in Site 1 to generate samples
(HS 1–4) for identifying Pb hotspot. Figure S3: Raw (solid) and corresponding fitted (dashed) (a)
k3 -weighted χ spectra and (b) radial structure functions obtained via Fourier transforming the raw
k3 -weighted spectra for samples (*marked samples denote composite 2 mm fractions). Table S1:
Sample description and nomenclature used in the manuscript. Table S2: Concentration of 1M HNO3
extracted metals for soil samples collected from Sites 1–7 and comparison to New Jersey Department
of Environmental Protection (NJDEP) Residential Direct Contact Soil Remediation Standard (RDCSRS)
values. Table S3: Classification based on Contamination factor (CF) and geoaccumulation indexSoil Syst. 2021, 5, 2 13 of 16
(Igeo ). Table S4: Calculated mean and median concentration of Pb (in mg kg−1 ) across sites and
categories for single-step extractions. The mean and median value for all samples is indicated in
italics. Table S5: Average Pb concentration in soil fractions for all samples collected in the study. Table
S6: Calculated median concentration of Pb (in mg kg−1 ) across categories for sequential extractions.
The median value for all samples in each fraction is indicated in italics. Table S7: Extractable Pb
concentration, and Pb associated with soil fractions collected for hotspot (HS) identification. Table
S8: Extractable Pb concentration in various particle size fractions of selected samples. Table S9: The
structural parameters derived from EXAFS analysis of samples including error reported in analysis
(shown in italics). Table S10: EXAFS parameters for Pb compounds from the literature and analyzed
soil samples.
Author Contributions: Conceptualization, O.G. and A.A.R.; methodology, O.G.; formal analysis,
O.G.; investigation, O.G.; resources, A.A.R.; data curation, O.G.; writing—original draft prepara-
tion, O.G.; writing, review and editing, O.G. and A.A.R.; visualization, O.G.; supervision, A.A.R.;
project administration, A.A.R.; funding acquisition, A.A.R. All authors have read and agreed to the
published version of the manuscript.
Funding: This research was funded by the National Science Foundation, grant number EAR 1530582
and a Rutgers University Newark Chancellor’s SEED Grant.
Data Availability Statement: The data presented in this study are available in the manuscript and
supplementary materials.
Acknowledgments: The authors thank Bruce Ravel, Beamline 6-BMM, National Synchrotron Light
Source-II (NSLS-II), Brookhaven National Laboratory (BNL), Upton New York, for access to the
beamline, technical support and assistance with XAFS data collection.
Conflicts of Interest: The authors declare no conflict of interest.
References
1. Poulsen, M.N.; Hulland, K.R.S.; Gulas, C.A.; Pham, H.; Dalglish, S.L.; Wilkinson, R.K.; Winch, P.J. Growing an Urban Oasis:
A Qualitative Study of the Perceived Benefits of Community Gardening in Baltimore, Maryland. CAFÉ 2014, 36, 69–82. [CrossRef]
2. Brown, K.H.; Jameton, A.L. Public Health Implications of Urban Agriculture. J. Public Health Policy 2000, 21, 20–39. [CrossRef]
[PubMed]
3. Siegner, A.; Sowerwine, J.; Acey, C. Does Urban Agriculture Improve Food Security? Examining the Nexus of Food Access and
Distribution of Urban Produced Foods in the United States: A Systematic Review. Sustainability 2018, 10, 2988. [CrossRef]
4. Lovell, S.T. Multifunctional Urban Agriculture for Sustainable Land Use Planning in the United States. Sustainability 2010,
2, 2499–2522. [CrossRef]
5. National Gardening Association. Available online: https://garden.org/special/pdf/2014-NGA-Garden-to-Table.pdf (accessed
on 14 October 2020).
6. Attanayake, C.P.; Hettiarachchi, G.M.; Harms, A.; Presley, D.; Martin, S.; Pierzynski, G.M. Field evaluations on soil plant transfer
of lead from an urban garden soil. J. Environ. Qual. 2014, 43, 475–487. [CrossRef]
7. Chaney, R.; Mielke, H.W. Standards for soil lead limitations in the United States. Trace Subst. Environ. Health 1986, 20, 357–377.
8. Mielke, H.W.; Reagan, P.L. Soil is an important pathway of human lead exposure. Environ. Health Perspect. 1998, 106 (Suppl. 1),
217–229. [CrossRef]
9. Smith, D.B.; Cannon, W.F.; Woodruff, L.G.; Solano, F.; Kilburn, J.E.; Fey, D.L. Geochemical and Mineralogical Data for Soils
of the Conterminous United States. 2013. Available online: https://pubs.usgs.gov/ds/801/pdf/ds801.pdf (accessed on 13
October 2020).
10. Minca, K.K.; Basta, N.T. Comparison of plant nutrient and environmental soil tests to predict Pb in urban soils. Sci. Total Environ.
2013, 445–446, 57–63. [CrossRef]
11. Datko-Williams, L.; Wilkie, A.; Richmond-Bryant, J. Analysis of U.S. soil lead (Pb) studies from 1970 to 2012. Sci. Total Environ.
2014, 468–469, 854–863. [CrossRef]
12. Mielke, H.W.; Anderson, J.C.; Berry, K.J.; Mielke, P.W.; Chaney, R.L.; Leech, M. Lead concentrations in inner-city soils as a factor
in the child lead problem. Am. J. Public Health 1983, 73, 1366–1369. [CrossRef]
13. Pouyat, R.V.; Szlavecz, K.; Yesilonis, I.D.; Wong, C.P.; Murawski, L.; Marra, P.; Casey, R.E.; Lev, S. Multi-scale assessment of
metal contamination in residential soil and soil fauna: A case study in the Baltimore–Washington metropolitan region, USA.
Landscape Urban. Plann. 2015, 142, 7–17. [CrossRef]
14. Pavilonis, B.; Maroko, A.; Cheng, Z. Lead in New York City’s soils: Population growth, land use, and contamination. Int. J.
Hygiene Environ. Health 2020, 229, 113564. [CrossRef] [PubMed]
15. Clarke, L.W.; Jenerette, G.D.; Bain, D.J. Urban legacies and soil management affect the concentration and speciation of trace
metals in Los Angeles community garden soils. Environ. Pollut. 2015, 197, 1–12. [CrossRef] [PubMed]Soil Syst. 2021, 5, 2 14 of 16
16. Kaminski, M.D.; Landsberger, S. Heavy Metals in Urban Soils of East St. Louis, IL, Part I: Total Concentration of Heavy Metals in
Soils. J. Air Waste Manag. Assoc. 2000, 50, 1667–1679. [CrossRef]
17. Mielke, H.W.; Laidlaw, M.A.S.; Gonzales, C. Lead (Pb) legacy from vehicle traffic in eight California urbanized areas: Continuing
influence of lead dust on children’s health. Sci. Total Environ. 2010, 408, 3965–3975. [CrossRef]
18. Attanayake, C.P.; Hettiarachchi, G.M.; Ma, Q.; Pierzynski, G.M.; Ransom, M.D. Lead Speciation and In Vitro Bioaccessibility of
Compost-Amended Urban Garden Soils. J. Environ. Qual. 2017, 46, 1215–1224. [CrossRef]
19. Filippelli, G.M.; Adamic, J.; Nichols, D.; Shukle, J.; Frix, E. Mapping the Urban Lead Exposome: A Detailed Analysis of Soil Metal
Concentrations at the Household Scale Using Citizen Science. Int. J. Environ. Res. 2018, 15, 1531. [CrossRef]
20. Finster, M.E.; Gray, K.A.; Binns, H.J. Lead levels of edibles grown in contaminated residential soils: A field survey.
Sci. Total Environ. 2004, 320, 245–257. [CrossRef]
21. Laidlaw, M.A.S.; Filippelli, G.M.; Brown, S.; Paz-Ferreiro, J.; Reichman, S.M.; Netherway, P.; Truskewycz, A.; Ball, A.S.; Mielke,
H.W. Case studies and evidence-based approaches to addressing urban soil lead contamination. Appl. Geochem. 2017, 83, 14–30.
[CrossRef]
22. Mielke, H.W.; Blake, B.; Burroughs, S.; Hassinger, N. Urban lead levels in Minneapolis: The case of the Hmong children.
Environ. Res. 1984, 34, 64–76. [CrossRef]
23. Mitchell, R.G.; Spliethoff, H.M.; Ribaudo, L.N.; Lopp, D.M.; Shayler, H.A.; Marquez-Bravo, L.G.; Lambert, V.T.; Ferenz, G.S.;
Russell-Anelli, J.M.; Stone, E.B.; et al. Lead (Pb) and other metals in New York City community garden soils: Factors influencing
contaminant distributions. Environ. Pollut. 2014, 187, 162–169. [CrossRef] [PubMed]
24. Moller, K.M.; Hartwell, J.G.; Simon-Friedt, B.R.; Wilson, M.J.; Wickliffe, J.K. Soil Contaminant Concentrations at Urban Agricul-
tural Sites in New Orleans, Louisiana. J. Agric. Food Syst. Community Dev. 2018, 8, 139–149. [CrossRef]
25. Defoe, P.P.; Hettiarachchi, G.M.; Benedict, C.; Martin, S. Safety of Gardening on Lead- and Arsenic-Contaminated Urban
Brownfields. J. Environ. Qual. 2014, 43, 2064–2078. [CrossRef] [PubMed]
26. Shinn, N.J.; Bing-Canar, J.; Cailas, M.; Peneff, N.; Binns, H.J. Determination of Spatial Continuity of Soil Lead Levels in an Urban
Residential Neighborhood. Environ. Res. 2000, 82, 46–52. [CrossRef]
27. Sterrett, S.B.; Chaney, R.L.; Gifford, C.H.; Mielke, H.W. Influence of fertilizer and sewage sludge compost on yield and heavy
metal accumulation by lettuce grown in urban soils. Environ. Geochem. Health 1996, 18, 135–142. [CrossRef]
28. Wagner, T.; Langley-Turnbaugh, S. Case study: Examining the contribution of historical sources of lead in urban soils in Portland,
Maine, USA. J. Environ. Plan. Manag. 2008, 51, 525–541. [CrossRef]
29. Brown, S.L.; Chaney, R.L.; Hettiarachchi, G.M. Lead in Urban Soils: A Real or Perceived Concern for Urban Agriculture?
J. Environ. Qual. 2016, 45, 26–36. [CrossRef]
30. United States Environmental Protection Agency. Protect Your Family from Exposures to Lead. Available online: https://www.
epa.gov/lead/protect-your-family-exposures-lead (accessed on 22 May 2020).
31. Agency for Toxic Substances and Disease Registry. Toxicological Profile: Lead. Available online: https://www.atsdr.cdc.gov/
toxprofiles/tp.asp?id=96&tid=22 (accessed on 14 May 2020).
32. Nevidomskaya, D.; Minkina, T.; Soldatov, A.; Shuvaeva, V.; Zubavichus, Y.; Podkovyrina, Y. Comprehensive study of Pb (II)
speciation in soil by X-ray absorption spectroscopy (XANES and EXAFS) and sequential fractionation. J. Soils Sediments 2016,
16, 1183–1192. [CrossRef]
33. Wong, C.S.C.; Li, X.D. Pb contamination and isotopic composition of urban soils in Hong Kong. Sci. Total Environ. 2004,
319, 185–195. [CrossRef]
34. Imperato, M.; Adamo, P.; Naimo, D.; Arienzo, M.; Stanzione, D.; Violante, P. Spatial distribution of heavy metals in urban soils of
Naples city (Italy). Environ. Pollut. 2003, 124, 247–256. [CrossRef]
35. Ryan, J.A.; Zhang, P.; Hesterberg, D.; Chou, J.; Sayers, D.E. Formation of Chloropyromorphite in a Lead-Contaminated Soil
Amended with Hydroxyapatite. Environ. Sci. Technol. 2001, 35, 3798–3803. [CrossRef] [PubMed]
36. Hashimoto, Y.; Takaoka, M.; Oshita, K.; Tanida, H. Incomplete transformations of Pb to pyromorphite by phosphate-induced
immobilization investigated by X-ray absorption fine structure (XAFS) spectroscopy. Chemosphere 2009, 76, 616–622. [CrossRef]
[PubMed]
37. Hettiarachchi, G.M.; Pierzynski, G.M. Soil lead bioavailability and in situ remediation of lead-contaminated soils: A review.
Environ. Prog. 2004, 23, 78–93. [CrossRef]
38. Funasaka, K.; Tojo, T.; Katahira, K.; Shinya, M.; Miyazaki, T.; Kamiura, T.; Yamamoto, O.; Moriwaki, H.; Tanida, H.; Takaoka, M.
Detection of Pb-LIII edge XANES spectra of urban atmospheric particles combined with simple acid extraction. Sci. Total Environ.
2008, 403, 230–234. [CrossRef] [PubMed]
39. Funasaka, K.; Tojo, T.; Kaneco, S.; Takaoka, M. Different chemical properties of lead in atmospheric particles from urban roadside
and residential areas. Atmos. Pollut. Res. 2013, 4, 362–369. [CrossRef]
40. Yi, K. Green Gardens Sprouting from Vacant Lots. Urban Farmers Hope to Grow City’s Economy. Available online: https://www.nj.
com/essex/2019/12/green-gardens-sprouting-from-vacant-lots-urban-farmers-hope-to-grow-citys-economy.html (accessed on
22 May 2020).
41. City of Newark. Available online: https://www.newarknj.gov/zoning (accessed on 29 October 2020).
42. Weil, R.; Brady, N. The Nature and Properties of Soils, 15th ed.; Pearson Education: London, UK, 2017; ISBN 9780133254488.Soil Syst. 2021, 5, 2 15 of 16
43. United States Environmental Protection Agency. Observational Economy Series Volume 1: Composite Sampling; EPA: Washington,
DC, USA, 1995. Available online: https://www.epa.gov/sites/production/files/2016-03/documents/comp-samp.pdf (accessed
on 24 December 2020).
44. Carter, M.R.; Gregorich, E.G. Soil Sampling and Methods of Analysis, 2nd ed.; CRC Press: Boca Raton, FL, USA, 2007. [CrossRef]
45. Chaney, R.L.; Sterrett, S.B.; Mielke, H.W. The potential for heavy metal exposure from urban gardens and soils. In Proceedings of
the Symposium on Heavy Metals in Urban Gardens; University of District of Columbia Extension Service: Washington, DC, USA,
1984; pp. 37–84. Available online: https://www.researchgate.net/publication/242693949_THE_POTENTIAL_FOR_HEAVY_
METAL_EXPOSURE_FROM_URBAN_GARDENS_AND_SOILS (accessed on 28 December 2020).
46. N.J.A.C. 7:26D Remediation Standards. Available online: https://www.nj.gov/dep/rules/rules/njac7_26d.pdf (accessed on 17
October 2020).
47. Tessier, A.; Campbell, P.G.C.; Bisson, M. Sequential extraction procedure for the speciation of particulate trace metals. Anal. Chem.
1979, 51, 844–851. [CrossRef]
48. John, D.A.; Leventhal, J.S. Bioavailability of Metals. Available online: https://pubs.usgs.gov/of/1995/ofr-95-0831/CHAP2.pdf
(accessed on 17 October 2020).
49. Ravel, B.; Newville, M. ATHENA, ARTEMIS, HEPHAESTUS: Data analysis for X-ray absorption spectroscopy using IFEFFIT.
J. Synchrotron Radiat. 2005, 12. [CrossRef]
50. McBride, M.B.; Mathur, R.R.; Baker, L.L. Chemical Extractability of Pb in Field-Contaminated Soils: Implications for Estimating
Total Pb. Commun. Soil Sci. Plant. Anal. 2011, 42, 1581–1593. [CrossRef]
51. Wharton, S.E.; Shayler, H.A.; Spliethoff, H.M.; Marquez-Bravo, L.G.; Ribaudo, L.; McBride, M.B. A Comparison of Screening Tests
for Soil Pb. Soil Sci. 2012, 177, 650–654. [CrossRef]
52. Kessler, R. Urban Gardening: Managing the Risks of Contaminated Soil. Environ. Health Perspect. 2013, 121, A326–A333.
[CrossRef]
53. Van Roosmalen, G.R.E.M.; Lustenhouwer, J.W.A.; Oosthoek, J.; Senden, M.M.G. Heavy metal sources and contamination
mechanisms in compost production. Resour. Conserv. 1987, 14, 321–334. [CrossRef]
54. Hakanson, L. An ecological risk index for aquatic pollution control.a sedimentological approach. Water Res. 1980, 14, 975–1001.
[CrossRef]
55. Remeikaitė-Nikienė, N.; Garnaga-Budrė, G.; Lujanienė, G.; Jokšas, K.; Stankevičius, A.; Malejevas, V.; Barisevičiūtė, R. Distribution
of metals and extent of contamination in sediments from the south-eastern Baltic Sea (Lithuanian zone). Oceanologia 2018,
60, 193–206. [CrossRef]
56. Muller, G. Index of Geoaccumulation in Sediments of the Rhine River. GeoJournal 1969, 2, 108–118.
57. Sanders, P.F. Ambient Levels of Metals in New Jersey Soils; NJDEP: Trenton, NJ, USA, 2003; Available online: https://www.state.nj.
us/dep/dsr/research/ambient-levels-metal.pdf (accessed on 24 December 2020).
58. Clark, H.F.; Brabander, D.J.; Erdil, R.M. Sources, Sinks, and Exposure Pathways of Lead in Urban Garden Soil. J. Environ. Qual.
2006, 35, 2066–2074. [CrossRef] [PubMed]
59. Wuana, R.A.; Okieimen, F.E. Heavy Metals in Contaminated Soils: A Review of Sources, Chemistry, Risks and Best Available
Strategies for Remediation. ISRN Ecol. 2011, 402647. [CrossRef]
60. Rieuwerts, J.S.; Thornton, I.; Farago, M.E.; Ashmore, M.R. Factors influencing metal bioavailability in soils: Preliminary
investigations for the development of a critical loads approach for metals. Chem. Speciat. Bioavailab. 1998, 10, 61–75. [CrossRef]
61. Elder, J.F. Metal biogeochemistry in surface-water systems; a review of principles and concepts. Circular 1988. [CrossRef]
62. Zimdahl, R.L.; Skogerboe, R.K. Behavior of lead in soil. Environ. Sci. Technol. 1977, 11, 1202–1207. [CrossRef]
63. Harrison, R.M.; Laxen, D.P.H.; Wilson, S.J. Chemical associations of lead, cadmium, copper, and zinc in street dusts and roadside
soils. Environ. Sci. Technol. 1981, 15, 1378–1383. [CrossRef]
64. Sutherland, R.A.; Tack, F.M.G. Metal phase associations in soils from an urban watershed, Honolulu, Hawaii. Sci. Total Environ.
2000, 256, 103–113. [CrossRef]
65. Norrström, A.C.; Jacks, G. Concentration and fractionation of heavy metals in roadside soils receiving de-icing salts.
Sci. Total Environ. 1998, 218, 161–174. [CrossRef]
66. Preer, J.R.; Akintoye, J.O.; Martin, M.L. Metals in downtown Washington, DC gardens. Biol. Trace Elem. Res. 1984, 6, 79–91.
[CrossRef] [PubMed]
67. Nirel, P.M.V.; Morel, F.M.M. Pitfalls of sequential extractions. Water Res. 1990, 24, 1055–1056. [CrossRef]
68. Dollar, N.L.; Souch, C.J.; Filippelli, G.M.; Mastalerz, M. Chemical Fractionation of Metals in Wetland Sediments: Indiana Dunes
National Lakeshore. Environ. Sci. Technol. 2001, 35, 3608–3615. [CrossRef]
69. Mi, Y.; Zhan, F.; Li, B.; Qin, L.; Wang, J.; Zu, Y.; Li, Y. Distribution characteristics of cadmium and lead in particle size fractions of
farmland soils in a lead–zinc mine area in Southwest China. Environ. Syst. Res. 2018, 7, 14. [CrossRef]
70. Park, H.; Park, H.; Yang, H.I.; Park, S.; Lim, S.; Kwak, J.; Lee, G.; Lee, S.; Park, M.; Choi, W. Sorption of Pb in chemical and
particle-size fractions of soils with different physico-chemical properties. J. Soils Sediments 2019, 19, 310–321. [CrossRef]
71. Sharp, R.M.; Brabander, D.J. Lead (Pb) Bioaccessibility and Mobility Assessment of Urban Soils and Composts: Fingerprinting
Sources and Refining Risks to Support Urban Agriculture. GeoHealth 2017, 1, 333–345. [CrossRef]
72. Dermatas, D.; Chrysochoou, M. Lead particle size and its association with firing conditions and range maintenance: Implications
for treatment. Environ. Geochem. Health 2007, 29, 347–355. [CrossRef]Soil Syst. 2021, 5, 2 16 of 16
73. Manceau, A.; Boisset, M.; Sarret, G.; Hazemann, J.; Mench, M.; Cambier, P.; Prost, R. Direct Determination of Lead Speciation in
Contaminated Soils by EXAFS Spectroscopy. Environ. Sci. Technol. 1996, 30, 1540–1552. [CrossRef]
74. Ostergren, J.D.; Brown, G.E.; Parks, G.A.; Tingle, T.N. Quantitative Speciation of Lead in Selected Mine Tailings from Leadville,
CO. Environ. Sci. Technol. 1999, 33, 1627–1636. [CrossRef]
75. Rouff, A.A.; Elzinga, E.J.; Reeder, R.J.; Fisher, N.S. X-ray Absorption Spectroscopic Evidence for the Formation of Pb (II) Inner-
Sphere Adsorption Complexes and Precipitates at the Calcite−Water Interface. Environ. Sci. Technol. 2004, 38, 1700–1707.
[CrossRef] [PubMed]
76. Hamel, S.; Heckman, J.; Murphy, S. Lead Contaminated Soil: Minimizing Health Risks. Available online: https://njaes.rutgers.
edu/fs336/ (accessed on 17 October 2020).
77. Chaney, R.L.; Mielke, H.W.; Sterrett, S.B. Speciation, mobility, and bioavailability of Soil Lead. In Lead in Soils: Issues and Guidelines;
Davies, B.E., Wixson, B.G., Eds.; CRC Press: Boca Raton, FL, USA, 1989; pp. 105–129.
78. Miretzky, P.; Fernandez-Cirelli, A. Phosphates for Pb immobilization in soils: A review. Environ. Chem. Lett. 2008, 6, 121–133.
[CrossRef]
79. Zahran, S.; Laidlaw, M.A.S.; McElmurry, S.P.; Filippelli, G.M.; Taylor, M. Linking Source and Effect: Resuspended Soil Lead,
Air Lead, and Children’s Blood Lead Levels in Detroit, Michigan. Environ. Sci. Technol. 2013, 47, 2839–2845. [CrossRef]
80. Pingitore, J.; Nicholas, E.; Clague, J.W.; Amaya, M.A.; Maciejewska, B.; Reynoso, J.J. Urban Airborne Lead: X-Ray Absorption
Spectroscopy Establishes Soil as Dominant Source. PLoS ONE 2009, 4, e5019. [CrossRef]
81. Burt, R.; Hernandez, L.; Shaw, R.; Tunstead, R.; Ferguson, R.; Peaslee, S. Trace element concentration and speciation in selected
urban soils in New York City. Environ. Monit. Assess. 2014, 186, 195–215. [CrossRef]
82. Essex County Trash Incinerator Unfairly Burdens Poor Critics Say. Available online: https://patch.com/new-jersey/newarknj/
essex-county-trash-incinerator-unfairly-burdens-poor-critics-say (accessed on 7 October 2020).
83. Essex Covanta. Available online: https://www.covanta.com/where-we-are/our-facilities/essex (accessed on 7 October 2020).
84. Earthjustice: Newark Youth March on Covanta, Trash-Burning Incinerator Masquerading As ‘Energy Plant’. Available on-
line: https://earthjustice.org/news/press/2018/newark-youth-march-on-covanta-trash-burning-incinerator-masquerading-
as-energy-plant (accessed on 14 October 2020).
85. Olson, D.E. Newark’s Lead Crisis Continues: Even Higher Levels in 2019. Available online: https://www.nrdc.org/experts/erik-
d-olson/newarks-lead-crisis-continues-even-higher-levels-2019 (accessed on 21 October 2020).
86. Yi, K. Newark Lead Levels Are Lower But Still Elevated, New Water Tests Show. Available online: https://www.nj.com/essex/
2020/01/newark-lead-levels-are-lower-but-still-elevated-new-water-tests-show.html (accessed on 21 October 2020).
87. Urban Agriculture: Practices to Improve Cities. Available online: https://urbanland.uli.org/news/urban-agriculture-practices-
to-improve-cities/ (accessed on 22 May 2020).You can also read