Exploitation of Lactic Acid Bacteria and Baker's Yeast as Single or Multiple Starter Cultures of Wheat Flour Dough Enriched with Soy Flour - MDPI
←
→
Page content transcription
If your browser does not render page correctly, please read the page content below
biomolecules

Article
Exploitation of Lactic Acid Bacteria and Baker’s Yeast
as Single or Multiple Starter Cultures of Wheat Flour
Dough Enriched with Soy Flour
Bernadette-Emőke Teleky 1 , Adrian Gheorghe Martău 1,2 , Floricut, a Ranga 2 , Felicia Chet, an 3
and Dan C. Vodnar 1,2, *
 1   Institute of Life Sciences, University of Agricultural Sciences and Veterinary Medicine, Calea Mănăs, tur 3-5,
     400372 Cluj-Napoca, Romania; bernadette.teleky@usamvcluj.ro (B.-E.T.);
     adrian.martau@usamvcluj.ro (A.G.M.)
 2   Faculty of Food Science and Technology, University of Agricultural Sciences and Veterinary Medicine,
     Calea Mănăs, tur 3-5, 400372 Cluj-Napoca, Romania; floricutza_ro@yahoo.com
 3   Agricultural Research and Development Station Turda, str. Agriculturii, nr. 27, Turda, 401100 Jud. Cluj,
     Romania; felice_fely@yahoo.com
 *   Correspondence: dan.vodnar@usamvcluj.ro; Tel.: +40747341881

 Received: 4 May 2020; Accepted: 15 May 2020; Published: 18 May 2020

 Abstract: Sourdough fermentation presents several advantageous effects in bread making,
 like improved nutritional quality and increased shelf life. Three types of experiments aimed
 to evaluate comparatively the efficiency of two Lactobacillus (Lb.) strains, Lb. plantarum ATCC 8014
 and Lb. casei ATCC 393, to metabolize different white wheat flour and soybeans flour combinations to
 compare their efficiency, together with/without Saccharomyces cerevisiae on sourdough fermentation.
 For this purpose, the viability, pH, organic acids, and secondary metabolites production were
 investigated, together with the dynamic rheological properties of the sourdough. During sourdough
 fermentation, LAB presented higher growth, and the pH decreased significantly from above pH
 6 at 0 h to values under 4 at 24 h for each experiment. Co-cultures of LAB and yeast produced a
 higher quantity of lactic acid than single cultures, especially in sourdough enriched with soy-flour.
 In general, sourdoughs displayed a stable, elastic-like behavior, and the incorporation of soy-flour
 conferred higher elasticity in comparison with sourdoughs without soy-flour. The higher elasticity
 of sourdoughs enriched with soy-flour can be attributed to the fact that through frozen storage,
 soy proteins have better water holding capacity. In conclusion, sourdough supplemented with 10%
 soy-flour had better rheological properties, increased lactic, acetic, and citric acid production.

 Keywords: lactic acid bacteria; soybean; sourdough; fermentation; Saccharomyces; organic acids;
 viscoelastic behavior

1. Introduction
     Sourdough used in the food industry, is a traditional leaven agent, for the fermentation of dough
with microorganisms like yeasts and lactic acid bacteria (LAB) [1,2]. The use of sourdough fermentation
in bread leavening is gaining increased attention as it is recognized as a healthy and natural way of
bread making [3]. With a history of over 5000 years, sourdough fermentation presents several beneficial
effects like a heterogeneous and enhanced sensory quality of baked foods [4,5]. Furthermore, with the
improvement of its nutritional quality, sourdough has the added benefit of increasing bread shelf life,
which brings the added advantage of diminished or no use of preservatives [6].
     White wheat flour is an essential staple food worldwide and contributes to the everyday intake of
daily fiber, micronutrient, and energy, but it presents fewer nutrients in comparison to whole-wheat

Biomolecules 2020, 10, 778; doi:10.3390/biom10050778                            www.mdpi.com/journal/biomolecules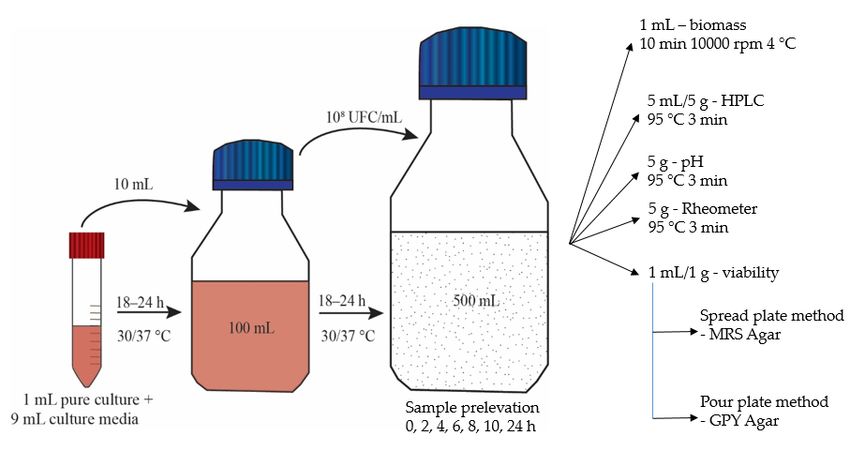
Biomolecules 2020, 10, x                                                                                    2 of 15

      White wheat flour is an essential staple food worldwide and contributes to the everyday intake
of daily fiber,
Biomolecules        micronutrient,
             2020, 10, 778         and energy, but it presents fewer nutrients in comparison to whole-      2 of 15
wheat flour [7,8]. In addition, soybeans contain a high content of isoflavones (daidzein, glycitein, and
genistein) that have beneficial health effects like osteoporosis and cardiovascular disease prevention,
flour [7,8]. In addition, soybeans contain a high content of isoflavones (daidzein, glycitein, and
anti-tumor agent, and hinders Alzheimer disease [9,10]. Soy flour addition to wheat flour contributes
genistein) that have beneficial health effects like osteoporosis and cardiovascular disease prevention,
to the nutritional characteristic of wheat flour dough. To increase bread quality, several studies
anti-tumor agent, and hinders Alzheimer disease [9,10]. Soy flour addition to wheat flour contributes
analyze the beneficial effect of soy flour addition to wheat flour [11–13]. On the other hand, soy flour
to the nutritional characteristic of wheat flour dough. To increase bread quality, several studies
supplementation due to the high content of soy proteins (45–55 g/100 g of soy flour) is feasible only
analyze the beneficial effect of soy flour addition to wheat flour [11–13]. On the other hand, soy flour
in low quantity otherwise, loaf volume is diminished, has inferior crumb properties, and reduced
supplementation due to the high content of soy proteins (45–55 g/100 g of soy flour) is feasible only
acceptance [11,14]. The health-promoting effects of soy proteins are highly studied [15,16], although
in low quantity otherwise, loaf volume is diminished, has inferior crumb properties, and reduced
in small children, it is believed to be a major allergen [17]. Aguirre et al. [18] observed the ability of
acceptance [11,14]. The health-promoting effects of soy proteins are highly studied [15,16], although in
different LAB strains to degrade the main soy proteins, until 6 h of fermentation, especially β-
small children, it is believed to be a major allergen [17]. Aguirre et al. [18] observed the ability of different
conglicinin. Seeing that LAB hydrolyzes primary soy proteins, they can be efficiently used for better
LAB strains to degrade the main soy proteins, until 6 h of fermentation, especially β-conglicinin. Seeing
digestion of soy proteins permitting their incorporation in an everyday diet [18]. A recent study [19]
that LAB hydrolyzes primary soy proteins, they can be efficiently used for better digestion of soy
analyzed the effect of soy flour addition on bread dough through frozen storage, which had a positive
proteins permitting their incorporation in an everyday diet [18]. A recent study [19] analyzed the effect
effect on dough extensibility strength and hardness. Textural and sensorial data indicated that
of soy flour addition on bread dough through frozen storage, which had a positive effect on dough
qualitatively soy dough has a slower deterioration rate in comparison with wheat dough. A 48.5% of
extensibility strength and hardness. Textural and sensorial data indicated that qualitatively soy dough
soy-flour addition acted as a plasticizing agent due to effective water-binding capability and
has a slower deterioration rate in comparison with wheat dough. A 48.5% of soy-flour addition acted as
provided nutritional advantages [19].
a plasticizing agent due to effective water-binding capability and provided nutritional advantages [19].
      During cereal fermentation, typically up to 24 h at moderate temperatures, the metabolic activity
      During cereal fermentation, typically up to 24 h at moderate temperatures, the metabolic activity
of the microorganisms present is in interaction with the grain constituents. In general, LAB produce
of the microorganisms present is in interaction with the grain constituents. In general, LAB produce
lactic and acetic acids, lowering the pH typically below pH 5. Additionally, usually, yeasts produce
lactic and acetic acids, lowering the pH typically below pH 5. Additionally, usually, yeasts produce
carbon dioxide and ethanol. Interactions between yeasts and bacteria are essential for the metabolic
carbon dioxide and ethanol. Interactions between yeasts and bacteria are essential for the metabolic
activity of the sourdough, such as the bioconversion of complex carbohydrates into organic acids or
activity of the sourdough, such as the bioconversion of complex carbohydrates into organic acids or
other chemical compounds with bioactive potential [20]. The changing conditions during
other chemical compounds with bioactive potential [20]. The changing conditions during fermentation
fermentation contribute to the activation of enzymes present, and adjustment of pH selectively
contribute to the activation of enzymes present, and adjustment of pH selectively enhances the
enhances the performance of certain enzymes, such as amylase, proteases, hemicellulases, and
performance of certain enzymes, such as amylase, proteases, hemicellulases, and phytases [21].
phytases [21]. The enzyme-induced changes, together with microbial metabolites, bring about the
The enzyme-induced changes, together with microbial metabolites, bring about the technological and
technological and nutritional effects of fermented cereal foods. Sourdough fermentation can
nutritional effects of fermented cereal foods. Sourdough fermentation can influence the nutritional
influence the nutritional quality by decreasing or increasing levels of compounds and enhancing or
quality by decreasing or increasing levels of compounds and enhancing or retarding the bioavailability
retarding the bioavailability of nutrients (Figure 1) [22]. An important aspect of sourdough is
of nutrients (Figure 1) [22]. An important aspect of sourdough is regarding to starch digestibility [23].
regarding to starch digestibility [23]. Owing to the high digestibility of gelatinized starch and as in
Owing to the high digestibility of gelatinized starch and as in wheat bread starch is in a strongly
wheat bread starch is in a strongly gelatinized and porous form, this aspect leads to the fast growth
gelatinized and porous form, this aspect leads to the fast growth of blood glucose level [22,24,25].
of blood glucose level [22,24,25]. Reduced digestibility is an advantageous effect of sourdough
Reduced digestibility is an advantageous effect of sourdough fermentation because of organic acid
fermentation because of organic acid production, like lactic acid that decreases the digestion of starch
production, like lactic acid that decreases the digestion of starch [22,24].
[22,24].

      Figure
      Figure 1. Nutritional influence
             1. Nutritional influence of
                                      of sourdough
                                         sourdough fermentation
                                                   fermentation with
                                                                with yeast
                                                                     yeast and
                                                                           and lactic
                                                                               lactic acid
                                                                                      acid bacteria
                                                                                           bacteria (LAB).
                                                                                                    (LAB).

     In functional food production, the use of LAB is favored due to its unique characteristics. LAB
is competent in producing polyols, antimicrobial substances, nutraceuticals, valuable enzymes,
Biomolecules 2020, 10, 778 3 of 15
or aromatic compounds [26–28]. LAB consists of Gram-positive bacteria with corresponding
physiological, metabolic, and morphological features, and can transform sugars to lactic acid [29].
During food fermentations, often-encountered microorganisms are LAB and yeasts. Saccharomyces
cerevisiae (Sc), a commercial baker’s yeast, remains the usual selection in baking. Sc has fast growth,
through dough leavening, great biomass yield on molasses medium, and presents increased CO2
production [30]. Supported by its capacity to ferment carbohydrates Lactobacillus plantarum (Lp),
a heterofermentative LAB is one of the native dominant strains of sourdough [31]. Lp ferments
hexoses through the Embden-Meyerhof Parnas pathway [32] and is extensively used in processing and
fermentation of unprocessed foods (vegetable, meat, and dairy). This LAB is “generally recognized as
safe” (GRAS) with a status of qualified presumption of safety (QPS-EFSA, 2018) [29,33]. The facultative
heterofermentative Lactobacillus casei (Lc) ferments nearly all hexose sugars to lactic acid [34]. Lc is a
highly used LAB in food fermentation for flavor enhancement in the cheese industry and in sourdough
production to manipulate acidification, gluten protein deterioration, aroma compounds, and amino
acid production and several other nutritional and sensory improvement [35]. Utilization of complex
microbial consortia is the general method used for performing food fermentation techniques, but there
are also several studies analyzing single cultures [36–38]. According to recent studies, there are
reciprocally stimulating interactions between LAB and Sc. Yeasts are a crucial element in foodstuff and
beverage production [2], and are predominantly in charge of dough leavening [39].
The antifungal activity of L. plantarum 21B was also found in sourdough bread. Compared to
bread started with S. cerevisiae 141 alone or in association with L. brevis 1D, the sourdough bread,
which used L. plantarum 21 B in association with S. cerevisiae 141 delayed fungal contamination until
after seven days of storage at room temperature [40].
The food industry to be efficient and competing has to address consumer requirements and recent
trends, which have incorporated the need for high-quality foods that are not highly processed and do
not involve any chemical preservatives. Considering the antimicrobial compounds generated by LAB
are regarded as natural preservatives, the use of L. plantarum 21 B to decrease the fungal contamination
of sourdough baked products has interesting potential applications [40].
The objectives of the present study were to (1) characterize the outcome of soy flour addition to
wheat flour during fermentation; (2) analyze the conversion level of wheat flour and soy flour through
fermentation with two heterofermentative lactic acid bacteria (LAB) strains Lactobacillus plantarum (Lp)
and Lactobacillus casei (Lc) as single strain starter cultures, and in multiple strain starters together with
baker’s yeast Saccharomyces cerevisiae (Sc); and (3) to characterize the dynamic rheological properties
and effect of soy flour addition on bread dough throughout a 24 h fermentation after frozen storage.
2. Materials and Methods
2.1. Materials
Culture media components and other reagents were of analytical grade and obtained from VWR
International (Radnor, Pennsylvania, PA, USA) except peptone special obtained from Sigma-Aldrich
(Steinheim, Germany), and agar (Agar plant for cell culture) obtained from Applichem (Omaha,
NE, USA).
2.2. Microorganisms and Culture Conditions
The microorganisms used throughout this study were two Lactobacillus (Lb.) strains, Lb. plantarum
ATCC 8014 and Lb. casei ATCC 393, obtained from the University of Agricultural Science, and Veterinary
Medicine Cluj-Napoca and Sc (Pak Gida Uretim ve Pazarlama AS, Turkey) acquired from commerce.
The medium used for LAB was MRS broth (per liter: glucose, 20.0 g; yeast extract, 5.0 g; meat extract,
10.0 g; enzymatic digest of casein, 10.0 g; sodium acetate, 5.0 g; diammonium citrate, 2.0 g;
dipotassium hydrogen phosphate, 2.0 g; magnesium sulphate, 0.2 g; manganese sulphate, 0.05 g;
and polyoxyethylene sorbitan monooleate, and 1.08 g with a final pH of 6.4 ± 0.2 at 25 ◦ C). For the ScBiomolecules 2020, 10, x 4 of 15
citrate, 2.0 g; dipotassium hydrogen phosphate, 2.0 g; magnesium sulphate, 0.2 g; manganese
Biomolecules 2020, 10, 778 4 of 15
sulphate, 0.05 g; and polyoxyethylene sorbitan monooleate, and 1.08 g with a final pH of 6.4 ± 0.2 at
25 °C). For the Sc yeast strain, the medium used was GPY (per liter: glucose, 40.0 g; peptone, 5.0 g;
and
yeastyeast extract,
strain, 5.0 g). used was GPY (per liter: glucose, 40.0 g; peptone, 5.0 g; and yeast extract,
the medium
Microorganisms’ reactivation before experimental usage was in 9 mL MRS media by introducing
5.0 g).
1 mLMicroorganisms’
of LAB inoculumreactivation
or 1 g of dried yeast
before in GPY media.
experimental Vial
usage incubation
was performed
in 9 mL MRS media atby30 °C (yeast)
introducing
and 37 °C (LAB) for 18–24 h. The second propagation occurred in MRS/GPY
1 mL of LAB inoculum or 1 g of dried yeast in GPY media. Vial incubation performed at 30 ◦ C (yeast) broth, through the
inoculation of the activated
and 37 ◦ C (LAB) for 18–24 LAB
h. Theor yeast
second (10propagation
mL) and afterward
occurredincubated for 18–24
in MRS/GPY h. through the
broth,
Microorganism concentration of 10 8 CFU/mL was determined with the spectrophotometer
inoculation of the activated LAB or yeast (10 mL) and afterward incubated for 18–24 h.
NanoDrop 1000 (NanoDrop
Microorganism concentrationTechnologies,
of 108 CFU/mL Wilmington, DE, USA)
was determined withthrough optical density
the spectrophotometer
measurement at 600 nm (OD600) between values 0.009 and 0.011 for bacteria
NanoDrop 1000 (NanoDrop Technologies, Wilmington, DE, USA) through optical density measurement or with Thoma counting
chamber (Marienfeld, Germany) under the microscope (Nikon, Japan)
at 600 nm (OD600) between values 0.009 and 0.011 for bacteria or with Thoma counting chamber for yeasts [41]. In 500 mL
model mediaGermany)
(Marienfeld, (MRS/GPY) underthetheexperiment
microscopestarted,
(Nikon, following the addition
Japan) for yeasts of 50
[41]. In 500 mLmL from
model the
media
established concentration of 10 8 bacteria/yeast. Samples for HPLC (5 mL), viability (1 mL), and wet
(MRS/GPY) the experiment started, following the addition of 50 mL from the established concentration
biomass (1 mL) extracted
of 108 bacteria/yeast. at 0, 2,
Samples for4,HPLC
6, 8, 10,
(5 12
mL),h, and at 24(1
viability h mL),
to monitor
and wetthebiomass
changes(1(Figure 2). Two
mL) extracted
single
at 0, 2,and
4, 6,one co-culture
8, 10, 12 h, andfermentation: (S1) Lp,
at 24 h to monitor (S2)
the Lc, (S3)(Figure
changes Lp, Lc, 2).
andTwo
Sc. single and one co-culture
fermentation: (S1) Lp, (S2) Lc, (S3) Lp, Lc, and Sc.
(a)
(b) (c)
Figure 2. (a).
(a). Microorganism
Microorganism activation,
activation, (b)
(b) washing
washing process,
process, and (c) dilutions.
2.3. Sourdough
2.3. Sourdough Preparation
Preparation
A commercial
A commercialwheat
wheatflour,
flour,used forfor
used traditional bread
traditional making
bread (type(type
making 000, according to the ash
000, according content
to the ash
by the Romanian classification), with 15.3% moisture and 11.2% protein, was
content by the Romanian classification), with 15.3% moisture and 11.2% protein, was used. The used. The sourdough
preparation preparation
sourdough included ratio flour: water
included ratioof 1:1, to
flour: produce
water a dough
of 1:1, yield of
to produce 200 (dough
a dough yieldmass/flour mass
of 200 (dough
× 100). Themass
mass/flour soybean provided
× 100). by theprovided
The soybean Agricultural Research
by the and Development
Agricultural Research andCenter Turda (https://
Development Center
scdaturda.ro/onix/). The obtained soybean variety was Onix (Glycine max (L.) Merril),
Turda (https://scdaturda.ro/onix/). The obtained soybean variety was Onix (Glycine max (L.) Merril), with conventional
soil cultivation
with system
conventional soilthrough tillagesystem
cultivation and 60% autumntillage
through rape vegetable
and 60%debris
autumn(green fertilizer).
rape vegetable Soybeans
debris
were ground (SF) and added to the wheat flour in the amount of 5% and 10%. The
(green fertilizer). Soybeans were ground (SF) and added to the wheat flour in the amount of 5% andpreparation consisted
of three
10%. Thetypes of fermentation
preparation consisted with 100% types
of three WF (batch A), 95% WFwith
of fermentation with100%
5% SFWF (batch B), and
(batch 90% WF
A), 95% WF with
with
10% of soy flour addition (batch C). Before fermentation, the measured wheat
5% SF (batch B), and 90% WF with 10% of soy flour addition (batch C). Before fermentation, the quantities went through
a sterilization process, and after the addition of 100 mL of autoclaved deionized water, the dough wentBiomolecules 2020, 10, 778 5 of 15
through a homogenization step. The ratio of obtained sourdough was 1 g−1 mL, with a final yield of
200 mL.
2.4. Fermentations
The fermentation of the different wheat concentrations with simple and co-cultures were carried
out separately. Sample prelevation as described before, as with the simple culture media, the only
difference was that for viability, samples were prelevated with sterile sample spoons and weighing
boats. For viability with pour plate method [42] first, 12-fold, respectively, 9-fold serial dilutions were
made in tubes with 9 mL physiological saline solution and 1 mL broth. In the Petri dish, 1 mL of diluted
inoculum and about 15 mL of warm MRS agar poured and mixed after which it was left to solidify.
Fungi viability developed with a spread plate method on potato dextrose agar. On the solidified agar,
100 µL inoculum spread evenly with a glass Drigalsky spatula on the surface of the agar. Plates for
LAB were incubated at 37 ◦ C for 48 h and for fungi at 25 ◦ C for 48–72 h.
Before inoculation in wheat and soy flour broth, the culture media was centrifuged 10 min at 4 ◦ C,
7000 rpm, the supernatant discarded, and the pellet suspended with saline solution [43]. After this
washing step repeated two times, with NanoDrop, LAB concentration was measured, and the fungi
were counted with Thoma Counting Chamber.
2.5. Organic Acid and Secondary Metabolite Analysis by HPLC
After fermentation extraction and quantification of organic acids and secondary metabolites
was possible with the help of high-performance liquid chromatography (HPLC-Agilent 1200 series,
Santa Clara, CA, USA) equipped with solvent degasser, quaternary pumps, DAD detector coupled
with a mass detector, column thermostat, and automatic injector (Agilent Technologies, Santa Clara,
CA, USA). The separation of organic acids could be realized on reversed-phase chromatographic
column Acclaim OA (5 µm, 4 mm × 150 mm Dionex), eluted for 10 min with monosodium phosphate
solution (NaH2 PO4 ) 50 mM concentration, pH 2.8, and a flow rate of 0.5 mL/min, at a temperature of
20 ◦ C. The measurement of chromatograms was possible at the wavelength λ = 210 nm.
Sample preparation for the HPLC consisted of the addition of 2 mL distilled H2 O to 1 g of sample,
which was vortexed 30 sec, sonicated 15 min, and centrifuged at 8000 rpm for 10 min at 4 ◦ C. After these
steps, the supernatant was filtered with a Millipore membrane filter of 0.45 µm pore size [44]. A volume
of 20 µL of sample was injected in the column, with a flow rate of 0.5 mL/min, and detection conducted
at 280 and 340 nm [45].
2.6. pH Measurements
The pH measurement through the in vitro experiments was determined with a digital pH
meter (InoLab 7110, Germany) at room temperature through dissolving 5.0 g of sample in 50 mL of
double-distilled water [46].
2.7. Rheological Measurements
For rheological measurements, samples were kept at −20 ◦ C (frozen storage), and before
measurements, they were defrosted at room temperature. The dough’s dynamic rheological
characteristics were analyzed utilizing an Anton Paar MCR 72 rheometer (Anton Paar, Graz,
Austria) [47,48], supplied with a Peltier plate-plate system (P-PTD 200/Air) with temperature control and
a 50 mm diameter smooth parallel plate geometry (PP-50-67300). On the lower plate, after supplying
around 3 g of dough, the upper plate was lowered to a plate distance set at a gap of 1 mm. After the
removal of the dough surplus from the exterior of the upper plate geometry, to avoid sample drying
through testing, silicone oil was added.Biomolecules 2020, 10, 778 6 of 15
2.8. Statistical Analysis
The results of three independent assays (performed with replicates each) were expressed as mean
value ± SD, n = 3. The statistical evaluation was carried out using Graph Prism Version 8.0.1. (GraphPad
Software Inc., San Diego, CA, USA) through a one-way ANOVA (Tukey multiple comparisons tests).
Differences among means at a 5% level have been considered statistically significant.
3. Results and Discussions
3.1. pH and Cell Viability
In general, for all fermentations, reached cell counts for LAB were of 1010 –1012 CFU/mL for
model media and 108 –109 CFU/mL for sourdough fermentation (Table 1). These cell counts were
reached during the first 24 h fermentation. Initially, the analysis of microorganism viability on
model media, presented a high increase, especially the LAB Lc (S2) and in the co-cultures (S3) with a
final concentration of above 1012 CFU/mL. The viability on three different substrates reached a final
concentration above 109 CFU/mL. The highest viability observed was with the LAB Lp, and the increase
was uniform throughout the experiment, while Lc at the beginning presented a slower growth, but the
final concentration was similar to Lp. No negative effect on the viability of LAB could be observed in
the presence of Sc. In contrary LAB together with Sc yeast, presented the highest viability on substrate
with 10% and 5% soy flour addition. Comparing the results in a similar study [49] LAB presented a
lower initial (106 CFU/mL) and final cell density (109 CFU/mL at 24 h) in model media and the same
results as in our study in sourdough.
Table 1. Viability and pH of the sourdough fermentations.
M.M. A B C
Sourdough Fermentation Batch
pH range C.c. (CFU/g) W.B. (g/L) pH range C.c. (CFU/g) pH range C.c. (CFU/g) pH range C.c. (CFU/g)
Initial 6.39 ± 0.12 1 × 10⁸ 0.0036 ± 0.001 6.12 ± 0.19 3.0 × 10⁶ 6.07 ± 0.22 2.0 × 10⁶ 6.02 ± 0.09 2.2 × 10⁶
S1
Final 3.58 ± 0.23 4.3 × 10¹⁰ 0.0172 ± 0.004 3.79 ± 0.16 4.8 × 10⁹ 3.81 ± 0.25 3.3 × 10⁹ 3.64 ± 0.27 4.1 × 10⁹
Initial 6.41 ± 0.34 3.5 × 10⁸ 0.0054 ± 0.002 6.15 ± 0.21 3.0 × 10⁵ 5.62 ± 0.17 8.0 × 10⁵ 5.73 ± 0.35 2.0 × 10⁵
S2
Final 3.56 ± 0.19 9.5 × 10¹² 0.0159 ± 0.007 3.81 ± 0.08 1.5 × 10⁹ 3.34 ± 0.10 3.5 × 10⁹ 3.35 ± 0.15 5.7 × 10⁹
Initial LAB 6.37 ± 0.12 2.0 × 10⁸ 0.0069 ± 0.001 6.19 ± 0.09 3.0 × 10⁵ 5.14 ± 0.05 1.5 × 10⁵ 5.09 ± 0.12 3.0 × 10⁵
Final LAB 3.36 ± 0.32 1.5 × 10¹² 0.0156 ± 0.003 3.92 ± 0.11 1.1 × 10⁹ 3.55 ± 0.30 4.2 × 10⁹ 3.50 ± 0.26 2.9 × 10⁹
S3
Initial Sc 6.37 ± 0.12 4.7 × 10⁶ 0.0069 ± 0.001 6.19 ± 0.09 1.7 × 10³ 5.14 ± 0.05 2.4 × 10³ 5.09 ± 0.12 1.9 × 10³
Final Sc 3.36 ± 0.32 1.8 × 10⁸ 0.0156 ± 0.003 3.92 ± 0.11 1.8 × 10⁷ 3.55 ± 0.30 2.6 × 10⁷ 3.50 ± 0.26 4.1 × 10⁷
M.M.—model media, A—100% WF, B—95% WF + 5% SF, C—90% WF + 10% SF, S1—L. plantarum, S2—L. casei,
S3—L. plantarum + L. casei + S. cerevisiae, LAB—L. plantarum + L. casei, Initial—analyzed at 0 h, final—analyzed at
24 h, W.B.—Wet Biomass, WF—wheat flour, SF—soy flour, C.c.—Cell count.
Soy flour addition to wheat flour had a positive effect especially in fermentations with Lc,
reaching final values of 5.7 × 10⁹ CFU/mL in comparison to the values obtained with 100% wheat
flour of 3.3 × 10⁹ CFU/mL. In co-cultures with the addition of 10% soy flour, the viability also
increased for LAB (from 1.1 × 10⁹ CFU/mL with 100% wheat flour to 2.9 × 10⁹ CFU/mL with 10%
soy flour) and Sc (from 1.8 × 10⁷ CFU/mL with 100% wheat flour to 4.1 × 10⁷ CFU/mL with 10% soy
flour). As demonstrated by Aguirre et al. [18,50] several LAB efficiently degrade soy as a substrate,
especially Lp. Depending on the applied fermentation conditions, especially refreshment time and the
substrate, the pH values differed (Table 1). The lowest pH values were obtained with co-cultures (3.4) in
model media. In the case of model media, due to carbohydrates like glucose that was more accessible,
the viability increased, and the pH decreased faster than sourdough where the microorganisms had to
break down starch to glucose.
At sourdough fermentation, the lowest pH value (3.4–3.6) was reached in fermentation batch C,
and the highest (3.8–3.9) was reached in fermentation batch A. These data indicated the growth and
metabolic activity of the LAB during the whole fermentation period.
In a study from Paucean et al. [49], pH started from approximately 6.12. After 24 h in modified
model media, the pH reached a final value of 4.35 with Lp and 4.57 with Lc in media containing only
glucose as a carbohydrate. Similar results were obtained with maltose (Lp-4.81 and Lc-4.62), and inBiomolecules 2020, 10, 778 7 of 15 media with glucose and fructose (Lp-4.1 and Lc-4.85). In media containing only fructose (Lp-5.59 and Lc-5.64), the pH had not decreased substantially. In sourdoughs, the obtained pH values reached the same results as in the present study
and G’’ were higher than at the beginning of the fermentation. The higher elasticity in batch C can be
explained mainly by the water holding capacity of soy proteins during frozen storage (-20 °C) and
the disruption of sourdough macromolecules like gluten proteins [19]. Soy and wheat proteins are
capable of binding covalently and non-covalently (e.g., disulfide and hydrogen bonds) [53], and the
strong binding capacity of soy protein to water is less affected through freezing [53].
Biomolecules 2020, 10, 778                                                                                              8 of 15

                               (a)                                                          (b)

                               (c)                                                          (d)

Biomolecules 2020, 10, x                                                                                                8 of 15

                               (e)                                                          (f)

                               (g)                                                          (h)

                                                              (i)
      Figure 3.
      Figure  3. The
                 The storage
                      storage (G’)
                               (G’) and
                                    and loss
                                         loss (G’’) shear moduli
                                              (G”) shear  moduli forfor sourdoughs
                                                                        sourdoughs fermented
                                                                                      fermented in in 100%
                                                                                                      100% wheat
                                                                                                            wheat flour
                                                                                                                    flour
      with  (a) Lp, (b) Lc, and (c) Lp +  Lc + Sc; 95%  wheat   + 5%  soy  flour  with (d) Lp, (e)  Lc, and (f)
      with (a) Lp, (b) Lc, and (c) Lp + Lc + Sc; 95% wheat + 5% soy flour with (d) Lp, (e) Lc, and (f) Lp + Lc  Lp + Lc +
                                                                                                                        +
      Sc; and  90%   wheat  + 10%  soy flour  with  (g) Lp, (h) Lc, and  (i) Lp + Lc + Sc through
      Sc; and 90% wheat + 10% soy flour with (g) Lp, (h) Lc, and (i) Lp + Lc + Sc through 24 h.     24  h.

     Wheat flour combined with water results in a hydrated gluten network that gives the viscoelastic
property of sourdough. The right amount of water is important in sourdough preparation, and due
to non-miscible properties of wheat biopolymers, it is present in each phase of bread making [54].
The study of sourdough rheological properties is associated with different wheat or other types of
Biomolecules 2020, 10, 778 9 of 15
3.3. Organic Acid and Secondary Metabolite Analysis by HPLC
LAB greatly influences the sensory, textural, nutritional, and shelf-life characteristics of sourdough
baked goods, especially bread [59]. For a long time, the improved shelf life of sourdough baked
products was attributed to the lactic and acetic acids produced by LAB [60,61]. Further studies [62–64]
have shown that lactic acid is not inhibitory to fungi, while the acetic acid concentration seems to
be more strictly related to the antifungal activity [40]. Acetic acid through sourdough fermentation
also enhances the aroma profile of bread [65]. The acetic acid concentration in sourdough may be
increased by adding fructose, which is used as an external electron acceptor by heterofermentative
LAB, which consequently increases the growth yield and acetic acid production [40].
In the present study, the ratio of acetic acid production in model media was elevated, but in
sourdough was very low (Tables 2–4) or there was no production at all, which is in concordance with
similar studies [49,51]. However, where there was a 10% soy flour addition (Table 4) it can be seen
that after 24 h of fermentation there was a slight acetic acid production of 0.022 ± 0.03 g/L with Lp,
0.186 ± 0.07 g/L with Lc, and the highest production was observed with co-cultures of 0.294 ± 0.10 g/L.
Depending on the used LAB through the sourdough fermentation taking place, the metabolism
of organic acids like citrate, fumarate, and malate. Lactate, malate, and citrate transformation uses
intracellular protons and consequently enhances the LAB’s tolerance to the acidic environment [32].
In the present study, fermentation most probably uses the pathway of converting citrate into lactate
(no acetic acid production in our case) together with malate fermentation.
Lactic acid concentration at 0 h in sourdoughs was absent or in a very low concentration
(0.3–0.5 g/L). After a fermentation of 24 h, the highest lactic acid production could be observed with Lp,
especially in sourdoughs from batch B with 5% soy flour. The production of lactic acid in batch B with
single Lp culture was 3.787 ± 0.03 g/L and in co-cultures together with Lc and Sc was 4.879 ± 0.03 g/L.
The lowest lactic acid production was observed in batch A with both single cultures (2.137–2.178 g/L),
but with co-cultures lactic acid production increased significantly to 3.787 g/L.
Fumaric acid presented a low but continuous amount during the whole 24 h of fermentation.
According to several studies, malic and fumaric acid are usually converted to succinic acid in
LAB [66–68].
Table 2. Organic acid production through fermentation with Lp.
Org. Acids (g/L)
Lactic A. Acetic A. Malic A. Succinic A. Tartaric A. Citric A. Fumaric A.
Substr. Time (h)
0 n.d. 0.663 ± 0.07 a 1.384 ± 0.05 a 6.609 ± 0.14 a 0.342 ± 0.06 a 3.081 ± 0.07 a 0.033 ± 0.07 a
4 1.812 ± 0.04 a 1.812 ± 0.09 a 2.139 ± 0.06 a 9.496 ± 0.10 a 0.668 ± 0.07 a 3.430 ± 0.08 a 0.015 ± 0.02 a
MM
10 2.899 ± 0.06 a 2.408 ± 0.10 a 1.641 ± 0.04 a 8.259 ± 0.08 a 0.478 ± 0.08 a 1.630 ± 0.08 a 0.017 ± 0.01 a
24 7.856 ± 0.06 a 2.899 ± 0.09 a 1.557 ± 0.09 a 8.361 ± 0.11 a 0.451 ± 0.12 a 0.813 ± 0.05 a 0.017 ± 0.02 a
0 0.363 ± 0.08 a n.d. 0.482 ± 0.06 b 0.673 ± 0.08 c 0.152 ± 0.05 b n.d. 0.027 ± 0.06 a
4 0.462 ± 0.07 b n.d. 0.494 ± 0.07 c 1.077 ± 0.08 d 0.169 ± 0.07 b n.d. 0.029 ± 0.04 a
A
10 0.643 ± 0.08 c n.d. 0.570 ± 0.06 b 0.572 ± 0.04 d 0.186 ± 0.02 b n.d. 0.013 ± 0.04 a
24 1.514 ± 0.06 d n.d. 0.468 ± 0.10 b 0.130 ± 0.03 d 0.100 ± 0.08 b 0.212 ± 0.03 b 0.008 ± 0.02 a
0 n.d. n.d. 0.612 ± 0.09 b 1.286 ± 0.04 b 0.354 ± 0.06 a 0.414 ± 0.05 b 0.037 ± 0.08 a
4 n.d. n.d. 0.619 ± 0.11 b,c 1.437 ± 0.09 c 0.339 ± 0.06 ab 0.371 ± 0.05 c 0.037 ± 0.07 a
B
10 1.328 ± 0.06 b,c n.d. 1.323 ± 0.04 a 1.918 ± 0.03 c 0.459 ± 0.04 a 0.532 ± 0.08 b 0.034 ± 0.06 a
24 3.787 ± 0.03 b n.d. 1.025 ± 0.09 a 0.785 ± 0.08 c 0.205 ± 0.07 b 0.295 ± 0.07 b 0.007 ± 0.01 a
0 n.d. n.d. 0.457 ± 0.13 b 0.531 ± 0.07 c 0.181 ± 0.07 b 0.450 ± 0.06 b 0.027 ± 0.05 a
4 n.d. n.d. 1.471 ± 0.08 b 3.993 ± 0.05 b 0.589 ± 0.08 a 0.979 ± 0.06 b 0.024 ± 0.03 a
C
10 1.634 ± 0.12 b n.d. 1.393 ± 0.03 a 3.564 ± 0.08 b 0.598 ± 0.07 a 0.648 ± 0.08 b 0.010 ± 0.02 a
24 3.330 ± 0.01 c n.d. 1.004 ± 0.07 a 1.070 ± 0.06 b 0.393 ± 0.13 a 0.362 ± 0.09 b 0.001 ± 0.00 a
Results (displayed as mean values ± SD, g/L, n = 3), in every column significant differences (p < 0.05) are shown with
different letters (a–d) between the types of substrate used (one-way ANOVA, multiple comparisons test, and Tukey
multiple range test (p = 0.05), GraphPad Prism, Version 8.0.1, Graph Pad S., Inc., San Diego, CA, USA). A—100%
WF, B—95% WF + 5% SF, C—90% WF + 10% SF, WF—wheat flour, SF—soy flour.Biomolecules 2020, 10, 778 10 of 15
Table 3. Organic acid production through fermentation with Lc.
Org. Acids (g/L)
Lactic A. Acetic A. Malic A. Succinic A. Tartaric A. Citric A. Fumaric A.
Substr. Time (h)
0 2.496 ± 0.04 a 3.571 ± 0.11 a 1.225 ± 0.04 a 3.661 ± 0.11 a 0.371 ± 0.07 a 2.930 ± 0.04 a 0.029 ± 0.05 a
4 3.139 ± 0.08 a 4.081 ± 0.09 a 1.367 ± 0.14 a 8.448 ± 0.09 a 0.463 ± 0.08 a 3.141 ± 0.07 a 0.020 ± 0.09 a
MM
10 4.972 ± 0.10 a 3.062 ± 0.06 a 1.831 ± 0.05 a 9.244 ± 0.09 a 0.558 ± 0.06 a 3.174 ± 0.07 a 0.014 ± 0.07 a
24 8.329 ± 0.04 a 2.369 ± 0.12 a 1.870 ± 0.08 a 3.787 ± 0.08 a 0.495 ± 0.05 a 1.091 ± 0.07 a 0.015 ± 0.04 a
0 n.d. n.d. 0.402 ± 0.06 b n.d. 0.099 ± 0.03 b 0.225 ± 0.06 c 0.023 ± 0.01 a
4 n.d. n.d. 0.518 ± 0.11 b n.d. 0.325 ± 0.06 a 1.052 ± 0.10 b 0.024 ± 0.12 a
A
10 0.931 ± 0.12 b n.d. 0.473 ± 0.07 b n.d. 0.297 ± 0.06 a,b 0.242 ± 0.09 b 0.022 ± 0.08 a
24 2.137 ± 0.01 b n.d. 0.737 ± 0.07 b n.d. 0.259 ± 0.05 a,b 0.521 ± 0.10 b 0.033 ± 0.06 a
0 n.d. n.d. 0.451 ± 0.07 b n.d. 0.217 ± 0.07 a,b 0.559 ± 0.07 b 0.025 ± 0.04 a
4 0.534 ± 0.07 b n.d. 0.966 ± 0.05 a,b n.d. 0.301 ± 0.09 a 0.808 ± 0.08 b,c 0.032 ± 0.02 a
B
10 0.149 ± 0.05 b n.d. 0.491 ± 0.07 b n.d. 0.303 ± 0.04 a,b 0.364 ± 0.10 b 0.010 ± 0.01 a
24 1.878 ± 0.04 c n.d. 0.666 ± 0.12 b n.d. 0.205 ± 0.04 b 0.273 ± 0.08 b 0.003 ± 0.01 a
0 n.d. n.d. 0.451 ± 0.06 b n.d. 0.126 ± 0.06 b 0.176 ± 0.7 c 0.020 ± 0.04 a
4 n.d. n.d. 0.506 ± 0.04 b n.d. 0.200 ± 0.05 a 0.427 ± 0.08 c 0.031 ± 0.07 a
C
10 0.349 ± 0.08 b n.d. 0.432 ± 0.11 b n.d. 0.128 ± 0.02 b 0.231 ± 0.10 b 0.001 ± 0.00 a
24 2.212 ± 0.11 b n.d. 0.657 ± 0.05 b n.d. 0.456 ± 0.08 a 1.133 ± 0.11 a 0.004 ± 0.01 a
Results (displayed as mean values ± SD, g/L, n = 3), in every column significant differences (p < 0.05) are shown with
different letters (a–d) between the types of substrate used (one-way ANOVA, multiple comparisons test, and Tukey
multiple range test (p = 0.05), GraphPad Prism, Version 8.0.1, Graph Pad S., Inc., San Diego, CA, USA). A—100%
WF, B—95% WF + 5% SF, C—90% WF + 10% SF, WF—wheat flour, SF—soy flour.
Table 4. Organic acid production through fermentation with Lp + Lc + Sc.
Org. Acids (g/L)
Lactic A. Acetic A. Malic A. Succinic A. Tartaric A. Citric A. Fumaric A.
Substr. Time (h)
0 2.079 ± 0.09 a 2.870 ± 0.10 a 1.501 ± 0.10 a 8.057 ± 0.09 a 0.407 ± 0.08 a 4.604 ± 0.08 a 0.016 ± 0.04 a
4 3.267 ± 0.08 a 4.004 ± 0.05 a 1.689 ± 0.09 a 9.681 ± 0.11 a 0.517 ± 0.11 a 3.688 ± 0.08 a 0.013 ± 0.07 a
MM a a a a a
10 4.715 ± 0.06 4.147 ± 0.08 1.724 ± 0.09 7.907 ± 0.07 0.387 ± 0.09 1.814 ± 0.12b 0.021 ± 0.04 a
24 4.935 ± 0.07 a 4.918 ± 0.07 a 0.934 ± 0.1 a 8.094 ± 0.18 0.395 ± 0.07 a 1.996 ± 0.06 a 0.021 ± 0.09 a
0 n.d. n.d. 0.359 ± 0.07 c n.d. 0.436 ± 0.04 a 0.391 ± 0.05 c 0.044 ± 0.02 a
4 n.d. n.d. 0.682 ± 0.06 a,b n.d. 0.556 ± 0.10 a 1.244 ± 0.07 b 0.049 ± 0.07 a
A b b b c
10 0.578 ± 0.06 n.d. 0.838 ± 0.03 n.d. 0.203 ± 0.02 0.389 ± 0.09 0.037 ± 0.08 a
24 2.178 ± 0.03 c 0.022 ± 0.03 d 0.575 ± 0.11 b n.d. 0.176 ± 0.08 b 0.198 ± 0.09 c 0.010 ± 0.03 a
0 n.d. n.d. 0.675 ± 0.10 b n.d. 0.314 ± 0.11 a 0.752 ± 0.13 b 0.051 ± 0.10 a
4 n.d. n.d. 0.355 ± 0.04 b n.d. 0.116 ± 0.04 b 0.630 ± 0.08 b 0.020 ± 0.08 a
B b b a,b b,c
10 0.899 ± 0.06 n.d. 1.152 ± 0.06 n.d. 0.252 ± 0.01 0.603 ± 0.09 0.030 ± 0.07 a
24 4.879 ± 0.03 a 0.186 ± 0.07 c 1.263 ± 0.02 a n.d. 0.334 ± 0.05 a 0.396 ± 0.04 b,c 0.003 ± 0.06 a
0 0.553 ± 0.13 b n.d. 0.964 ± 0.05 a,b n.d. 0.335 ± 0.08 a 0.887 ± 0.09 b 0.032 ± 0.08 a
4 0.339 ± 0.07 b n.d. 1.180 ± 0.06 a n.d. 0.379 ± 0.06 a,b 1.252 ± 0.08 b 0.043 ± 0.03 a
C b b b a b
10 0.921 ± 0.06 n.d. 1.212 ± 0.08 1.026 ± 0.07 0.359 ± 0.05 0.986 ± 0.07 0.018 ± 0.08 a
24 3.580 ± 0.01 b 0.294 ± 0.10 b 0.533 ± 0.02 b 0.799 ± 0.10 b 0.375 ± 0.02 a 0.633 ± 0.12 b 0.003 ± 0.07 a
Results (displayed as mean values ± SD, g/L, n = 3), in every column significant differences (p < 0.05) are shown with
different letters (a–d) between the types of substrate used (one-way ANOVA, multiple comparisons test, and Tukey
multiple range test (p = 0.05), GraphPad Prism, Version 8.0.1, Graph Pad S., Inc., San Diego, CA, USA). A—100%
WF, B—95% WF + 5% SF, C—90% WF + 10% SF, WF—wheat flour, SF—soy flour.
The production of malic acid, primarily used in the food industry as a taste intensifier and an
acidulant is especially a result of yeast fermentation [69]. Malic acid production in these experiments
was in accordance with similar studies [51], which shows the equilibrium during hydrolysis of starch,
which is conditioned of microbial and enzymatic transformation (amylases and maltose metabolic
enzymes) at every stage of dough fermentation [70]. The presence of soy flour in fermentation increased
the malic acid concentration (0.847 ± 0.39) in comparison with samples where only wheat flour was
used (0.550 ± 0.14).
When LAB remains without any carbohydrate, they might utilize citric acid as an energy
supply [66]. In the present study citric acid, production during fermentation presented fluctuating
results, but usually, until the end of fermentation, it began to decrease. Hu et al. [71], characterized the
antimicrobial activity of three Lp strains from isolated dairy food and proved that organic acids presentBiomolecules 2020, 10, 778 11 of 15
an important factor as antimicrobial substances in fermentation broths. These organic acids display
the best antimicrobial activity, especially if they are mixed in different concentrations. Beside lactic and
acetic acid, citric, malic, and tartaric acid also possess antimicrobial activity.
Succinic acid production in model media was in concordance with Kaneuchi et al. [66], who showed
that Lactobacillus strains produce various amounts of succinic acid in MRS media. In the present study,
succinic acid production increased for Lp at 4 h of 9.496 ± 0.10 g/L, Lc at 10 h of 9.244 ± 0.09 g/L, and in
co-culture at 4 h of 9.681 ± 0.11 g/L, after which it decreased. In sourdoughs, succinic acid was only
produced where Lp was present, with an increase after 4 h of fermentation and decreased until 24 h.
Succinic acid production increased with the increase of soybean flour with the highest values in batch
A of 1.077 ± 0.08, batch B of 1.918 ± 0.03, and batch C of 3.993 ± 0.05 g/L. Considering Lp, has an
incomplete tricarboxylic acid cycle and a natural producer of succinic acid; this LAB is extensively
researched in studies of metabolic engineering for higher succinic acid production [72].
4. Conclusions
Sourdough fermentation with single and co-cultures of LAB and yeast has several beneficial
effects, and soy-flour incorporation further improved sourdough quality. The addition of soy-flour
to wheat flour had a positive impact, considering the fermentations with Lc (5.7 × 10 9 CFU/mL),
and co-cultures (LAB: 2.9 × 10⁹ ; Sc: 4.1 × 10 7 ). The metabolic activity and growth of microorganisms
was also observed with the decrease of pH value with final values of 3.4–3.6 with 10% of soy flour and
3.8–3.9 where no soy flour was added.
Some beneficial effects of soy-flour addition were the increase of organic acids after 24 h of
fermentation production especially with Lp (lactic: 3.330 ± 0.01 g/L, malic: 1.004 ± 0.07 g/L, and succinic
acid: 1.070 ± 0.06 g/L) and co-cultures of Lp + Lc + Sc (lactic: 3.580 ± 0.01 g/L and succinic acid:
0.799 ± 0.10 g/L). Acetic acid production in sourdoughs was only observed in co-cultures and also
increased with the increase of soy-flour at a final value of 0.294 ± 0.10 g/L.
The incorporation of soy-flour in wheat flour during sourdough preparation generated relatively
important alterations in comparison with sourdough without any soy-flour addition. The addition
of 10% of soy-flour presented enhanced rheological properties, like increased elastic behavior.
Although every sourdough exhibited a constant elastic-like behavior, the incorporation of soy-flour
presented higher elasticity, which is due to the water retention ability of soy-protein in the course of
frozen storage. The highest elasticity was obtained after 24 h of fermentation and especially where Lc
was present.
Supplementary Materials: The following are available online at http://www.mdpi.com/2218-273X/10/5/778/s1,
Table S1. Standard deviation of storage (G’) and loss (G”) shear moduli for 100% wheat flour with Lp; Table S2.
Standard deviation of storage (G’) and loss (G”) shear moduli for 100% wheat flour with Lc; Table S3. Standard
deviation of storage (G’) and loss (G”) shear moduli for 100% wheat flour with Lp + Lc + Sc; Table S4. Standard
deviation of storage (G’) and loss (G”) shear moduli for 95% wheat + 5% soy flour with Lp; Table S5. Standard
deviation of storage (G’) and loss (G”) shear moduli for 95% wheat + 5% soy flour with Lc; Table S6. Standard
deviation of storage (G’) and loss (G”) shear moduli for 95% wheat + 5% soy flour with Lp + Lc + Sc; Table S7.
Standard deviation of storage (G’) and loss (G”) shear moduli for 90% wheat + 10% soy flour with Lp; Table S8.
Standard deviation of storage (G’) and loss (G”) shear moduli for 90% wheat + 10% soy flour with Lc; Table S9.
Standard deviation of storage (G’) and loss (G”) shear moduli for 90% wheat + 10% soy flour with Lp + Lc + Sc.
Author Contributions: D.C.V. and B.-E.T. conceived and designed the study. B.-E.T., A.G.M., F.C., and F.R.
performed the experiments. D.C.V., B.-E.T., and A.G.M., undertook the data analysis and co-wrote the paper.
All authors have read and agreed to the published version of the manuscript.
Funding: This work was supported by the National Research, Development and Innovations Program for
2015-2020-PNII, developed with the support of UEFISCDI (Project No. PN-III-P1-1.2-PCCDI-2017-0056; 2PCCDI).
Acknowledgments: The authors would like to thank their colleagues from the Department of Food Science, for
continued support.
Conflicts of Interest: The authors declare no conflict of interest. The funders had no role in the design of the
study; in the collection, analyses, or interpretation of data; in the writing of the manuscript, or in the decision to
publish the results.Biomolecules 2020, 10, 778 12 of 15
References
1. Zhao, Z.; Mu, T.; Sun, H. Microbial characterization of five Chinese traditional sourdoughs by high-throughput
sequencing and their impact on the quality of potato steamed bread. Food Chem. 2019, 274, 710–717. [CrossRef]
2. Winters, M.; Panayotides, D.; Bayrak, M.; Rémont, G.; Viejo, C.G.; Liu, D.; Le, B.; Liu, Y.; Luo, J.; Zhang, P.;
et al. Defined co-cultures of yeast and bacteria modify the aroma, crumb and sensory properties of bread.
J. Appl. Microbiol. 2019, 127, 778–793. [CrossRef] [PubMed]
3. Corona, O.; Alfonzo, A.; Ventimiglia, G.; Nasca, A.; Francesca, N.; Martorana, A.; Moschetti, G.; Settanni, L.
Industrial application of selected lactic acid bacteria isolated from local semolinas for typical sourdough
bread production. Food Microbiol. 2016, 59, 43–56. [CrossRef] [PubMed]
4. Maidana, S.D.; Ficoseco, C.A.; Bassi, D.; Cocconcelli, P.S.; Puglisi, E.; Savoy, G.; Vignolo, G.; Fontana, C.
Biodiversity and technological-functional potential of lactic acid bacteria isolated from spontaneously
fermented chia sourdough. Int. J. Food Microbiol. 2020, 316, 108425. [CrossRef] [PubMed]
5. Liu, T.; Li, Y.; Yang, Y.; Yi, H.; Zhang, L.; He, G. The influence of different lactic acid bacteria on sourdough
flavor and a deep insight into sourdough fermentation through RNA sequencing. Food Chem. 2020, 307,
125529. [CrossRef]
6. Montemurro, M.; Coda, R.; Rizzello, C.G. Recent Advances in the Use of Sourdough. Foods 2019, 8, 129.
[CrossRef]
7. Mironeasa, S.; Mironeasa, C. Dough bread from refined wheat flour partially replaced by grape peels:
Optimizing the rheological properties. J. Food Process. Eng. 2019, 42, 1–14. [CrossRef]
8. Călinoiu, L.F.; Vodnar, D.C. Whole Grains and Phenolic Acids: A Review on Bioactivity, Functionality, Health
Benefits and Bioavailability. Nutrients 2018, 10, 1615. [CrossRef]
9. Kang, J.; Badger, T.M.; Ronis, M.J.J.; Wu, X. Non-Isoflavone phytochemicals in soy and their health effects.
J. Agric. Food Chem. 2010, 58, 8119–8133. [CrossRef]
10. Liu, Y.; Hilakivi-Clarke, L.; Zhang, Y.; Wang, X.; Pan, Y.X.; Xuan, J.; Fleck, S.C.; Doerge, D.R.; Helferich, W.G.
Isoflavones in soy flour diet have different effects on whole-genome expression patterns than purified
isoflavone mix in human MCF-7 breast tumors in ovariectomized athymic nude mice. Mol. Nutr. Food Res.
2015, 59, 1419–1430. [CrossRef]
11. Ribotta, P.D.; León, A.E.; Pérez, G.T.; Añón, M.C. Electrophoresis studies for determining wheat-soy protein
interactions in dough and bread. Eur. Food Res. Technol. 2005, 221, 48–53. [CrossRef]
12. Zhang, B.; Yang, Z.; Huang, W.; Omedi, J.O.; Wang, F.; Zou, Q.; Zheng, J. Isoflavone aglycones enrichment in
soybean sourdough bread fermented by Lactic acid bacteria strains isolated from traditional Qu starters:
Effects on in-vitro gastrointestinal digestion, nutritional, and baking properties. Cereal Chem. 2018, 96,
129–141. [CrossRef]
13. Ryan, K.J.; Homco-Ryan, C.L.; Jenson, J.; Robbins, K.L.; Prestat, C.; Brewer, M.S. Lipid extraction process on
texturized soy flour and wheat gluten protein-protein interactions in a dough matrix. Cereal Chem. 2002, 79,
434–438. [CrossRef]
14. Bojňanská, T.; Šmitalová, J.; Vollmannová, A.; Tokár, M.; Vietoris, V. Bakery products with the addition of
soybean flour and their quality after freezer storage of dough. J. Microbiol. Biotechnol. Food Sci. 2015, 4, 18–22.
[CrossRef]
15. Friedman, M.; Brandon, D.L. Nutritional and health benefits of soy proteins. J. Agric. Food Chem. 2001, 49,
1069–1086. [CrossRef] [PubMed]
16. Faraj, A.; Vasanthan, T. Soybean Isoflavones: Effects of Processing and Health Benefits. Food Rev. Int. 2004,
20, 51–75. [CrossRef]
17. Besler, M.; Helm, R.M.; Ogawa, T. Soybean (Glycine max L.) Allergen Data Collection—Update: Internet Symp.
Food Allerg. 2000, 2, 1–35.
18. Aguirre, L.; Hebert, E.M.; Garro, M.S.; de Giori, G.S. Proteolytic activity of Lactobacillus strains on soybean
proteins. LWT-Food Sci. Technol. 2014, 59, 780–785. [CrossRef]
19. Simmons, A.L.; Smith, K.B.; Vodovotz, Y. Soy ingredients stabilize bread dough during frozen storage.
J. Cereal Sci. 2015, 56, 232–238. [CrossRef]
20. De Vuyst, L.; Neysens, P. The sourdough microflora: Biodiversity and metabolic interactions. Trends Food
Sci. Technol. 2005, 16, 43–56. [CrossRef]Biomolecules 2020, 10, 778 13 of 15
21. Rizzello, C.G.; Lorusso, A.; Montemurro, M.; Gobbetti, M. Use of sourdough made with quinoa
(Chenopodium quinoa) flour and autochthonous selected lactic acid bacteria for enhancing the nutritional,
textural and sensory features of white bread. Food Microbiol. 2016, 56, 1–13. [CrossRef] [PubMed]
22. Poutanen, K.; Flander, L.; Katina, K. Sourdough and cereal fermentation in a nutritional perspective.
Food Microbiol. 2009, 26, 693–699. [CrossRef] [PubMed]
23. Clarke, C.I.; Arendt, E.K. A Review of the Application of Sourdough Technology to Wheat Breads. Adv. Food
Nutr. Res. 2005, 49, 137–161. [PubMed]
24. Östman, E. Fermentation as a Means of Optimizing the Glycaemic Index Food Mechanisms and Metabolic Merits with
Emphasis on Lactic Acid in Cereal Products; Lund Institute of Technology: Lund, Sweden, 2003; ISBN 9174220160.
25. Foster-Powell, K.; Holt, S.H.A.; Brand-Miller, J.C. International Table of Glycemic Index and Glycemic Load
values. Am. J. Clin. Nutr. 2002, 31, 5–56. [CrossRef] [PubMed]
26. Leroy, F.; De Vuyst, L. Lactic acid bacteria as functional starter cultures for the food fermentation industry.
Trends Food Sci. Technol. 2004, 15, 67–78. [CrossRef]
27. Martău, G.A.; Coman, V.; Vodnar, D.C. Recent advances in the biotechnological production of erythritol and
mannitol. Crit. Rev. Biotechnol. 2020, 1–15. [CrossRef]
28. Calinoiu, L.; Vodnar, D.; Precup, G. The Probiotic Bacteria Viability under Different Conditions. Bull. UASVM
Food Sci. Technol. 2014, 73, 55–60. [CrossRef]
29. Liu, Y.W.; Liong, M.T.; Tsai, Y.C. New perspectives of Lactobacillus plantarum as a probiotic: The gut-heart-brain
axis. J. Microbiol. 2018, 56, 601–613. [CrossRef]
30. Hui, Y.H.; Corke, H.; De Leyn, I.; Nip, W.-K.; Cross, N. Bakery Products Science and Technology, 1st ed.;
Wiley-Blackwell: Hoboken, NJ, USA, 2006; ISBN 9780813801872.
31. Abedfar, A.; Hosseininezhad, M.; Corsetti, A. Effect of wheat bran sourdough with exopolysaccharide
producing Lactobacillus plantarum (NR_104573.1)on quality of pan bread during shelf life. LWT 2019, 111,
158–166. [CrossRef]
32. Gobbetti, M.; Gänzle, M. Handbook on Sourdough Biotechnology; Springer: Berlin/Heidelberg, Germany, 2013;
ISBN 9781461454250.
33. Ly, D.; Mayrhofer, S.; Yogeswara, I.B.A.; Nguyen, T.H.; Domig, K.J. Identification, classification and screening
for γ-amino-butyric acid production in lactic acid bacteria from cambodian fermented foods. Biomolecules
2019, 9, 768. [CrossRef]
34. Hill, D.; Sugrue, I.; Tobin, C.; Hill, C.; Stanton, C.; Ross, R.P. The Lactobacillus casei group: History and health
related applications. Front. Microbiol. 2018, 9, 1–12. [CrossRef] [PubMed]
35. Reale, A.; Renzo, T.D.; Zotta, T.; Preziuso, M.; Boscaino, F.; Ianniello, R.; Storti, L.V.; Tremonte, P.; Coppola, R.
Effect of respirative cultures of Lactobacillus casei on model sourdough fermentation. LWT-Food Sci. Technol.
2016, 73, 622–629. [CrossRef]
36. Ryan, L.A.M.; Zannini, E.; Bello, F.D.; Pawlowska, A.; Koehler, P.; Arendt, E.K. Lactobacillus amylovorus DSM
19280 as a novel food-grade antifungal agent for bakery products. Int. J. Food Microbiol. 2011, 146, 276–283.
[CrossRef] [PubMed]
37. Tyler, C.A.; Kopit, L.; Doyle, C.; Yu, A.O.; Hugenholtz, J.; Marco, M.L. Polyol production during
heterofermentative growth of the plant isolate Lactobacillus florum 2F. J. Appl. Microbiol. 2016, 120, 1336–1345.
[CrossRef] [PubMed]
38. Park, D.M.; Bae, J.H.; Kim, M.S.; Kim, H.; Kang, S.D.; Shim, S.; Lee, D.; Seo, J.H.; Kang, H.; Han, N.S.
Suitability of Lactobacillus plantarum SPC-SNU 72-2 as a Probiotic Starter for Sourdough Fermentation.
J. Microbiol. Biotechnol. 2019, 29, 1729–1738. [CrossRef]
39. Sieuwerts, S.; Bron, P.A.; Smid, E.J. Mutually stimulating interactions between lactic acid bacteria and
Saccharomyces cerevisiae in sourdough fermentation. LWT-Food Sci. Technol. 2018, 90, 201–206. [CrossRef]
40. Lavermicocca, P.; Valerio, F.; Evidente, A.; Lazzaroni, S.; Corsetti, A.; Gobbetti, M. Purification and
characterization of novel antifungal compounds from the sourdough Lactobacillus plantarum strain 21B.
Appl. Environ. Microbiol. 2000, 66, 4084–4090. [CrossRef]
41. Mitrea, L.; Ranga, F.; Fetea, F.; Dulf, F.V.; Rusu, A.; Trif, M.; Vodnar, D.C. Biodiesel-Derived Glycerol Obtained
from Renewable Biomass—A Suitable Substrate for the Growth of Candida zeylanoides Yeast Strain ATCC
20367. Microorganisms 2019, 7, 265. [CrossRef]Biomolecules 2020, 10, 778 14 of 15
42. Renschler, M.A.; Wyatt, A.; Anene, N.; Robinson-Hill, R.; Pickerill, E.S.; Fox, N.E.; Griffith, J.A.; McKillip, J.L.
Using nitrous acid-modified de Man, Rogosa, and Sharpe medium to selectively isolate and culture lactic
acid bacteria from dairy foods. J. Dairy Sci. 2020, 103, 1215–1222. [CrossRef]
43. Vodnar, D.C.; Socaciu, C.; Rotar, A.M.; Stãnilã, A. Morphology, FTIR fingerprint and survivability of
encapsulated lactic bacteria (Streptococcus thermophilus and Lactobacillus delbrueckii subsp. bulgaricus) in
simulated gastric juice and intestinal juice. Int. J. Food Sci. Technol. 2010, 45, 2345–2351. [CrossRef]
44. Szabo, K.; Dulf, F.V.; Diaconeasa, Z.; Vodnar, D.C. Antimicrobial and antioxidant properties of tomato
processing byproducts and their correlation with the biochemical composition. LWT-Food Sci. Technol. 2019,
116, 108858. [CrossRef]
45. Călinoiu, L.-F.; Catoi, A.-F.; Vodnar, D.C. Solid-State Yeast Fermented Wheat and Oat Bran as A Route for
Delivery of Antioxidants. Antioxidants 2019, 8, 372. [CrossRef] [PubMed]
46. Mitrea, L.; Trif, M.; Vodnar, D.-C. The effect of crude glycerol impurities on 1,3-propanediol biosynthesis by
Klebsiella pneumoniae DSMZ 2026. Renew. Energy 2020, 153, 1418–1427.
47. Szabo, K.; Teleky, B.E.; Mitrea, L.; Călinoiu, L.F.; Martău, G.A.; Simon, E.; Varvara, R.A.; Vodnar, D.C. Active
packaging-poly (vinyl alcohol) films enriched with tomato by-products extract. Coatings 2020, 10, 141.
[CrossRef]
48. Mitrea, L.; Călinoiu, L.-F.; Martău, G.-A.; Szabo, K.; Teleky, B.-E.; Mures, an, V.; Rusu, A.-V.; Socol, C.-T.;
Vodnar, D.-C. Poly(vinyl alcohol)-Based Biofilms Plasticized with Polyols and Colored with Pigments
Extracted from Tomato By-Products. Polymers 2020, 12, 532. [CrossRef] [PubMed]
49. Paucean, A.; Vodnar, D.C.; Socaci, S.A.; Socaciu, C. Carbohydrate metabolic conversions to lactic acid and
volatile derivatives, as influenced by Lactobacillus plantarum ATCC 8014 and Lactobacillus casei ATCC 393
efficiency during in vitro and sourdough fermentation. Eur. Food Res. Technol. 2013, 237, 679–689. [CrossRef]
50. Aguirre, L.; Garro, M.S.; de Giori, G.S. Enzymatic hydrolysis of soybean protein using lactic acid bacteria.
Food Chem. 2008, 111, 976–982. [CrossRef]
51. Robert, H.; Gabriel, V.; Lefebvre, D.; Rabier, P.; Vayssier, Y.; Fontagné-Faucher, C. Study of the behaviour of
Lactobacillus plantarum and Leuconostoc starters during a complete wheat sourdough breadmaking process.
LWT-Food Sci. Technol. 2006, 39, 256–265. [CrossRef]
52. Sun, L.; Li, X.; Zhang, Y.; Yang, W.; Ma, G.; Ma, N.; Hu, Q.; Pei, F. A novel lactic acid bacterium for improving
the quality and shelf life of whole wheat bread. Food Control. 2020, 109, 106914. [CrossRef]
53. Zhang, Y.C.; Albrecht, D.; Bomser, J.; Schwartz, S.J.; Vodovotz, Y. Isoflavone Profile and Biological Activity of
Soy Bread. J. Agric. Food Chem. 2003, 51, 7611–7616. [CrossRef]
54. Fessas, D.; Schiraldi, A. Water properties in wheat flour dough. I: Classical thermogravimetry approach.
Food Chem. 2001, 72, 237–244. [CrossRef]
55. Hardt, N.A.; Boom, R.M.; van der Goot, A.J. Wheat dough rheology at low water contents and the influence
of xylanases. Food Res. Int. 2014, 66, 478–484. [CrossRef]
56. Sun, X.; Koksel, F.; Nickerson, M.T.; Scanlon, M.G. Modeling the viscoelastic behavior of wheat flour dough
prepared from a wide range of formulations. Food Hydrocoll. 2020, 98, 105129. [CrossRef]
57. Arendt, E.K.; Ryan, L.A.M.; Bello, F.D. Impact of sourdough on the texture of bread. Food Microbiol. 2007, 24,
165–174. [CrossRef] [PubMed]
58. Zhou, J.; Liu, J.; Tang, X. Effects of whey and soy protein addition on bread rheological property of wheat
flour. J. Texture Stud. 2018, 49, 38–46. [CrossRef] [PubMed]
59. Gobbetti, M.M. Gobbetti. Trends Food Sci. Technol. 1998, 9.
60. Rehm, H.J.; Reed, G. Book Review: Book Review. Acta Biotechnol. 1985, 5, 451–454.
61. Vodnar, D.C.; Paucean, A.; Dulf, F.V.; Socaciu, C. HPLC characterization of lactic acid formation and FTIR
fingerprint of probiotic bacteria during fermentation processes. Not. Bot. Horti Agrobot. Cluj-Napoca 2010, 38,
109–113.
62. Corsetti, A.; Gobbetti, M.; Rossi, J.; Damiani, P. Antimould activity of sourdough lactic acid
bacteria: Identification of a mixture of organic acids produced by Lactobacillus sanfrancisco CB1.
Appl. Microbiol. Biotechnol. 1998, 50, 253–256. [CrossRef]
63. Gourama, H. Inhibition of growth and mycotoxin production of Penicillium by Lactobacillus species.
LWT-Food Sci. Technol. 1997, 30, 279–283. [CrossRef]
64. Niku-Paavola, M.L.; Laitila, A.; Mattila-Sandholm, T.; Haikara, A. New types of antimicrobial compounds
produced by Lactobacillus plantarum. J. Appl. Microbiol. 1999, 86, 29–35. [CrossRef] [PubMed]You can also read