Western Bay of Plenty - Public Transport Mode Shift Scenarios 13 March 2020 - UFTI
←
→
Page content transcription
If your browser does not render page correctly, please read the page content below
Western Bay of Plenty

Public Transport Mode Shift Scenarios

13 March 2020
Scope of Work
Overview
The Urban Form Transport Initiative (UFTI) commissioned a multi-modal technical report to aid the development of the UFTI programmes. GHD was contracted to complete
the work on behalf of UFTI. The initial project scope for this work was broader and included considering other modes such as walking, cycling and micro mobility. Upon
direction from the UFTI project team, the scope for the work was revised to focus and provide detail on increasing public transport use within the Western Bay of Plenty
(WBOP) sub-region.
Reason for Scope Change
The scope revision was made by UFTI on the basis of:
Needing to move the maximum number of people to work, schools and other locations particularly during peak times, and significantly increasing public transport mode
share from the current 1-2%.
The analysis from the draft Tauranga Transport Programme indicated that public transport levels of service in the WBOP sub-region relative to comparators are lower
(local circumstances aside). This indicates that there are opportunities for public transport improvements relative to the level of service gaps of other modes such as
walking and cycling, or micro-mobility.
The pathway to improve public transport is often more complex than other modes because of the numerous factors involved and need co-ordinating. Additionally,
supportive land use/urban form are critical components to support the uptake of public transport services.
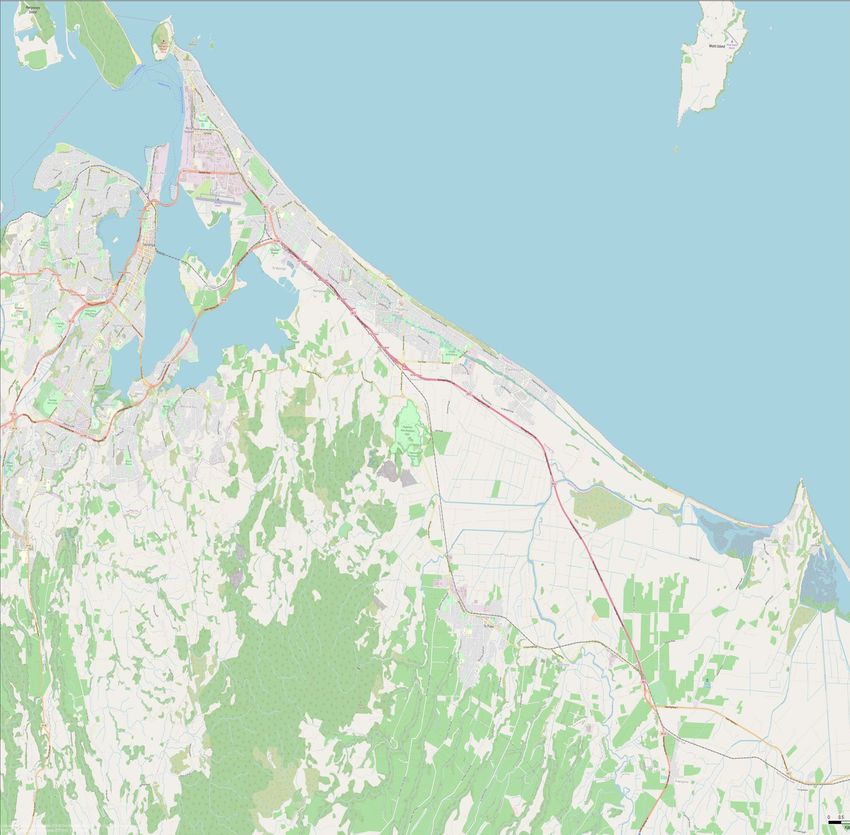
Tauranga City Council and Western Bay of Plenty District Council are completing or undertaking significant pieces of work to develop a strategic cycling network that will
support cycle/walking and other personal mobility trips throughout the sub-region.
The revised scope meant that additional effort and resource could be used to focus more on increasing public transport mode share. Based on the direction received from
the UFTI project team to revise the original scope, GHD prepared the WBOP Public Transport Mode Shift Scenarios report.
2 GHD Advisory Urban Form & Transport Initiative – Mode Shift & Multi-Modal Solutions
Contents
Executive Summary              4

Introduction                   5

Project Objectives             6

Review – Customer Insights     7

Explore – Current State       13

Develop – Future State        19

Summary and Recommendations   32
Executive Summary
Introduction                                                                                 Develop
GHD has been commissioned to assist Tauranga’s Urban Form and Transport                      Analysis has been undertaken to determine potential future AM peak hour mode
Initiative (UFTI) to achieve substantial improvements in the transport system and the        share scenarios.
urban form for the Western Bay of Plenty (WBoP) sub-region.
                                                                                             This work shows the significant level of uptake in public transport use that would be
The aim of this project is to outline a suite of potential interventions and triggers that   required to achieve higher mode share scenarios by 2063. As an example to achieve
are likely to be required to achieve a range of future public transport mode share           20% public transport mode share by 2063, patronage would need to increase from a
scenarios over the short (10 years), medium (11-20 years) and longer term (21-30             forecast base of around 2,500 public transport trips per day in 2063 up to 11,500
years).                                                                                      trips. If 20% mode share is achieved then the analysis suggests that a form of high
                                                                                             capacity transit is likely to be required to meet the anticipated level of demand.
Review
                                                                                             The analysis suggests that the greatest level of demand for public transport is
An interactive workshop was undertaken with targeted stakeholders in Tauranga in
                                                                                             anticipated for people travelling within the eastern sector of the WBoP sub-region.
October 2019 to help inform the development of this Public Transport Mode Shift
                                                                                             This is followed by people travelling both within the southern sector and from the
Plan. Common themes that emerged from the customer insight exercises centred on
                                                                                             southern sector to the central sector. The other high demand area is from the
the importance of travel time, reliability, and cost (relative to that by other modes)
                                                                                             western sector to the central sector.
and frequency of services.
                                                                                             Mass rapid transit is also a way to stimulate land use around public transport hubs.
Explore
                                                                                             Increased frequencies and/or larger buses could be an alternative response to meet
This project focusses on the public transport system in the WBoP sub-region as this          future increases in public transport demand over time. This data provides a useful
provides the greatest opportunity to move the highest number of people by modes              indication of where future demand is likely to warrant the investigation of higher
other than car, but this work also recognises the role that other modes will need to         capacity modes.
play to achieve emissions targets over the next 30 years.
                                                                                             Summary and Recommendations
A review of current and future challenges and constraints helped stakeholders to
                                                                                             This report has built on the extensive work undertaken to date. It has developed an
understand the scale and significance of the problems. The next step was to develop
                                                                                             understanding of key customer insights and outlines the opportunities to make a
potential interventions to respond to these challenges and opportunities.
                                                                                             significant shift in mode share over the next 10, 20 and 30 years.
The immediate focus was generally on improving the customer experience and
                                                                                             The analysis suggests that the greatest level of demand for public transport is
beginning the transition to alternative modes, by improving the attractiveness of
                                                                                             anticipated for people travelling within the eastern sector. This is followed by people
existing public transport services. Common themes in the short term relate to travel
                                                                                             travelling from the southern sector to the central sector.
demand management, walking and cycling and public transport improvements.
                                                                                             This work suggests that a phased approach is required to progress towards the
In the longer term, the actions identified are more focused on transformational
                                                                                             desired future state, starting with bus priority and working towards higher capacity
changes to move more people through mass transit and supporting land use
                                                                                             modes and supporting measures that include land use intensification, Park and Ride
patterns such as Transit Oriented Developments to enable the critical mass of
                                                                                             and parking management in the central City and other high trip generating areas.
people and density required to support higher capacity modes of transport.

4    GHD Advisory                                                                                            Urban Form & Transport Initiative – Mode Shift & Multi-Modal Solutions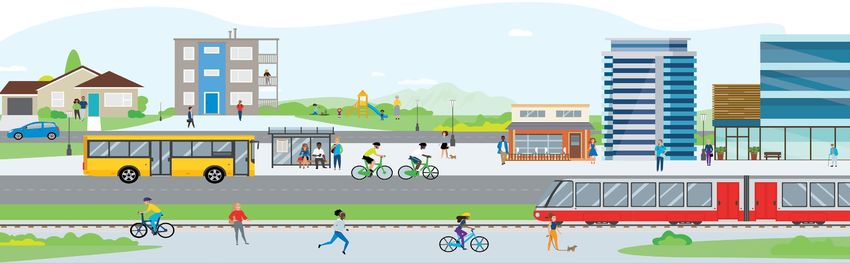
Introduction
Shaping highly liveable places in thriving cities and fast growing regions
When we think about how and why we live where we do, we are drawn to the
WBoP’s enviable lifestyle, local cafes, beaches and an outstanding natural
environment. People are attracted to living here because of the opportunities.
Imagine a modern, integrated public transport system that provides convenient and
reliable transport in WBoP sub-region. A system where public transport is the mode
of choice for dropping the kids off at school, travelling to the beach for a family
picnic, getting to the airport for that early Monday morning flight to Wellington or
heading into town for dinner with friends at the end of a busy week.
The aim of this project is to help shape the future vision for public transport in the
WBoP sub-region and detail potential future public transport mode share scenarios
to inform a suite of potential interventions and triggers that may be required to
support these future mode share scenarios over the short (10 years), medium (11-
20 years) and longer term (21-30 years).
This project focusses on the public transport system in the WBoP sub-region as this
provides the greatest opportunity to move the highest number of people to work
and school by modes other than car, but this work also recognises the role that
other modes will need to play to achieve emissions targets over the next 30 years.
This piece of work is intended to start a conversation about potential future mode
shift scenarios and the types of interventions and triggers. It is anticipated that this
work will be further developed and evaluated as part of the options assessment
phases of a future Programme Business Case.
The remainder of this report is structured as follows:
Review: A literature review of background documents and reports. A summary of
key customer insight research and outputs from a stakeholder workshop that was
held with targeted stakeholders.
Explore: An overview of the key current and future opportunities/challenges for
public transport in Tauranga and the development of potential mode shift
interventions over the short, medium and longer term.
Develop: The findings from initial technical analysis on potential mode shift
scenarios and the likely interventions required to achieve mode shift.

5    GHD Advisory                                                                          Urban Form & Transport Initiative – Mode Shift & Multi-Modal Solutions

Project Objectives
Purpose
To identify what factors across the land use, urban form, people and transport system are necessary to achieve a significant increase in public transport use.
Target Outcomes
Gather ideas about public transport problems, including identifying key conflict points now and over the next 50 years (a focus on core routes); and,
Establish and assess a range of alternatives and options that are required to accommodate different public transport mode share scenarios.
Parallel Workstreams
The purpose of this project is to identify a series of high level future public transport mode shift scenarios and to investigate the likely interventions that could be required if
public transport mode share was to significantly increase. An increase to 20% mode share over the next 50 years is considered very achievable based on continuous year
on year growth. The aim is to focus on public transport trips to the central city as this provides the greatest opportunity to move the most number of people to work and
school, and aligns with the UFTI investment objectives.
This work acknowledges that there are broader considerations that need to be taken into account when investigating mode shift scenarios, including wider modes such as
walking and cycling, land use planning, urban form and, costs/benefits and emerging technology. UFTI is in the process of commissioning separate work packages which will
explore these broader considerations.
This initial high level project is intended to inform subsequent phases of work and start a conversation amongst UFTI partners about ambitious future public scenarios. It will
be used to inform decisions on where further analysis and detail should be undertaken to achieve the UFTI investment objectives and realise modal shift in the sub-region.
6 GHD Advisory Urban Form & Transport Initiative – Mode Shift & Multi-Modal Solutions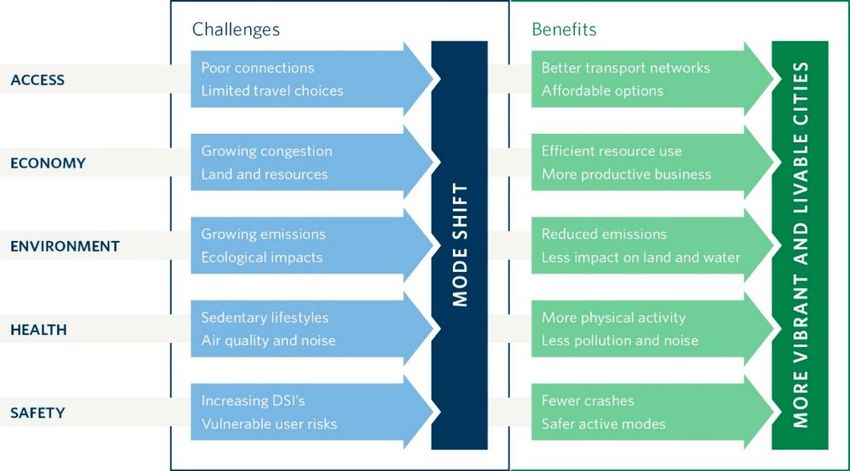
Review          The following section contains a summary of opinions
                expressed by a targeted reference group, a more
                comprehensive summary is provided at Appendix A.

                These insights have been considered by the consultant
                team and are used to inform the material presented in
                the subsequent sections.
 GHD Advisory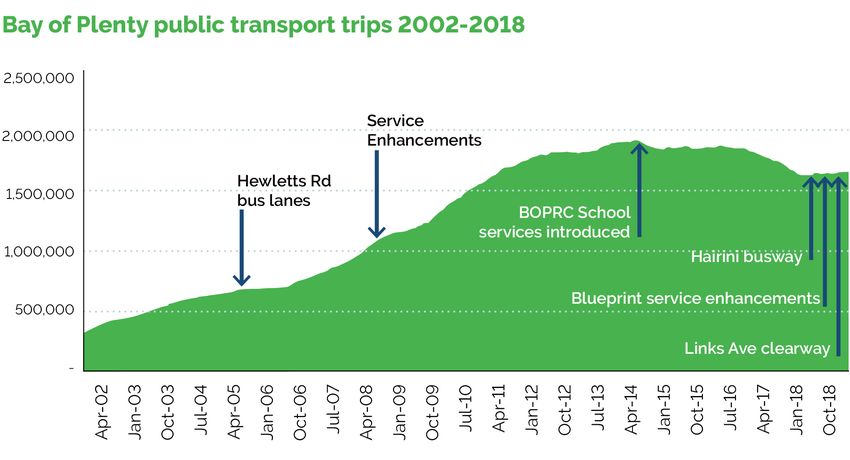
Why is Mode Shift Important (Source: NZTA Keeping Cities Moving, September 2019)
Mode shift is not an outcome itself – it is a measure of progress
Mode shift can help address several key challenges and support many important outcomes
In particular, mode shift is key to improving urban mobility by moving more people in fewer vehicles and less space
This ‘space efficiency’ enables access to opportunities in a way that supports quality and liveable urban areas
Mode shift is a key national priority and activities could be prioritised for funding through the next National Land Transport Fund
Key principles:
1. Target the causes of car dependency
2. Concentrate on high growth urban areas
3. Understand the journeys people make
4. Focus on the most effective modes
5. Ensure a consistent pace of change
EXPLORE
FOCUS
REVIEW DEVELOP
8 GHD Advisory Urban Form & Transport Initiative – Mode Shift & Multi-Modal Solutions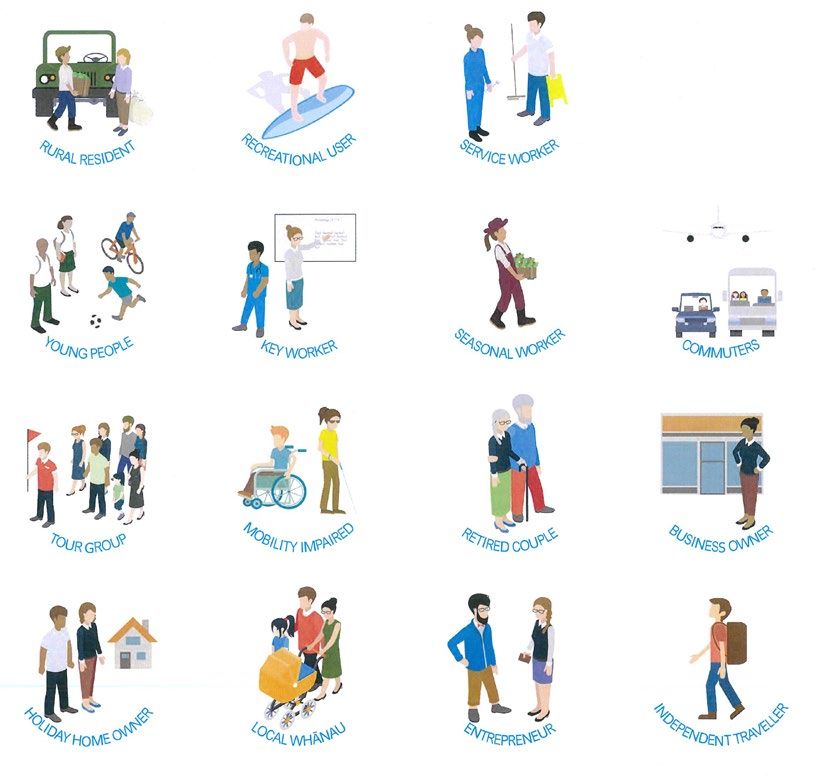
The Case for Multi-Modal Mode Shift (Source: NZTA Keeping Cities Moving, September 2019)
All transport modes have their strengths and weaknesses, and a role to play in an integrated multi-modal system:
Public transport can be an efficient way of moving large numbers of people but providing a high-quality service can be expensive. This means it can be difficult to provide an
attractive service in lower-density areas or for journeys that are less common.
Cycling is a healthy way to travel medium-length distances. However, bikes mix poorly with pedestrians and vehicles, which means that specific infrastructure is needed to
make cycling a high-quality option. Slower average speeds than motorised modes, exposure to the weather and required fitness levels limit cycling’s attractiveness for longer
journeys, although e-bikes help overcome some of these challenges.
Walking is also a healthy and congestion-free way of travelling shorter distances. It is free and does not require any specialist equipment or services. However, walking is
much slower than other transport modes, making it less attractive for longer journeys. Poorly designed streets and urban areas can also make walking unattractive and
unsafe.
‘New’ technologies such as on-demand services, e-scooters and car sharing are redefining interaction between traditional transport modes and operating models and have
great potential to play a role in reducing car dependency.
Overall, an integrated approach is required that focuses each mode on playing a greater role in serving the types of trips they are well suited to. Each of these can also support
the other, for example through making it easier and safer to walk or cycle to public transport. Because of their significant wider benefits, active modes should be the focus for
achieving mode shift for shorter journeys.
This project specifically focuses on future public transport mode share scenarios, however recognises that this will need to be considered alongside existing work has already
been completed or that is underway for other modes (walking, cycling, carpooling, scooters etc.) and broader mode shift enablers (land use/urban form). This includes work that
has been progressed to improve walking/cycling mode share (particularly for short-medium trips) and parallel work that UFTI is progressing to understand land use interventions.
9 GHD Advisory Urban Form & Transport Initiative – Mode Shift & Multi-Modal Solutions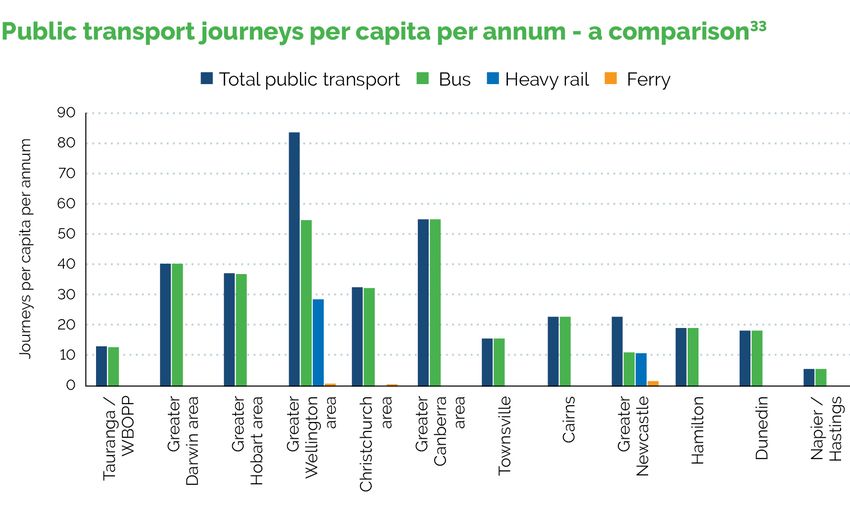
The Case for Multi-Modal Mode Shift in Western Bay of Plenty
The UFTI partners recognise the need to proactively plan and invest in the transport system to give effect to national and local strategic priorities and achieve mode shift.
Mode shift is important for the sub-region because:
The State Highway network is largely complete and further major initiatives to add road capacity for private vehicles are likely to be cost-prohibitive. Furthermore, additional
road capacity can result in negative effects on neighbouring communities and exacerbate a reliance on single occupant private vehicles through induced demand.
With few future opportunities to add road capacity, travel demand is expected to increase substantially in the future due to population and employment growth. It is important
to consider mode shift now to avoid future issues such as poor travel time reliability and increasing congestion.
It is difficult and costly to retrofit public transport and active mode infrastructure into new developments. It is better to plan for higher capacity modes now in the sub-region
and implement as required.
Intensification in the Western Bay of Plenty around activity centres is also critical to encourage and enable short trips to be taken by foot and by bike. Intensification around
public transport routes will help increase demand for services which can then result in improved service provision such as higher route frequencies.
10 GHD Advisory Urban Form & Transport Initiative – Mode Shift & Multi-Modal SolutionsTechnological Advances (Source: MoT Transport Outlook: Future State, November 2017) Many new technologies under development are likely to change local transport over the next 25 years. They include self-driving vehicles along with apps to match travellers with transport services in real time. The result may be a shift to ‘mobility as a service’, offering the convenience of private vehicle travel without the need to own a private vehicle or to be able to drive it. The distinction between ‘private’, ‘shared’ and ‘public’ transport may be blurred. The future shape of ‘public transport’ could expand to cover any mode that a user can hire, purchase, or share, and not necessarily only from a public sector provider. Vehicle-sharing and ride-sharing fit this definition. In the future, high frequency services may operate on fixed schedules, as they do today, while other services could be offered on demand using technologies such as a smartphone app. Some public transport vehicles could become self-driving, making it more economical to operate smaller buses and shorter trains. Smaller buses could be used to serve markets where traditional public transport services may not be viable. These include not only smaller cities and less dense suburbs, but also new point-to-point express services, collector services serving major destinations such as large employers, hospitals and shopping malls, or services that feed into more traditional public transport services. Emerging technologies provide an opportunity to increase mode share of transport modes other than the private vehicle. They can help with first and last mile connections to public transport services, for example wheeled modes such as e-scooters. There is an opportunity for the Western Bay of Plenty and Tauranga to be an early adopter of new mobility technologies, to improve access to public transport and reduce dependency on private vehicles, particularly for short-medium length trips. 11 GHD Advisory Urban Form & Transport Initiative – Mode Shift & Multi-Modal Solutions
EXPLORE
Current Situation
FOCUS
REVIEW DEVELOP
A significant amount of existing work has already been undertaken to understand
the key transport problems and outcomes sought for the WBoP sub-region.
A technical review of relevant strategic documents and previous investigations has
been undertaken. Key findings include:
Tauranga is one of the most car dependant cities in New Zealand, with 84.7
percent car mode share for journeys to work.1
Similarly, a report by the Bay of Plenty Regional Council states that 97 percent
of all work and recreational trips are taken by private vehicle. 2
The current public transport mode share in the Bay of Plenty is around 1-2
percent compared to a national average of 5 percent.3
Noting that public transport patronage has
also increased due to population growth
In Tauranga bus patronage declined by 4.5 percent in 2017/18, with tertiary
patronage decreasing by 18 percent.3 However, since the start of 2019/20, bus
patronage in TCC has been tracking ahead of 2018/19 as a result of network
improvements.
Rapid population growth is leading to increased demand for travel which is
resulting in a reduced level of service on the road network.4
Travel time reliability is decreasing as vehicle traffic increases, particularly
during peak hours.4
A recent customer insight survey conducted on behalf of the NZ Transport
Agency has found that three out of four drivers cite congestion as an issue in
Tauranga, and the bus is seen as the most likely alternative to the car.5
Tauranga bus journey times are considerably slower than a journey by car and
journey times are no more reliable than a car.6
Customer research suggests that addressing long travel times and unreliability
through measures such as increased frequency, bus lanes, express services
and Park and Ride facilities are key to achieving mode shift.7
Measures to make car driving less attractive such as parking prices, reducing
minimum parking requirements for new residential and commercial
developments, shared streets, slower speeds, road narrowing etc.
12 GHD Advisory Urban Form & Transport Initiative – Mode Shift & Multi-Modal SolutionsCurrent Situation
Tauranga has a similar level of private
vehicle use as Hamilton, Christchurch and
Queenstown as shown opposite.
Public transport use is the lowest of the six
main urban centres and walking and cycling
is lower than both Wellington and
Christchurch.
It is recognised that Auckland and Wellington
are more densely populated. However, this Noting that public transport patronage has
also increased due to population growth
demonstrates the significant opportunity to
increase public transport use in Tauranga
and the wider Western Bay of Plenty to
match the other main urban centres.
EXPLORE
FOCUS
REVIEW DEVELOP
13 GHD Advisory Urban Form & Transport Initiative – Mode Shift & Multi-Modal SolutionsInsights
A Day in the Life
An interactive session was undertaken with staff from UFTI
partners in Tauranga in October 2019. A set of fast paced
and focused exercises moved from insights to ideas on
specific actions and priorities to help achieve the desired
mode shift outcomes.
A range of characters, representing user groups, were
identified and participants were asked to describe the
characters daily lives, connections with other characters
and summarise their priorities.
There was a strong relationship between each user group,
with some characters playing multiple roles and having
similar needs, being dependant or affected by one another.
Common themes that emerged from the exercise
emphasised the importance of:
Public transport travel time (compared to other modes)
Frequency of public transport services
Ease of services (for example, minimising transfers)
Reliability of public transport
Cost (comparative to other modes)
Access to a range of facilities and services
Local Young Commuter Independent Business Rural Retired
Whanau People Traveller Owner Resident Couple
14 GHD Advisory Urban Form & Transport Initiative – Mode Shift & Multi-Modal SolutionsExplore The following section contains a summary of opinions
expressed by a targeted reference group, a more
comprehensive summary is provided at Appendix B.
These insights have been considered by the consultant
team and are used to inform the material presented in
Click to insert Document Title
GHD Advisory the subsequent sections.Problem / Opportunity Identification
In groups, the workshop participants were asked to select a key corridor and identify the current and future opportunities, challenges and constraints. The following table
summarises the key themes expressed by the participants for each corridor. A full summary is provided at Appendix B.
Papamoa – Mount Maunganui - City Omokoroa – Te Puna – Bethlehem - City Tauriko – Pyes Pa - City
Schools in the area are key trip
Impact of growth in Papamoa, Te Growth planned mainly in Omokoroa
generators – mostly south of SH29
LAND USE / BUILT & URBAN FORM Puke and Rangiuru provides an Opportunity for TOD’s, Park & Rides
Welcome Bay could benefit from
opportunity to increase PT use Intensification opportunity with TNL
more amenities such as shops
Bus transfers add to travel times Opportunity to consider ferry Lack of alternative modes along
making PT less competitive with cars services from Omokoroa to City western corridors and low density
Limited off peak bus services Low catchment/densities for makes PT provision challenging
TRAVEL CHOICE Buses get delayed in traffic on Golf passenger rail (currently)
Road, Maunganui Roundabout and
approaching the bus lanes on
Hewlett’s Road
SH network may cause severance
Parking management leads to vehicles
SAFETY / WELLBEING A number of high risk intersections
circling looking for a park
along SH2 corridor
16 GHD Advisory Urban Form & Transport Initiative – Mode Shift & Multi-Modal SolutionsProgramme Development Insights
EXPLORE
FOCUS
The groups were next asked to create a programme of approximately 15-20 interventions that would deliver substantial mode shift and
meet the needs of their particular characters over the short, medium and longer term. The groups were provided with a provisional set of REVIEW DEVELOP
actions, and were encouraged to amend or include any of their own actions. The group then prioritised the most urgent interventions.
Papamoa – Mount Maunganui – Te Puke - City (Te Papa)
Short term 0-10 years Medium term 11-20 years Long term 21-30 years
Public transport use is Bus Rapid Transit is build
incentivised and heavily along key arterial routes
advertised by Council
More road space
allocated to buses at
peak times, clearways Intensify residential proximate to Extend Papamoa inland
transport and activity hubs (TOD’s) and grow Mangatawa to
support SH2 PT corridor
A 30 year Mass
Developers required to
Transit Strategy
contribute to PT infrastructure
is developed
PT corridor via Mass transit Paengaroa, Te
Matapihi (part Increase capacity of key arterials Puke, Papamoa, Mount
New areas of intensification are
of Eastern (new lanes to support multi-modal) Maunganui to Te Papa (City)
provided with improved services
Corridor TOD)
Park and Ride at Stadium More bus interchanges
Undertake a significant Additional crossing points and PT transport
review of the PT services along areas with strong facilities in both urban
including frequency, pedestrian presence or near and residential areas Biggest long term impact
coverage, routes and price major PT infrastructure
with a view to updating the
services provided Requires immediate attention
Match PT services
with events, schools Park and Ride
and employment hubs Second highest priority
Intensify uses alongside at Papamoa
existing centres and around Eastern
transit hubs to create a Interchange Third highest priority
The cycling and walking
critical mass for transit and corridor is separated
encourage linked trips from high traffic corridors
along key routes
17 GHD Advisory Urban Form & Transport Initiative – Mode Shift & Multi-Modal SolutionsProgramme Development Insights
EXPLORE
FOCUS
REVIEW DEVELOP
Omokoroa – Te Puna – Bethlehem - City (Te Papa)
Short term 0-10 years Medium term 11-20 years Long term 21-30 years
A 30 year Mass Reduce price of PT travel PT bus-trains that can Bus Rapid Transport is built along
Transit Strategy relative to car travel , use both the rail corridor key arterial routes e.g. Omokoroa
is developed increase City parking charges and road network to City and Katikati to City
Intensification and TOD’s
around Cherrywood, Matua
Match PT services
with events, schools
and employment hubs Ferry service between
Land bank Park and Ride Omokoroa, City and Intensify uses alongside existing centres
sites and future TOD sites Mount Maunganui and around transit hubs to create a critical
mass for transit and encourage linked trips
Development of Park and More local PT services for growth
Ride at Te Puna, Omokoroa areas and existing areas,
2022 and Apata 2020 particularly around schools
Biggest long term impact
Public transport services
extended further to Requires immediate attention
major growth areas
Second highest priority
Third highest priority
18 GHD Advisory Urban Form & Transport Initiative – Mode Shift & Multi-Modal SolutionsProgramme Development Insights
EXPLORE
FOCUS
REVIEW DEVELOP
Tauriko, Pyes Pa, Welcome Bay - City (Te Papa)
Short term 0-10 years Medium term 11-20 years Long term 21-30 years
The cycling and walking Enforce school
network is separated from high zones Intensify uses alongside new and existing
traffic corridors along key routes
centres and around transit hubs to create a
critical mass for transit and encourage
Road network linked trips (policy to enable in short term)
optimisation for PT and
smart transport Ferry hubs
corridors by time of day
Reduce price of More bus interchanges (City
PT travel e.g. interchange) and PT transport
day savers, facilities in both urban and
monthly options residential areas including
incentivise Park and Ride at Tauriko and
regular PT use Welcome Bay
Welcome Bay to City to Mount
Maunganui ferry services
Undertake a significant review
of the PT services and active
modes including frequency,
coverage, routes and price
Biggest long term impact
with a view to updating the
Bus Rapid Transit is built along key arterial
services provided
routes (Tauriko to City) Requires immediate attention
Match PT services Additional crossing points along areas with strong Second highest priority
with events, schools pedestrian presence or near major PT infrastructure
and employment hubs
Third highest priority
(total mobility/on
demand services)
19 GHD Advisory Urban Form & Transport Initiative – Mode Shift & Multi-Modal SolutionsShort Term 0-10 Years
Summary of Insights
Overview
Combined Actions By Theme
Analysis of the interventions and phasing overall
shows a significant emphasis on public transport
improvements, land use planning and walking and
cycling interventions across all of the key corridors.
The shorter terms focus was generally on
improving the customer experience and beginning
the transition to alternative modes, by improving Medium Term 11-20 Years
the attractiveness of existing services. Common
themes in the short term relate to travel demand
management, walking and cycling and public
transport improvements.
In the longer term, the actions identified are more
focused on transformational changes to move
more people through mass transit and supporting
land use patterns such as TOD’s to enable the
critical mass of people and density required to
support higher capacity modes of transport.
Long Term 21-30 Years
EXPLORE
FOCUS
REVIEW DEVELOP
20 GHD Advisory Urban Form & Transport Initiative – Mode Shift & Multi-Modal SolutionsDevelop
The following section builds on the UFTI
partner insights presented above and
details the consultant teams view on the
interventions required and triggers to
Click to insert Document Title
GHD Advisory achieve a range of future public transport
mode shift scenarios.Mode Share Scenarios Data for the WBoP area for the Base+ or Base++ scenarios was not readily available
This section outlines the technical analysis that has been undertaken to determine potential future mode share scenarios for the year 2063. This section also
identifies the likely public transport frequency and service requirements for a range of mode shift scenarios.
PT Base Base + Base ++ 10% 20% 30% 50%
TCC
*
2,500 trips 2,900 trips 4,100 trips 5,750 trips 11,450 trips 17,200 trips 28,650 trips
PT Base Base + Base ++ 10% 20% 30% 50%
WBoP
*
2,850 trips n/a n/a 8,800 trips 17,600 trips 26,450 trips 44,050 trips
* trips per day (all)
The current public transport mode share in Tauranga is approximately 2% for journeys to work (census)
2063 AM Peak
The base (2018) transport model gives a figure of 1.4% for public transport in the morning peak hour for all trips
EXPLORE
The future base case for 2063 gives the AM peak figure for the Tauranga City Council area as 4.4% of all trips. The corresponding
figure for the WBoP area is 3.2% of all trips.
Tests on a Base + (expanded bus services) scenario in 2063 gives the AM peak figure for the TCC area as 5.1% of all trips FOCUS
Public transport mode share in the TCC area is expected to increase further from 5.1% to 7.1% of all trips and 11.5% of journeys to
REVIEW DEVELOP
work with an expanded priced parking zone in Tauranga City, plus cheaper ($1) bus fares (Base ++)
The image above demonstrates the number of people that would need to be moved by public transport in the TCC and WBoP areas
respectively to achieve 10, 20, 30 and 50% public transport mode share scenarios in 2063. This demonstrates the significant level of
uptake in public transport use that would be required to achieve higher mode share scenarios by 2063.
22 GHD Advisory Urban Form & Transport Initiative – Mode Shift & Multi-Modal SolutionsBenchmarking Mode Share
The share of current travel by public transport, walking and cycling varies across cities, due in part to geography, and different urban planning and transport
policies over time. Overall patterns are similar as shown below, other than in Wellington, which has a much higher rate of active and public transport use.
International research suggests that mode share scenarios of 20-30% percent are achievable, based on a review of mode splits for comparable sized European
cities. Mode share targets are currently being developed for high growth urban centres in New Zealand.
EXPLORE
FOCUS
REVIEW DEVELOP
23 GHD Advisory Urban Form & Transport Initiative – Mode Shift & Multi-Modal SolutionsNet Zero Emissions EXPLORE
FOCUS
REVIEW DEVELOP
2063
The vast majority of Tauranga’s emissions are related to transportation (61%)8
It is estimated that 97% of transport emissions in Tauranga are from road transport, and come from the use of petrol, diesel and LPG for vehicle transport
Tauranga’s per capita emissions for transport are higher than Wellington’s and Dunedin’s, possibly due to lower levels of commuter public transport trips
The Climate Change Response (Zero Carbon) Amendment Bill Act if enacted will provide a framework by which New Zealand can develop and implement
clear and stable climate change policies.
The draft legislation sets a series of emission targets, including a reduction in greenhouse gas emissions to net zero by 2050. This will contribute to the global
effort under the Paris Agreement to limit the global average temperature increase to 1.5° Celsius above pre-industrial levels. To achieve these future emission
reduction targets there is a need to achieve significant mode shift away from private car trips in the WBoP sub-region.
A further test has been undertaken to determine the mode shift required to achieve net zero increase in vehicle emissions.
This has been assumed to mean no increase in traffic between 2018 and 2063. Some ways of achieving this could be:
If excess car trips divert 50% to walking and cycling and 50% to public transport. This would need a public transport mode share of 18% in 2063 to avoid
an increase in emissions. This scenario is achievable if average commuting distances are reduced by implementing land use changes that promote
densification. This will lead to active modes and public transport being more attractive to people.
If car occupancy increases from 1.23 to 1.5, 50% of any excess traffic diverts to walking and cycling and 50% to public transport.
This would need a public transport mode share of 10.5%. This scenario is achievable if interventions such as special vehicle lanes (HOV, Bus lanes) are
implemented, coaxing more people into ridesharing and/or using public transport. Reducing average commuting distances by implementing land use
changes that promote densification will lead to active modes being more attractive to people.
If car occupancy increases from 1.23 to 1.3, and 30% of the fleet is electric powered, and all of the excess traffic diverts to public transport.
This would need a public mode share mode share of 6%. According to a report from the MoT, electric vehicles are expected to make up 40% of the fleet
in New Zealand by 2039/40*. Additionally uptake in walking and cycling as well as interventions such as special vehicle lanes (HOV, Bus lanes) will
influence the increase in modal shift and average car occupancies which will help achieve emissions targets.
* https://www.transport.govt.nz/assets/Uploads/Research/Documents/b41c266676/GOTO-Future-State-A4.pdf (page 70)
24 GHD Advisory Urban Form & Transport Initiative – Mode Shift & Multi-Modal SolutionsGrowth & Triggers EXPLORE
Sector Growth Analysis FOCUS
To better understand the potential number of people that could be moved by REVIEW DEVELOP
public transport and inform the development and phasing of potential
interventions, the following analysis provides an overview of the expected
growth in population within four broad sectors in 2063.
Analysis of future dwelling and employee growth by sector is provided at
Appendix C.
The map opposite shows the broad sectors that have been used for the
analysis provided below and on the next slide.
Population Growth
The table below shows the expected growth in each sector between 2018
and 2063. The data indicates that the south and east sectors are expected to
experience the largest growth in population, with the south sector increasing
by an average of 1.3% per annum and the east by 0.8% per annum.
Analysis on the sequencing and scale of the growth shows that growth is
forecast to increase first in the east sector between 2021 and 2026
(additional 6,308 people), followed by the south between 2031 onwards
(increasing by over 6,000 people between 2031 and 2053). This suggests
that the greatest opportunity to increase public transport mode share would
be to target the east sector, followed by the south sector.
% growth in relation
2018 2021 2026 2031 2036 2043 2053 2063
to total growth
West 54,763 56,976 60,113 62,621 64,369 65,569 67,428 68,539 17%
South 46,832 49,010 52,611 57,717 64,081 71,023 77,293 83,193 46%
Central 9,293 9,560 9,854 9,979 10,104 10,365 10,915 11,606 3%
East 64,596 68,406 74,714 79,293 83,149 87,979 90,378 91,184 34%
Total 175,485 183,952 197,291 209,610 221,703 234,936 246,014 254,522 100%
25 GHD Advisory Urban Form & Transport Initiative – Mode Shift & Multi-Modal SolutionsOrigin – Destination Demand Matrices EXPLORE
Sector to Sector Demand Analysis FOCUS
To better understand the potential number of people that could be REVIEW DEVELOP
moved by public transport and inform the development and phasing of
potential interventions, the following analysis provides an overview of
the primary destinations for people travelling between four broad origin
and destination sectors in 2063 AM peak.
The analysis has been undertaken for three future scenarios, for the
2063 AM peak period:
Base case = 4.4% TCC public transport mode share (6.4% TCC
public transport mode share for journeys to work)
Base ++ = 7.1% TCC public transport mode share (11.5% TCC
public transport mode share for journeys to work)
Assumed 20% = TCC public transport mode share scenario
(public transport proportionally increased from Base ++ scenario,
32.3% TCC public transport mode share for journeys to work).
For the purpose of this work 20% public transport mode share has been
assessed and analysed. This is an arbitrary figure that has been used
to test the impacts of a significant increase compared to current usage.
The map opposite shows the broad sectors that have been used for the
analysis provided on the next slide.
The analysis on the next slide provides a high level overview of
potential demand (people movements) for public transport services in
2063 AM peak. It shows the theoretical demand between each of the
origin and destination sectors for each of the three future scenarios.
Growth rates have been applied at a very broad level for the purpose of
this analysis (i.e. assuming population growth is applied equally across
each of the sectors).
26 GHD Advisory Urban Form & Transport Initiative – Mode Shift & Multi-Modal Solutions4.4% = 144 4.4% = 40
4.4% = 205 4.4% = 47
7.1% = 198 7.1% = 60
7.1% = 394 7.1% = 92
20% = 554 20% = 168
20% = 1,106 20% = 258
4.4% = 59 4.4% = 69
7.1% = 94 7.1% = 106
20% = 264 4.4% = 57 20% = 296 4.4% = 43
7.1% = 90 7.1% = 67
20% = 253 20% = 189
Origin: West 2063 AM Peak Origin: Central 2063 AM Peak
4.4% = 86 4.4% = 24
4.4% = 389 4.4% = 207
7.1% = 156 7.1% = 40
7.1% = 686 7.1% = 345
20% = 436 20% = 111
20% = 1,925 20% = 967
4.4% = 288 4.4% = 60
7.1% = 476 7.1% = 86
20% = 1,335 4.4% = 95 20% = 243 4.4% = 682
7.1% = 159 7.1% = 1,028
Origin: South 2063 AM Peak 20% = 447 Origin: East 2063 AM Peak 20% = 2,884
27 GHD Advisory Urban Form & Transport Initiative – Mode Shift & Multi-Modal SolutionsPublic Transport Frequencies EXPLORE
Staging of Public Transport Interventions FOCUS
The demand matrices shown on the previous slide have been analysed to determine the public transport service requirements. It has REVIEW DEVELOP
been assumed that a standard bus would accommodate an average capacity of 35 people and a double decker 100 people.
Should the level of public transport demand reach the need for a bus every 2.5 minutes (with double decker buses) then it may be more
appropriate for this demand to be serviced by a higher capacity mode. With a frequency of equal or greater than a bus every 2.5 minutes,
dedicated corridors would be required due to the number of services operating as shown on the next slide.
The tables below provides an overview of the potential demand for public transport and service frequencies for each mode share scenario
based on a standard bus capacity of 35 people and a double decker capacity of 100 people. The Central sector is identified as a key
destination, however, has a relatively low demand in the AM peak from a trip origin perspective.
Note: The first number in each cell below indicates the number of buses required per hour to service the forecast demand for public transport, the second number
indicates the required public transport service frequency (e.g. 3/20 = 3 buses per hour or a bus every 20 minutes during the AM peak period).
Base Case (4.4%) 35 people per bus Base ++ (7.1%) 35 people per bus Assumed 20% 35 people per bus
Base Case (4.4%) 100 people per bus Base ++ (7.1%) 100 people per bus Assumed 20% 100 people per bus
West Central South East West Central South East West Central South East
West 2/30 3/20 1/60 1/60 West 2/30 4/15 1/60 1/60 West 6/10 12/5 3/20 3/20
Central 1/60 1/60 1/60 1/60 Central 1/60 1/60 2/30 1/60 Central 2/30 3/20 3/20 2/30
South 1/60 4/15 3/20 1/60 South 1/60 7/8.6 5/12 2/30 South 5/12 20/3 14/4.3 5/12
East 1/60 3/20 1/60 7/8.6 East 1/60 4/15 1/60 11/5.5 East 2/30 10/6 3/20 29/2.1
28 GHD Advisory Urban Form & Transport Initiative – Mode Shift & Multi-Modal SolutionsPublic Transport Programme Development EXPLORE
The analysis on the previous slide shows that standard or double decker buses are likely to be able to adequately service the anticipated FOCUS
demand for public transport in both the Base Case and the Base ++ scenarios. However, in the assumed 20% WBoP public transport
mode share scenario, one of the origin-destination sectors exceeds the need for a double decker bus every 2.5 minutes, suggesting that REVIEW DEVELOP
higher capacity mode is likely to be required to meet the anticipated level of demand should public transport mode share reach 20%
(also dependent on the exact location of the origin and destination and attractiveness of the services provided).
The analysis suggests that the greatest level of demand for public transport is anticipated for people travelling within the eastern sector.
This is followed by people travelling from the southern sector to the central sector, supporting the earlier analysis on forecast growth
within each sector.
Higher capacity modes are also a way to stimulate land use around public transport hubs. Increased frequencies and/or larger buses
could be an alternative response to meet future increases in public transport demand over time. This data provides a useful indication of
where future demand is likely to warrant the investigation of higher capacity modes. The table below illustrates typical thresholds for
different types of public transport modes and infrastructure provision.
In addition, commentary on the effects of different densities is provided at Appendix C.
Public Transport Typologies
WBOP
29 GHD Advisory Urban Form & Transport Initiative – Mode Shift & Multi-Modal SolutionsEXPLORE
Public Transport Competitiveness
Generalised Cost FOCUS
Analysis has been undertaken to calculate the total forecast times and costs (all expressed as travel time e.g. minutes) for travel in 2063 AM REVIEW DEVELOP
peak. This analysis has been undertaken for five origin and destinations that form the main public transport corridors.
The findings below demonstrate how public transport is unlikely to be competitive or an attractive option without off-site car parking charges and
improved travel times. Even with a nominal $10 off site parking charge, some of the routes shown would still struggle to compete with car use,
without the implementation of bus priority interventions. On the routes where public transport is still theoretically slower, additional priority would
be required to improve public transport travel times (compared to general traffic for example either public transport quicker, or public transport
quicker and general traffic slower). Alternatively we have tested an increase in off site parking charges to $15, which the analysis shows would
make public transport theoretically more competitive than private car on all five routes.
The most competitive routes (in terms of comparable travel times) in the 2063 AM peak period, are between Papamoa and Tauranga and Mount
Maunganui and Tauranga, where public transport is expected to be more competitive than SOV trips with a $10 parking charge (minimum charge
alongside a reduction in the availability of free parking on the fringes). For the other routes some extra form of incentive to travel by bus (such as
travel time priority, or a change in the relative costs of bus versus car travel) or an increase in parking costs to a minimum of $15 would be
required to make public transport more attractive than SOV trips.
Car (SOV) Car (SOV) Car (SOV) Car (SOV)
Bus / Park and Ride Bus / Park and Ride
Free Off-site Off-site Off-site HOV Bus / Park and compared with Car compared with Car
Trip Link
parking at parking parking parking passenger Ride (SOV) Off –site (SOV) Off –site
work parking $10 parking $15
Free $10 $15
Papamoa - Mount Maunganui 34.6 44.4 57.9 67 37.8 63.5 + 5.6 minutes - 3.5 minutes
Papamoa – Tauranga 39.5 49.5 62.7 71.9 42.1 53.4 - 9.3 minutes - 18.5 minutes
Mount Maunganui - Tauranga 14.2 24.2 37.5 46.6 23.2 35.4 - 2.1 minutes - 11.2 minutes
Greerton - Tauranga 14.8 24.8 38.1 47.2 24.1 39.7 + 1.6 minutes - 7.5 minutes
Omokoroa - Tauranga 31.2 41.2 54.5 38 38 59.3 + 4.8 minutes - 4.3 minutes
30 GHD Advisory Urban Form & Transport Initiative – Mode Shift & Multi-Modal SolutionsPublic Transport Programme Development EXPLORE
Connected Nodes
The consultant team have considered the insights collected from staff from the UFTI partners and the analysis that has been undertaken to
REVIEW DEVELOP
develop an indicative programme of phased interventions that is illustrated on the following slide and detailed below.
FOCUS
Phase 1 (east sector)
Phase 1 focuses on public transport and land use improvements for the east sector to accommodate the additional growth that is forecast from 2021:
A high capacity public transport route between Te Tumu, Papamoa, Bayfair and the City
Secondary public transport feeder services connecting Mount Maunganui and the City and Te Puke with Wairakei
Park and Ride at Te Puke and Te Tumu to boost patronage of the high capacity route
Higher density developments and high growth around key hubs
Parking management in the central City ($10-15 charge for off-site parking)
Phase 2 (south sector)
Phase 2 focuses on public transport and land use improvements for the south sector to accommodate the additional growth that is forecast from 2031:
A high capacity public transport route between Pyes Pa, Greerton, the Hospital and the City
Secondary public transport feeder service connecting Tauriko and Welcome Bay with the high capacity corridor and the City.
Park and Ride at Tauriko and Pyes Pa to boost patronage of the high capacity route
Higher density developments and high growth around key hubs
Phase 3 (west sector)
Phase 3 focuses on public transport and land use improvements for the west sector from 2041:
Secondary public transport services connecting Omokoroa, Te Puna and Bethlehem and an Otumoetai loop connecting with the City
Park and Ride at Te Puna and Omokoroa to boost patronage of the public transport route
Growth around key hubs
A toolbox and description of the proposed public transport interventions is included in Appendix C.
31 GHD Advisory Urban Form & Transport Initiative – Mode Shift & Multi-Modal SolutionsPublic Transport Programme Development EXPLORE
Connected Nodes
REVIEW DEVELOP
FOCUS
Mount = Primary High Capacity PT Route
Omokoroa Maunganui
= Secondary PT Route
= Rail Line
P
Otumoetai P = Park and Ride
= Parking Management (pricing)
Bayfair
= High Growth Areas (TOD’s)
Tauranga = Higher Densities (adjacent to PT)
Phase 3 Te Puna
Bethlehem
from 2041 P Papamoa
Phase 1 Wairakei
Welcome
Greerton Bay
from 2021
Tauriko Te Tumu
P P
Te Puke
P
Phase 2
Pyes Pa
from 2031 P
Paengaroa
32 GHD Advisory Urban Form & Transport Initiative – Mode Shift & Multi-Modal SolutionsWider Considerations EXPLORE
A significant amount of existing work has already been undertaken to understand The need to investigate park and ride facilities FOCUS
the key transport problems and outcomes sought for the WBoP sub-region.
Mixed use development to reduce the REVIEW DEVELOP
This includes a recent draft Transport Model Update report (Programme 8.2 TTSM number and distance of trips
Model Updates), dated 2 October 2019. This report details the transport model that
Reducing levels of car ownership per household
has been developed to attempt to replicate the transport system in the Tauranga
and increasing vehicle occupancy rates
area. The report highlights:
The report highlights the potential future use of
Higher public transport mode share may be achieved on longer trips where
ferry/water services to provide an alternative to
buses have more opportunity to compete with car
road and rail passenger services
Higher parking prices or other penalties for driving, travel behaviour change
When considering and testing future public transport scenarios it is also
initiatives that support mode shift and improvements to first and last mile travel
important to consider the theoretical capacity of the corridors. As an example in
such as e-bikes and scooters, would support public transport mode shift
the base ++ model scenario ($1 bus fares, expanded coverage and larger paid
Current land uses close to the existing railway line utilised by freight, are not parking zone in Tauranga city), Cameron Road would have a 47% public
conducive to passenger rail trips. In particular, residential density near rail transport mode share, reducing capacity for general traffic and other modes
stations is very low
The draft Programme 8.2 TTSM Model Updates Report provides an overview of
Considering intensification around rail stations (transit oriented developments) forecast traffic levels of service and highlights the worst performing corridors for
and micro-mobility opportunities to improve first and last mile connections is general traffic, which include:
recommended to optimise a passenger rail service
o 15th Avenue and Cameron Road intersection
o Welcome Bay roundabouts
o Intersections along Hewlett’s Road
o Maunganui Road between Hewlett’s and Girven Road
o Maunganui / Girven intersection
33 GHD Advisory Urban Form & Transport Initiative – Mode Shift & Multi-Modal SolutionsSummary and
Recommendations
Click to insert Document Title
GHD AdvisoryEXPLORE
Summary and Recommendations
FOCUS
Summary REVIEW DEVELOP
This report has built on the extensive work undertaken to date. It has developed an
understanding of key customer insights and outlines the opportunities to make a
significant shift in mode share over the next 10, 20 and 30 years to help improve
environmental, social and economic outcomes for the WBoP sub-region.
Evidently, travel times plays a key role in the overall satisfaction of an individual’s
commute and the attractiveness of public transport use over car use. Shorter public
transport travel times will likely encourage a greater mode shift. However there are
several other factors affecting people’s travel choices, such as frequency, reliability and
cost (relative to that by other modes).
A workshop was undertaken with staff from UFTI partners to better understand the
current and likely future constraints, challenges and opportunities. This work
highlighted the importance of transport and land use integration in order to develop the
density and demand required for higher capacity, high frequency public transport
services. Along with wider policy and transport interventions to improve the
competitiveness and attractiveness of public transport in comparison with other modes.
Travel demand forecasts have been developed by Flow Transportation Specialists
utilising the latest version of the Tauranga Transport Model. A review of broad sector to
sector origin and destination demand matrices in the 2063 AM peak indicate the
highest demand will originate from the eastern and southern sectors.
High level analysis has been undertaken to determine the number of public transport
services, frequency and supporting infrastructure that is likely to be required to
accommodate demand for a range of future public transport mode share scenarios.
This analysis demonstrates the potential trigger for higher capacity modes if demand
for public transport was to increase to 20% mode share by 2063. The analysis
suggests that the greatest level of demand for public transport is anticipated for people
travelling within the eastern sector. This is followed by people travelling from the
southern sector to the central sector. This work suggests that a phased approach is
required to progress towards the desired future state, starting with bus priority and
working towards higher capacity modes and supporting measures that include land use
intensification, Park and Ride and parking management in the central City.
35 GHD Advisory Urban Form & Transport Initiative – Mode Shift & Multi-Modal SolutionsAssumptions
Click to insert Document Title
GHD AdvisoryAssumptions
This report has been prepared by GHD for UFTI on behalf of Smart Growth and In preparing this report GHD have assumed the following:
may only be used and relied on by UFTI for the purpose agreed between GHD and
For the purpose of this analysis it has been assumed that the growth in demand
UFTI.
for public transport is evenly distributed. Further analysis of land use growth
GHD otherwise disclaims responsibility to any person other than UFTI arising in patterns and timing of future development would be required to refine this
connection with this report. GHD also excludes implied warranties and conditions, analysis.
to the extent legally permissible.
It is important to note that the Beca Programme 8.2 Transport Model Update
The services undertaken by GHD in connection with preparing this report were report is draft, so the forecast numbers should be taken as indicative only.
limited to those specifically detailed in the report and are subject to the scope
The assumed 20% public transport mode share scenario test is not based on
limitations set out in the report.
any modelling – as noted above it is based on factoring up all public transport
The opinions, conclusions and any recommendations in this report are based on demands from the model test that gave the highest public transport demands.
conditions encountered and information reviewed at the date of preparation of the
References
report. GHD has no responsibility or obligation to update this report to account for
events or changes occurring subsequent to the date that the report was prepared. 1 2013 Census Quick Stats about a place: Tauranga City:
http:Census/2013-census/profile-and-summary-reports/quickstats-about-a
The opinions, conclusions and any recommendations in this report are based on
place.aspx?request_value=13878&tabname=Transport
assumptions made by GHD. GHD disclaims liability arising from any of the
assumptions being incorrect. 2 Bay of Plenty Passenger & Freight Rail Phase 1 Investigation, Channeled
Planning and Contracting, 2019
GHD has prepared this report on the basis of information provided by UFTI and
others who provided information to GHD (including government authorities), which 3 Bus
Patronage Growth Initiatives, Discussion Paper 2: Behaviour Change,
GHD has not independently verified or checked beyond the agreed scope of work. MRCagney
GHD does not accept liability in connection with such unverified information, 4 Western
including errors and omissions in the report which were caused by errors or Bay of Plenty Public Transport Blueprint, Programme Business Case,
omissions in that information. Beca, 2017
5 Travel Demand Management in Tauranga, Presentation, NZTA, 2019
Level 3 138 Victoria Street Christchurch Central 8013 New Zealand PO Box 13468
Christchurch 8141 New Zealand, +64 3 378 0900, advisory@ghd.com. 6 Technical Note 7: Park and Ride – Tauranga Parking Strategy, MRCagney, 2019
© GHD 2017. This document is and shall remain the property of GHD Advisory. 7 Travel Demand Management in Tauranga, Presentation, NZTA, 2019
Reviewer Approved for Issue
Rev.No. Author 8 https://www.tauranga.govt.nz/our-future/strategic-planning/strategic-
Name Signature Name Signature Date
focus/environment-strategy/tauranga-community-carbon-footprint
01 A Smith L Dowdle L Dowdle 31.10.2019
02 A Smith L Dowdle L Dowdle 22.11.2019
37 GHD Advisory Urban Form & Transport Initiative – Mode Shift & Multi-Modal SolutionsYou can also read