Toward resolving the budget discrepancy of ozone-depleting carbon tetrachloride (CCl4): an analysis of top-down emissions from China
←
→
Page content transcription
If your browser does not render page correctly, please read the page content below
Atmos. Chem. Phys., 18, 11729–11738, 2018
https://doi.org/10.5194/acp-18-11729-2018
© Author(s) 2018. This work is distributed under
the Creative Commons Attribution 4.0 License.

Toward resolving the budget discrepancy of ozone-depleting carbon
tetrachloride (CCl4): an analysis of top-down emissions from China
Sunyoung Park1,2 , Shanlan Li2,3 , Jens Mühle4 , Simon O’Doherty5 , Ray F. Weiss4 , Xuekun Fang6 , Stefan Reimann7 ,
and Ronald G. Prinn6
1 Department   of Oceanography Kyungpook National University, Daegu 41566, Republic of Korea
2 Kyungpook    Institute of Oceanography Kyungpook National University, Daegu 41566, Republic of Korea
3 Climate Research Division, National Institute of Meteorological Sciences, Seogwipo, Korea
4 Scripps Institution of Oceanography, University of California, San Diego, La Jolla, CA 92093, USA
5 School of Chemistry, University of Bristol, Bristol, UK
6 Center for Global Change Science, Massachusetts Institute of Technology, Cambridge, MA 02139, USA
7 Empa, Laboratory for Air Pollution and Environmental Technology, Swiss Federal Laboratories for Materials Science and

Technology, Überlandstrasse 129, 8600 Dübendorf, Switzerland

Correspondence: Sunyoung Park (sparky@knu.ac.kr)

Received: 1 March 2018 – Discussion started: 12 March 2018
Revised: 17 July 2018 – Accepted: 22 July 2018 – Published: 17 August 2018

Abstract. Carbon tetrachloride (CCl4 ) is a first-generation     and better regulation strategies to reduce evaporative losses
ozone-depleting substance, and its emissive use and produc-      of CCl4 occurring at the factory and/or process levels.
tion were globally banned by the Montreal Protocol with a
2010 phase-out; however, production and consumption for
non-dispersive use as a chemical feedstock and as a process
                                                                 1   Introduction
agent are still allowed. This study uses the high frequency
and magnitude of CCl4 pollution events from an 8-year real-      Carbon tetrachloride (CCl4 ) is a long-lived greenhouse gas
time atmospheric measurement record obtained at Gosan sta-       and an ozone-depleting substance. Its emissive use, produc-
tion (a regional background monitoring site in East Asia) to     tion and consumption are regulated under the Montreal Pro-
present evidence of significant unreported emissions of CCl4 .   tocol on Substances that Deplete the Ozone Layer and its
Top-down emissions of CCl4 amounting to 23.6 ± 7.1 Gg            Amendments (MP). After reaching a peak in the early 1990s,
yr−1 from 2011 to 2015 are estimated for China, in contrast      the atmospheric abundance of CCl4 has been decreasing at a
to the most recently reported, post-2010, Chinese bottom-        rate of −4.9 ± 0.7 ppt Cl yr−1 (Carpenter et al., 2014) due to
up emissions of 4.3–5.2 Gg yr−1 . The missing emissions (∼       the phase-out of CCl4 use in MP non-Article 5 (developed)
19 Gg yr−1 ) for China contribute to approximately 54 % of       countries by 1995. MP Article 5 (developing) countries, in-
global CCl4 emissions. It is also shown that 89 % ± 6 % of       cluding China, were required to cease CCl4 production and
CCl4 enhancements observed at Gosan are related to CCl4          consumption for dispersive applications by 2010. However,
emissions from the production of CH3 Cl, CH2 Cl2 , CHCl3         CCl4 production and consumption for non-dispersive use
and C2 Cl4 and its usage as a feedstock and process agent        (e.g., as chemical feedstock and as a process agent) continues
in chemical manufacturing industries. Specific sources and       to be allowed, and thus CCl4 is still produced and consumed
processes are identified using statistical methods, and it is    alongside the increasing production of non-ODS chemicals
considered highly unlikely that CCl4 is emitted by dispersive    (Carpenter et al., 2014). At present, the global bottom-up
uses such as old landfills, contaminated soils and solvent us-   CCl4 emissions derived from reporting countries are 3 (0–
age. It is thus crucial to implement technical improvements      8) Gg yr−1 for 2007–2013 (Carpenter et al., 2014; Liang et
                                                                 al., 2016).

Published by Copernicus Publications on behalf of the European Geosciences Union.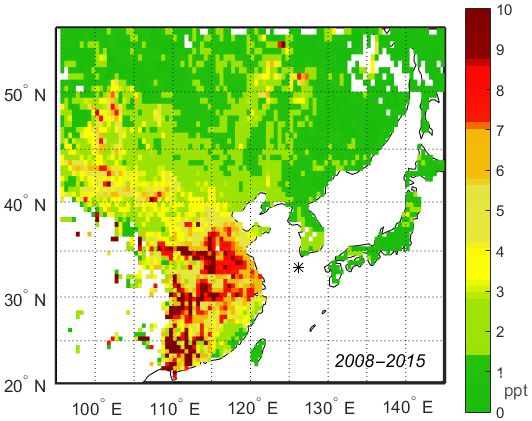
11730            S. Park et al.: Toward resolving the budget discrepancy of ozone-depleting carbon tetrachloride (CCl4 )

    The recent Stratosphere–Troposphere Processes and their           With the aim of resolving the apparent CCl4 budget dis-
Role in Climate (SPARC) report (Liang et al., 2016) updated        crepancy, this study presents an estimate of regional CCl4
bottom-up anthropogenic CCl4 emissions to at most 25 Gg            emissions from China, one of the MP Article 5 countries
yr−1 in 2014, based on reconsideration of industrial pro-          in East Asia. Due to its recent and ongoing strong indus-
duction processes plus usage (15 Gg yr−1 ), and the upper-         trial growth, current emissions and changes in emission
limit estimate of 10 Gg yr−1 for the potential escape from         patterns are of special interest. In addition, recent stud-
legacy sites and unreported inadvertent emissions (Sherry et       ies based on atmospheric monitoring have consistently re-
al., 2017).                                                        ported a significant increase in the emissions of most halo-
    To verify these bottom-up estimates, independent top-          carbons in China (Vollmer et al., 2009; Kim et al., 2010;
down CCl4 emission studies have used the total lifetime of         Li et al., 2011). Top-down estimates of Chinese emissions
CCl4 with atmospheric observations (i.e., the observed de-         for CCl4 have been made in previous studies using a La-
cline rate of CCl4 concentrations) and atmospheric transport       grangian inverse model based on ground-based monitoring
models to derive top-down emission estimates. Using the            data (Vollmer et al., 2009) and an interspecies correlation
most current estimates for the lifetime of CCl4 in the atmo-       method based on aircraft observations (Palmer et al., 2003;
sphere, soil and ocean (Liang et al., 2016; Rhew and Happell,      Wang et al., 2014). The estimates made in these studies were
2016; Butler et al., 2016), global top-down emissions to the       quite variable, with 17.6 ± 4.4 Gg yr−1 in 2001 (Palmer et
atmosphere were calculated as 40 ± 15 Gg yr−1 from 2007            al., 2003), 15 (10–22) Gg yr−1 in 2007 (Vollmer et al., 2009)
to 2014 (Liang et al., 2016). A recent top-down study based        and 4.4 ± 3.4 Gg yr−1 in 2010 (Wang et al., 2014), and these
on the observed temporal trend and interhemispheric gra-           studies were conducted before the complete phase-out of
dient of atmospheric CCl4 (Liang et al., 2014) consistently        CCl4 production for emissive applications in China came
derived global CCl4 emissions of 30 ± 5 Gg yr−1 from 2000          into effect in 2010. Most recently, Bie et al. (2017) pub-
to 2012 when using the newly determined relative strength of       lished post-2010 bottom-up emission estimates for China
oceanic sink versus soil loss (Liang et al., 2016). Therefore,     of 4.3 (1.9–8.0) Gg yr−1 in 2011 and 5.2 (2.4–8.8) Gg yr−1
the best estimate of global emissions from top-down methods        in 2014, which updated the previous zero-emissions estimate
is 35±16 Gg yr−1 , which is significantly higher than reported     (Wan et al., 2009) by including the conversion of C2 Cl4 emis-
emissions of 3 Gg yr−1 , even when considering large uncer-        sions to CCl4 as well as the source of CCl4 from coal com-
tainties relating to soil and ocean CCl4 sinks (and how those      bustion smog.
sinks might change over time). Although the revised bottom-           In this study, we present an 8-year record of continuous,
up estimate of 25 Gg yr−1 mentioned above contributes con-         high frequency, high-precision, atmospheric CCl4 concentra-
siderably to closing the gap between bottom-up and top-            tions measured at the Gosan station (33◦ N, 126◦ E) on Jeju
down emission estimates, this new bottom-up value is still         Island, Korea for 2008–2015. Using a tracer–tracer correla-
lower than the average SPARC-merged top-down emission              tion method (Li et al., 2011) based on a top-down interpre-
estimate of 35±16 Gg yr−1 (though the uncertainty is large).       tation of atmospheric observations, we estimate yearly emis-
The discrepancy between bottom-up and top-down emission            sion rates of CCl4 for China and examine changes in these
estimates implies the existence of unidentified sources and/or     rates following the scheduled phase-out for CCl4 in 2010.
unreported industrial emissions.                                   Gosan station monitors air masses arriving from a variety of
    Regional studies of episodic enhancements of CCl4 above        different regions (Kim et al., 2012), and the emission foot-
atmospheric background concentrations observed in several          prints of these cover an area from north-eastern China down
regions using inverse model techniques have suggested emis-        to south of the Yangtze River, which is the most industri-
sive fluxes of 0.11 ± 0.04 Gg yr−1 in 2009–2012 from Aus-          alized region in China. We also analyze the measurements
tralia (Fraser et al., 2014), 15 (10–22) Gg yr−1 in 2007 from      of 17 other anthropogenic compounds to identify key indus-
East Asia (Vollmer et al., 2009), 4 (2–6.5) Gg yr−1 in 2008–       trial sources of CCl4 emissions and their potential locations
2012 from the USA (Hu et al., 2016) and 2.3±0.8 Gg yr−1 in         using a positive matrix factorization model in combination
2006–2014 from western Europe (Graziosi et al., 2016). The         with trajectory statistics (Li et al., 2014).
summed emissions were estimated to total 21 ± 8 Gg yr−1
(Liang et al., 2016), with the most significant contribution be-
longing to East Asia. As the sum of regional emissions quan-       2     Data overview
tified to date has not accounted for global top-down emis-
sions, an improved quantification of regional-/country-scale       2.1    Measurements of CCl4 at Gosan
and industry-based CCl4 emissions is required to gain a bet-
ter insight into the causes of the discrepancy between the re-     Gosan station (GSN) is located on the remote south-western
gional sums and the global top-down estimate. This would           tip of Jeju Island, which lies to the south of the Korean penin-
improve our understanding of the unidentified and/or unre-         sula (72 m a.s.l.) and is well situated for monitoring long-
ported industrial emission sources and would help to estab-        range air mass transport from surrounding regions (Fig. S1
lish practical and effective regulation strategies.                in the Supplement). Wind patterns at GSN are typical of the

Atmos. Chem. Phys., 18, 11729–11738, 2018                                          www.atmos-chem-phys.net/18/11729/2018/
S. Park et al.: Toward resolving the budget discrepancy of ozone-depleting carbon tetrachloride (CCl4 ) 11731
Figure 1. Atmospheric CCl4 concentrations observed from 2008 to 2015 at Gosan station (GSN, 33◦ N, 126◦ E) on Jeju Island, Korea.
Pollution events (identified as significant enhancements in concentrations from background levels shown in black) are denoted by red dots.
Asian monsoon, with strong predominant north-westerly and remote background monitoring station in the Northern Hemi-
north-easterly continental outflows of polluted air from fall sphere) and are declining at a similar rate to the global trend
through to spring, clean continental air flowing directly from (Fig. S4). The magnitude of pollution data analyzed in this
northern Siberia in winter and pristine maritime air from study was defined as the observed enhancements (red dots
the Pacific in summer (Fig. S2). High-precision and high- in Fig. 1) in concentration units above the baseline values
frequency measurements of 40 halogenated compounds in- (i.e., background values representing regional clean condi-
cluding CCl4 were made continuously every 2 h from 2008 tions without regional/local pollution events, black dots) to
to 2015 using a gas chromatography-mass spectrometer (GC- exclude the influence of trends and/or variability in back-
MS) coupled with an online cryogenic preconcentration sys- ground levels from the analysis.
tem (Medusa) (Miller et al., 2008) as part of the Advanced
Global Atmospheric Gases Experiment (AGAGE) program.
Precisions (1σ ) derived from repeated analysis (n = 12) of 3 Potential source regions of CCl4 in East Asia
a working standard of ambient air were better than 1 % of
background atmospheric concentrations for all compounds, A statistical analysis combining enhanced concentrations
e.g., ±0.8 ppt (1σ ) for 85.2 ppt of CCl4 . The measurements (above-baseline concentrations) of CCl4 from 2008 to 2015,
are mostly on calibration scales developed at the Scripps In- with corresponding back trajectories, enabled identifica-
stitution of Oceanography (SIO). tion of the regional distribution of potential CCl4 emission
sources. The statistical method (see Trajectory Statistics in
2.2 Results the Supplement) was first introduced in 1994 (Seibert et al.,
1994) and has previously been applied to analyses relating to
The 8-year observational record of CCl4 analyzed in this halogenated compounds (e.g., Li et al., 2014; Reimann et al.,
study is shown in Fig. 1. It is apparent that pollution events 2004).
(red dots) with significant enhancements above background An elevated concentration at an observation site is pro-
levels (black dots) occurred frequently, resulting in daily portionally related to both the average concentration in each
variations of observed concentrations with relative standard grid cell over which the corresponding air mass has trav-
deviations (RSDs) of 4 %–20 % (in contrast to the RSDs of eled and the air mass trajectory residence time in the grid
0.1 %–1.5 % shown in all the remote stations that operated cell. This allows the method to compute a residence-time-
under the AGAGE program). These results clearly imply that weighted mean concentration for each grid cell by simply
CCl4 emissions are emanating from East Asia. The back- superimposing the back trajectory domain on the grid ma-
ground concentrations at GSN were determined using the trix. We used 6-day kinematic backward trajectories arriv-
statistical method detailed in O’Doherty et al. (2001), and ing at a 500 m altitude above the measurement site that were
they agree well with those observed at the Mace Head sta- calculated using the HYbrid Single-Particle Lagrangian Inte-
tion (53◦ N, 10◦ W) in Ireland (which is representative of a grated Trajectory (HYSPLIT) model of the NOAA Air Re-
www.atmos-chem-phys.net/18/11729/2018/ Atmos. Chem. Phys., 18, 11729–11738, 201811732 S. Park et al.: Toward resolving the budget discrepancy of ozone-depleting carbon tetrachloride (CCl4 )
sources Laboratory (ARL) based on meteorological infor-
mation from the Global Data Assimilation System (GDAS)
model with a 1◦ × 1◦ grid cell (Li et al., 2014). The resi-
dence times were calculated using the methods of Poirot and
Wishinski (1986). To eliminate low confidence level areas,
we applied a point filter that removed grid cells that had less
than 12 overpassing trajectories (Reimann et al., 2004).
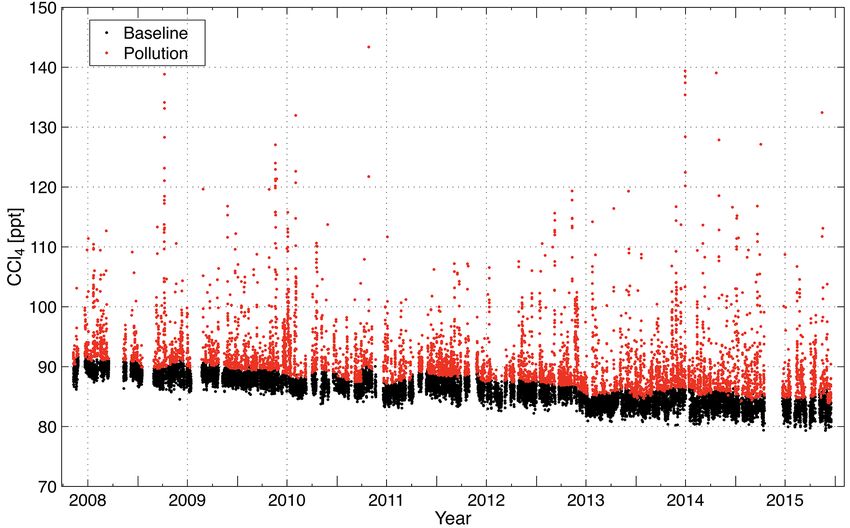
The resulting map of potential source areas for CCl4 in
East Asia (Fig. 2) shows that emission sources are widely
distributed in China, but they are particularly concentrated in
north-eastern China and south-central China (approximately
Shandong, Henan, Hubei and Guangdong provinces). These
provinces include industrialized urban areas that conduct in-
tensive industrial activities, such as chemical manufactur-
ing (http://eng.chinaiol.com/, last access: 21 June 2018). It
is of note that this statistical analysis has little sensitivity to
emissions from southwestern China, due to the limits of the
Figure 2. Distribution of potential source regions calculated
typical 5- to 6-day back-trajectory domain of the HYSPLIT
from trajectory statistics for enhancement data of CCl4 observed
model. Additionally, this method tends to underestimate the from 2008 to 2015. The color code (in ppt) denotes a residence-
inherently sharp spatial gradients in the vicinity of emission time-weighted mean concentration for each grid cell. The resulting
hotspots, because its calculation scheme distributes the mea- map of potential source areas for CCl4 shows that emission sources
sured concentrations evenly throughout grid cells over which are widely distributed over China. The site of Gosan station is indi-
a trajectory has passed (Stohl, 1996). Nonetheless, it is clear cated by an asterisk (∗ ).
that the CCl4 emission sources from East Asia were predom-
inantly located in China.
sions and/or clearly have large errors, which thus makes it
difficult to adequately define the prior emissions required for
4 Using observed interspecies correlations to estimate inverse modeling. However, the ratio method is restricted by
country-based, top-down CCl4 emissions in China its core assumptions: that the emissions of the reference and
target compounds are co-located (or at least well mixed) un-
To identify pollution events solely related to Chinese emis- til they reach the measurement site, and that the reference
sions, we classified an event as “Chinese” if the 6-day kine- emissions are well known. The interspecies ratios we ob-
matic back trajectories arriving at GSN had entered the served at GSN showed statistically significant correlations
boundary layer (as defined by HYSPLIT) only within the for many compounds on a national scale (Li et al., 2011),
Chinese domain, which was defined as a regional grid of suggesting that overall these core assumptions were satisfied
100–124◦ E and 21–45◦ N (Fig. S5a). This analysis classi- in this study.
fied 29 % of all observed CCl4 pollution events from 2008 An adequate reference compound should be a widely
to 2015 (Fig. S5b) as Chinese. An additional 46 % were af- used industrial species with high national emission rates,
fected by Chinese domain plus another country; however, thereby allowing for robust and compact correlations with
these blended air masses were excluded from the determi- many other species and low uncertainties in its own emis-
nation of Chinese emissions. sion estimate. The reference compound was chosen by ex-
For the Chinese emissions estimate of CCl4 , we use an in- amining the observed relationships of CCl4 enhancements
terspecies correlation method, analogously to many recent above baseline versus the enhancements above baseline for
emission studies (e.g., Kim et al., 2010; Li et al., 2011; 25 other halocarbons in air masses classified as Chinese.
Palmer at al., 2003; Wang et al., 2014). In this method, the We found that the 1CCl4 /1HCFC-22 ratio (0.13 ppt ppt−1 )
emission rate of a co-measured compound of interest can be showed one of the most significant correlations (R 2 = 0.72,
inferred based on its compact empirical correlation with a p < 0.01) (Fig. S6). Furthermore, given that China has been
reference compound with a country-scale emission that has the largest producer and consumer of HCFCs since 2003,
been independently well defined. This empirical ratio ap- and that production of HCFC-22 accounts for more than
proach provides a simple yet comprehensive method for es- 80 % of all Chinese HCFC production (UNEP, 2009), HCFC-
timating regional emissions of almost all halogenated com- 22 is the best-suited reference compound for use with
pounds measured at GSN, and it minimizes the uncertainties China. Additionally, strong Chinese HCFC-22 emissions
inherent in more complex modeling schemes. This method is have been determined from atmospheric observations and
particularly useful for compounds such as CCl4 , where the inverse modeling in previous studies (Kim et al., 2010; Li
associated bottom-up inventories indicate close to zero emis- et al., 2011; Stohl et al., 2010; An et al., 2012; Fang et
Atmos. Chem. Phys., 18, 11729–11738, 2018 www.atmos-chem-phys.net/18/11729/2018/S. Park et al.: Toward resolving the budget discrepancy of ozone-depleting carbon tetrachloride (CCl4 ) 11733
al., 2012), with estimates ranging from 46 to 146 Gg yr−1
over the period 2007–2009. Our estimates of annual HCFC- 50 CCl4 emissions
22 emissions in China for 2008–2015 were independently
derived from atmospheric measurements at GSN using an 40 This study
inverse technique based on FLEXible PARTicle dispersion
CCl4 (Gg yr-1)
Palmer et al. (2003)
model (FLEXPART) Lagrangian transport model analysis 30
(Stohl et al., 2010; Fang et al., 2014) and ranged from Vollmer et al. (2009)
89 Gg yr−1 in 2011 to 144 Gg yr−1 in 2015. The uncertainty
20
in the top-down estimates was 30 %, which mainly related to
an assumed uncertainty of ±50 % in annual prior emissions
used for the inversion calculation (Fig. S7). 10
Wan et al. (2009):
Next, we used empirical correlations between observed Bottom-up Wang et al. Bie et al. (2017):
(2014) Bottom-up
enhancements of CCl4 and HCFC-22 (1CCl4 /1HCFC-22; 0
2000 2002 2004 2006 2008 2010 2012 2014 2016
annual slopes shown in Fig. S8) to estimate CCl4 emission Year
rates. The interspecies slopes were determined based on ob-
served enhancements obtained by subtracting regional back- Figure 3. CCl4 emissions in China as determined by an interspecies
ground values from the original observations to avoid po- correlation method. A comparison between our results and previous
tential underestimation of the slopes due to the high den- estimates for Chinese emissions is also shown. Note that emissions
sity of low background values (following Palmer et al., reached a maximum in 2009–2010 in concurrence with the sched-
2003). Estimated uncertainties for our CCl4 emission es- uled phase-out of CCl4 by 2010, but the average annual emission
rate of 23.6 ± 7.1 Gg yr−1 for the years 2011–2015 is still substan-
timates comprise the emissions uncertainty of HCFC-22
tial.
and an uncertainty associated with the 1HCFC-22/1CCl4
slope, which was calculated using the Williamson–York lin-
ear least-squares fitting method (Cantrell, 2008), considering resent emissions from northern China. Extrapolating them to
measurement errors of both HCFC-22 and CCl4 . the entire country using data from northern China would lead
Figure 3 provides the annual CCl4 emissions in China to an underestimate of emissions, as most industrial activities
for the years 2008–2015, which were calculated based occur in the south-central and eastern parts of China.
on our interspecies correlation method, and also shows a Our estimates show that Chinese emissions increased
comparison between our results and previous estimates of sharply before reaching a maximum in 2009–2010 (with a
CCl4 emissions from China. The CCl4 emission rate of range of 38.2 ± 5.5 to 32.7 ± 5.1 Gg yr−1 ) immediately prior
16.8 ± 5.6 Gg yr−1 in 2008 found in this study is consistent to the scheduled phase-out of CCl4 by 2010. The sudden
with 2001 (Palmer et al., 2003) and 2007 (Vollmer et al., large increase could be attributed to uncontrolled use or pro-
2009) top-down emissions estimates of 17.6± 4.4 Gg yr−1 duction leading to emissions of stored CCl4 before the sched-
and 15 (10–22) Gg yr−1 . To obtain those results, Palmer et uled restrictions came into effect. Interestingly, this increase
al. (2003) used observed correlations of CCl4 with CO as a in our emission estimates was also consistent with the in-
tracer to investigate CCl4 emissions in aircraft observations crease of about 20 Gg yr−1 in the total annual production of
of the Asian plume over a 2-month period (March to April) CCl4 in China from 2008 to 2010, which was mainly related
in 2001, and Vollmer et al. (2009) estimated the 2007 emis- to an increase in the feedstock production sector, i.e., raw ma-
sions using an inverse model based on atmospheric measure- terial production for non-ODS chemicals (Bie et al., 2017).
ments taken from late 2006 to early 2008 at an inland sta- After a dip in 2012, our estimated emissions in 2013–2015
tion (Shangdianzi, 40◦ N, 117◦ E) located in the North China remain stable and are similar overall to those in 2011, with no
Plain. Wang et al. (2014) obtained aircraft measurements statistically discernible differences between these years. It is
over the Shandong Peninsula on 22 July and 27 October 2010 of note that the average emission rate estimated in this study
and from March to May in 2011, and estimated CCl4 emis- of 23.6 ± 7.1 Gg yr−1 for the years 2011–2015 is significant,
sion in 2010 based on observed correlations of CCl4 with as post-2010 bottom-up emissions of CCl4 in China have
both CO and HCFC-22. However, the estimates from these been reported as near zero (Wan et al., 2009), and even the
two different tracers differed by ∼ 100 % (8.8 Gg yr−1 ver- most up-to-date bottom-up estimates (Bie et al., 2017) have
sus 4.4 Gg yr−1 ) and were much lower than the two previ- indicated emissions of only 4.3 (1.9–8.0) Gg yr−1 in 2011
ous results of Palmer et al. (2003) and Vollmer et al. (2009) and 5.2 (2.4–8.8) Gg yr−1 in 2014. These discrepancies be-
and our 2010 estimate of 32.7 ± 5.1 Gg yr−1 . Although the tween bottom-up and top-down emission estimates may sug-
cause of this discrepancy is unclear, it is considered that it gest that emissions of CCl4 from either non-regulated feed-
could be related to the low numbers of observations obtained stock and process agent use or unreported non-feedstock
in the aircraft campaigns and to difficulties defining regional emissions from the production of chloromethanes (CH3 Cl,
background values and extracting pollution signals from the CH2 Cl2 , CHCl3 ) and PCE (C2 Cl4 ) are larger than expected.
aircraft data. It is also possible that the results mostly rep-
www.atmos-chem-phys.net/18/11729/2018/ Atmos. Chem. Phys., 18, 11729–11738, 201811734 S. Park et al.: Toward resolving the budget discrepancy of ozone-depleting carbon tetrachloride (CCl4 )
5 Industrial source apportionment of atmospheric 100
80 38 % (a) Byproduct of CH3Cl plants
CCl4 in East Asia 60
40
The positive matrix factorization (PMF) model was used 20
0
to characterize key industrial CCl4 sources based solely on 100
80 32 % (b) Fugitive in feedstock/process agent usage
atmospheric observations (Paatero and Tapper, 1994). We 60
included all CCl4 enhancement events observed at GSN, 40
20
thereby representing a better characterization of emission 0
100
sources throughout East Asia and not just in China. The PMF 80 19 % (c) Byproduct and escape from PCE plants/
model has been widely used to identify and apportion sources 60 feedstock for PCE
40
of atmospheric pollutants (Guo et al., 2009; Lanz et al., 2009; 20
Source contribution (%)
Li et al., 2009; Choi et al., 2010) and is an optimization 0
100
method that uses a weighted least squares regression to ob- 80 9% (d) Al production/coal burning: COS, CF4
60
tain a best fit to the measured concentration enhancements of 40
chemical species (details in the text of the Supplement) and 20
0
to resolve the number of source factors controlling the ob- 100
80 2 % (e) HFCs production/use:
servations. A brief mathematical expression of the model is 60 HFC-125, HFC-32
given by Eq. (1): 40
20
p 0
X 100
xik = gij fj k + eik (i = 1, 2, . . ., m; j = 1, 2, . . ., p; 80 (f) Refrigerant use:
60 HCFC-22, HFC-134a
j =1 40
20
k = 1, 2, . . ., n), (1) 0
100
where xik represents enhanced concentrations in the time se- 80 (g) Semiconductor/electronic industry: PFCs (SF6, C2F6)
60
ries of the ith compound at the kth sampling time; gij is 40
the concentration fraction of the ith compound from the 20
0
j th source; fj k is the enhanced concentration from the 100
80 (h) Foam blowing: HCFC-142b
j th source contributing to the observation at the kth time, 60
which is given in ppt; eik is the model residual for the 40
20
ith compound concentration measured in the kth sampling 0
SF6
PCE
C2F6
COS
CHCl3
HFC-23
CH2Cl2
CH3Cl
CCl4
HFC-32
CF4
CFC-11
HFC-125
HCFC-22
HCFC-142b
HFC-143a
HCFC-141b
HFC-134a
time; and p is the total number of independent sources (i.e.,
the number of factors) (Paatero and Tapper, 1994). The num-
ber of source factors is an optimal value determined based
on the R 2 that measures how close the predicted concentra-
Figure 4. Source profiles derived from PMF analysis for 18 com-
tions are to the observed enhancements of 18 species (includ-
pounds, including CCl4 , CFCs, HCFCs, HFCs, PFCs, SF6 , COS,
ing not only CCl4 , major CFCs, HCFCs, HFCs, PFCs, SF6 , CH3 Cl, CH2 Cl2 , CHCl3 and C2 Cl4 . The PMF analysis is per-
carbonyl sulfide (COS), but also CH3 Cl, CH2 Cl2 , CHCl3 formed on the time series of enhanced concentrations. The y axis
and PCE) to account for the potential chemical intermedi- shows the percentage of all observed enhancements associated with
ate release of CCl4 during industrial activities. The model’s each factor (with 1σ standard deviation) such that the vertical sum
R-squared values, as estimated from a correlation plot be- for each species listed on the x axis is 100.
tween the measured and PMF model-predicted concentra-
tions, showed that an eight–source model is most appropri-
ate, suggesting eight potential source categories for those emitted in smog from coal combustion (Li et al., 2017) are
18 species. Each source factor is defined based on the source less likely to be the source of this factor because COS, which
profile (i.e., relative abundances of individual species). The is a major coal burning tracer, does not contribute to this fac-
percentage contributions of factors to the observed enhance- tor. Source factor (B) is largely related to fugitive emissions
ments of individual compounds are shown in Fig. 4. Uncer- in feedstock and process agent use of various compounds;
tainties were determined from the 1σ standard deviation of it accounts for a large fraction of CCl4 (32 % ± 4 %) and
factor contributions from 5 sets of 20 runs (total 100 replica- shows high percentages for several compounds: 72 % ± 18 %
tions) (Reff et al., 2007). of CH2 Cl2 , 59 % ± 11 % of CHCl3 , 39 % ± 10 % of CFC-
Factor (A) shown in Fig. 4 is characterized by 38 % ± 11 and 51 % ± 12 % of HFC-23. It is of note that CH2 Cl2
4 % of CCl4 and 97 % ± 2 % of CH3 Cl, suggesting adver- and CHCl3 can be produced as byproducts of chlorination
tent or inadvertent co-production and escape of CCl4 dur- along with CCl4 and are used as intermediates or solvents in
ing chloromethane generation in chemical plants (see Sup- chemical manufacturing. CCl4 is a feedstock for PCE, HFC,
plement text for chemical reactions). CCl4 and CH3 Cl co- methyl chloride and divinyl acid chloride production (Liang
Atmos. Chem. Phys., 18, 11729–11738, 2018 www.atmos-chem-phys.net/18/11729/2018/S. Park et al.: Toward resolving the budget discrepancy of ozone-depleting carbon tetrachloride (CCl4 ) 11735
et al., 2016) and is also used in CFC production (Zhang et soil and solvent usage have become less significant. A de-
al., 2010; Sherry et al., 2018). In addition, CHCl3 can be tailed description of factors D–H is provided in the Supple-
used as a feedstock for HCFC-22 production (Montzka et ment.
al., 2011), which is consistent with factor (B) also being dis-
tinguished by a high contribution of HFC-23: Chinese emis-
sions of HFC-23 account for ∼ 70 % of total global emis- 6 Conclusions
sions (Kim et al., 2010; Li et al., 2011) and it is a typical
An 8-year record of atmospheric CCl4 observations obtained
byproduct of HCFC-22 generation (Fang et al., 2015). HFC-
at GSN provided evidence of ongoing CCl4 emissions from
23 is thus emitted at factory level in regions where chemical
East Asia during 2008–2015. Based on these measurements,
manufacturing industries are heavily collocated. Overall, the
this paper presents a top-down CCl4 emissions estimate from
fact that observed enhancements of HFC-23, CCl4 , CH2 Cl2 ,
China of 23.6 ± 7.1 Gg yr−1 for the years 2011–2015, which
CHCl3 and CFC-11 are grouped together into factor (B) in
is different to a bottom-up estimate of 4.3–5.2 Gg yr−1 given
the PMF analysis implies that this factor most likely repre-
by most current bottom-up emission inventories for post-
sents fugitive emissions of these compounds occurring at fac-
2010 China.
tory level during various chemical manufacturing processes
Liang et al. (2016) estimated global top-down emissions
in China. Source factor (C) is distinguished by 19 % ± 1 % of
as 35 ± 16 Gg yr−1 , which was an average estimate based
CCl4 and 95 %± 2% of PCE; it can be explained by adver-
on the estimate of 40 ± 15 Gg yr−1 for the new 33-year total
tent or inadvertent co-production and escape of CCl4 during
lifetime of CCl4 and an independent top-down method using
industrial C2 Cl4 production and in part by fugitive emissions
the observed interhemispheric gradient in atmospheric con-
of CCl4 used as a chlorination feedstock for C2 Cl4 produc-
centrations, which yielded 30 ± 5 Gg yr−1 . The SPARC sum
tion.
of regional emissions was estimated as 21 ± 8 Gg yr−1 , of
The spatial distributions (Fig. S9) of source factors (A)–
which Chinese emissions of 15 (10–22) Gg yr−1 contributed
(C) derived from trajectory statistics (text of Supplement) are
71 % ± 33 % to the total amount, but this result is still lower
similar and cover areas in and around Guangzhou of Guang-
than the aggregated top-down values. However, if we employ
dong, Wuhan of Hubei, Zhengzhou of Henan and Xian of
the higher emission estimate of 23.6 ± 7.1 Gg yr−1 obtained
Shaanxi province. These distributions are consistent with the
for China in this study, the summed regional estimate would
results of PMF analysis, which confirms that CCl4 emissions
be 30 ± 10 Gg yr−1 , which is largely in agreement with the
from China are more strongly associated with industrial pro-
best global emissions estimate of 35±16 Gg yr−1 determined
cesses than with population density. Our results are also con-
by Liang et al. (2016).
sistent with those of a previous study on halocarbon observa-
A factor analysis combining the observed concentration
tions in the Pearl River Delta region of Guangdong (Zhang
enhancements of 18 species was used to identify key in-
et al., 2010), which used a source profile analysis to reveal
dustrial sources for CCl4 emissions and link our atmo-
that CFCs and CCl4 emissions from an industrial source re-
spheric observation-based top-down identification of poten-
lated to chemical (i.e., refrigerant) production increased by
tial sources with bottom-up inventory-based estimates (e.g.,
1.4–2.0 times from 2001–2002 to 2007, even though there
Liang et al., 2016; Sherry et al., 2018). Three major source
were no significant changes in the atmospheric mixing ra-
categories accounting for 89 % ± 6 % of CCl4 enhancements
tios of these compounds for the 6 years. These results imply
observed at GSN were identified as being related to adver-
an increased use of CCl4 in chemical production. The three
tent or inadvertent co-production and escape of CCl4 from
emission source factors (A–C), which account for 89 %±6 %
CH3 Cl production plants (factor A), escape during indus-
of CCl4 enhancements observed at GSN, are thus considered
trial PCE production (factor C), fugitive emissions (factor B)
to be mostly escaped CCl4 emissions at factory level relating
from feedstock use for the production of other chlorinated
to an inadvertent byproduct, feedstock usage for production
compounds (e.g., CHCl3 ) and process agent use and possibly
of chlorinated compounds, and process agent use for chemi-
from other uses of chloromethanes in chemical manufactur-
cal processes.
ing. These sources are largely consistent with the bottom-up
Other factors of PMF analysis relate to (D) primary alu-
CCl4 emission pathways identified in SPARC (Liang et al.,
minum production (Blake et al., 2004), (E) HFC produc-
2016). The SPARC estimate of global CCl4 emissions from
tion/applications, (F) refrigerant consumption, (G) processes
chloromethanes and PCE / CCl4 plants (pathway B from
in the semiconductor and electronics industry, and (H) foam
Liang et al., 2016 and Sherry et al., 2018) was 13 Gg yr−1 ,
blowing agent use, and can mostly be summarized as be-
as the most significant source. Fugitive feedstock and pro-
ing distributed emissions. However, the percentage contribu-
cess agent emissions, denoted by pathway A by Liang et
tions of these other source factors to CCl4 enhancements are
al. (2016) and Sherry et al. (2018), were estimated as ∼
not statistically significant when considering the uncertainty
2 Gg yr−1 . The emission contributions from China to path-
range. The smallest contribution to CCl4 of the sources char-
ways B and A were 6.6 and 0.7 Gg yr−1 , respectively (Liang
acterized as general consumption and legacy release could
et al., 2016; Sherry et al., 2018).
suggest that CCl4 emissions from old landfills, contaminated
www.atmos-chem-phys.net/18/11729/2018/ Atmos. Chem. Phys., 18, 11729–11738, 201811736 S. Park et al.: Toward resolving the budget discrepancy of ozone-depleting carbon tetrachloride (CCl4 )
If we assume that emission rates from sources correspond ICT (MSIT), the Ministry of Environment (ME), and the Ministry
to the relative contributions of corresponding source fac- of Health and Welfare (MOHW) (no. NRF-2017M3D8A1092225).
tors to the total Chinese emission rate (23.6 ± 7.1 Gg yr−1 We acknowledge the support of our colleagues from the Ad-
for the years 2011–2015), source factors (A) (CCl4 emis- vanced Global Atmospheric Gases Experiment (AGAGE). The
sions from chloromethane plants) and (C) (emissions from operation of the Mace Head AGAGE station, the MIT theory
and inverse modeling and SIO calibration activities are supported
PCE plants) amount to 13 ± 4 Gg yr−1 for China. This is
by the National Aeronautics and Space Administration (NASA,
as high as the global bottom-up number of 13 Gg yr−1 for USA) (grants NAG5-12669, NNX07AE89G, NNX11AF17G
pathway B emissions and more than 50 % higher than the and NNX16AC98G to MIT; grants NAG5-4023, NNX07AE87G,
Chinese estimate of 6.6 Gg yr−1 . This could represent the NNX07AF09G, NNX11AF15G, NNX11AF16G, NNX16AC96G
possibility that the ratio of CCl4 emissions from these pro- and NNX16AC97G to SIO). AGAGE stations operated by the
cesses into the atmosphere is higher than previously as- University of Bristol were funded by the UK Department of
sumed, although factor (C) could include the influence of Business, Energy and Industrial Strategy (formerly the Department
fugitive emissions of CCl4 when using as a chlorination feed- of Energy and Climate Change) through contract TRN 34/08/2010,
stock for PCE production. Furthermore, source factor (B) NASA contract NNX16AC98G through MIT, and NOAA con-
(fugitive feedstock/process agent emissions) is estimated at tract RA-133R-15-CN-0008.
∼ 7 ± 2 Gg yr−1 from China alone, which again contrasts
Edited by: Alex B. Guenther
with the Chinese estimate of ∼ 0.7 Gg yr−1 and even with the
Reviewed by: three anonymous referees
lower global estimate of only 2 Gg yr−1 for pathway A from
Liang et al. (2016) and Sherry et al. (2018). Although the
analysis provided here may contain uncertainties, it appears
that the SPARC industry-based bottom-up emissions are un-
derestimated. Therefore, improvements in estimating indus- References
try bottom-up emissions of CCl4 , particularly at the factory
and/or process levels, are crucial for gaining a better under- An, X. Q., Henne, S., Yao, B., Vollmer, M. K., Zhou, L. X., and
standing and evaluation of ongoing global emissions of CCl4 . Li Y.: Estimating emissions of HCFC-22 and CFC-11 in China
by atmospheric observations and inverse modeling, Sci. China
Chem., 55, 10, 2233–2241, https://doi.org/10.1007/s11426-012-
4624-8, 2012.
Data availability. Data used in this study are available from
Bie P., Fang X., Li Z., and Hu J.: Emissions estimates of carbon
the AGAGE (Advanced Global Atmospheric Gases Exper-
tetrachloride for 1992–2014 in China, Environ. Poll., 224, 670–
iment) database (http://agage.eas.gatech.edu/data_archive/agage/
678, https://doi.org/10.1016/j.envpol.2017.02.051, 2017.
gc-ms-medusa/, last access: July 2018).
Blake, N. J., Streets, D. G., Woo, J. H., Simpson, I. J.,
Green, J., Meinardi, S., Kita, K., Atlas, E., Fuelberg, H. E.,
The Supplement related to this article is available Sachse, G., Avery, M. A., Vay, S. A., Talbot, R. W., Dibb,
online at https://doi.org/10.5194/acp-18-11729-2018- J. E., Bandy, A. R., Thornton, D. C., Rowland, F. S., and
Blake, D. R.: Carbonyl sulfide and carbon disulfide: Large-
supplement.
scale distributions over the western Pacific and emissions
from Asia during TRACE-P, J. Geophys. Res., 109, D15S05,
https://doi.org/10.1029/2003JD004259, 2004.
Author contributions. SP and SL carried out the measurements of Butler, J. H., Yvon-Lewis, S. A., Lobert, J. M., King, D. B.,
CCl4 and other halogenated compounds at Gosan and analyzed the Montzka, S. A., Bullister, J. L., Koropalov, V., Elkins, J. W., Hall,
results. SP supported the Gosan observations, interpreted the data B. D., Hu, L., and Liu, Y.: A comprehensive estimate for loss
and wrote the manuscript. JM and RFW supported the calibration of atmospheric carbon tetrachloride (CCl4 ) to the ocean, Atmos.
and long-term precision for the observations of halogenated com- Chem. Phys., 16, 10899–10910, https://doi.org/10.5194/acp-16-
pounds at Gosan. SR designed the study and interpreted the an- 10899-2016, 2016.
alyzed results. SOD provided the in situ measurement data from Cantrell, C. A.: Technical Note: Review of methods for lin-
Mace Head. XF performed an inverse model and provided the ear least-squares fitting of data and application to atmo-
HCFC-22 emission estimates. RGP supported the AGAGE obser- spheric chemistry problems, Atmos. Chem. Phys., 8, 5477–5487,
vations. https://doi.org/10.5194/acp-8-5477-2008, 2008.
Carpenter, L. J., Reimann, S., Burkholder, J. B., Clerbaux, C.,
Hall, B. D., Hossaini, R., Laube, J. C., and Yvon-Lewis, S. A.:
Competing interests. The authors declare that they have no conflict Ozone-Depleting Substances (ODSs) and other gases of interest
of interest. to the Montreal Protocol, in: Scientific Assessment of Ozone De-
pletion: 2014, Global Ozone Research and monitoring Project,
Report No. 55, World Meteorological Organization, Geneva,
Acknowledgements. This research was supported by the National Switzerland, 2014.
Strategic Project-Fine particle of the National Research Foun- Choi, E., Heo, J. B., and Yi, S. M.: Apportioning and lo-
dation of Korea (NRF) funded by the Ministry of Science and cating nonmethane hydrocarbon sources to a background
Atmos. Chem. Phys., 18, 11729–11738, 2018 www.atmos-chem-phys.net/18/11729/2018/S. Park et al.: Toward resolving the budget discrepancy of ozone-depleting carbon tetrachloride (CCl4 ) 11737 site in Korea, Environ. Sci. Technol., 44, 5849–5854, Chem. Phys., 9, 3445–3459, https://doi.org/10.5194/acp-9-3445- https://doi.org/10.1021/es903634e, 2010. 2009, 2009. Fang, X., Wu, J., Su, S., Han, J., Wu, Y., Shi, Y., Wan, Li, S., Kim, J., and Kim, K. R.: Emissions of halogenated D., Sun, X., Zhang, J., and Hu, J.: Estimates of ma- compounds in East Asia determined from measurements at jor anthropogenic halocarbon emissions from China based Jeju Island, Korea, Environ. Sci. Technol., 45, 5668–5675, on interspecies correlations, Atmos. Environ., 62, 26–33, https://doi.org/10.1021/es104124k, 2011. https://doi.org/10.1016/j.atmosenv.2012.08.010, 2012. Li, S., Kim, J., Park, S., Kim, S. K., Park, M. K., Mühle, J., Lee, Fang, X., Thompson, R. L., Saito, T., Yokouchi, Y., Kim, J., G., Lee, M., Jo, C. O., and Kim, K. R.: Source identification Li, S., Kim, K. R., Park, S., Graziosi, F., and Stohl, A.: and apportionment of halogenated compounds observed at a re- Sulfur hexafluoride (SF6 ) emissions in East Asia determined mote site in East Asia, Environ. Sci. Technol., 48, 491–498, by inverse modeling, Atmos. Chem. Phys., 14, 4779–4791, https://doi.org/10.1021/es402776w, 2014. https://doi.org/10.5194/acp-14-4779-2014, 2014. Li, S., Park, M. K., Jo, C. O., and Park, S. J.: Emission estimates of Fang, X., Stohl, A., Yokouchi, Y., Kim, J., Li, S., Saito, T., Park, methyl chloride from industrial sources in China based on high S., and Hu, J.: Multiannual top-down estimate of HFC-23 emis- frequency atmospheric observations, J. Atmos. Chem., 74, 227– sions in East Asia, Environ. Sci. Technol., 49, 4345–4353, 243, https://doi.org/10.1007/s10874-016-9354-4, 2017. https://doi.org/10.1021/es505669j, 2015. Li, X., Wang, S., Duan, L., and Hao, J.: Characterization of non- Fraser, P., Dunse, B., Manning, A., Wang, R., Krummel, P., methane hydrocarbons emitted from open burning of wheat Steele, P., Porter, L., Allison, C., O’Doherty, S., Simmonds, P., straw and corn stover in China, Environ. Res. Lett., 4, 044015, Mühle, J., and Prinn, R.: Australian carbon tetrachloride (CCl4 ) https://doi.org/10.1088/1748-9326/4/4/044015, 2009. emissions in a global context, Environ. Chem., 11, 77–88, Liang, Q., Newman, P. A., Daniel, J. S., Reimann, S., Hall, B. https://doi.org/10.1071/EN13171, 2014. D., Dutton, G., and Kuijpers L. J. M.: Constraining the car- Graziosi, F., Arduini, J., Bonasoni, P., Furlani, F., Giostra, U., bon tetrachloride (CCl4 ) budget using its global trend and Hermanssen, O., Lunder, C., Manning, A. J., McCulloch, A., inter-hemispheric gradient, Geophys. Res. Lett., 41, 5307–5315, O’Doherty, S. J., Reimann, S., Vollmer, M. K., Maione, M.: https://doi.org/10.1002/2014GL060754, 2014. Emissions of carbon tetrachloride (CCl4 ) from Europe, Atmos. Liang, Q. Newman, P. A., and Reimann, S. (Eds.): SPARC Re- Chem. Phys., 16, 12849–12859, https://doi.org/10.5194/acp-16- port on the Mystery of Carbon Tetrachloride, SPARC Report 12849-2016, 2016. No. 7, WCRP-13/2016, available at: http://www.sparc-climate. Guo, H., Ding, A. J., Wang, T., Simpson, I. J., Blake, D. R., Bar- org/publications/sparc-reports/sparc-report-no7 (last access: letta, B., Meinardi, S., Rowland, F. S., Saunders, S. M., Fu, T. M., July 2018), 2016. Hung, W. T., and Li, Y. S.: Source origins, modeled profiles, and Miller, B. R., Weiss, R. F., Salameh, P. K., Tanhua, T., Gre- apportionments of halogenated hydrocarbons in the greater Pearl ally, B. R., Mühle, J., and Simmonds, P. G.: Medusa: A River Delta region, southern China, J. Geophys. Res.-Atmos., sample preconcentration and GC/MS detector system for in 114, D11302, https://doi.org/10.1029/2008JD011448, 2009. situ measurements of atmospheric trace halocarbons, hydro- Hu, L., Montzka, S. A., Miller, B. R., Andrews, A. E., Miller, carbons, and sulfur compounds, Anal. Chem., 80, 1536–1545, J. B., Lehman, S. J., Sweeney, C., Miller, S., Thoning, K., https://doi.org/10.1021/ac702084k, 2008. Siso, C., Atlas, E., Blake, D., de Gouw, J. A., Gilman, J. Montzka, S. A. and Reimann S.: Ozone-Depleting Sub- B., Dutton, G., Elkins, J. W., Hall, B. D., Chen, H., Fischer, stances 1.90 (ODSs) and related chemicals, Chapter 1 in M. L., Mountain, M., Nehrkorn, T., Biraud, S. C., Moore, Scientific Assessment of Ozone Depletion: 2010, Global F., and Tans, P. P.: Continued emissions of carbon tetrachlo- Ozone Research and Monitoring Project, Report No. 52, World ride from the U.S. nearly two decades after its phase-out for Meteorological Organization, Geneva, Switzerland, 2011. dispersive uses, P. Natl. Acad. Sci. USA, 113, 2880–2885, O’Doherty, S., Simmonds, P. G., Cunnold, D. M., Wang, H. https://doi.org/10.1073/pnas.1522284113, 2016. J., Sturrock, G. A., Fraser, P. J., Ryall, D., Derwent, R. G., Kim, J., Li, S., Kim, K. R., Stohl, A., Muhle, J., Kim, S. K., Weiss, R. F., Salameh, P., Miller, B. R., and Prinn, R. G.: Park, M. K., Kang, D. J., Lee, G., Harth, C. M., Salameh, P. In situ chloroform measurements at Advanced Global At- K., and Weiss, R. F.: Regional atmospheric emissions deter- mospheric Gases Experiment atmospheric research stations mined from measurements at Jeju Island, Korea: Halogenated from 1994 to 1998, J. Geophys. Res.-Atmos., 106, 20429–20444, compounds from China, Geophys. Res. Lett., 37, L12801, https://doi.org/10.1029/2000JD900792, 2001. https://doi.org/10.1029/2010GL043263, 2010. Paatero, P. and Tapper, U.: Positive matrix factorization: A Kim, J., Li, S., Mühle, J., Stohl, A., Kim, S. K., Park, S., Park, non-negative factor model with optimal utilization of er- M. K., Weiss, R. F., Kim, K. R.: Overview of the findings from ror estimates of data values, Environmetrics, 5, 111–126, measurements of halogenated compounds at Gosan (Jeju Island, https://doi.org/10.1002/env.3170050203, 1994. Korea) quantifying emissions in East Asia, J. Integrat. Environ. Palmer P. I., Jacob, D. J., Mickley, L. J., Blake, D. R., Sci., 9, 71–80, https://doi.org/10.1080/1943815X.2012.696548, Sachse, G. W., Fuelberg, H. E., and Kiley, C. M.: East- 2012. ern Asian emissions of anthropogenic halocarbons deduced Lanz, V. A., Henne, S., Staehelin, J., Hueglin, C., Vollmer, M. from aircraft concentration data, J. Geophys. Res., 108, 4753, K., Steinbacher, M., Buchmann, B., and Reimann, S.: Statistical https://doi.org/10.1029/2003JD003591, 2003. analysis of anthropogenic non-methane VOC variability at a Eu- Poirot, R. L. and Wishinski, P. R.: Visibility, sulfate and ropean background location (Jungfraujoch, Switzerland), Atmos. air-mass history associated with the summertime aerosol www.atmos-chem-phys.net/18/11729/2018/ Atmos. Chem. Phys., 18, 11729–11738, 2018
11738              S. Park et al.: Toward resolving the budget discrepancy of ozone-depleting carbon tetrachloride (CCl4 )

   in northern Vermont, Atmos. Environ., 20, 1457–1469,                   Stohl, A., Kim, J., Li, S., O’Doherty, S., Mühle, J., Salameh,
   https://doi.org/10.1016/0004-6981(86)90018-1, 1986.                       P. K., Saito, T., Vollmer, M. K., Wan, D., Weiss, R. F.,
Reff, A., Eberly, S. I., and Bhave, P. V.: Receptor modeling of ambi-        Yao, B., Yokouchi, Y., and Zhou, L. X.: Hydrochlorofluoro-
   ent particulate matter data using positive matrix factorization: re-      carbon and hydrofluorocarbon emissions in East Asia deter-
   view of existing methods, J. Air Waste Manage. Assoc., 57, 146–           mined by inverse modeling, Atmos. Chem. Phys., 10, 3545–
   154, https://doi.org/10.1080/10473289.2007.10465319, 2007.                3560, https://doi.org/10.5194/acp-10-3545-2010, 2010.
Reimann S., Schaub, D., Stemmler, K., Folini, D., Hill, M.,               Vollmer, M. K., Zhou, L. X., Greally, B. R., Henne, S., Yao, B.,
   Hofer, P., Buchmann, B., Simmonds, P. G., Greally, B.                     Reimann, S., Stordal, F., Cunnold, D. M., Zhang, X. C., Maione,
   R., and O’Doherty, S.: Halogenated greenhouse gases at                    M., Zhang, F., Huang, J., and Simmonds, P. G., Emissions of
   the Swiss High Alpine Site of Jungfraujoch (3580 m asl):                  ozone-depleting halocarbons from China, Geophys. Res. Lett.,
   Continuous measurements and their use for regional Eu-                    36, L15823, https://doi.org/10.1029/2009GL038659, 2009.
   ropean source allocation, J. Geophys. Res., 109, D05307J,              Wan, D., Xu, J., Zhang, J., Tong, X., and Hu, J.: His-
   https://doi.org/10.1029/2003JD003923, 2004.                               torical and projected emissions of major halocar-
Rhew, R. C. and Happell, J. D.: The atmospheric par-                         bons in China, Atmos. Environ., 43, 5822–5829,
   tial lifetime of carbon tetrachloride with respect to the                 https://doi.org/10.1016/j.atmosenv.2009.07.052, 2009.
   global soil sink, Geophys. Res. Lett., 43, 2889–2895,                  Wang, C., Shao, M., Huang, D., Sihua, L., Zeng, L., Hu, M., and
   https://doi.org/10.1002/2016GL067839, 2016.                               Zhang, Q.: Estimating halocarbon emissions using measured ra-
Seibert, P., Kromp-Kolb, H., Baltensperger, U., Jost, D. T., and             tio relative to tracers in China, Atmos. Environ., 89, 816–826,
   Schwikowski, M.: Trajectory analysis of aerosol measurements              https://doi.org/10.1016/j.atmosenv.2014.03.025, 2014.
   at high Apline sites, in: Transport and transformation of pollu-       UNEP – United Nations Environment Programme: Ozone Secre-
   tants in the troposphere, edited by: Borrell, P. M., Cvitaš, T., and      tariat Data Access Centre, http://ozone.unep.org/reporting/ (last
   Seiler, W., Academic Publishing, Den Haag, 689–693, 1994.                 access: 11 February 2018), 2009.
Sherry, D., McCulloch, A., Liang, Q., Reimann, S., and Newman,            Zhang, Y. L., Guo, H., Wang, X. M., Simpson, I. J., Barletta,
   P. A.: Current sources of carbon tetrachloride in our atmosphere,         B., Blake, D. R., Meinardi, S., Rowland, F. S., Cheng, H.
   Environ. Res. Lett., 13, 024004, https://doi.org/10.1088/1748-            R., Saunders, S. M., and Lam, S. H. M.: Emission patterns
   9326/aa9c87, 2018.                                                        and spatiotemporal variations of halocarbons in the Pearl River
Stohl, A.: Trajectory statistics: A new method to establish source           Delta region, southern China, J. Geophys. Res., 115, D15309,
   receptor relationships of air pollutants and its application to the       https://doi.org/10.1029/2009JD013726, 2010.
   transport of particulate sulfate in Europe, Atmos. Environ., 30, 4,
   579–587, https://doi.org/10.1016/1352-2310(95)00314-2, 1996.

Atmos. Chem. Phys., 18, 11729–11738, 2018                                                  www.atmos-chem-phys.net/18/11729/2018/
You can also read