European Union Greenhouse Gas Reduction Potential for Heavy-Duty Vehicles - European Commission
←
→
Page content transcription
If your browser does not render page correctly, please read the page content below
European Union
Greenhouse Gas
Reduction Potential for
Heavy-Duty Vehicles

Report

Prepared for:
The International Council on Clean
   Transportation
One Post Street, Suite 2700
San Francisco, CA 94104

Date: December 23, 2011

Prepared by:
Karen Law
Michael D. Jackson
Michael Chan
TIAX LLC
20813 Stevens Creek Blvd., Suite. 250
Cupertino, California 95014
Tel 408.517.1550
Fax 408.517.1551

TIAX Reference No. D5625

Legal Disclaimer

This report was commissioned by the International Council on Clean Transportation (ICCT) on
terms specifically limiting TIAX’s liability. Our conclusions are the results of the exercise of our
best professional judgment, based in part upon materials and information provided to us by ICCT
and others.

TIAX accepts no duty of care or liability of any kind whatsoever to any third party, and no
responsibility for damages, if any, suffered by any third party as a result of decisions made, or
not made, or actions taken, or not taken, based on this document.

This report may be reproduced only in its entirety.
Acknowledgments

The authors gratefully acknowledge the guidance and support of Fanta Kamakaté, Ben Sharpe,
and Peter Mock of the International Council on Clean Transportation and Christophe
Rochefordiere, Peter Brunner, and Ian Hodgson of the European Commission.

                                             iii
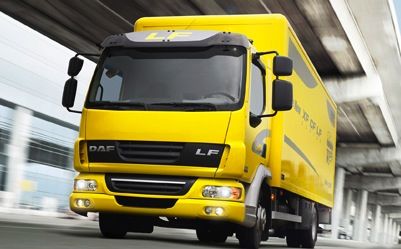
Table of Contents

Executive Summary ...................................................................................................................... ix
1.        Background ..................................................................................................................... 1-1
2.        Methodology ................................................................................................................... 2-1
3.        Assumptions.................................................................................................................... 3-1
4.        Vehicle Baselines ............................................................................................................ 4-1
5.        Fuel Efficiency Improvement Technologies ................................................................... 5-1
6.        Heavy-Duty Market Discussion ...................................................................................... 6-1
7.        Conclusions ..................................................................................................................... 7-1

                                                                      v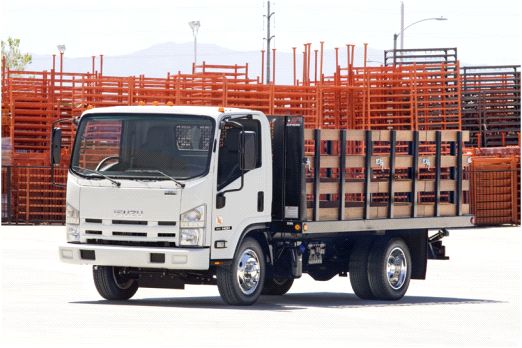
List of Figures

Figure ES-1. Potential New EU Vehicle GHG Reductions from All Technologies ...................... x
Figure 2-1. Overall Analysis Methodology .............................................................................. 2-1
Figure 2-2. EU Average Fuel Consumption ............................................................................. 2-3
Figure 5-1. Potential New EU Vehicle GHG Reductions from All Technologies ................. 5-15
Figure 5-2. Potential New EU vs. US Vehicle GHG Reductions from All Technologies...... 5-16
Figure 5-3. Potential New EU Vehicle GHG Reductions from Technologies with
            Payback within Three Years ................................................................................ 5-22
Figure 6-1. EU Fuel Consumption by Vehicle Segment .......................................................... 6-1
Figure 7-1. Comparison of GHG Reduction Analyses ............................................................. 7-2

                                                             vi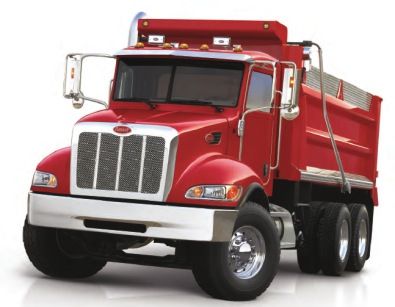
List of Tables
Table ES-1. Technologies by Vehicle Segment .......................................................................... xii
Table ES-2. Potential GHG Reductions by Segment ................................................................. xiii
Table 2-1. Baseline 2014 EU Fuel Economies ........................................................................ 2-4
Table 2-2. EU Heavy-Duty GHG Allocation by Vehicle Segment ......................................... 2-4
Table 2-3. Comparison of Key Analysis Methodologies ........................................................ 2-6
Table 4-1. Example of EU-US Tractor Differences ................................................................ 4-2
Table 4-2. Example of EU-US Trailer Differences ................................................................. 4-2
Table 4-3. Tractor-Trailer Differences in the EU vs. the US .................................................. 4-3
Table 4-4. Baseline Vehicles in the Service Segment ............................................................. 4-4
Table 4-5. Baseline Vehicles in the Urban Delivery Segment ................................................ 4-5
Table 4-6. Baseline Vehicles in the Municipal Utility Segment ............................................. 4-6
Table 4-7. Baseline Vehicles in the Regional Delivery Segment ............................................ 4-7
Table 4-8. Baseline Vehicles in the Long Haul Segment ........................................................ 4-8
Table 4-9. Baseline Vehicles in the Construction Segment .................................................... 4-9
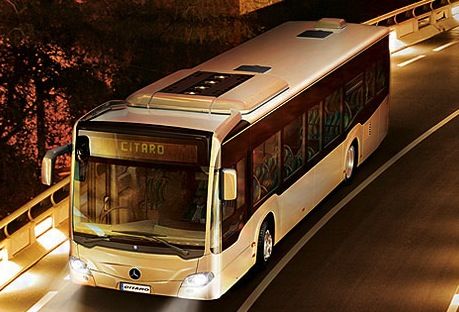
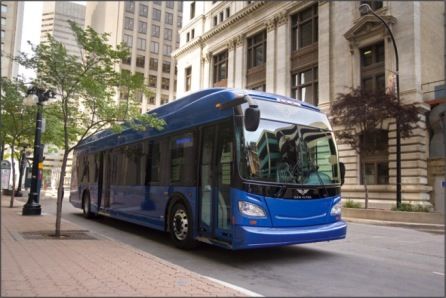
Table 4-10. Baseline Vehicles in the Bus Segment ................................................................. 4-10
Table 4-11. Baseline Vehicles in the Coach Segment ............................................................. 4-11
Table 5-1. High-Level Comparison of TIAX and AEA-Ricardo Technologies
Considered .............................................................................................................. 5-2
Table 5-2. Technology Options in the Service Segment ......................................................... 5-3
Table 5-3. Technology Options in the Urban Delivery Segment ............................................ 5-4
Table 5-4. Technology Options in the Municipal Utility Segment ......................................... 5-5
Table 5-5. Technology Options in the Regional Delivery Segment ........................................ 5-6
Table 5-6. Technology Options in the Long Haul Segment .................................................... 5-8
Table 5-7. Technology Options in the Construction Segment .............................................. 5-10
Table 5-8. Technology Options in the Bus Segment ............................................................. 5-11
Table 5-9. Technology Options in the Coach Segment ......................................................... 5-12
Table 5-10. TIAX Technology Costs ...................................................................................... 5-17
Table 5-11. AEA-Ricardo Technology Costs .......................................................................... 5-18
Table 5-12. TIAX Technology Payback Periods ..................................................................... 5-19
Table 5-13. AEA-Ricardo Technology Payback Periods ........................................................ 5-20
vii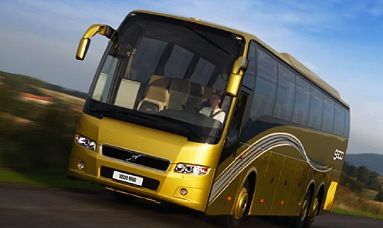
Table 6-1.   Technology Cost Effectiveness .............................................................................. 6-2
Table 6-2.   HDV Fleet Turnover by 2030 ................................................................................ 6-3
Table 6-3.   Potential GHG Reductions by Segment ................................................................. 6-4

                                                       viii
Executive Summary

To support development of a European Union (EU) strategy for reducing greenhouse gas (GHG)
emissions from the heavy-duty vehicle (HDV) sector, the report entitled “Reduction and Testing
of Greenhouse Gas (GHG) Emissions from Heavy Duty Vehicles – Lot 1: Strategy” was
prepared for the European Commission by AEA and Ricardo.1 The report itemized the potential
fuel efficiency improvement technologies that may be applied to various HDV segments and
assessed their fuel consumption and CO2 benefits and their costs. Technologies were applied, as
appropriate, to eight vehicle segments: Service, Urban Delivery, Municipal Utility, Regional
Delivery, Long Haul, Construction, Bus, and Coach. The GHG reductions in each segment were
calculated based on the benefits offered by applying the technologies to today’s vehicles.
Through scenario projections, a major conclusion of the report was that total GHG emissions
from the HDV fleet are unlikely to be reduced significantly below 2010 levels by 2030.2

The goal of this TIAX study is to examine the data and assumptions used by AEA-Ricardo to
derive conclusions regarding the GHG reduction potential of HDVs in the EU. This analysis is
based on a comparison between HDV technologies offered in the United States (US) and those
offered in the EU. Many of the vehicle and engine manufacturers that sell products in the US are
EU-based, and thus technologies are expected to be similar. Previous studies conducted by the
National Research Council (NRC)3 and TIAX on behalf of the National Academy of Sciences
(NAS)4 suggested that the GHG reduction potential for the US HDV sector may be significant.
These studies were informed by interviews with and data from the major US HDV and engine
manufacturers, many of whom serve the EU markets as well, and this analysis builds from the
data collected in the NRC and TIAX/NAS studies. By methodically comparing the data and
assumptions between the EU and the US, the objective is to determine whether conclusions for
the US HDV sector may apply to the EU and to quantify the potential GHG reductions that may
be achievable.

This assessment draws from the data gathered for the AEA-Ricardo study and supplements the
analysis with additional input gathered from original equipment manufacturers (OEMs) by NRC
and TIAX. The eight vehicle segments selected by AEA-Ricardo to represent the HDV market in
the EU have been closely matched to vehicle segments in the US according to vehicle and engine
characteristics and applications. For each segment, fuel efficiency improvement technologies are
considered where appropriate for that segment. The technologies fall into seven broad categories:

1
    Hill, N., S. Finnegan, J. Norris, C. Brannigan, D. Wynn, H. Baker, I. Skinner. “Reduction and Testing of Greenhouse Gas (GHG)
    Emissions from Heavy Duty Vehicles – Lot 1: Strategy.” Prepared by AEA and Ricardo for European Commission – DG Climate
    Action, DG ENV. 070307/2009/548572/SER/C3. February 22, 2011.
2
    AEA-Ricardo projected that the baseline HDV population in the EU would grow from 7.8 million vehicles in 2010 to 10.1 million
    vehicles in 2030, corresponding to GHG levels of 275 million tonnes in 2010 and 349 million tonnes in 2030.
3
    National Research Council. “Technologies and Approaches to Reducing the Fuel Consumption of Medium- and Heavy-Duty
    Vehicles.” http://www.nap.edu/catalog/12845.html. 2010.
4
    Kromer, M., W. Bockholt, M. Jackson. “Assessment of Fuel Economy Technologies for Medium- and Heavy-Duty Vehicles.”
    Prepared by TIAX LLC for National Academy of Sciences. November 19, 2009.

                                                                 ix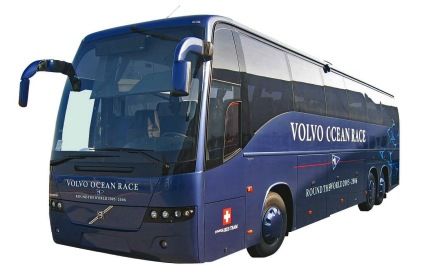
•   Aerodynamics
   •   Lightweighting
   •   Tires and wheels
   •   Transmission and driveline
   •   Engine efficiency
   •   Hybridization
   •   Management

This analysis finds that across the eight vehicle segments, potential vehicle-level GHG benefits
from all technologies available in the 2015 to 2020 timeframe (Figure ES-1) range from 30 to
52 percent and are slightly higher than the EU benefits reported by AEA-Ricardo and lower than
the US benefits reported by NRC. In general, the higher EU benefits of this study are a result of
the greater benefits from hybridization, engine efficiency, and transmission and driveline
improvements that were estimated in this study.

        (A-R: AEA-Ricardo)
Figure ES-1. Potential New EU Vehicle GHG Reductions from All Technologies

The relative shares of fuel consumption by each vehicle segment suggest that it may be more
effective to target fuel efficiency improvement technologies in some segments than others.
Technologies for the Long Haul segment, many of which are applicable to similar vehicles in the
Regional Delivery segment, may offer the greatest impact. In addition, the Service, Bus, and
Coach segments are also attractive because they offer mass-market or relatively uniform vehicles
across the segment that can benefit from the same technologies. Conversely, technologies for the

                                              x
Urban Delivery, Municipal Utility, and Construction segments may offer the least impact
because these segments are highly fragmented, with a variety of vehicle types and
configurations. Accordingly, EU strategies aimed at reducing overall GHG emissions from the
heavy-duty sector may benefit from specifically targeting the high fuel consumption, uniform
vehicles of the Long Haul, Regional Delivery, Service, Bus, and Coach segments and regarding
the remaining segments as a single group. A similar approach has already been taken in the US
heavy-duty GHG regulation.
The specific technologies considered for each vehicle segment in this analysis are grouped by
category in Table ES-1. Across the vehicle segments, among the most cost effective5
technologies are low rolling resistance tires, low rolling resistance wide-base tires, transmission
friction reduction, and predictive cruise control. Among the least cost effective technologies are
automatic tire inflation and material substitution for lightweighting.
Translating vehicle-level benefits to the segment level, Table ES-2 shows the absolute GHG
benefits of applying the technologies across each population of vehicles. AEA-Ricardo estimated
that 7.8 million heavy-duty vehicles were on the road in the EU in 2010 and projected that this
number would grow to 10.1 million by 2030. After accounting for the growth in vehicle
population, applying all applicable fuel-saving technologies to all new HDVs starting in 2020
has the potential to reduce 2030 GHG emissions to 28 percent below 2030 BAU levels.
This assessment provides total potential GHG benefits from a full spectrum of options for the
heavy-duty sector, and the determination of which technologies and packages will be applied to
achieve what magnitude of benefits is left to policymakers and the marketplace. Adoption of
these technologies will be a function of regulatory requirements (e.g., vehicle emissions
standards, fuel economy standards, and incentives) and vehicle owner economics, and will also
be driven by additional factors such as end user acceptance and driver retention. In the US,
mandatory heavy-duty fuel consumption reductions of up to 23 percent by 2017 are moving
OEMs to adopt many of the technologies described above, including aerodynamic
improvements, engine friction reduction, advanced fuel injection, advanced turbocharging,
parasitic loss reduction, waste heat recovery, lightweighting, low rolling resistance tires, and idle
reduction.6,7 These technologies will be options for improving HDV efficiency in the EU as well.
5
Cost effectiveness as defined by total lifetime GHG reduction divided by initial technology cost in 2010€
6
Reiskin, J.S. “OEMs Detail Design Innovations to Meet New Greenhouse Rules.” Transport Topics, pg. 5 and 28. August 22,
2011.
7
Galligan, J. “The Push for Mileage.” Light & Medium Truck, pg. 16-18. September 2011.
xiTable ES-1. Technologies by Vehicle Segment
Vehicle Segment
Construction
Long Haul
Municipal
Regional
Delivery
Delivery
Service
Coach
Urban
Utility
Bus
Technology
Aft box taper
Boat tail
Box skirts
Cab side extension or cab/box
Aerodynamics gap fairings
Full gap fairing
Full skirts
Roof deflector
Streamlining
Lightweighting Material substitution
Automatic tire inflation on
vehicle/tractor
Tires and Automatic tire inflation on trailer
Wheels Low rolling resistance tires
Low rolling resistance wide-
base single tires
Aggressive shift logic and early
Transmission lockup
and Driveline Increased transmission gears
Transmission friction reduction
Engine
Improved diesel engine
Efficiency
Dual-mode hybrid
Parallel hybrid
Hybridization
Parallel hydraulic hybrid
Series hybrid
Predictive cruise control
Management Route management
Training and feedback
xiiTable ES-2. Potential GHG Reductions by Segment
2010* 2030, Projected* 2030 Emissions 2030 Emissions
Reduction, Relative to 2030
CO2e BAU CO2e Assuming All BAU Levels,
Population Emissions Population Emissions Applicable Assuming All
Vehicle (million (million (million (million Technologies Applicable
Segment vehicles) tonnes) vehicles) tonnes) (million tonnes) Technologies (%)
Service 1.90 35 2.60 48 11 76%
Urban
0.45 12 0.55 15 4 71%
Delivery
Municipal
0.40 15 0.60 23 5 79%
Utility
Regional
1.20 40 1.75 58 15 74%
Delivery
Long Haul 2.00 100 2.60 130 39 70%
Construction 1.00 30 1.25 38 12 67%
Bus 0.45 25 0.44 24 6 75%
Coach 0.40 18 0.30 14 3 75%
All 72%
7.80 275 10.09 349 96
Segments (28% reduction)
BAU: business as usual, using baseline vehicle technologies and assuming no underlying changes in fuel economy over time
* Population numbers and projections for each EU vehicle segment are derived from AEA-Ricardo’s report. All CO2e levels are given
as well-to-wheel emissions and are derived from AEA-Ricardo’s emissions allocations as described in Section 3: Methodology.
As in the US, the market adoption of the various fuel efficiency improvement technologies in the
EU will be influenced by policies and economics. Policies—including fuel economy regulations,
low carbon fuel standards, financial incentives, and public procurement mandates—will
determine the fuel efficiency and carbon intensity of heavy-duty transportation in the EU.
Economics for vehicle owners in the form of payback through fuel savings will be one of the
significant factors that dictate the viability and market demand for these technologies. As the EU
considers a path of GHG reductions from the HDV sector, the technologies highlighted in this
assessment may enable significant benefits to be achieved.
xiii1. Background
To support development of a European Union (EU) strategy for reducing greenhouse gas (GHG)
emissions from the heavy-duty vehicle (HDV) sector, the report entitled “Reduction and Testing
of Greenhouse Gas (GHG) Emissions from Heavy Duty Vehicles – Lot 1: Strategy” was
prepared for the European Commission by AEA and Ricardo.8 The report itemized the potential
fuel efficiency improvement technologies that may be applied to various HDV segments and
assessed their fuel consumption and CO2 benefits and their costs. Based on these benefits and
costs, the report created two scenarios: a “Cost Effective” scenario, where technologies with a
payback of three years or fewer are adopted by the HDV market over time, and a “Challenging”
scenario, where technologies likely to be commercialized between 2010 and 2030 are adopted
over time regardless of payback periods. Technologies were applied, as appropriate, to eight
vehicle segments: Service, Urban Delivery, Municipal Utility, Regional Delivery, Long Haul,
Construction, Bus, and Coach. The GHG reductions in each segment were calculated based on
the benefits offered by applying the technologies to today’s vehicles. Through scenario
projections of future vehicle populations, a major conclusion of the report was that GHG
emissions from HDVs were unlikely to be reduced significantly below 2010 levels by 2030. This
conclusion, however, was based on two factors. First, the methodology for estimating GHG
emissions relied on specific assumptions regarding market uptake for each technology, which in
effect dictated the GHG emissions achieved by 2030, without allowing for potential legislation
that would require technologies to achieve certain GHG standards. Second, the technologies
included in the “Cost Effective” scenario projection did not appear to be consistent with the
stated methodology of including only technologies offering payback periods of three years or
fewer, thereby giving GHG emissions results that do not clearly correspond to the available
technologies. (See Section 3: Assumptions for more details).
The goal of this TIAX study is to examine the data and assumptions used by AEA-Ricardo to
derive conclusions regarding the GHG reduction potential of HDVs in the EU. This analysis is
based on a comparison between HDV technologies offered in the United States (US) and those
offered in the EU. Many of the vehicle and engine manufacturers that sell products in the US are
EU-based, and thus technologies are expected to be similar. Previous studies conducted by the
National Research Council (NRC)9 and TIAX on behalf of the National Academy of Sciences
(NAS)10 suggested that the GHG reduction potential for the US HDV sector may be significant.
These studies were informed by interviews with and data from the major US HDV and engine
manufacturers, many of whom serve the EU markets as well, and this analysis builds from the
data collected in the NRC and TIAX/NAS studies. By methodically comparing the data and
assumptions between the EU and the US, the objective is to determine whether conclusions for
8
Hill, N., S. Finnegan, J. Norris, C. Brannigan, D. Wynn, H. Baker, I. Skinner. “Reduction and Testing of Greenhouse Gas (GHG)
Emissions from Heavy Duty Vehicles – Lot 1: Strategy.” Prepared by AEA and Ricardo for European Commission – DG Climate
Action, DG ENV. 070307/2009/548572/SER/C3. February 22, 2011.
9
National Research Council. “Technologies and Approaches to Reducing the Fuel Consumption of Medium- and Heavy-Duty
Vehicles.” http://www.nap.edu/catalog/12845.html. 2010.
10
Kromer, M., W. Bockholt, M. Jackson. “Assessment of Fuel Economy Technologies for Medium- and Heavy-Duty Vehicles.”
Prepared by TIAX LLC for National Academy of Sciences. November 19, 2009.
1-1the US HDV sector may apply to the EU and to quantify the potential GHG reductions that may
be achievable.
Between the EU and the US, there are several key differences in the HDV market that are
considered in this analysis and reflected in the vehicle baselines and applicable technologies. In
Europe, vehicle length restrictions generally pertain to the entire length of the vehicle, rather than
only the trailer as in the US As a result, the cab-over-engine design is the dominant configuration
for tractors in the EU, while the long-nosed configuration is employed in the US The geometry
of the tractor affects which aerodynamic devices are applicable to the vehicles, and many of the
devices considered for US vehicles by the NRC study do not apply to EU vehicles, especially
since many of them (e.g., cab skirts) have already been integrated into EU vehicle designs.
Furthermore, with the exception of vehicles in the Coach segment, EU vehicles are governed
with lower speed limits than in the US Because vehicle drag is related to the cube of the
vehicle’s speed and rolling resistance is directly related to the vehicle’s speed, the lower speed
limit for EU vehicles may lead to lower baseline fuel consumption and higher fuel economy than
for US vehicles. However, fuel efficiency is also determined by other factors, such as vehicle
weight and duty cycles, and thus conclusions about how vehicles in the two regions compare in
terms of fuel efficiency cannot be made unless the vehicles are comparable in such respects.
This report begins with a discussion of the methodology used by TIAX to evaluate potential
GHG reductions in the heavy-duty sector, followed by the key assumptions on which this
evaluation is based. Next, the vehicle baselines for the eight segments are described in terms of
their weights, engine sizes, transmissions, emissions standards, and fuel consumption. Fuel
efficiency improvement technologies are then applied to these baseline vehicles, and their fuel
consumption benefits and costs are quantified. Following a discussion of heavy-duty market
dynamics and technology implications, this report concludes with summary of the outlook for
GHG reductions from HDVs in the EU.
1-22. Methodology
At a high level, the methodology for this analysis follows the four major steps shown in
Figure 2-1. Drawing from AEA-Ricardo’s expertise and familiarity with the EU heavy-duty
market, this analysis examines in detail the assumptions, costs, and benefits of various fuel
efficiency improvement technologies. These technologies are applied to representative vehicles
within distinct vehicle segments within the market to determine the total potential GHG benefits
achievable for HDVs.
Review AEA-Ricardo analysis assumptions
Establish EU vehicle segments and baseline
vehicle characteristics
Establish fuel efficiency improvement
technologies applicable to EU segments
Calculate technology cost effectiveness,
payback periods, and potential GHG impacts
on heavy-duty vehicles
Figure 2-1. Overall Analysis Methodology
This assessment draws from the data gathered for the AEA-Ricardo study and supplements the
analysis with additional input gathered from original equipment manufacturers (OEMs) by NRC
and TIAX/NAS in the aforementioned studies.11,12 Representative EU vehicles in the eight HDV
segments selected by AEA-Ricardo have been closely matched to comparable vehicles in the US
according to vehicle and engine characteristics and applications. For each representative vehicle,
fuel efficiency improvement technologies are considered where appropriate vehicle. The
technologies fall into seven broad categories:
• Aerodynamics
• Lightweighting
• Tires and wheels
• Transmission and driveline
11
National Research Council. “Technologies and Approaches to Reducing the Fuel Consumption of Medium- and Heavy-Duty
Vehicles.” http://www.nap.edu/catalog/12845.html. 2010.
12
Kromer, M., W. Bockholt, M. Jackson. “Assessment of Fuel Economy Technologies for Medium- and Heavy-Duty Vehicles.”
Prepared by TIAX LLC for National Academy of Sciences. November 19, 2009.
2-1• Engine efficiency
• Hybridization
• Management
This analysis relies on GHG reduction benefits and technology costs13 determined by NRC and
TIAX/NAS on the basis of OEM input. The technologies evaluated in this analysis are those that
improve the fuel economy of the vehicles and thus implicitly consider only tailpipe emissions of
GHGs. As such, vehicles that replace diesel fuel with alternative fuels (e.g., natural gas,
electricity) are omitted from the combined technologies packages, as the benefits offered by
these fuels contain an upstream component (i.e., in the production and distribution of the fuels)
that cannot be directly compared the tailpipe emissions benefits of the other technologies. The
potential GHG benefits of alternative fuels are discussed in Section 6: Heavy-Duty Market
Discussion.
This assessment of the potential GHG reductions for HDVs in the EU begins by describing the
baseline vehicles chosen to represent the heavy-duty sector and confirming the similarity of US
vehicles to EU vehicles. The baseline vehicles are characterized by gross vehicle weight rating
(GVWR), engine size and specifications,14 transmission type, emissions control, aerodynamics,
fuel economy, annual activity, and average GHG emissions.15 The fuel consumption benefits of
individual technologies for each representative vehicle are combined to estimate the maximum
technically achievable GHG benefits for that segment. A goal of this analysis is to present these
benefits without imposing economic or policy thresholds or speculating on market acceptance or
penetration, allowing policymakers to make these determinations. The GHG benefits, first
expressed as tailpipe emissions reduction percentages, are applied to baseline vehicles to derive
per-vehicle benefits in terms of actual reductions in CO2 equivalents.
Because the ultimate objective is to evaluate future GHG reduction opportunities, this
assessment assumes model year 2014 vehicles meeting Euro VI emissions standards as the
baseline, including any fuel efficiency improvement technologies that are likely to have already
been applied by that time. Section 4: Vehicle Baselines describes in detail the technologies that
are assumed to be incorporated as standard features in the 2014 vehicles. This study differs from
the AEA-Ricardo study in the basic assumption regarding the effect on fuel consumption of
moving to Euro VI standards. The AEA-Ricardo study reported that a 3 percent penalty would
result from the integration of diesel particulate filter (DPF) technology into emissions control
systems in order to meet Euro VI emissions standards.16 (Euro V standards are currently being
met primarily with selective catalytic reduction (SCR) systems.) AEA-Ricardo assumed that
active regeneration of the DPF would be needed in Euro VI configurations; however, the US
13
Costs presented in this report are given in 2010 euros. Costs originally given in US dollars are converted to 2010 euros using a
conversion rate of 2010€0.75 per 2010$1.00.
14
Including details regarding cylinder pressure, fuel injection, turbochargers, controls, and peak thermal efficiencies
15
GHG emissions from today’s vehicles have been estimated by AEA-Ricardo using a top-down approach that allocates total CO2
emissions from road transport to individual vehicle segments. See Figure 4-7 of Hill, N., S. Finnegan, J. Norris, C. Brannigan, D.
Wynn, H. Baker, I. Skinner, “Reduction and Testing of Greenhouse Gas (GHG) Emissions from Heavy Duty Vehicles – Lot 1:
Strategy,” prepared by AEA and Ricardo for European Commission – DG Climate Action, DG ENV,
070307/2009/548572/SER/C3, February 22, 2011.
16
See page 117 of Hill, N., S. Finnegan, J. Norris, C. Brannigan, D. Wynn, H. Baker, I. Skinner, “Reduction and Testing of
Greenhouse Gas (GHG) Emissions from Heavy Duty Vehicles – Lot 1: Strategy,” prepared by AEA and Ricardo for European
Commission – DG Climate Action, DG ENV, 070307/2009/548572/SER/C3, February 22, 2011.
2-2experience with 2010 standards using the same combination of aftertreatment technologies has
improved fuel consumption from the 2007 configurations because active regeneration has been
substantially reduced, if not eliminated. For US 2010 systems, engine-out NOx was increased,
and engine-out particulate was reduced. This reduces the particulate buildup on the DPF and,
under most operating conditions, the need for active regeneration. Although the DPF will add
some additional back pressure, this analysis assumes the manufacturers will offset this possible
increase in fuel consumption with better system calibration, due in part to the learning from the
experience with US 2010 systems. Historical trends in average fuel consumption for EU vehicles
(Figure 2-2) suggest that this assumption may be reasonable. This analysis therefore assumes that
a regeneration penalty would not result. Some manufacturers concur with this assessment of fuel
consumption penalties, stating that Euro VI models may offer the same fuel consumption as Euro
V models.17 As a conservative assumption, the following analysis assumes 0 percent change in
fuel consumption for Euro VI vehicles compared to today’s vehicles. The fuel economy values
for each vehicle segment, derived from the AEA-Ricardo analysis, are summarized in Table 2-1.
Note that these fuel economies are segment averages and thus are not necessarily the fuel
economies of specific vehicles in the segments.
At present, no official GHG accounting tool or model for the EU is widely used, and thus this
analysis relies on the AEA-Ricardo inventory of CO2 emissions from each vehicle segment. The
emissions were derived from an allocation of total road transport emissions based on fuel
consumption and vehicle characteristics, and the allocations are presented in Table 2-2.
US Fleet
(6.0 - 6.5
mi/gal)
Reference: Schuckert, M. “CO2 Footprint for Heavy Duty Vehicles.” Daimler Trucks. ISPRA. April 19, 2010.
Figure 2-2. EU Average Long Haul Fuel Consumption
17
Scania. “Pressroom: Scania Euro 6.” http://www.scania.com/media/calendar/2011/scania-euro-6/pressroom-scania-euro-6.aspx.
March 31, 2011.
2-3Table 2-1. Baseline 2014 EU Fuel Economies
Vehicle Segment EU Fuel Economy
mi/gal 14.7
Service
L/100 km 16.0
mi/gal 11.2
Urban Delivery
L/100 km 21.0
mi/gal 4.3
Municipal Utility
L/100 km 55.2
mi/gal 9.3
Regional Delivery
L/100 km 25.3
mi/gal 7.7
Long Haul
L/100 km 30.6
mi/gal 8.8
Construction
L/100 km 26.8
mi/gal 6.5
Bus
L/100 km 36.0
mi/gal 8.5
Coach
L/100 km 27.7
Reference: Hill, N., S. Finnegan, J. Norris, C. Brannigan, D. Wynn, H. Baker, I. Skinner.
“Reduction and Testing of Greenhouse Gas (GHG) Emissions from Heavy Duty Vehicles –
Lot 1: Strategy.” Prepared by AEA and Ricardo for European Commission – DG Climate
Action, DG ENV. 070307/2009/548572/SER/C3. February 22, 2011.
Table 2-2. EU Heavy-Duty GHG Allocation by Vehicle Segment
Vehicle Segment GHG Emissions by Segment (%)
Service 13
Urban Delivery 4
Municipal Utility 5
Regional Delivery 15
Long Haul 36
Construction 11
Bus 9
Coach 7
Reference: Hill, N., S. Finnegan, J. Norris, C. Brannigan, D. Wynn, H. Baker, I. Skinner.
“Reduction and Testing of Greenhouse Gas (GHG) Emissions from Heavy Duty
Vehicles – Lot 1: Strategy.” Prepared by AEA and Ricardo for European Commission –
DG Climate Action, DG ENV. 070307/2009/548572/SER/C3. February 22, 2011.
In addition to the achievable GHG reductions per vehicle, this analysis further explores the
potential benefits of the fuel efficiency improvement technologies in terms of cost effectiveness,
which is defined as the GHG benefit (expressed as lifetime kilograms of CO2 reduced) divided
2-4by the capital cost in 2010€. This metric can be used from a policy perspective to compare
technology options across vehicles according to the ultimate goal of reducing carbon emissions.
Another useful metric is the payback period, defined as the period of time until fuel savings are
equal to the initial cost of the fuel efficiency improvement technology.
For purposes of putting the per-vehicle benefits into the fleet-wide context, this analysis applies
the per-vehicle GHG reductions to the vehicle populations projected by AEA-Ricardo18 to offer a
point of reference for the magnitude of impacts achievable. The per-vehicle reductions by
segment are multiplied by the projected number of vehicles in each segment to derive the total
HDV fleet reductions. As with the AEA-Ricardo study, the fleet-wide GHG reductions are
assessed for the year 2030. The adoption of vehicle technologies will be a gradual process, and
this approach assumes that the advanced technologies are adopted as packages on all new
vehicles beginning in the year 2020 (corresponding to the time frame in which the technologies
considered here become available). The phase-in of these technologies packages will occur as the
HDV fleet turns over, such that as each vehicle reaches the end of its lifetime, it is replaced with
a new vehicle that incorporates all technologies applicable to its segment.19 As the HDV fleet
turns over, the relative fraction of vehicles with these advanced technology packages increases.
While heavy-duty vehicles often have lifetimes of 20 or more years, the majority of VKT
typically occurs in the early years of the vehicle’s life. To reflect this decline in activity over
vehicle lifetime, assumptions were made about the fraction of total vehicle activity in 2030 that
would come from vehicles having the advanced technology packages (i.e. those vehicles sold in
2020 or later). See Table 6-2 for more details.
The baseline vehicles in this study differ most from those of the AEA-Ricardo study in that 2014
vehicles meeting Euro VI emissions standards are assumed (in contrast to 2010 vehicles meeting
Euro V emissions standards). The technologies differ in that some automation of transmissions is
assumed in this study, whereas none was assumed in the AEA-Ricardo study. Where the AEA-
Ricardo study did not specifically list the segment-specific technologies incorporated into
baseline vehicles, the table above infers the baseline technologies by examining which
technologies are considered as options by AEA-Ricardo. The effects of these differences
between the two studies are discussed in greater detail in the following sections.
Unlike the AEA-Ricardo analysis, this analysis assumes no inherent fuel consumption changes
over time, i.e., all fuel consumption changes are the direct results of specific technologies applied
in the analysis. Because the baseline vehicles are assumed to be 2014 vehicles meeting Euro VI
standards, fuel economy improvements between 2010 (the year of AEA-Ricardo’s current GHG
levels) and 2014 (the year of baseline vehicles in this analysis) are accounted for by assuming the
adoption of certain aerodynamics and transmission technologies (itemized by segment in
Section 5: Fuel Efficiency Improvement Technologies). For comparison, Table 2-3 summarizes
the key differences in analysis methodology between this study and the AEA-Ricardo study,
including estimates of benefits gained from technologies assumed to be already in place by 2014.
18
Populations for each of the eight vehicle segments have been projected to 2030. See Figure 4-7 of Hill, N., S. Finnegan, J.
Norris, C. Brannigan, D. Wynn, H. Baker, I. Skinner, “Reduction and Testing of Greenhouse Gas (GHG) Emissions from Heavy
Duty Vehicles – Lot 1: Strategy,” prepared by AEA and Ricardo for European Commission – DG Climate Action, DG ENV,
070307/2009/548572/SER/C3, February 22, 2011.
19
Recognizing that this approach assumes that technologies can be applied to all vehicles within the segment, which may or may
not be true, given that each segment is composed of multiple vehicle types
2-5Table 2-3. Comparison of Key Analysis Methodologies
TIAX AEA-Ricardo
• 2014 vehicles meeting Euro VI standards • 2010 vehicles meeting Euro V standards
(EGR+DPF+SCR) (SCR)
• No aerodynamic trailers or fairings • No aerodynamic trailers or fairings
• Regular rolling resistance tires, no wide-base • Regular rolling resistance tires, no wide-
Baseline single tires base single tires
vehicles • No engine turbocompound or waste heat • No engine turbocompound or waste heat
recovery, engine specifications corresponding to recovery, other engine specifications
those of US 2010 engines* unknown
• No hybridization • No hybridization
• No predictive cruise control • No predictive cruise control
Additional segment-specific technologies incorporated:
• Automatic transmission (0 to 5% fuel consumption • Manual transmission
Service
benefit over manual transmission)
• Manual transmission • Manual transmission
Urban
Delivery • Integrated air dam, cab side edge turning vanes • Integrated air dam, cab side edge turning
vanes
Municipal • Automatic transmission (0 to 5% fuel consumption • Manual transmission
Utility benefit over manual transmission)
• Automated manual transmission (4 to 8% fuel • Manual transmission
consumption benefit over manual transmission) • Aerodynamic tractor with integrated air
Regional
Delivery • Aerodynamic tractor with integrated air dam, cab dam, cab side edge turning vanes, roof
side edge turning vanes, roof and side air and side air deflector
deflector
• Automated manual transmission (4 to 8% fuel • Manual transmission
consumption benefit over manual transmission) • Aerodynamic tractor with integrated air
Long Haul • Aerodynamic tractor with integrated air dam, cab dam, cab side edge turning vanes, roof
side edge turning vanes, roof and side air and side air deflector
deflector (3 to 4% improvement over AEA-Ricardo • Engine specifications unknown
aerodynamic tractor)
Construction • Manual transmission • Manual transmission
Bus • Automatic transmission (0 to 5% fuel consumption • Manual transmission
benefit over manual transmission)
• Automated manual transmission (4 to 8% fuel • Manual transmission
Coach
consumption benefit over manual transmission)
• No underlying fuel economy changes over time • Natural powertrain improvements ranging
(i.e., all fuel economy increases result directly from 0 to 0.5% from previous year
Fuel economy from application of specific technologies) • Fuel consumption improvements ranging
projections from 0 to 0.5% from previous year
• Fuel consumption penalties ranging from
0 to 3% from previous year
• Application of technology packages to all new • Application of individual technologies to
vehicles starting in 2020 vehicles at specified uptake rates
Market uptake • No uptake percentages specified, uptake in 2030 • Uptake percentages by year for new
model depends on vehicle turnover within each segment, vehicles and HDV fleet, ranging from 0 to
as defined by average vehicle lifetime 80% in 2010 and 0 to 100% in 2030
across segments
*Engine specifications in this study correspond to those of US 2010 engines, as follows: 6 to 9 L engines with 190 to 200 bar cylinder
pressure, 2,000 bar common rail fuel injection, multiple injections per cycle electrically actuated variable geometry turbocharger, open-
loop emission controls, and peak thermal efficiency 42 to 43%; 11 to 13 L engines with 210 to 220 bar cylinder pressure, 2,200 to
2,400 bar common rail fuel injection, rate shaping, multiple injections per cycle, electrically actuated variable geometry turbocharger,
open-loop controls, and peak thermal efficiency 43 to 44%.
2-63. Assumptions
The following is a list of the general assumptions made in this analysis. Some assumptions are
made to reconcile information presented in the AEA-Ricardo report with the data inputs in this
analysis, and others are made to provide a reference point for potential GHG benefits. Additional
detailed assumptions regarding vehicle baselines and fuel efficiency improvement technologies
are presented in Section 4: Vehicle Baselines and Section 5: Fuel Efficiency Improvement
Technologies.
Assumptions:
• The fuel efficiency improvement technologies and their associated costs offered by
manufacturers in US are similar to those offered by manufacturers in the EU.20
• Vehicles baselines reflect 2014 technologies meeting Euro VI emissions standards.
• The fuel efficiency improvement technologies considered are expected to be available in
the 2015 to 2020 timeframe. While they may not yet be available today, interviews
conducted with OEMs in the NRC and TIAX/NAS studies indicate that these
technologies are likely to be available with the stated fuel efficiency benefits and at the
stated costs in the near term.
• The total combined benefit of individual vehicle fuel efficiency improvement
technologies is calculated as follows:21
FCB1 FCB2 FCBi
Combined fuel consumption benefit (%) = 100 × (1 − (1 − ) × (1 − ) × ... × (1 − ))
100 100 100
where FCBi is the percent fuel consumption benefit of the ith technology. The combined
benefit is then applied to the representative vehicle, which is defined by unique
characteristics and duty cycle.
• Costs presented in this report are given in 2010 euros. Costs originally given in 2009 US
dollars are converted to 2010 euros using a conversion rate of 2010$1.02 per 2009$1.00
and 2010€0.75 per 2010$1.00.
• The GHG emissions presented in Figure 4-7 of the AEA-Ricardo report are assumed to
be in units of kilotonnes of CO2 equivalents rather than tonnes.
20
Note that many EU manufacturers also offer similar products in the US These manufacturers include Daimler Trucks, DAF
(Kenworth and Peterbilt as part of PACCAR in the US), and Volvo.
21
See note under Table S-1 of National Research Council, “Technologies and Approaches to Reducing the Fuel Consumption of
Medium- and Heavy-Duty Vehicles,” http://www.nap.edu/catalog/12845.html, 2010.
3-1• As mentioned in Section 1: Background, the technologies included in the “Cost
Effective” scenario projection of the AEA-Ricardo study did not appear to be consistent
with the stated methodology of including only technologies offering payback periods of
three years or fewer. For example, the technologies that define the Coach segment in the
“Cost Effective” scenario in Figure 4-9 of the AEA-Ricardo report are presented as:
automated manual transmission, full hybrid, flywheel hybrid, stop/start system, low
rolling resistance tires, automatic tire pressure adjustment, and predictive cruise control.
However, the payback periods for these seven technologies are listed in Table 4.23 as:
16.2, 16.7, 3.2, 1.5, 0.8, 40.9, and 1.9 years, respectively. As defined, the “Cost
Effective” scenario should only incorporate technologies that offer payback within three
years, and hence, the automated manual transmission, full hybrid, and automatic tire
pressure adjustment technologies should not have been included in the Coach segment for
this scenario, whereas single wide tires, spray reduction mud flaps, lightweighting, and
controllable air compressor should have been included.
For comparison with the results of this analysis, the AEA-Ricardo “Cost Effective”
scenario, nominally using technologies with payback periods of three years or fewer, is
assumed to be defined by the technologies listed in Table 4.23 rather than those listed in
Figure 4-9.
• The representative vehicle for the Construction segment is assumed to be a dump truck.
The details of the potential benefits for the Construction segment are not explicitly
described in the AEA-Ricardo report.
3-24. Vehicle Baselines
The tables in this section compare vehicle characteristics between the EU and the US in eight
heavy-duty segments and serve two purposes: to establish the similarity between vehicles in the
two regions and to describe the baseline vehicle configurations to which technologies are added
in Section 5: Fuel Efficiency Improvement Technologies. In some cases, multiple configurations
may be offered by manufacturers, and the assumed predominant configuration is listed. The
baseline tables list the GVWRs, engine displacements, engines, transmissions, emissions
controls, and vehicle configurations assumed to be representative of each vehicle segment.
Annual activity, fuel economy, and fuel consumption for the EU are derived from AEA-
Ricardo’s study as average characteristics across the EU-27 member states, and those for the US
are derived from NRC’s study as ranges across vehicles within each segment.
The EU vehicles are based on the characteristics presented in the AEA-Ricardo study, and the
US vehicles are matched to those characteristics and cross-checked with the vehicles considered
in the NRC study. Examples of representative vehicles within each segment are provided as well.
Because this analysis is aimed at future fuel efficiency improvements and GHG reductions, the
baseline vehicles for the EU are assumed to be 2014 vehicles that meet Euro VI emissions
standards using the same emissions control devices as EPA 2010 vehicles.
Vehicles in the EU and the US are similar in many ways, yet differ in some key areas, including
vehicle length, number of axles, number of tires, and driveline configuration. For example,
Tables 4-1 through 4-3 offer details on differences in tractors and trailers between the EU and the
US Tables 4-4 through 4-11 show that one major difference with EU vehicles is the use of the
cab-over-engine design.
It is important to note, however, that the EU segment characteristics listed in the following tables
were described by AEA-Ricardo to reflect the average of multiple types of vehicles within the
segments. While each segment in this analysis is assumed to be nominally represented by the
example vehicles in the tables, the segments as categorized by AEA-Ricardo actually comprise a
range of vehicles, spanning a range of associated characteristics. For example, while the Service
segment is represented in this analysis by the US equivalent of a Class 2b vehicle
(11,030 pounds or 5 tonnes), the segment as defined by AEA-Ricardo encompasses a broader set
of vehicle weights and configurations, including all heavy-duty vehicles 7,716 to 16,535 pounds
(3.5 to 7.5 tonnes) GVWR. As another example, the fuel economies provided by AEA-Ricardo
for the Bus and Coach segments are significantly higher than those of the US because these
average values include not only 40-foot buses and standard coaches but also minibuses and
smaller vehicles used in Bus and Coach operations.22 Because the eight vehicle segments for the
EU are each composed of a variety of vehicle sizes and makes, the average characteristics given
do not characterize every individual vehicle in that segment nor do they necessarily match the
comparative U.S vehicles, which describe one category of vehicle in that segment. As a result,
22
As described by AEA-Ricardo, the Bus and Coach segments are composed 40.3% of buses and coaches weighing less than
35,274 pounds (16 tonnes) and 59.7% of buses and coaches weighing more than 35,274 pounds (16 tonnes). For comparison, a
40-foot bus and a standard coach weigh approximately 40,000 pounds (18 tonnes) and 50,000 pounds (22 tonnes), respectively.
4-1the comparison of EU and US baseline vehicles yields some differences in characteristics,
including fuel economy and fuel consumption. Furthermore, while recognizing that each
segment in reality consists of multiple vehicle types, the fuel efficiency improvement
technologies considered for each segment are assumed to be applied to the representative
example vehicle shown in the baseline tables. Accordingly, technologies included or not
included for each representative vehicle should not be considered to define the entirety of
potential improvements for all vehicles in that segment.
Table 4-1. Example of EU-US Tractor Differences
Trailer/Vehicle
EU US
Characteristics
Width (m) 2.55 2.6
Height (m) 4 (maximum) 4.09
Length (m) 5.7-6.5 7.9
2
Frontal area (m )Table 4-3. Tractor-Trailer Differences in the EU vs. the US
Parameter EU US
*
Cd ~US 0.62-0.64
Crr — 0.0068
Trailer 13.6 m 53-foot standard box
Engine 11-15L 11-15L
**
Transmission Automated manual 10-speed manual
**
Governed speed 55 mi/hr (90 km/hr) 75 mi/hr (120 km/hr)
GVW 88,000-97,000 lb (40-44 tonnes) 80,000 lb (36 tonnes)
Fuel economy/consumption 6.7-7.8 mi/gal (30-35 L/100km) 6.5 mi/gal (36 L/100km)
Fuel price €1.3/L €0.75/L
*Cab-over-design Cd probably greater than US aero-tractor, but this is offset by smaller tractor trailer gap.
**Lower EU speed offers 4.5% fuel consumption benefit; automated manual transmission offers 6% benefit.
4-3Table 4-4. Baseline Vehicles in the Service Segment
Service EU US
Mitsubishi Fuso FG Isuzu NPR
Example
Engine displacement (L) 3.907 3
Diesel: turbocharged, high Diesel: turbocharged, high
Engine*
pressure common rail (1,800 bar) pressure common rail (1,800 bar)
Transmission 6-speed automatic 6-speed automatic
Emissions control Euro VI: EGR+DPF+SCR EPA 2010: EGR+DPF+SCR
Vehicle configuration Front bumper with air dam Front bumper with air dam
Segment Characteristics:
†
GVWR (lb) 7,716 to 16,535 8,500 to 16,000
†
GVWR (kg) 3,500 to 7,500 3,856 to 7,257
†
Annual activity (mi) 21,748 (average) 15,000 to 60,000
†
Annual activity (km) 35,000 (average) 24,141 to 96,560
†
Fuel economy (mi/gal) 14.7 (average) 8 to 13
†
Fuel consumption (L/100km) 16.0 (average) 18 to 29
Engine displacement, transmission, and vehicle configuration information are derived from manufacturer websites. Engine and
emissions control information are assumptions made in this analysis. GVWR, annual activity, fuel economy, and fuel
consumption information are provided for the EU by AEA-Ricardo as average values across the EU-27 member states and for
the US by NRC.
* Assuming technology to meet Euro VI standards is the same as technology to meet US EPA 2010 standards
† 23
Corresponding to US Class 2b, Class 3, and Class 4 vehicles
(Images courtesy of Mitsubishi Fuso, Isuzu)
23
National Research Council. “Technologies and Approaches to Reducing the Fuel Consumption of Medium- and Heavy-Duty
Vehicles.” http://www.nap.edu/catalog/12845.html. 2010.
4-4Table 4-5. Baseline Vehicles in the Urban Delivery Segment
Urban Delivery EU US
DAF LF45 Kenworth T270
Example
Engine displacement (L) 6.7 6.7
Transmission 6-speed manual 6-speed manual
Diesel: 190 to 200 bar cylinder Diesel: 190 to 200 bar cylinder
pressure, common rail fuel pressure, common rail fuel
injection (2,000 bar), multiple injection (2,000 bar), multiple
injections per cycle, electrically injections per cycle, electrically
Engine* actuated variable geometry
actuated variable geometry
turbocharger, open-loop turbocharger, open-loop
emission controls, peak thermal emission controls, peak thermal
efficiency 42 to 43% efficiency 42 to 43%
Emissions control Euro VI: EGR+DPF+SCR EPA 2010: EGR+DPF+SCR
Integrated air dam, cab side Aerodynamic styled cab including
Vehicle configuration
edge turning vanes rounded bumper and air dam
Segment Characteristics:
GVWR (lb) 16,535 to 30,865 16,001 to 26,000
GVWR (kg) 7,500 to 14,000 7,257 to 11,793
† ‡
Annual activity (mi) 24,855 (average) 20,000 to 75,000
† ‡
Annual activity (km) 40,000 (average) 32,187 to 120,701
† ‡
Fuel economy (mi/gal) 11.2 (average) 5 to 12
† ‡
Fuel consumption (L/100km) 21.0 (average) 20 to 47
Engine displacement, transmission, and vehicle configuration information are derived from manufacturer websites. Engine and
emissions control information are assumptions made in this analysis. GVWR, annual activity, fuel economy, and fuel consumption
information are provided for the EU by AEA-Ricardo as average values across the EU-27 member states and for the US by NRC.
* Assuming technology to meet Euro VI standards is the same as technology to meet US EPA 2010 standards
†
Average of EU heavy-duty vehicles used for distribution in cities or suburban sites of consumer goods from a central store to
selling points; rigid trucks only
‡ 24
Corresponding to US Class 5 and Class 6 vehicles
(Images courtesy of DAF, Kenworth)
24
National Research Council. “Technologies and Approaches to Reducing the Fuel Consumption of Medium- and Heavy-Duty
Vehicles.” http://www.nap.edu/catalog/12845.html. 2010.
4-5Table 4-6. Baseline Vehicles in the Municipal Utility Segment
Municipal Utility EU US
DAF CF 75 Peterbilt 320
Example
Engine displacement (L) 9.2 8.9
Diesel: 190 to 200 bar cylinder Diesel: 190 to 200 bar cylinder
pressure, common rail fuel pressure, common rail fuel
injection (2,000 bar), multiple injection (2,000 bar), multiple
injections per cycle, electrically injections per cycle, electrically
Engine*
actuated variable geometry actuated variable geometry
turbocharger, open-loop turbocharger, open-loop
emission controls, peak thermal emission controls, peak thermal
efficiency 42 to 43% efficiency 42 to 43%
Transmission 6-speed automatic 6-speed automatic
Emissions control Euro VI: EGR+DPF+SCR EPA 2010: EGR+DPF+SCR
Segment Characteristics:
‡
GVWR (lb) 16,535 to 61,729 66,000
‡
GVWR (kg) 7,500 to 28,000 30,000
† ‡
Annual activity (mi) 15,534 (average) 15,000
† ‡
Annual activity (km) 25,000 (average) 24,140
† ‡
Fuel economy (mi/gal) 4.3 (average) 3.3
† ‡
Fuel consumption (L/100km) 55.2 (average) 71
Engine displacement, and transmission, information are derived from manufacturer websites. Engine and emissions control
information are assumptions made in this analysis. GVWR, annual activity, fuel economy, and fuel consumption information are
provided for the EU by AEA-Ricardo as average values across the EU-27 member states and for the US by TIAX/NAS.
* Assuming technology to meet Euro VI standards is the same as technology to meet US EPA 2010 standards
†
Average of EU heavy-duty vehicles used for municipal utility purposes, e.g., refuse collection, road sweeping
‡ 25
Corresponding to average US refuse hauler
(Images courtesy of DAF, Peterbilt)
25
Kromer, M., W. Bockholt, M. Jackson. “Assessment of Fuel Economy Technologies for Medium- and Heavy-Duty Vehicles.”
Prepared by TIAX LLC for National Academy of Sciences. November 19, 2009.
4-6You can also read