Social and Travel Lockdown Impact Considering Coronavirus Disease (COVID-19) on Air Quality in Megacities of India: Present Benefits, Future ...
←
→
Page content transcription
If your browser does not render page correctly, please read the page content below
Special Issue on COVID-19 Aerosol Drivers, Impacts and Mitigation (II)

Aerosol and Air Quality Research, 20: 1222–1236, 2020
Publisher: Taiwan Association for Aerosol Research
ISSN: 1680-8584 print / 2071-1409 online
https://doi.org/10.4209/aaqr.2020.04.0171

Social and Travel Lockdown Impact Considering Coronavirus Disease
(COVID-19) on Air Quality in Megacities of India: Present Benefits, Future
Challenges and Way Forward

Suresh Jain*, Tanya Sharma
Department of Civil & Environmental Engineering, Indian Institute of Technology Tirupati, Tirupati, Andhra Pradesh –
517 506, India

ABSTRACT

   The coronavirus disease (COVID-19) created enormous pressure across the globe due to an increasing number of COVID-19
infected cases. All the governments’ primary focus is to save humanity from this pandemic problem, and they have lockdown
almost the entire nation to stop the spread of infection. This lockdown resulted in a considerable impact on the global as well
as a local economy that will take a long time to perform with business as usual scenario. However, improvement in the air
quality of the cities across the globe has emerged as a key benefit of this lockdown. Therefore, this study aims to assess the
overall impact of social and travel lockdown in five megacities of India; Delhi, Mumbai, Chennai, Kolkata, and Bangalore.
The study evaluated the spatiotemporal variations in five criteria pollutants over two time periods, i.e., March–April 2019
and March–April 2020 and 10th–20th March 2020 (before lockdown) and 25th March to 6th April 2020 (during lockdown).
The results highlighted a statistically significant decline in all the pollutants in all the megacities except for ozone. It was
observed that the concentration of PM2.5, PM10, NO2 and CO declined by ~41% (66–39 µg m–3), ~52% (153–73 µg m–3),
~51% (39–19 µg m–3) and ~28% (0.9–0.65 mg m–3) during the lockdown phase in comparison to the before lockdown in
Delhi, respectively. Similar decline in pollutant concentration was observed in other megacities as well. Further, the study
conducted an expert survey to identify the possible challenges India might face after lockdown is over. All the experts said
that reviving the economy will be a big challenge for the government, and it may result in some tradeoff while managing the
air quality in the near future due to scarcity of funds, etc.

Keywords: Interpolation technique; Arc GIS; Air quality; Vulnerability; Environmental health.

INTRODUCTION                                                                      positive cases crossing 75,048 and death toll at 2440 until
                                                                                  May 13, 2020 (MoHFW, 2020). The entire country was
  The entire world is facing a severe risk due to COVID-19                        under complete lockdown from March 25 to April 14, 2020,
(Coronavirus disease) which is affecting almost all the                           for 21 days, which was further extended by the Government
countries (Buono et al., 2020). The World Health Organization                     of India until May 3, 2020 followed by the third phase of
(WHO, 2020) declared COVID-19 as a pandemic due to                                lockdown till May 17, 2020 to tackle the spread of COVID-19.
widespread global infection. As of May 13, 2020, ~4,369,933                       Social and travel restriction resulted in the shutdown of all
coronavirus cases have been reported globally. Out of which                       the businesses which includes industries, transport (air, water,
2,456,508 are currently infected (98% with mild and 2%                            and surface), markets, shops, tourism, construction and
with serious or critical conditions) and around 1,913,425 are                     demolition, hotels and restaurants, mining and quarrying,
the closed cases out of which 85% recovered and 15% died.                         etc. except the limited essential services like groceries, milk,
India is also facing a similar challenge due to the COVID-19                      fruits and vegetable, medicines, etc. This situation already
pandemic, which created an emergency in the entire country.                       created a significant impact on the global as well as a local
India is at a critical stage in its fight against COVID-19 with                   economy that will take adequate time to perform with
                                                                                  business as usual scenarios. For e.g., India’s fuel growth rate
                                                                                  witnessed its worst hit over the last two decades, mainly due
                                                                                  to lockdown in March 2020, which resulted in a decline in
*
    Corresponding author.                                                         fuel consumption by nearly 60–70%. However, according to
    Tel: +91-11-7180 0222; Fax: +91-11-2612 2874                                  Indian oil companies, consumption of liquefied petroleum
    E-mail address: sureshjain_in@yahoo.com;                                      gas (LPG) use has been increased by 15% due to more
    sureshjain@iittp.ac.in                                                        cooking at home. Nevertheless, globally one change that has

   Copyright The Author(s). This is an open access article distributed under the terms of the Creative Commons Attribution License (CC BY 4.0), which permits
unrestricted use, distribution, and reproduction in any medium, provided the original author and source are cited.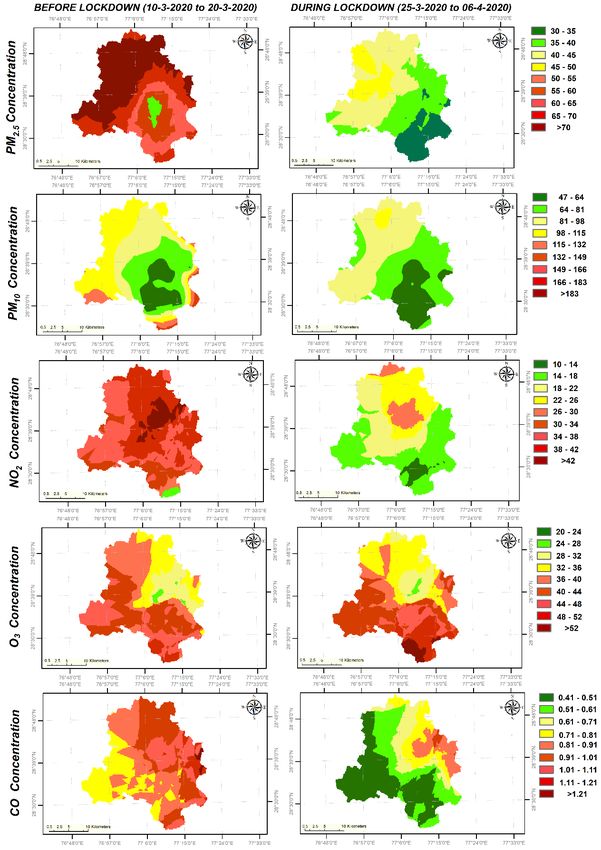
Jain and Sharma, Aerosol and Air Quality Research, 20: 1222–1236                                 1223

been observed is the improvement in the air quality due to         observed that air quality has drastically improved in most of
lockdown and travel restrictions (Bao and Zhang, 2020;             the cities. Ogen (2020) and Wu et al. (2020) have reported
Saadat et al., 2020). The decline in the levels of air pollution   that improvement in air quality lowers the severity of COVID-
have been recently reported in many countries across the           19 outcomes. But this situation will not continue for a long
world like China, Brazil, Barcelona etc. A study conducted         time. As soon as the businesses are permitted to resume their
by Xu et al. (2020) reported the impact of COVID-19 on air         operations as indicated by the Government of India after
pollution levels in three cities of central China. The results     May 17, 2020, the air quality is likely to start deteriorating
clearly indicated a decline in the levels of pollutants like       in most of the cities, and by the time winters will approach,
PM2.5, PM10, SO2, CO and NO2 during the lockdown period.           it may create the same conditions as it was in the year 2019.
Further, Nakada and Urban (2020) also reported the reduction       Pollution is inevitable due to a growing economy and results
in NO, NO2 and CO concentrations by ~77.3% ~54.3% and              as one of the outcomes of the developing economies for
~64.8%, respectively, in the city of São Paulo, Brazil during      moving towards industrialization. Hence, there is a tradeoff
the partial lockdown in February to April 2020 in comparison       between nature and human activities, which is essential to
to the five-year average of the same months from 2015 to           analyze to make informed decisions. Therefore, considering
2019. Similar declines in air pollution have been reported by      the current situation, we have analyzed the current state of
other researchers like Tobías et al. (2020) in Barcelona; Dantas   air quality in most of the megacities in India and identified
et al. (2020) in Rio de Jenario and Mahato et al. (2020) in        the potential future challenges. Also, a few policy measures
Delhi. Still, there is a cost to that, i.e., the slowdown in the   have been suggested to control the air quality in most of the
economy of the countries and effect on the mental wellbeing        Indian cities in the coming future.
of the communities (European Environment Agency, 2020;
Zambrano-Monserrate et al., 2020).                                 METHODOLOGY
   A similar effect has been observed in the Indian context.
Before the lockdown, air quality was inferior in most Indian          The present study evaluated the impact of social and
cities, and it affects the most vulnerable people in the           travel lockdown amid the COVID-19 breakout on the air
community like children, the aging population, women, and          quality in megacities of India, given its implications in the
the public having respiratory and cardiovascular problems          near future. Fig. 1 presents the overall methodological approach
(Aggarwal and Jain, 2015; Kumar et al., 2013; WHO, 2018).          adopted to conduct the study.
The Global Burden of Disease reported that around 3.4 million
premature deaths were attributed to exposure to ambient air        Site Description and Data Collection
pollution (Stanaway et al., 2018). However, under the current         The study analyses the impact of social and travel
India wise lockdown situation because of COVID-19, it is           lockdown on air quality of five megacities of India, i.e., Delhi,

Fig. 1. Overall methodological framework used in the current study to assess the impact of lockdown in view of COVID-19
in megacities of India on air quality.
1224                               Jain and Sharma, Aerosol and Air Quality Research, 20: 1222–1236

Mumbai, Chennai, Bangalore, and Kolkata. The megacities             1. Yearly comparison: Air quality data for the period
being the economic centers of the country are susceptible to            representing lockdown months, i.e., March–April 2020
relatively higher levels of both national as well as                    was compared with air quality data of the last year March–
international travel movements. Delhi and Mumbai have                   April 2019. The air quality of the cities was compared
been regarded as epicenters for coronavirus in India are                for a period of 22 days spanning over two months, i.e.,
analysed separately using spatiotemporal analysis in view of            from 20th March to 10th April for the years 2019 and 2020,
correlation between air pollution exposure and COVID-19                 respectively. The air quality data has not been analysed
infection. They hence are under scrutiny, and severe restrictions       for Mumbai city for the same period due to the presence
are presenting unusual cases for evaluation of the impact of            of enormous data gaps in the 2019 data for the pollutants
the lockdown on air pollution. Continuous ambient air quality           considered in most of the monitoring stations of Mumbai.
data monitored by various State Pollution Control Boards            2. Lockdown duration comparison was made for the time
(SPCBs) at different monitoring stations in each city under             period of 10th to 20th March 2020 (Before lockdown period)
consideration was procured through the Central Pollution                versus 25th March to 6th April 2020 (During lockdown
Control Board, New Delhi for five criteria pollutants, i.e.,            period).
particulate matter ≤ 2.5 µm (PM2.5), particulate matter ≤ 10 µm        A trend analysis of 24-hour daily average data for the five
(PM10), nitrogen dioxide (NO2), ozone (O3) and carbon               pollutants was considered for the above stated periods in all
monoxide (CO) along with three meteorological parameters,           the cities to understand the variations in the levels of pollutant
i.e., ambient temperature (AT), wind speed (WS) and                 accumulation amid the lockdown period. Meteorology plays
relative humidity (RH). Air pollutants and meteorological           a significant role in determining air pollution levels.
data were procured from all the monitoring stations operational     Therefore, time-series data were analyzed to see the effect
in each city, i.e., 38 in Delhi, 10 in Mumbai, 4 in Chennai,        of meteorology on air quality. A simultaneous trend analysis
10 in Bangalore, and 7 in Kolkata. Table 1 presents the list        of meteorological parameters and air pollutants was conducted
of all air quality monitoring stations considered in each city      to validate the impact of lockdown on air pollution levels in
for data collection. Continuous 24-hour average data for the        the cities. Furthermore, paired t-test was used to test the
above parameters were collected for 22 days spanning over           significant changes in the criteria air pollutant concentrations
two months in 2019, i.e., from 20th March to 10th April 2019,       during the lockdown period.
while for 32 days in the year 2020, i.e., from 10th March to
10th April 2020.                                                    Spatiotemporal Analysis of Air Pollution over COVID-19
                                                                    Epicenters of India: Delhi and Mumbai
Data Analysis                                                          One of the objectives of the present study was to map the
Trend Analysis                                                      spatiotemporal variations in the air pollution levels achieved
   The impact of social and travel lockdown on air pollution        through lockdown periods in two of the most significantly
levels of the selected megacities was inspected for two             COVID-19 affected cities of India, i.e., Delhi and Mumbai.
different periods, as indicated below:                              Kriging, a spatial interpolation GIS technique, was employed

                  Table 1. Monitoring stations considered in the selected megacities cities for data collection.
                         Number of
                         Monitoring
 S. No.    City                           List of Monitoring Stations
                         Stations
                         Considered
 1         Delhi         38               Alipur-DPCC; Anand Vihar-DPCC; Ashok Vihar-DPCC; Aya Nagar-IMD;
                                          Bawana-DPC; Burari Crossing-IMD; CRRI Mathura Road-IMD; Dr. Karni Singh
                                          Shooting Range-DPCC; DTU-CPCB; Dwarka-Sector 8-DPCC; East Arjun Nagar-
                                          CPCB; IGI Airport (T3)-IMD; IHBAS, Dilshad Garden-CPCB; ITO-CPCB;
                                          Jahangirpuri-DPCC; Jawaharlal Nehru Stadium-DPCC; Lodhi Road-IMD; Major
                                          Dhyan Chand National Stadium-DPCC; Mandir Marg-DPCC; Mundka-DPCC;
                                          Najafgarh-DPCC; Narela-DPCC; Nehru Nagar-DPCC; North Campus, DU-IMD;
                                          NSIT Dwarka-CPCB; Okhla Phase-2-DPCC; Patparganj-DPCC; Punjabi Bagh-
                                          DPCC; Pusa-DPCC; R K Puram-DPCC; Rohini-DPCC; Shadipur-CPCB; Sirifort-
                                          CPCB; Sonia Vihar-DPCC; Sri Aurobindo Marg-DPCC; Vivek Vihar-DPCC;
                                          Wazirpur-DPCC
 2         Mumbai        10               Bandra; Borivali East; Chhattrapati Shivaji Int. Airport; Colaba; Kurla; Powai;
                                          Sion; Vasai, West; Vile Parle west; Worli
 3         Chennai       4                Alandur Bus Depot; Manali; Manali Village; achery Residential Area
 4         Bangalore     10               BTM Layout; BWSSB; Bapuji Nagar; City Railway station; Hebbal;
                                          Hombegowda Nagar; Jayanagar 5th Block; Peenya; Sanegurava Hills; Silk Board
 5         Kolkata       7                Ballygunge; Bidhannagar; Fort William; Jadavpur; Rabindra Bharti University;
                                          Rabindra Sarobar; Victoria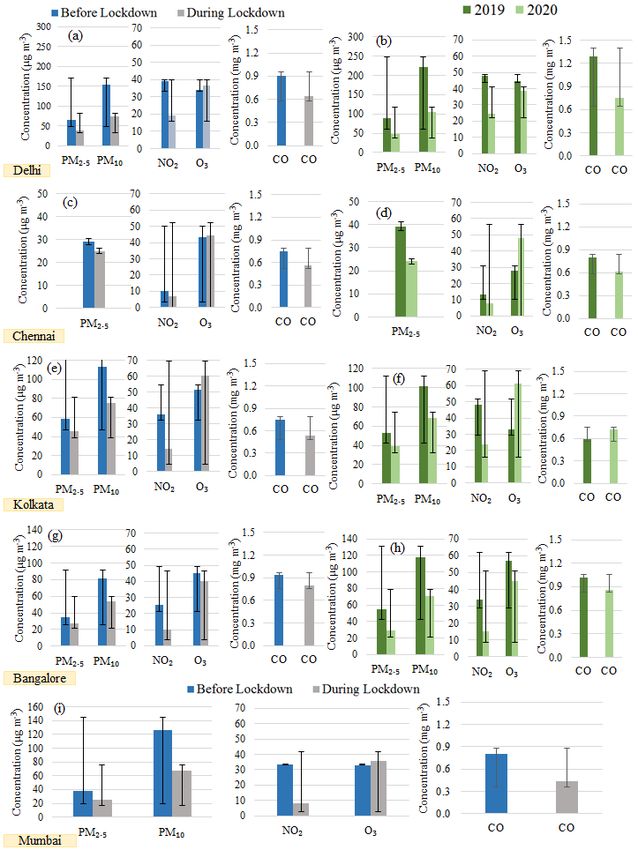
Jain and Sharma, Aerosol and Air Quality Research, 20: 1222–1236 1225
to assess the spatial spread of air pollutants over the cities temporal analysis of the variations in the levels of criteria air
for the selected periods. Kriging is a powerful statistical pollutants revealed that there was a significant decline in the
technique which assumes that distance or direction between concentration of all the pollutants except for surface ozone
sample points reflect a spatial correlation and hence represent (O3) in the megacities under examination. It is important to
variation in surface (Kumar et al., 2016; van Zoest et al., highlight that the concentrations of O3 witnessed an increase
2019). It uses a weighted average technique by considering in the lockdown period in 2020, while an overall decline was
spatial correlation to predict the values for an area from the observed when compared for the same duration in 2019.
available data samples as per the following equation: However, the magnitude of the decline in air pollutant
concentrations is different in all the megacities. Fig. 2 clearly
N showed that there is no violation of the National Ambient
Z So i Z Si Air Quality Standards (NAAQS for PM2.5 = 60 µg m–3, PM10
i 1
= 100 µg m–3, NO2 = 80 µg m–3 (42.54 ppb) based on a 24-
hours average; O3 = 100 µg m–3 (50.96 ppb) and CO =
where, Z(si) = measured value at the ith location; 2 mg m–3 (1.75 ppm) based on 8-hours average) during the
λi = Unknown weight for measured value at ith location; lockdown period in all the megacities (the ppb and ppm
so = Prediction location; values are at 25°C and 1013 mb for comparison purpose).
N = number of measured values. However, when compared with the WHO standards (for
The tool was employed on the air pollutant data procured PM2.5 = 25 µg m–3, PM10 = 50 µg m–3 based on a 24-hours
through the CPCB monitoring stations to interpolate the average; O3 = 100 µg m–3 based on 8-hours average),
pollutant concentrations for the entire city. It was done to Mumbai, Bangalore, and Chennai are within the permissible
identify and demonstrate the most affected, i.e., hot spots limits for PM2.5; whereas all the megacities violate WHO
and least affected (benefited) areas within the cities. standards (WHO, 2018) when compared in terms of PM10
levels. Moreover, all the megacities are within the permissible
Experts’ Opinion through an Online Survey limits without any violations for O3. Further, all the criteria
The study conducted an expert survey to take their opinions pollutant concentrations were within the NAAQS limit
to identify the possible challenges India might face soon before the lockdown except for PM2.5 in Delhi (66 µg m–3)
after the lockdown period is over. A total of 25 responses and PM10 in Delhi, Mumbai and Kolkata, with average
were received from national experts, including researchers, concentrations being 153 µg m–3, 126 µg m–3 and 113 µg m–3,
academicians, industry experts, etc. working in the field of respectively, as presented in Figs. 2(a), 2(e) and 2(i). A
air quality management through an online questionnaire similar trend was observed for lockdown period March–April
with an online response rate of 64%. The questionnaire was 2020 when compared with air quality data of the last year
comprised of both ‘open-ended’ as well as ‘closed-ended’ March–April 2019 except for PM2.5 (89 µg m–3) in Delhi and
questions to gather the perspective of the experts regarding PM10 levels in Delhi, Kolkata and Bangalore, 222 µg m–3,
the current scenario as well as future implications of 102 µg m–3, 118 µg m–3, respectively, as presented in Figs. 2(b),
COVID-19 pandemic on India. The questionnaire has been 2(d) and 2(f). The WHO (2018) reported that bringing down
presented in supplementary information (S1). The experts PM2.5 levels by 25 µg m–3 would result in a reduction of 15%
were provided questions to identify the possible challenges premature deaths (mortality). Even though impact due to
and their solutions after the lockdown period is over. The exposure to air pollution will not result in instantaneous
expert opinion survey was also used to identify the major mortality, and it is more of a chronic phenomenon. Therefore,
learnings that can be achieved through the lockdown and immediate benefits would be more in terms of avoided
how these can be used strategically for future planning and morbidity and increased in healthy days.
air quality management. Fig. 3 represents the percentage change in all the criteria
pollutants considered in each megacity for the two periods
RESULTS AND DISCUSSION of assessment, i.e., before vs. during lockdown in 2020 and
March–April 2019 vs March–April 2020. The results of the
The results of the air quality analysis have been presented analysis showed that the maximum dip was observed in NO2
in terms of yearly and daily variations observed in the pollutant concentrations in all the cities, with the maximum decline
concentrations due to the implementation of lockdown in the of ~75% being observed in Mumbai for the ‘before’ and
selected five megacities (Fig. 2). Spatiotemporal variations ‘during’ lockdown duration in 2020. Dutheil et al. (2020)
in air pollutant concentrations have also been analysed for also reported a significant reduction in NO2 levels in China
Delhi and Mumbai. Finally, time series analysis for daily due to COVID-19 pandemic. Further, Delhi witnessed a
variations in the levels of air pollutants and meteorological dramatic decline in all the pollutants, which can be assumed
parameters was carried out, which highlighted the impact of to be historic as compared to the city’ air quality since the
WS, AT, and RH on the air quality of the cities. last two decades. In Delhi, there is a significant (p values
vary from 0.02474-0.03E-06) decline of 41%, 52%, 50%,
Effects of Lockdown on-Air Quality in Megacities 29% in the average concentration of PM 2.5 from 66 to
Fig. 2 shows the concentrations of all the air pollutants in 39 µg m–3, PM10 from 153 to 73 µg m–3, NO₂ from 39 to
Delhi, Chennai, Kolkata, Bangalore, and Mumbai before 19 µg m–3, and CO from 0.9 to 0.65 mg m–3, respectively
and during the lockdown as well as in 2019 and 2020. The during the lockdown phase in comparison to the before1226 Jain and Sharma, Aerosol and Air Quality Research, 20: 1222–1236 Fig. 2. Effects of lockdown on-air quality during two scenarios, i.e., effect of lockdown on air quality in compared with before lockdown and effect on air quality due to lockdown in March–April 2020 vs. last year March–April 2019. (a–b) is for Delhi; (c–d) is for Chennai; (e–f) is for Kolkata; (g–h) is for Bangalore and (i) is for Mumbai (PM, NO2 and O3 are in µg m–3 and CO in mg m–3).
Jain and Sharma, Aerosol and Air Quality Research, 20: 1222–1236 1227
BEFORE vs. DURING LOCKDOWN' 2020 MARCH-APRIL 2019 vs. MARCH APRIL 2020
CITY
PM2.5 PM₁₀ NO₂ CO O₃ PM2.5 PM₁₀ NO₂ CO O₃
Delhi –41% –52% –50% –29% 7% –45% –52% –48% –41% –14%
Mumbai –33% –47% –75% –46% 8% DNA* DNA* DNA* DNA* DNA*
Chennai –14% DNA* –32% –25% 3% –39% DNA –43% –23% 73%
Bangalore –22% –34% –60% –16% –11% –47% –40% –56% –15% –21%
Kolkata –23% –34% –60% –29% 17% –27% –32% –66% –16% 87%
* DNA: Data Not Available.
> 60% 40%-60% 20%-40% < 20%
Decline in air pollutants
> 60% 40%-60% 20%-40% < 20%
Increase in air pollutants
Fig. 3. Percentage decline or increase in criteria air pollutants concentrations in five megacities of India during lockdown
and before lockdown period.
lockdown phase. In contrast to this, a ~7% increase in O3 phase in comparison to the ‘before’ lockdown phase as
concentration has been observed (not significant p = 0.4892) shown in Figs. 2(e), 2(g) and 2(i). In contrast to the trend
in the city as shown in Fig. 2(a) due to lockdown as compared followed by the above pollutants, the concentration of O3
to before the lockdown period. Xu et al. (2020) also reported witnessed an incline in all the cities except for a decline in
the similar reduction in air pollutant concentrations in three Bangalore. The concentration of pollutant increased from 51
cities in Hubei Province, Wuhan, Jingmen, and Enshi in to 60 µg m–3 in Kolkata, 33 to 36 µg m–3 in Mumbai and 43 to
central China except an increase in O3 concentrations like 44 µg m–3 in Chennai as highlighted in Fig. 3. The contrasting
Indian megacities during the lockdown period. This study trend of O3 may be due to more favorable conditions for
compared average air pollutant concentrations for three photochemical reactions attributed to increased solar insolation
months, i.e., January to March 2017–2019 vs. January to and a decrease in NO2 leading to changes in the photochemical
March 2020. In case of Wuhan city, a decline from 33% to reactions determining ozone formation and destruction
45% (88.6 to 59.6 µg m–3 in January; 67.9 to 38 µg m–3 in (Sharma et al., 2016; Dang and Liao, 2019; Xu et al., 2020).
February, and 53.1 to 34.5 µg m–3 in March) was observed The underlying chemistry between anthropogenic emissions
in in PM2.5 concentration. A decline in PM10, NO2 and CO like NOx in a VOC-limited environment and O3 along with
concentrations were observed in the range 30% to 48%, 30% the meteorological parameters govern the accumulation of
to 61% and 7% to 23%, respectively. Likewise Delhi, Wuhan surface ozone in the atmosphere (Gorai et al., 2015; Saini et
also experienced an increase in O3 concentration ranging al., 2017). Similar increasing trends have been observed in
from 9% to 27% (20.4 ppb in January 2017–2019 to 22.3 ppb the levels of O3 concentrations during the lockdown period
in January 2020; 27.7 ppb in February 2017–2019 to 35.2 ppb in China by Xu et al. (2020). A better understanding about
in February 2020 and 36.2 ppb in March 2017–2019 to the increasing trend of O3 concentration in Indian cities can
42.1 ppb in March 2020), indicating the similar trends as be gathered through the underlying chemistry between NOx
observed in Indian megacities due to COVID-19. and O3 as represented in Eqs. (1) to (3):
The other megacities of India also witnessed a similar
decline in air pollutants as reported in Delhi, as shown in NO2 hv
437 nm
NO O* (1)
Figs. 2 and 3. Chennai for instance witnessed a decline of
~14% (from 30 to 26 µg m–3) in PM2.5, ~30% (10–7 µg m–3)
O2 + O* → O 3 (2)
in NO2, ~25% (0.75–0.56 mg m–3) in CO and a rise of ~3%
(43–44 µg m–3) in O3 ‘during’ lockdown phase in comparison
to the ‘before’ lockdown phase in the year 2020 as shown in O3 + NO → NO2 + O2 (3)
Fig. 2(c). Similarly, in the ‘during’ lockdown phase the
levels of PM2.5 declined from 58 to 45 µg m–3 in Kolkata, 35 As evident from the above equations, NO2 and NO
to 27 µg m–3 in Bangalore and 37 to 25 µg m–3 in Mumbai, produce contrasting impact on O3 accumulation. The NO2
respectively. A similar decline in other pollutants like PM10, promotes its formation in presence of sunlight while NO
NO2 and CO amounting to 34%, 60% and 29% in Kolkata; depletes it by formulating NO2 after the reaction. Further,
42%, 70% and 38% in Bangalore and 47%, 75% and 46% in the air pollution studies conducted in Indian cities showed
Mumbai, respectively was observed in the ‘during’ lockdown that more than 30–50% of NOx emissions are released by1228 Jain and Sharma, Aerosol and Air Quality Research, 20: 1222–1236 vehicles especially diesel vehicles compared to petrol driven carried out for Delhi and Mumbai. The spatiotemporal analysis vehicles (Aggarwal and Jain, 2015; Jain et al., 2016). Thus, was restricted to these cities since Delhi and Mumbai are in view of the current lockdown scenario wherein 70–80% among the most significantly affected cities in India due to of passenger vehicles and 60–70% of goods vehicles are off COVID-19 pandemic having 5,532 and 10,527 COVID-19 the road and other reduced combustion activities results in cases in, respectively. Further, Frontera et al. (2020) and reduced NOx emissions in a VOC-limited environment, Zhu et al. (2020) reported a strong linkage of COVID-19 which could have led to an increase in O3 concentration infection with higher air pollution concentrations. Therefore, (Kim et al., 2018; Tobías et al., 2020). It is relevant to point Delhi and Mumbai have been analysed separately. Figs. 4(a) out that the cities considered in the present study lie in VOC and 4(b) present the spatiotemporal variations in all the limited regions of India (Sharma et al., 2016), thus an pollutants before and during the lockdown period in Delhi increase in the levels of O3 can be understood by the decline and Mumbai, respectively. The spatiotemporal analysis would in NOx emissions. help in identifying the pollution hotspots in the cities. It has A similar trend has been observed in PM2.5, PM10, NO2, been observed that the Central and Northern part of Delhi CO, and O3 concentrations in Mumbai, Chennai, Bangalore, has more pollution hotspots compared to Mumbai where and Kolkata between March–April 2019 versus March– pollution levels are high in the Southern region. This is April 2020, as shown in Figs. 2(b)–2(e) and Fig. 3. A attributed to the fact that most of the activities are happening significant (p values vary from 0.001-6.22E-10) decrease in in the same regions, and these are the most populous concentrations of PM2.5 from 89 to 48 µg m–3, PM10 from compared to the rest of the areas in both the cities. In the 222 to 97 µg m–3, NO2 from 48 to 25 µg m–3, CO from 1.30 case of Delhi, Bawana, Jahangirpuri, Anand Vihar, Mundaka to 0.75 mg m–3, and O3 from 45 to 38 µg m–3 amounting to are few examples where pollution levels were high. While 32%, 34%, 27%, 27%, and 11% reductions, respectively, in Mumbai, many industries such as petroleum refineries, was observed between March–April 2019 and March–April power plants, fertilizer factories, and industries located near 2020 in Delhi as shown in Fig. 2 (refer to Table S1 in peripheral areas in the Southern region of Mumbai are supplementary information for ‘p’ values). The concentrations contributing to hotspots for high NO2 and PM levels. The of air pollutants in Bangalore declined from 55 to 29 µg m–3, yearly comparison between March–April 2019 and March– 118 to 71 µg m–3, 34 to 15 µg m–3, 1.01 to 0.86 mg m–3 and April 2020 highlighted that Central, Northern, Western and 57 to 45 µg m–3 for PM2.5, PM10, NO2, CO and O3, respectively Eastern parts of Delhi are more polluted areas in comparison in March–April 2020 as compared with March–April 2019. to the Southwest part of the city, as shown in Fig. 4(c). The A similar trend in reduction of air pollutant concentrations results of the analysis revealed that the concentration levels from 55 to 39 µg m–3, 102 to 68 µg m–3, 48 to 16 µg m–3, 0.6 of PM2.5, PM10, and NO2 witnessed the maximum decline to 0.5 mg m–3 in PM2.5, PM10, NO2 and CO, respectively, during March–April 2020 when compared to March–April was observed in Kolkata in March–April 2020 in comparison 2019. There is clear evidence that due to lockdown conditions to March–April 2019. because of COVID-19, there is a significant reduction in air It is important to highlight that reduction in PM2.5 levels pollution levels in Delhi. during the lockdown period may also be attributed to reduce NO2 levels, which played an influential role in the formation Meteorology and Air Quality in Megacities of secondary PM (ARAI and TERI, 2018). In addition to In general, very high wind speed and temperature and low transportation, the other factors that resulted in a reduction relative humidity favor more dispersion of air pollutants in air pollution levels are shutdown of industries, construction compared to calm wind speeds or stagnant days (Sharma et and demolition activities, road dust, refused burning and al., 2020). Fig. 5 shows the time series analysis of all the reduction in electricity demand from thermal power plants. criteria air pollutants PM2.5, PM10, NO2, O3, and CO, along The power sector reported that electricity demand has with meteorological parameters like atmospheric temperature reduced by ~20–30% (regional variation) when compared (AT), wind speed (WS – measured around 10 m from the with a week before the lockdown due to the shutdown of all ground), and relative humidity (RH) for Delhi. The time schools, colleges, theaters, malls, shopping centers, corporate series analysis clearly showed that about 1–2 weeks before and utility offices and even railway systems, etc. For e.g., all the lockdown, i.e., AT was in the range of 22–27°C, WS less the coal power plants were shutdowns in northern states of than 0.5 m s–1, RH in the range of 58–78% which are not India, i.e., Haryana, Punjab and Utter Pradesh) in a radius of favorable conditions for air pollutants dispersion and hence around 300 km of Delhi, except two units at Dadri Power concentrations of all the criteria pollutants was high. Plant in the state of Utter Pradesh (CREA, 2020). However, However, immediately after the lockdown, the temperature stubble burning has been observed at various places in India was 27–32°C, WS in the range of 0.7–1.2 m s–1, RH in the like Central India and Southern plains (which includes cities range of 50–64%, which are more favorable conditions like Bangalore, Chennai) because farmers cannot sell their compared to before lockdown for more dispersion of air agricultural residue due to the non-availability of transport. pollutants in the atmosphere. Putaud et al. (2004) have This may be another reason for the lesser amount of reported that at 50% RH led to PM10 and PM2.5, respectively, reduction in air pollutant concentrations in cities in Southern 1.09 and 1.07 times as high as gravimetric measurements at India compared to Northern India. 20% relative humidity; this may be attributed to particle- In addition to trend analysis, a spatiotemporal analysis bound water. Further, Jayamurugan et al. (2013) also reported using kriging a spatial interpolation GIS technique was the statistically significant negative correlations between
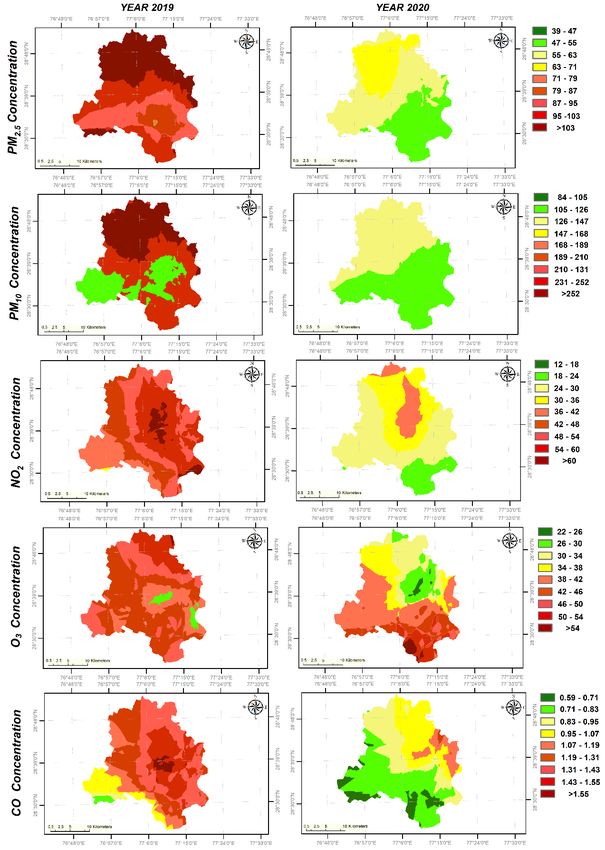
Jain and Sharma, Aerosol and Air Quality Research, 20: 1222–1236                      1229

Fig. 4(a). Spatiotemporal variations in air quality due to the lockdown period compared with before lockdown period in
Delhi (PM, NO2 and O3 are in µg m–3 and CO in mg m–3).
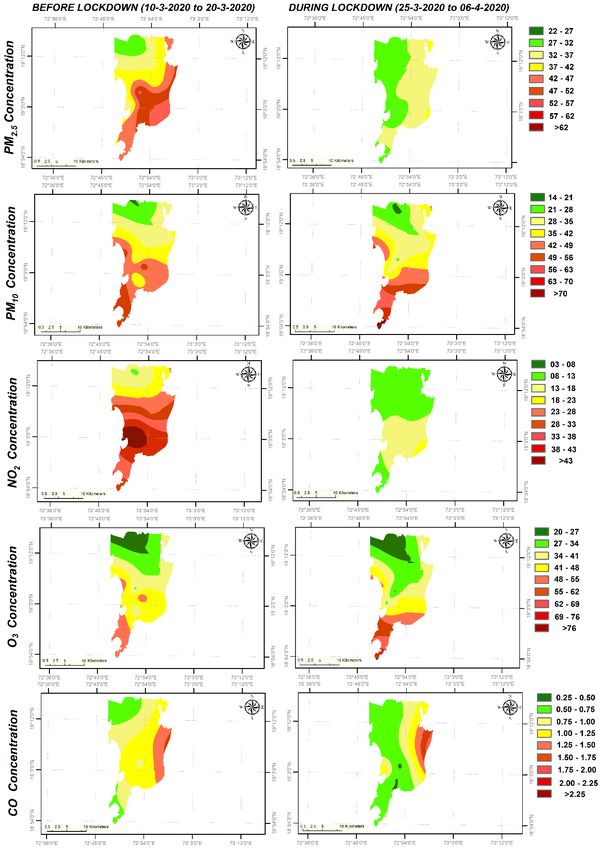
1230                           Jain and Sharma, Aerosol and Air Quality Research, 20: 1222–1236

Fig. 4(b). Spatiotemporal variations in air quality due to the lockdown period compared with before lockdown period in
Mumbai (PM, NO2 and O3 are in µg m–3 and CO in mg m–3).
Jain and Sharma, Aerosol and Air Quality Research, 20: 1222–1236                         1231

Fig. 4(c). Spatiotemporal variations in air quality in Delhi due to the lockdown in March–April 2020 vs. last year March–
April 2019 (PM, NO2 and O3 are in µg m–3 and CO in mg m–3).
1232                               Jain and Sharma, Aerosol and Air Quality Research, 20: 1222–1236

Fig. 5. Trend analysis showing the effect of lockdown period and meteorological parameters on air quality in Delhi - Punjabi
Bagh monitoring station.

humidity and particulates (RSPM and SPM) and advocated             the southern India, i.e., ~1.0 m s–1 and eastern India, i.e.,
the influence of humidity for subsiding particulates near the      0.7 m s–1 as reported by Sharma et al. (2020). Considering
surface. Therefore, along with the lockdown, meteorological        the variations in the meteorological parameters in the selected
parameters also played a significant role in the reduction in      megacities as per their geographical locations, the decline in
air pollution levels in most of the places. Sharma et al. (2020)   air pollutant concentrations was more pronounced in Delhi
reported that in north India, predominant wind directions were     and Mumbai, thus, indicating the impact of meteorology on
south and southwest with average WS of around 1.5 m s–1,           air pollution levels amidst the lockdown period as well.
which further results in more dilution to air pollution levels     Further, similar time series analysis for other megacities have
in northern India. In contrast to the WS in northern India         also been presented in Figs. S1–S4 in S3 for more clarity.
during the March and April months of 2020, it was lower in
Jain and Sharma, Aerosol and Air Quality Research, 20: 1222–1236                                   1233

Challenges, Learnings and Solutions: Findings from                        results highlighted a statistically significant decline in all
Expert Opinion Survey                                                     the pollutants across all the megacities except for O3.
   The impact of COVID-19 lockdown on the air quality of              ●   In Delhi, there is a significant decrease of 41%, 52%,
the country was unanimously accepted by 24 out of the 25                  50%, and 29% in PM2.5, PM10, NO2 and CO concentrations,
experts who responded to the questionnaire (the response                  respectively, whereas ~7% increase in O3 concentrations
rate of the online survey was 64%). Experts mention that                  during the lockdown phase in comparison to before
lockdown gave several opportunities to rethink and learn                  lockdown phase. A significant decrease in concentrations
beyond our boundaries to reform the infrastructure and policy             of PM2.5 from 89 to 48 µg m–3, PM10 from 222 to 97 µg
measures to reduce the overall impacts on the economy and                 m–3, NO₂ from 48 to 25 µg m–3, CO from 1.30 to 0.75
environment together (Schwartz, 2020). Majority of the                    mg m–3, and O3 from 45 to 38 µg m–3 amounting to 32%,
experts emphasized that a lot of learnings w.r.t environmental            34%, 27%, 27%, and 11% reductions, respectively, was
management, especially air pollution can be learnt from this              observed between March–April 2019 and March–April
countrywide lockdown. It was highlighted that the lockdown                2020 in Delhi.
has helped us in understanding the best-case scenario to              ●   Chennai also witnessed a decline of ~14% (from 30 to
measure the air quality gains along with the major contributors.          26 µg m–3) in PM2.5, ~ 30% (10 to 7 µg m–3) in NO2,
Nearly 70% of the experts indicated that reforms in                       ~25% (0.75 to 0.56 mg m–3) in CO and a rise of ~3% (43
transportation sector like avoiding unnecessary travel and                to 44 µg m–3) in O3 concentrations in the ‘during’
adopting the concept of tele-working can yield significant                lockdown phase in comparison to ‘before’ lockdown
benefits in terms of air pollution reduction in the business-             phase in the year 2020. A similar decline in other
as-usual days. Expert also highlighted that non-essential                 pollutants like PM10, NO2 and CO was observed during
activities can be identified and controlled to gain measurable air        the lockdown phase in comparison to the before
quality benefits. It is important to highlight that transportation,       lockdown phase in other megacities as highlighted in
industries, construction and demolition, road dust, and biomass           previous sections of the manuscript.
and refused burning were considered as the most important             ●   The concentrations of PM2.5, PM10, NO2, CO, and O3 in
sources which led to the reduction in air pollution levels in             Mumbai, Chennai, Bangalore, and Kolkata in March–
the country.                                                              April 2020 was estimated to be lower in comparison to
   All the experts stated that it is crucial to adopt an                  the concentration levels in March–April 2019. The
integrated strategy to manage the economy and environment                 concentrations of air pollutants in Bangalore declined
together to plan the future development activities in India               from 55 to 29 µg m–3 (~47%), 118 to 71 µg m–3 (~40%),
post COVID-19. They also highlighted that there would be                  34 to 15 µg m–3 (~56%), 1.01 to 0.86 mg m–3 (~15%)
a decline in the funds allocated to environmental activities              and 57 to 45 µg m–3 (~21%) for PM2.5, PM10, NO2, CO
in order to recover the economy. In view of the above concerns,           and O3, respectively in March–April 2020 as compared
all the experts were asked to report the possible challenges              with March–April 2019.
that the country might face after the lockdown is over. They          ●   A similar trend in reduction of air pollutant concentrations
were also asked to suggest the possible solutions to                      from 55 to 39 µg m–3, 102 to 68 µg m–3, 48 to 16 µg m–3,
overcome the challenges which can be used to devise the                   0.6 to 0.5 mg m–3 in PM2.5, PM10, NO2, and CO,
future strategies of the country. The findings of the expert              respectively, was observed in Kolkata in March–April
responses revealed that these challenges and their possible               2020 in comparison to March–April 2019. This decline
solutions could be grouped in three areas of development,                 in the concentration levels could be attributed to the
i.e., social, environmental and economic. An effort was made              complete travel lockdown and suspension of all the non-
to consolidate and identify the most frequently highlighted               essential travel activities in all the cities. The Timeseries
challenges and their solutions. Table 2 summarizes the                    analysis showed meteorology also played an essential role
findings of the expert opinion gathered from the survey along             in the dispersion of air pollutants in all the megacities.
with a comprehensive understanding about their perspectives.          ●   In addition, the expert’s opinion survey highlighted that
In light of the findings of the expert opinion survey, it can             the most critical challenge for India and even other
be concluded that the present air quality scenarios taught a              countries would be uplifting the economy by bringing
lesson to all the stakeholders belongs to scientific, academic,           back all the businesses after the lockdown period is over.
policy-decision, and politics how to handle the future air                Furthermore, reviving the economy is going to be the
quality scenarios and which sectors need to be controlled,                topmost priority of the government, which might forego
how much, and when (Wang et al., 2020).                                   the environmental benefits gained amidst the lockdown
                                                                          period.
CONCLUSIONS                                                           ●   Experts highlighted that the COVID-19 situation gave a
                                                                          lot of opportunities to reform our existing infrastructure
● The study evaluated spatiotemporal variations in five                   and policies to make the system more resilient and to
  criteria pollutants in Delhi, Mumbai, Chennai, Bangalore,               adapt to such incidents in the future (Musselwhite et al.,
  and Kolkata over two time periods. First, between                       2020). For examples, the government can encourage e-
  March–April 2019 and March–April 2020 and second                        governance initiatives, encourage work from home policy
  between 10th to 20th March 2020 (before the lockdown)                   for corporates and various other businesses, improved
  and 25th to 6th April 2020 (during the lockdown). The                   health infrastructure to tackle such issues, invest in
1234 Jain and Sharma, Aerosol and Air Quality Research, 20: 1222–1236
Table 2. Summary of responses received from experts in terms of potential challenges and possible solutions to manage
economy and environment after lockdown in India.
Aspects Potential Challenges Feasible Solutions
SOCIAL
Acceptance of the ‘new normal’ among mass Self-determination and understanding at
population. The COVID-19 impact is going to be individual level about their responsibility for the
in the country for a long time. Thus, acceptance of welfare of the society and country.
the fact that social distancing, maintaining Adoption of work from home strategies wherever
hygiene and being conscious about the situation and whenever possible.
should be inculcated as a habit among the Strategic planning required to increase investment
residents of the country is a prominent challenge. in public health sector.
Increased burden on public health infrastructure.
ENVIRONMENTAL
Degradation in air quality, probably to higher Implementation of 'odd-even' strategy for work
levels than the business-as-usual scenario offices and private vehicles.
attributable to increased usage of private modes of A quick transition from fossil fuels-based energy
transportation in comparison to public transport system to renewable and cleaner energy
due to the perception about the public transport in alternatives.
terms of lack of safety due to COVID-19 infection Plantation of trees with high surface area to
and less management by the agencies in terms of volume ratio in the pollution hotspot areas.
proper sanitisation, etc. Regulating construction and demolition activities
Implementation of air pollution control strategies in urban areas.
and plans The National Clean Air programme (NCAP)
Rise in air pollution related co-morbidity in needs to scale up significantly to ensure that rapid
COVID-19 infected patients. economic growth and meeting National Ambient
Medical waste in view of COVID-19 may be a Air Quality Standards (NAAQs) are aligned to
major threat if not handle properly. ensure ground level implementation.
Special collection and treatment mechanisms for
medical waste to be used as suggested by the
CPCB: Guidelines for Handling, Treatment, and
Disposal of Waste Generated during
Treatment/Diagnosis/ Quarantine of COVID-19
Patients (March 2020).
ECONOMIC
Recovery of the economic losses and GDP Increase in industrial production.
incurred due to the lockdown considering Support to small scale industry and their
COVID-19. modernization.
Prioritization of economic gains in comparison to Recovery and speeding of infrastructure related
environmentally sustainable solutions by the local, projects.
state as well as national government. Strategic Low Carbon Development Plans to
Employment crises and lack of job security as ensure sustainable economic development.
evident from other parts of the world. Financial support to make the country self-reliant
by having investment in various sectors for
stimulating the present economy and making the
infrastructure more resilient.
online education infrastructure to have a better adaptation and disposal of municipal and medical wastes in the cities
to such incidence in future, investment in sustainable to have a clean and breathable environment in the future.
infrastructure, better policy to reduce the vulnerability of
migrant workers under such situations, financial support DECLARATION OF COMPETING FOR INTEREST
micro, small and medium enterprises, etc.
● Integrated planning that caters to the environment and The authors declare that there are no financial and
economy together came out as an essential suggestion personal interests to influence the results and work presented
from the experts, and they also highlighted to align all the in the manuscript.
policy decisions in line with the Sustainable Development
Goals (SDGs). ACKNOWLEDGMENT
● Most important solutions suggested by the experts to
have a quick transition from fossil fuels based energy The authors would like to thank the experts who
system to renewable and cleaner energy alternatives, participated in an online survey under this pandemic
sustainable public transport; stringent emissions control situation. We would like to thank the CPCB and SPCBs for
measures and proper collection and scientific treatment ambient air quality data used in the study. We would like toJain and Sharma, Aerosol and Air Quality Research, 20: 1222–1236 1235
thank our Director, IIT Tirupati for the motivation to work 397. https://doi.org/10.5094/APR.2015.043
on COVID-19 and air quality issues and their solutions. Jain, S., Aggarwal, P., Sharma, P. and Kumar, P. (2016).
Vehicular exhaust emissions under current and alternative
AUTHOR STATEMENT future policy measures for megacity Delhi, India. J.
Transp. Health 3: 404–412. https://doi.org/10.1016/j.jth.2
Suresh Jain: Concept, Methodology, Data presentation, 016.06.005
Analyses and writing the original manuscript. Jayamurugan, R., Kumaravel, B., Palanivelraja, S. and
Tanya Sharma: Methodology, Data collection, Data Chockalingam, M.P. (2013). Influence of Temperature,
analysis, Writing the original manuscript. Relative Humidity and Seasonal Variability on Ambient
Air Quality in a Coastal Urban Area. Int. J. Atmos. Sci.
SUPPLEMENTARY MATERIAL 2013: 264046. https://doi.org/10.1155/2013/264046
Kim, S., Jeong, D., Sanchez, D., Wang, M., Seco, R., Blake,
Supplementary data associated with this article can be D., Meinardi, S., Barletta, B., Hughes, S., Jung, J., Kim,
found in the online version at http://www.aaqr.org. D., Lee, G., Lee, M., Ahn, J., Lee, S.D., Cho, G., Sung,
M.Y., Lee, Y.H. and Park, R. (2018). The controlling
REFERENCES factors of photochemical ozone production in Seoul,
south Korea. Aerosol Air Qual. Res. 18: 2253–2261.
Aggarwal, P. and Jain, S. (2015). Impact of air pollutants https://doi.org/10.4209/aaqr.2017.11.0452
from surface transport sources on human health: A Kumar, A., Gupta, I., Brandt, J., Kumar, R., Dikshit, A.K.
modeling and epidemiological approach. Environ. Int. 83: and Patil, R.S. (2016). Air quality mapping using GIS and
146–157. https://doi.org/10.1016/j.envint.2015.06.010 economic evaluation of health impact for Mumbai city,
ARAI and TERI (2018). Source Apportionment of PM2.5 & India. J. Air Waste Manage. Assoc. 66: 470–481.
PM10 of Delhi NCR for Identification of Major Sources. https://doi.org/10.1080/10962247.2016.1143887
Report No. Department of Heavy Industry Ministry of Kumar, P., Jain, S., Gurjar, B.R., Sharma, P., Khare, M.,
Heavy Industries and Public Enterprises, New Delhi, Morawska, L. and Britter, R. (2013). New Directions: Can a
ARAI/16-17/DHI-SA-NCR/Final. https://www.teriin.org “blue sky” return to Indian megacities? Atmos. Environ. 71:
/project/source-apportionment-pm25-pm10-delhi-ncr-ide 198–201. https://doi.org/10.1016/j.atmosenv.2013.01.055
ntification-major-sources. Mahato, S., Pal, S. and Ghosh, K.G. (2020). Effect of
Bao, R. and Zhang, A. (2020). Does lockdown reduce air lockdown amid COVID-19 pandemic on air quality of the
pollution? Evidence from 44 cities in northern China. Sci. megacity Delhi, India. Sci. Total Environ. 730: 139086.
Total Environ. 731: 139052. https://doi.org/10.1016/j.sci https://doi.org/10.1016/j.scitotenv.2020.139086
totenv.2020.139052 MoHFW (2020). COVID-19 INDIA. https://www.mohfw.g
Buono, M.G.D., Iannaccone, G., Camilli, M., Buono, R.D. and ov.in/
Aspromonte, N. (2020). The Italian outbreak of COVID- Musselwhite, C., Avineri, E. and Susilo, Y. (2020). Editorial
19: Conditions, contributors, and concerns. Mayo Clin JTH 16 –The Coronavirus Disease COVID-19 and
Proc. https://doi.org/10.1016/j.mayocp.2020.04.003 implications for transport and health. J. Transp. Heal. 16:
CPCB (2020). All India CAAQMS Portal. https://app.cpc 100853. https://doi.org/10.1016/j.jth.2020.100853
bccr.com/ccr/#/caaqm-dashboard-all/caaqm-landing Nakada, L.Y.K. and Urban, R.C. (2020). COVID-19
CREA (2020). Air quality improvements due to COVID 19 pandemic: Impacts on the air quality during the partial
lock-down in India. https://energyandcleanair.org/air- lockdown in São Paulo state, Brazil. Sci. Total Environ. 730:
quality-improvements-due-to-covid-19-lock-down-in-india/ 139087. https://doi.org/10.1016/j.scitotenv.2020.139087
Dang, R. and Liao, H. (2019). Radiative forcing and health Ogen, Y. (2020). Assessing nitrogen dioxide (NO2) levels as
impact of aerosols and ozone in China as the consequence a contributing factor to coronavirus (COVID-19) fatality.
of clean air actions over 2012–2017. Geophys. Res. Lett. Sci. Total Environ. 726: 138605. https://doi.org/10.1016
46: 12511–12519. https://doi.org/10.1029/2019GL084605 /j.scitotenv.2020.138605
Dutheil, F., Baker, J.S. and Navel, V. (2020). COVID-19 as Putaud, J.P., Raes, F., Van Dingenen, R., Brüggemann, E.,
a factor influencing air pollution? Environ. Pollut. 263: Facchini, M.C., Decesari, S., Fuzzi, S., Gehrig, R., Hüglin,
114466. https://doi.org/10.1016/j.envpol.2020.114466 C., Laj, P., Lorbeer, G., Maenhaut, W., Mihalopoulos, N.,
European Environment Agency (2020). Air quality and Müller, K., Querol, X., Rodriguez, S., Schneider, J.,
COVID-19. https://www.eea.europa.eu/themes/air/air- Spindler, G., Brink, H. ten, Tørseth, K. and Wiedensohler,
quality-and-covid19/air-quality-and-covid19 A. (2004). (2004). A European aerosol phenomenology-2:
Frontera, A., Martin, C., Vlachos, K. and Sgubin, G. (2020). chemical characteristics of particulate matter at kerbside,
Regional air pollution persistence links to COVID-19 urban, rural and background sites in Europe. Atmos.
infection zoning. J. Infect. https://doi.org/10.1016/j.jinf.2 Environ. 38: 2579–2595. https://doi.org/10.1016/j.atmos
020.03.045 env.2004.01.041
Gorai, A.K., Tuluri, F. and Tchounwou, P.B. (2015). Saadat, S., Rawtani, D. and Hussain, C.M. (2020).
Development of PLS–path model for understanding the Environmental perspective of COVID-19. Sci. Total
role of precursors on ground level ozone concentration in Environ. 728: 138870. https://doi.org/10.1016/j.scitotenv.
Gulfport, Mississippi, USA. Atmos. Pollut. Res. 6: 389– 2020.1388701236 Jain and Sharma, Aerosol and Air Quality Research, 20: 1222–1236 Saini, R., Taneja, A. and Singh, P. (2017). Surface ozone https://doi.org/10.1080/13658816.2019.1667501 scenario and air quality in the north-central part of India. Wang, P., Chen, K., Zhu, S., Wang, P. and Zhang, H. (2020). Int. J. Environ. Sci. 59: 72–79. https://doi.org/10.1016/j.j Severe air pollution events not avoided by reduced es.2017.02.008 anthropogenic activities during COVID-19 outbreak. Schwartz, A.A. (2020). Climate change, Covid-19, Resour. Conserv. Recycl. 158: 104814. https://doi.org/10. preparedness, and consciousness. EXPLORE 16: 141– 1016/j.resconrec.2020.104814 144. https://doi.org/10.1016/j.explore.2020.02.022 WHO (2018, May 2). Ambient air quality and health. ht Sharma, S., Chatani, S., Mahtta, R., Goel, A. and Kumar, A. tps://www.who.int/en/news-room/fact-sheets/detail/ambi (2016). Sensitivity analysis of ground level ozone in India ent-(outdoor)-air-quality-and-health using WRF-CMAQ models. Atmos. Environ. 131: 29–40. WHO (2020). Coronavirus disease (COVID-19) pandemic. https://doi.org/10.1016/j.atmosenv.2016.01.036 https://www.who.int/emergencies/diseases/novel-corona Sharma, S., Zhang, M., Anshika, Gao, J., Zhang, H. and virus-2019 Kota, S.H. (2020). Effect of restricted emissions during Wu, X., Nethery, R.C., Sabath, B.M., Braun, D. and Dominici, COVID-19 on air quality in India. Sci. Total Environ. 728: F. (2020). Exposure to air pollution and COVID-19 mortality 138878. https://doi.org/10.1016/j.scitotenv.2020.138878 in the United States. medRxiv 2020.04.05.20054502. Stanaway, J.D., Afshin, A., Gakidou, E., Lim, S.S., Abate, https://doi.org/10.1101/2020.04.05.20054502 D., Abate, K.H., Abbafati, C., Abbasi, N., Abbastabar, H., Xu, K., Cui, K., Young, L.H., Hsieh, Y.K., Wang, Y.F., Zhang, Abd-Allah, F., Abdela, J., Abdelalim, A., Abdollahpour, J. and Wan, S. (2020). Impact of the COVID-19 event on I., Abdulkader, R.S., Abebe, M., Abebe, Z., Abera, S.F., air quality in central China. Aerosol Air Qual. Res. 20: Abil, O.Z., Abraha, H.N., … Murray, C.J.L. (2018). 915–929. https://doi.org/10.4209/aaqr.2020.04.0150 Global, regional, and national comparative risk assessment Zambrano-Monserrate, M.A., Ruano, M.A. and Sanchez- of 84 behavioural, environmental and occupational, and Alcalde, L. (2020). Indirect effects of COVID-19 on the metabolic risks or clusters of risks for 195 countries and environment. Sci. Total Environ. 728: 138813. territories, 1990-2017: A systematic analysis for the https://doi.org/10.1016/j.scitotenv.2020.138813 Global Burden of Disease Study 2017. Lancet 392: 1923– Zhu, Y., Xie, J., Huang, F. and Cao, L. (2020). Association 1994. https://doi.org/10.1016/S0140-6736(18)32225-6 between short-term exposure to air pollution and COVID- Tobías, A., Carnerero, C., Reche, C., Massagué, J., Via, M., 19 infection: Evidence from China. Sci. Total Environ. Minguillón, M.C., Alastuey, A. and Querol, X. (2020). 727: 138704. https://doi.org/10.1016/j.scitotenv.2020.13 Changes in air quality during the lockdown in Barcelona 8704 (Spain) one month into the SARS-CoV-2 epidemic. Sci. Total Environ. 726: 138540. https://doi.org/10.1016/j.sci totenv.2020.138540 Received for review, April 25, 2020 van Zoest, V., Osei, F.B., Hoek, G. and Stein, A. (2019). Revised, May 13, 2020 Spatio-temporal regression kriging for modelling urban Accepted, May 15, 2020 NO2 concentrations. Int. J. Geog. Inf. Sci. 34: 851–865.
You can also read


