Northern Sacramento Valley Planning Area 2012 Triennial Air Quality Attainment Plan - Prepared by the Sacramento Valley Air Quality Engineering ...
←
→
Page content transcription
If your browser does not render page correctly, please read the page content below
Northern Sacramento Valley Planning Area
        2012 Triennial Air Quality Attainment Plan

Prepared by the Sacramento Valley Air Quality Engineering and Enforcement Professionals

                                     Spring 2013

                                                                                      1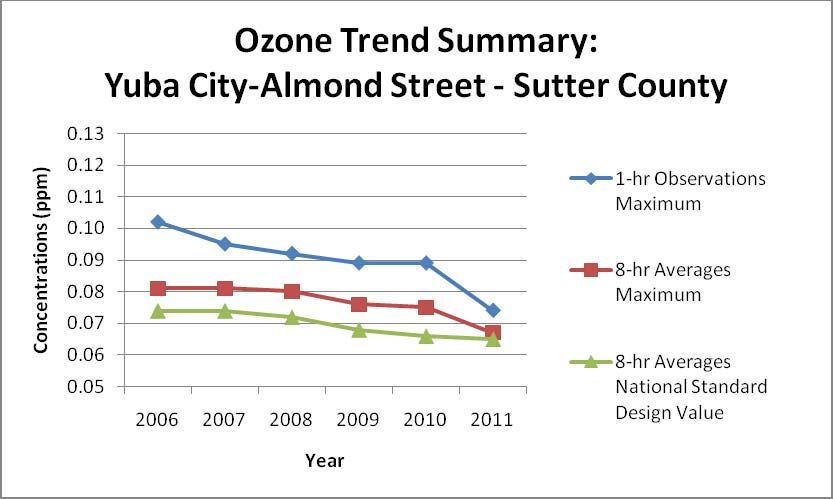
TABLE OF CONTENTS

Chapter I – Plan Overview                                                       Pg. 3
      Section I.1 – Introduction                                                Pg. 3
      Section I.2 – Legislative Requirements                                    Pg. 4
      Section I.3 – Area Description                                            Pg. 4
      Section I.4 – Area Designations                                           Pg. 5
      Section I.5 – Overview of Air Pollution Health Effects                    Pg. 5

Chapter II – Air Monitoring                                                     Pg. 6
      Section II.1 – Introduction                                               Pg. 6
      Section II.2 – Ozone Monitoring

      Section II.3 – Emission Inventory                                         Pg. 8
             Table 11.1 – Reactive Organic Gases Projected Emission Inventory
             2006 Base Year – Stationary Sources                                Pg. 8
             Table 11.2 – Oxides of Nitrogen Projected Emission Inventory
             2006 Base Year – Stationary Sources                                Pg. 8

Figure. 1 Air Quality and Meteorological Stations in the NSVAB                  Pg. 14

Chapter III – Public Education Programs                                         Pg. 15
      Section III.1 – Introduction                                              Pg. 15
      Section III.2 – Education Programs                                        Pg. 15
      Section III.3 – District Programs                                         Pg. 15
              Butte County AQMD                                                 Pg. 16
              Colusa County                                                     Pg. 16
              Shasta County AQMD                                                Pg. 16
              Feather River District                                            Pg. 17
              Tehama County District                                            Pg. 17
              Glenn County APCD                                                 Pg. 18

Chapter IV – Transportation of Pollutants                                       Pg. 18
      Section IV.1 – Introduction                                               Pg. 18
      Section IV.2 – Definitions and Terminology                                Pg. 18
      Section IV.3 – Background                                                 Pg. 20
      Section IV.4 – The Central California Ozone Study (CCOS)                  Pg. 22

Chapter V – District Status of Feasible Control Measures                        Pg. 22
      Table V-I Planning Elements                                               Pg. 23
      Table V-II Feasible Measures Considered for Adoption                      Pg. 23
      Table V-III Feasible Measures Considered for Basin
      Wide Model Rule Development and Subsequent Adoption                       Pg. 25

Appendix A- NSVAB Ozone Trend Table and Graphs                                  Pg. 26

                                                                                        2
CHAPTER I – PLAN OVERVIEW
I.1 INTRODUCTION
The Air Pollution Control Districts and Air Quality Management Districts’ (Districts) for the
counties located in the northern portion of the Sacramento Valley together compromise the
Northern Sacramento Valley Planning Area (NSVPA). The NSVPA Districts have committed to
jointly prepare and adopt a uniform air quality attainment plan for the purpose of achieving and
maintaining healthful air quality throughout the air basin. This triennial update of the NSVPA
Air Quality Attainment Plan (Plan) addresses the progress made in implementing the 2009 Plan
and proposes modifications to the strategies necessary to attain the California ambient air quality
standard for the 8-hour ozone at the earliest practicable date. The 2012 Plan identifies those
portions of the NSVPA designated as “non-attainment” for the State ambient air quality
standards and discusses the health effects related to the various air pollutants. The Plan identifies
the air pollution problems which are to be cooperatively addressed on as many fronts as possible
in order to make the region a healthier place to live now and in the future. Like the 2006 and
2009 Plans, the 2012 Plan focuses on the adoption and implementation of control measures for
stationary sources, area wide sources, and indirect sources, and addresses public education and
information programs. The 2012 Plan also addresses the effect that pollutant transport has on the
ability of the NSVPA to meet and attain the State standards.
The California Air Resources Board (CARB) outlined in their 1994 State Implementation Plan
(SIP) for ozone, control strategies that were to be developed and implemented over the next
decade in California. This 2012 Plan contains the suggested control measures included in the
2009 Plan along with the Tier 1 Control Measures (Identification of Achievable Performance
Standards and Emerging Technologies for Stationary Sources – March 1998; Identification of
Performance Standards for Existing Stationary Sources – Last Reviewed, April 2010). These
control measures will reduce air pollution throughout California and will ensure continued
progress towards meeting or maintaining federal standards, and will aid in progression towards
California’s more stringent health protective State standards.
With the SIP as the State’s established control strategy for the future, the CARB found that the
NSVPA Districts would have to meet basic requirements as laid out in Health & Safety (H&S)
Code sections 40924 and 40925, which include the following:
1. Assessing progress towards achieving control measure commitments in the 2009
Triennial Plan;
2. Summarizing the last three years of ozone data to demonstrate improvement of air
quality, utilizing air quality indicators to be provided by CARB staff;
3. Comparing the expected versus actual emission reductions for each measure
committed to in the 2009 Triennial Plan; and
4. Updating control measure commitments and growth rates of population, industry, and
vehicle related emissions.
3I.2 LEGISLATIVE REQUIREMENTS
As specified in the California Clean Air Act of 1988 (CCAA), Chapters 1568-1588, it is the
responsibility of each District within the State to attain and maintain California’s ambient air
quality standards. The CCAA requires that an Attainment Plan be developed by all non-
attainment District’s for ozone (O3), carbon monoxide (CO), sulfur oxides (SOx), and nitrogen
oxides (NOx) that are either receptors or contributors of transported air pollutants. The purpose
of this Plan is to comply with the requirements of the CCAA as implemented through the
California Health and Safety Code (H&S Code). Districts in the NSVPA are required to update
the Plan every three years. This revision of the Plan satisfies the requirement for the December
31, 2012 update. The Plan is formatted to reflect the 2006 baseline emissions year with a
planning horizon of 2020. The H&S Code, Sections 40910 and 40913, require the Districts to
achieve State standards by the earliest practicable date to protect the public health, particularly
that of children, the elderly, and people with respiratory illness.
The H&S Code, Section 41503(b), requires that control measures for the same emission sources
are uniform throughout the planning area to the extent that is feasible. To meet this requirement,
the NSVPA has coordinated the development of this Attainment Plan and has set up a specific
rule adoption protocol. The protocol was established by the Technical Advisory Committee
(TAC) of the Sacramento Valley Basin wide Air Pollution Control Council and the Sacramento
Valley Air Quality Engineering and Enforcement Professionals, which allow the Districts in the
basin to act and work as a united group with the CARB as well as with industry in the rule
adoption process.
Section 40912 of the H&S Code states that each District responsible for, or effected by, air
pollutant transport shall provide for attainment and maintenance of the State and Federal
standards in both upwind and downwind Districts. This section also states that each downwind
District’s Plan shall contain sufficient measures to reduce emissions originating in each District
to below the levels which violate State ambient air quality standards, assuming the absence of the
transport contribution.
I.3 AREA DESCRIPTION
The area that this Plan specifically addresses is referred to as the NSVPA, and includes the
following counties located in the northern portion of the Sacramento Valley: Butte, Colusa,
Glenn, Shasta, Sutter, Tehama, and Yuba. The NSVPA is bounded on the north and west by the
Coastal Mountain Range and on the east by the southern portion of the Cascade Mountain Range
and the northern portion of the Sierra Nevada Mountains. These mountain ranges reach heights
in excess of 6000 feet above mean sea level (MSL), with individual peaks rising much higher.
This provides a substantial barrier to both locally created pollution and the pollution that has
been transported northward on prevailing winds from the Sacramento Metropolitan area.
Although a significant area of the NSVPA is at elevations higher than 1,000 feet above MSL, the
vast majority of its populace lives and works below that elevation. The valley is often subjected
to inversion layers that, coupled with geographic barriers and higher summer temperatures,
create a high potential for air pollution problems.
4I.4 AREA DESIGNATIONS
All of the Northern Sacramento Valley Air Districts, with the exception of Colusa and Glenn
counties, have been designated as non-attainment areas for the state standard for O3. Colusa and
Glenn counties have been designated as non-attainment transitional areas for O3 (California Air
Resources Board - Area Designations - February 21, 2012). In 2011 Glenn County was
designated as non-attainment for the state ozone standard of 0.09 parts per million with one hour
averaging time. This classification has since been amended, reverting Glenn County back to
non-attainment transitional for the ozone standard. The non-attainment transitional designation is
made by operation of law if, during a single calendar year, the state standard is not exceeded
more than three times at any monitoring location within the district.
In the NSVPA, ozone violations are caused in part, by combustion sources, and are occasionally
influenced by smoke impacts due to nearby wildfires. The primary emission source is the
internal combustion engine. The ozone problem is further aggravated by transport from the
Broader Sacramento Area (BSA), which is comprised of all of the Sacramento Metropolitan
AQMD, Yolo-Solano AQMD and a portion of El Dorado, Placer and Sutter counties. Ozone is
formed by a photochemical reaction of nitrogen oxides and reactive organic gases. These ozone
precursors are emitted as part of the exhaust of internal combustion engines in the NSVAB and
BSA and transported northward via prevailing winds. Due to the regional nature of the ozone
problem and the fact that the NSVAB counties share the same air basin with BSA, the
Attainment Plan is prepared in conjunction with the Sacramento Valley Air Basin Control
Council’s Technical Advisory Committee (TAC).
I.5 OVERVIEW OF AIR POLLUTANT HEALTH EFFECTS
Ozone
In the NSVAB, ozone is a seasonal problem, typically occurring during the months of May
through October. Sources for the pollutants, which react to form ozone, include motor vehicles,
power plants, factories, chemical solvents, combustion products from various fuels, and
consumer products.
Ozone acts as a strong irritant that attacks the body’s respiratory system. Symptoms include
shortness of breath, chest pain when inhaling deeply, wheezing and coughing. When ozone
levels are high, people with lung disease (e.g., chronic bronchitis, emphysema, and asthma) are
particularly susceptible to adverse health impacts.
Nitrogen Oxides
Nitrogen dioxide (NO2), a toxic reddish-brown gas, and nitric oxide (NO), a colorless gas,
comprise NOx (oxides of nitrogen). Because NOx is an ingredient in the formation of ozone, it
is referred to as an ozone precursor. NO2 is associated with adverse health effects, and is formed
in the atmosphere when NO is oxidized to NO2. Both NO2 and NO are produced by fuel
combustion.
5CHAPTER II - AIR MONITORING
II. 1 INTRODUCTION
This chapter of the California Clean Air Act Attainment Plan Update looks at NSVAB air quality
monitoring data and results from the past three years (2009-2011). This 2012 Plan Update is
concerned with the pollutant ozone for which the NSVAB has been designated non-attainment.
The Ambient Air Quality Standards establish the concentration at which the pollutant is known
to cause adverse health effects to sensitive groups within the population, such as children and the
elderly. Both the California and federal governments have adopted health-based standards for the
criteria pollutants, which include ozone, particulate matter (PM10 and PM2.5) and carbon
monoxide. In general, the air quality standards are expressed as a measure of the amount of
pollutant per unit volume of air. The ozone standard is expressed as parts per million (ppm).
II. 2 OZONE MONITORING
Ozone is a colorless gas with a pungent odor. It is the chief component of urban smog. Ozone is
not directly emitted as a pollutant, but is formed in the atmosphere when precursor emissions,
hydrocarbons and nitrogen oxides, react in the presence of sunlight. Generally, low wind speeds
or stagnant air coupled with warm temperatures and cloudless skies provide for the optimum
conditions for ozone formation. As a result, summer is generally the peak ozone season. Because
of the reaction time involved, peak ozone concentrations often occur far downwind of the
precursor emissions. Therefore, ozone is a regional pollutant that often impacts a widespread
area. In addition to adverse health effects, ozone causes damage to open vegetation, building
surfaces, exposed rubber surfaces, and certain exposed plastics.
Meteorology (weather) and topography play major roles in ozone formation. When the weather
is warm and the winds are light, a vertical downward motion of air and a natural cooling of the
earth’s surface act together to form an inversion that traps pollutants. Sunlight then causes a
chemical reaction between the hydrocarbons and nitrogen oxides to form ozone.
The Sacramento Valley is shaped like an elongated bowl. Temperature inversion layers can
clamp a lid on the bowl, allowing air pollution to rise to unhealthy levels. Weather conditions
cause air pollution concentrations to fluctuate widely from day to day and season to season.
Topography alone gives the NSVAB great potential for trapping and accumulating air pollutants.
The strong inversions typical of NSVAB summers are caused by subsidence, the slow sinking of
air causing compressional warming. The surface inversions typical of winter form primarily at
night as air is cooled when it contacts the earth’s cold surface; these are called radiation
inversions.
Temperature inversions prevent pollutants from rising and vertical dilution of pollutants. Thus,
pollutants remain trapped and are able to increase in concentration in the layer of air where
people breathe. Summer subsidence inversions occur on more than 90% of summer days; they
persist throughout the day and tend to intensify during the afternoon. Winter radiation inversions
6occur on more than 70% of winter nights, but are usually destroyed by daytime heating, bringing
a rapid improvement in air quality by afternoon. Both types of inversion mechanisms may exist
at any time of the year, and in the fall both may occur together to produce the heaviest pollution
potential.
Recognizing the adverse health impacts of daylong exposure, the United States Environmental
Protection Agency revised the 8-hour ozone standard in 2008. The State of California
promulgated an 8-hour ozone standard that became effective May 17, 2006.
AMBIENT AIR QUALITY STANDARDS FOR OZONE
State Ozone Standards: National Ozone Standards:
0.07 ppm for 8 hour -- not to be 0.075 ppm for 8 hours – expressed to three decimal
exceeded. Effective May 17, 2006. places.
0.09 ppm for 1 hour -- not to be Effective May 27, 2008
exceeded.
Ozone Summary
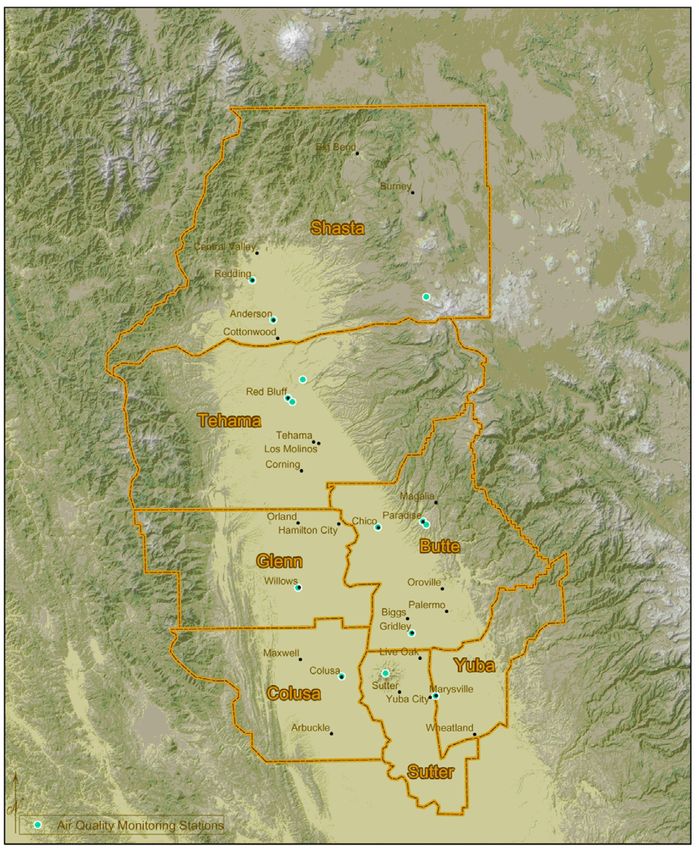
Figure 1 shows the placement of the air monitoring stations operating from 2009 through 2011 in
the NSVAB. The placement of the ozone monitors appears evenly distributed throughout the
NSVAB. Shasta County has four ozone monitors, one located in Redding, one in Anderson, one
in Lassen Volcanic National Park, and one at Shasta Lake; Butte County has two monitors, one
located in Chico, and one located in Paradise; Sutter County has two monitors, one located in
Yuba City, and one special use monitor on the Sutter Buttes; Tehama County has two monitors,
one in downtown Red Bluff, and one on the Tuscan Buttes; Glenn County has one monitor in
Willows; and Colusa County has one monitor in the town of Colusa. Currently there are twelve
ozone monitors operating in the NSVAB.
The State standard allows only one exceedance per year on average at any site within the Air
District in the preceding three-year period. This takes into account year-to-year weather
fluctuation and any exceptional exceedances. The California Air Resources Board has
established three categories of exceptional exceedances: (1) “exceptional events” (i.e. forest
fires); (2) “extreme concentration events”; and (3) “unusual concentration events”.
Ozone trends are variable and unique for each district within the NSVAB. During the past three-
year period, the Tuscan Butte-Tehama County and Paradise-Butte County monitors experienced
the highest number of ozone violations in the basin. The Sutter Buttes-Sutter County monitor
has exceeded the ozone standards on several occasions, but is indicative of ozone transport in the
valley and is not used for state attainment purposes. Depending on location, ozone
concentrations in the NSVAB have decreased or remained relatively constant over the past three
years. Population has generally remained unchanged and vehicle miles traveled (VMT) have
slightly decreased during the same period.
The air quality zone data contained in this Plan was provided by the CARB website at
www.arb.ca.gov/adam/welcome.html.
7II. 3 EMISSION INVENTORY
The California Air Pollution Control and Air Quality Management Districts and the California
Air Resources Board (ARB) develop the emission inventory and associated emissions
projections. The California Emission Forecasting System (CEFS) is the computer tool used to
develop the projections and the emission estimates are based on the most currently available
growth and control data. For mobile sources, CEFS integrates the emission estimates from the
EMFAC model. The emission projections are based on the 2011 inventory.
In the following tables are forecast emissions for the Sacramento Valley Air Basin for Reactive
Organic Gases (ROG) and Oxides of Nitrogen (NOx) for several source categories. The annual
average emissions are reported in tons per day for the years 2006, 2010, 2015 and 2020. The
projected emissions show a downtrend for both ROG and NOx, which are the precursor
emissions for ozone.
REACTIVE ORGANIC GASES PROJECTED EMISSION INVENTORY
2006 Base Year - Annual Average – Grown and Controlled
NORTHERN SACRAMENTO VALLEY AIR BASIN
All emissions are represented in Tons per Day and reflect the most current data provided to ARB.
STATIONARY SOURCES
SUMMARY CATEGORY NAME 2006 2010 2015 2020
FUEL COMBUSTION
ELECTRIC UTILITIES 0.053 0.054 0.055 0.056
COGENERATION 0.149 0.177 0.178 0.178
OIL AND GAS PRODUCTION (COMBUSTION) 0.561 0.611 0.611 0.611
MANUFACTURING AND INDUSTRIAL 0.384 0.395 0.427 0.448
FOOD AND AGRICULTURAL PROCESSING 0.278 0.273 0.265 0.259
SERVICE AND COMMERCIAL 0.133 0.133 0.133 0.131
OTHER (FUEL COMBUSTION) 0.124 0.116 0.110 0.109
* TOTAL FUEL COMBUSTION 1.682 1.759 1.779 1.792
WASTE DISPOSAL
SEWAGE TREATMENT 0 0 0 0
LANDFILLS 0 0 0 0
INCINERATORS 0 0 0 0
SOIL REMEDIATION 0 0 0 0
OTHER (WASTE DISPOSAL) 0.011 0.013 0.014 0.014
* TOTAL WASTE DISPOSAL 0.011 0.013 0.014 0.014
CLEANING AND SURFACE COATINGS
LAUNDERING 0.023 0.026 0.028 0.030
DEGREASING 1.317 1.309 1.347 1.381
COATINGS AND RELATED PROCESS SOLVENTS 1.261 1.349 1.448 1.530
PRINTING 0.030 0.036 0.037 0.038
8ADHESIVES AND SEALANTS 0.263 0.239 0.214 0.194
OTHER (CLEANING AND SURFACE COATINGS) 1.133 0.142 0.154 0.166
* TOTAL CLEANING AND SURFACE COATINGS 3.027 3.101 3.228 3.339
PETROLEUM PRODUCTION AND MARKETING
OIL AND GAS PRODUCTION 5.500 5.882 6.613 7.362
PETROLEUM REFINING 0.012 0.015 0.015 0.015
PETROLEUM MARKETING 1.750 1.771 1.852 2.001
OTHER (PETROLEUM PRODUCTION AND MARKETING) 0.005 0.006 0.006 0.007
* TOTAL PETROLEUM PRODUCTION AND MARKETING 7.267 7.674 8.486 9.385
INDUSTRIAL PROCESSES
CHEMICAL 0.240 0.312 0.328 0.345
FOOD AND AGRICULTURE 0.289 0.313 0.339 0.361
MINERAL PROCESSES 0.955 1.023 1.123 1.190
METAL PROCESSES 0 0 0 0
WOOD AND PAPER 0.175 0.186 0.204 0.218
ELECTRONICS 0 0 0 0
OTHER (INDUSTRIAL PROCESSES) 0.193 0.193 0.193 0.193
* TOTAL INDUSTRIAL PROCESSES 1.852 2.027 2.187 2.307
** TOTAL STATIONARY SOURCES 13.839 14.574 15.694 16.837
AREA-WIDE SOURCES
SUMMARY CATEGORY NAME 2006 2010 2015 2020
SOLVENT EVAPORATION
CONSUMER PRODUCTS 4.338 4.518 4.869 5.237
ARCHITECTURAL COATINGS AND RELATED PROCESS SOLVENTS 1.907 1.988 2.113 2.252
PESTICIDES/FERTILIZERS 3.122 2.932 2.852 2.775
ASPHALT PAVING / ROOFING 6.089 6.124 6.172 6.200
* TOTAL SOLVENT EVAPORATION 15.456 15.562 16.006 16.464
MISCELLANEOUS PROCESSES
RESIDENTIAL FUEL COMBUSTION 5.542 5.520 5.544 5.637
FARMING OPERATIONS 5.434 5.434 5.434 5.434
CONSTRUCTION AND DEMOLITION 0 0 0 0
PAVED ROAD DUST 0 0 0 0
UNPAVED ROAD DUST 0 0 0 0
FUGITIVE WINDBLOWN DUST 0 0 0 0
FIRES 0.020 0.020 0.022 0.023
MANAGED BURNING AND DISPOSAL 7.409 7.412 7.420 7.439
COOKING 0.101 0.108 0.116 0.122
* TOTAL MISCELLANEOUS PROCESSES 18.506 18.494 18.536 18.655
** TOTAL AREA-WIDE SOURCES 33.962 34.056 34.542 35.119
9MOBILE SOURCES
SUMMARY CATEGORY NAME 2006 2010 2015 2020
ON-ROAD MOTOR VEHICLES
LIGHT DUTY PASSENGER (LDA) 6.380 4.737 2.942 2.015
LIGHT DUTY TRUCKS - 1 (LDT1) 4.608 3.816 2.844 2.029
LIGHT DUTY TRUCKS - 2 (LDT2) 3.411 2.866 2.119 1.684
MEDIUM DUTY TRUCKS (MDV) 1.476 1.290 1.043 0.854
LIGHT HEAVY DUTY GAS TRUCKS – 1 (LHDV1) 0.810 0.544 0.451 0.439
LIGHT HEAVY DUTY GAS TRUCKS – 2 (LHDV2) 0.381 0.287 0.198 0.150
MEDIUM HEAVY DUTY GAS TRUCKS (MHDV) 0.983 0.743 0.423 0.196
HEAVY HEAVY DUTY GAS TRUCKS (HHDV) 0.353 0.234 0.118 0.067
LIGHT HEAVY DUTY DIESEL TRUCKS – 1 (LHDV1) 0.058 0.049 0.041 0.037
LIGHT HEAVY DUTY DIESEL TRUCKS – 2 (LHDV2) 0.039 0.038 0.033 0.026
MEDIUM HEAVY DUTY DIESEL TRUCKS (MHDV) 0.064 0.065 0.059 0.051
HEAVY HEAVY DUTY DIESEL TRUCKS (HHDV) 3.143 2.559 1.948 1.504
MOTORCYCLES (MCY) 1.255 1.136 1.088 1.174
HEAVY DUTY DIESEL URBAN BUSES (UB) 0.009 0.009 0.008 0.008
HEAVY DUTY GAS URBAN BUSES (UB) 0.007 0.006 0.005 0.005
SCHOOL BUSES (SB) 0.039 0.032 0.029 0.026
OTHER BUSES (OB) 0.054 0.046 0.033 0.025
MOTOR HOMES (MH) 0.121 0.091 0.056 0.029
* TOTAL ON-ROAD MOTOR VEHICLES 23.191 18.548 13.438 10.319
OTHER MOBILE SOURCES
AIRCRAFT 1.463 1.521 1.583 1.630
TRAINS 0.657 0.636 0.650 0.666
SHIPS AND COMMERCIAL BOATS 0 0 0 0
RECREATIONAL BOATS 8.213 7.320 6.686 6.410
OFF-ROAD RECREATIONAL VEHICLES 2.434 2.535 2.558 2.806
OFF-ROAD EQUIPMENT 4.398 3.615 2.925 2.575
FARM EQUIPMENT 2.756 2.262 1.530 0.997
FUEL STORAGE AND HANDLING 0.613 0.370 0.274 0.227
* TOTAL OTHER MOBILE SOURCES 20.534 18.259 16.206 15.311
** TOTAL MOBILE SOURCES 43.725 36.807 29.644 25.630
GRAND TOTAL FOR NORTHERN SACRAMENTO VALLEY 91.526 85.437 79.880 77.586
* Emissions from natural sources are excluded.
10OXIDES OF NITROGEN PROJECTED EMISSION INVENTORY
2006 Base Year - Annual Average – Grown and Controlled
NORTHERN SACRAMENTO VALLEY AIR BASIN
All emissions are represented in Tons per Day and reflect the most current data provided to ARB.
STATIONARY SOURCES
SUMMARY CATEGORY NAME 2006 2010 2015 2020
FUEL COMBUSTION
ELECTRIC UTILITIES 1.637 1.664 1.713 1.736
COGENERATION 2.175 2.374 2.375 2.376
OIL AND GAS PRODUCTION (COMBUSTION) 4.158 4.537 4.537 4.537
MANUFACTURING AND INDUSTRIAL 4.460 4.675 5.013 5.341
FOOD AND AGRICULTURAL PROCESSING 2.922 2.640 2.209 1.720
SERVICE AND COMMERCIAL 3.634 3.641 3.666 3.596
OTHER (FUEL COMBUSTION) 1.904 1.821 1.737 1.681
* TOTAL FUEL COMBUSTION 20.890 21.352 21.250 20.987
WASTE DISPOSAL
SEWAGE TREATMENT 0 0 0 0
LANDFILLS 0.008 0.009 0.010 0.011
INCINERATORS 0.002 0.002 0.003 0.004
SOIL REMEDIATION 0.034 0.039 0.045 0.045
OTHER (WASTE DISPOSAL) 0 0 0 0
* TOTAL WASTE DISPOSAL 0.044 0.050 0.058 0.060
CLEANING AND SURFACE COATINGS
LAUNDERING 0 0 0 0
DEGREASING 0 0 0 0
COATINGS AND RELATED PROCESS SOLVENTS 0.001 0.001 0.001 0.001
PRINTING 0 0 0 0
ADHESIVES AND SEALANTS 0 0 0 0
OTHER (CLEANING AND SURFACE COATINGS) 0.001 0.001 0.001 0.001
* TOTAL CLEANING AND SURFACE COATINGS 0.002 0.002 0.002 0.002
PETROLEUM PRODUCTION AND MARKETING
OIL AND GAS PRODUCTION 2.240 2.240 2.240 2.240
PETROLEUM REFINING 0 0 0 0
PETROLEUM MARKETING 0.065 0.065 0.065 0.065
OTHER (PETROLEUM PRODUCTION AND MARKETING) 0 0 0 0
* TOTAL PETROLEUM PRODUCTION AND MARKETING 2.305 2.305 2.305 2.305
INDUSTRIAL PROCESSES
CHEMICAL 0 0 0 0
FOOD AND AGRICULTURE 0.014 0.015 0.016 0.017
MINERAL PROCESSES 2.197 2.329 2.547 2.743
METAL PROCESSES 0 0 0 0
WOOD AND PAPER 0.081 0.086 0.094 0.100
11ELECTRONICS 0 0 0 0
OTHER (INDUSTRIAL PROCESSES) 0.066 0.066 0.098 0.098
* TOTAL INDUSTRIAL PROCESSES 2.358 2.496 2.755 2.958
** TOTAL STATIONARY SOURCES 25.599 26.205 26.370 26.312
AREA-WIDE SOURCES
SUMMARY CATEGORY NAME 2006 2010 2015 2020
SOLVENT EVAPORATION
CONSUMER PRODUCTS 0 0 0 0
ARCHITECTURAL COATINGS AND RELATED PROCESS
SOLVENTS 0 0 0 0
PESTICIDES/FERTILIZERS 0 0 0 0
ASPHALT PAVING / ROOFING 0 0 0 0
* TOTAL SOLVENT EVAPORATION 0 0 0 0
MISCELLANEOUS PROCESSES
RESIDENTIAL FUEL COMBUSTION 2.282 2.271 2.262 2.266
FARMING OPERATIONS 0 0 0 0
CONSTRUCTION AND DEMOLITION 0 0 0 0
PAVED ROAD DUST 0 0 0 0
UNPAVED ROAD DUST 0 0 0 0
FUGITIVE WINDBLOWN DUST 0 0 0 0
FIRES 0.007 0.007 0.007 0.008
MANAGED BURNING AND DISPOSAL 2.158 2.146 2.134 2.129
COOKING 0 0 0 0
* TOTAL MISCELLANEOUS PROCESSES 4.447 4.424 4.403 4.403
** TOTAL AREA-WIDE SOURCES 4.447 4.424 4.403 4.403
MOBILE SOURCES
SUMMARY CATEGORY NAME 2006 2010 2015 2020
ON-ROAD MOTOR VEHICLES
LIGHT DUTY PASSENGER (LDA) 4.856 3.747 2.357 1.508
LIGHT DUTY TRUCKS - 1 (LDT1) 4.335 3.552 2.524 1.647
LIGHT DUTY TRUCKS - 2 (LDT2) 4.315 3.419 2.321 1.617
MEDIUM DUTY TRUCKS (MDV) 2.278 1.895 1.387 0.992
LIGHT HEAVY DUTY GAS TRUCKS – 1 (LHDV1) 0.716 0.750 0.769 0.822
LIGHT HEAVY DUTY GAS TRUCKS – 2 (LHDV2) 0.272 0.262 0.241 0.239
MEDIUM HEAVY DUTY GAS TRUCKS (MHDV) 0.454 0.396 0.299 0.219
HEAVY HEAVY DUTY GAS TRUCKS (HHDV) 0.456 0.357 0.263 0.224
LIGHT HEAVY DUTY DIESEL TRUCKS – 1 (LHDV1) 1.606 1.086 0.775 0.580
LIGHT HEAVY DUTY DIESEL TRUCKS – 2 (LHDV2) 0.908 0.768 0.555 0.392
MEDIUM HEAVY DUTY DIESEL TRUCKS (MHDV) 3.002 2.664 1.879 1.276
12HEAVY HEAVY DUTY DIESEL TRUCKS (HHDV) 46.160 36.559 25.016 17.314
MOTORCYCLES (MCY) 0.299 0.322 0.338 0.378
HEAVY DUTY DIESEL URBAN BUSES (UB) 0.178 0.176 0.171 0.170
HEAVY DUTY GAS URBAN BUSES (UB) 0.024 0.022 0.023 0.025
SCHOOL BUSES (SB) 0.413 0.418 0.399 0.384
OTHER BUSES (OB) 0.146 0.144 0.115 0.086
MOTOR HOMES (MH) 0.369 0.353 0.294 0.229
* TOTAL ON-ROAD MOTOR VEHICLES 70.787 56.890 39.726 28.102
OTHER MOBILE SOURCES
AIRCRAFT 0.720 0.750 0.783 0.808
TRAINS 9.983 9.050 9.448 9.932
OCEAN GOING VESSELS 0 0 0 0
COMMERCIAL HARBOR CRAFT 0 0 0 0
RECREATIONAL BOATS 1.690 1.769 1.790 1.851
OFF-ROAD RECREATIONAL VEHICLES 0.122 0.137 0.165 0.207
OFF-ROAD EQUIPMENT 12.465 10.350 7.811 5.716
FARM EQUIPMENT 13.556 11.395 8.223 5.435
FUEL STORAGE AND HANDLING 0 0 0 0
* TOTAL OTHER MOBILE SOURCES 38.536 33.451 28.220 23.949
** TOTAL MOBILE SOURCES 109.323 90.341 67.946 52.051
GRAND TOTAL FOR NORTHERN SACRAMENTO
VALLEY 139.369 120.970 98.719 82.766
* Emissions from natural sources are excluded.
13Figure1. Air Quality and Meteorological Stations in the NSVAB
14CHAPTER III – PUBLIC EDUCATION PROGRAMS
III. 1 INTRODUCTION
The NSVAB continues to develop and implement public education programs in order to fulfill
the requirements of the CCAA. Section 40918(a)(6) of the California H&S Code states that
“Each District shall include provisions for public education programs to promote actions to
reduce emissions from transportation and area wide sources”. Public education and information
programs are important components of local and regional efforts to reduce air pollution.
III. 2 EDUCATION PROGRAMS
Many of the public education programs and projects have been funded using Vehicle
Registration Surcharge Fees (Vehicle Fees). These include the following:
Passenger fare transit subsidies
Transit operations
Purchase of transit buses
Bicycle lanes and trails
Electric “ZAP” bicycles
Other bicycle facilities (racks, lockers, etc.)
Carpool and transit subsidies
Electric vehicle conversions
Hybrid electric vehicle research and development
Public Service Announcements
Air Quality Education Exhibits
PM10 Reduction Strategies
Residential green waste recycling project
On-Road cleaner vehicle repowering
Greenhouse gases and global warming
The methodology used to provide education and information takes many forms: pamphlets,
brochures, public reports and public service announcements; presentations and workshops;
multimedia commercials, and promotions. Public education programs are targeted to a wide
audience, including the general public, academia, students from elementary to college level, the
medical community, the agricultural community, and the business community.
Information concerning sources of air pollution, health effects, property damage, the fiscal and
environmental impacts of air pollution, and what can be done to reduce air pollution continue to
be the primary focus of public education efforts.
III. 3 DISTRICT PROGRAMS
15Each District conducts its own public education program. Some elements are common and others
are unique.
Butte County AQMD Public Education Program includes a variety of activities as part of its
clean air strategy. These activities include the following:
Maintain the District’s website at www.bcaqmd.org
Forecast air quality index (AQI) and provide daily burn day information to the media
Utilize EnviroFlash for email/text messaging service for real time air quality events and
AQI
Manage the “Check Before You Light” advisory program during November through
February for residential wood burning
Participates in grant and incentive programs to remove older polluting equipment from
service
Develop and distribute District brochures on various air quality issues
Distribute CARB brochures and informational handbooks; encourage methods and
activities to help reduce air quality impacts
Provide presentations to schools, agricultural and business groups as requested
Participate in community events
Provide Press Releases and Public Service Announcements; maintain communication
channels with local media
Respond to public inquires and requests for information
Facilitate a teachers grant program to increase awareness and consider how our actions
affect air quality
Provide air quality expertise to outside organizations
Colusa County’s District office sponsors a Public Education program which includes the
following public outreach activities:
Distribution of pamphlets and brochures
Public service announcements/reports
Presentations on air pollution and health effects to elementary through high school
classes
Presentation to agricultural and business groups
Response to public inquiries
Shasta County AQMD community education efforts include a broad spectrum of activities
intended to increase public awareness of air quality issues and encourage people to reduce motor
vehicle emissions. These activities include but are not limited to the following:
Participation in community events such as District Fair, Boat & RV Show, and Earth Day
Presentations in school classrooms
Distribution of air quality pamphlets
Bike trails brochures printed and distributed
Press releases
Response to public inquiries
Operation of a smoking vehicle reporting program
Public service announcements via radio and television
16 Drive hybrid vehicles during inspections, complaints, meetings etc. during work hours
The display of hybrid vehicles at community events
Utilize the EnviroFlash online program for the public to access the Daily Air Quality
Index (AQI)
Webpage allowing public to access real-time ambient air quality, the visibility camera,
and most current Attainment Plan
The Feather River District office serves as a central point for public education and outreach.
The office maintains current announcements for news and events, provides residents with
opportunities to sign up for District mailing lists and air quality advisory alerts, and provides
educational handouts regarding open burning regulations. The District office also has available
brochures covering the following subject matter:
Air Quality Permits
Air Toxics Program
Enforcement Procedures
Agricultural Burning
Residential Burning
These brochures are available to the public at the front counter of the District offices along with
CARB educational “comic books”.
The Feather River District periodically speaks at organizational functions regarding air quality
programs such as Earth Day events, Rotary lunches, and special events at the local community
college. The District also staffs a booth at the annual Yuba-Sutter Fair to promote air quality and
disseminate information to the general public. The District maintains a web site at
http://www.fraqmd.org/, which provides updates on District events, current ambient air quality
readings, and educational materials for public access. Electronic feedback forms are used to
encourage air quality questions. The District responds to public and media questions and
concerns received by telephone, e-mail, postal mail and in person.
The Tehama County District office also maintains a website: http://www.tehcoapcd.net. The
District’s public education activities include:
Distribution of CARB brochures and instructional leaflets
Presentations to business groups and agricultural groups
Public service announcements
Response to public inquiries
The issuance of press releases
Presentations in school classrooms
Provide fliers on agricultural and residential burning and respond to questions and
concerns about burning
Provide air quality information whenever there is need for caution or concern
Answer questions on diesel engine pollution and global warming
Operate Carl Moyer Program and Equipment Replacement Program allowing for
successful turnover of older stationary and mobile farm equipment. The District
supplements this with AB 923 funds.
17The Glenn County District office sponsors a public education program which includes the
following outreach activities:
Distribute and display pamphlets, brochures, and Fact Sheets in English and Spanish
Newsletters
Public Service Announcements/Reports
Presentations on air pollution and health effects to elementary through high school
classes
Presentations to Agricultural and Business Groups
Presentations to the Board of Supervisors and other Government groups
Public workshops
Response to public inquiries
Maintain District web site: http://www.countyofglenn.net/govt/departments/air_pollution/
Attend and judge the Science Fair
Operate the County booth at the State Fair
CHAPTER IV – TRANSPORT OF POLLUTANTS
IV. 1 INTRODUCTION
This portion of the Attainment Plan addresses air pollution transport, identifies transport couples,
and discusses transport mitigation regulations related to the Upper Sacramento Valley (USV). A
review of amendments to the transport mitigation regulations and the relevance of the Central
California Ozone Study are also discussed.
Synopsis
The CARB has identified that air pollution is transported from the Broader Sacramento Area
(BSA) to the Upper Sacramento Valley (USV), thus establishing the BSA/USV Transport
Couple. The impacts of transported BSA air pollution to Districts in the USV are variable.
Transport pollution impacts are classified using the terms “Inconsequential”, “Significant”, and
“Overwhelming”, as defined in Section IV.2 below. The most recent CARB assessment,
published in March 2001, indicates that all three of these classifications occur in the BSA/USV
transport couple region, with the latest classification of “inconsequential” added to describe the
transport couple assessment for Shasta County.
IV. 2 DEFINITIONS AND TERMINOLOGY
Air Basin – an area sharing similar meteorological and geographic conditions; also defined by
political boundaries; an area in which the air mass is homogeneous; an area usually bounded by
topographical features.
Ambient Air Quality Standards specified concentrations and durations of air pollutants
which reflect the relationship between the intensity and composition of air pollution to adverse
18health effects. The standards are established by the CARB or, where applicable, by the federal
government.
Broader Sacramento Area (BSA) - includes the Sacramento Metropolitan Air Quality
Management District; Yolo-Solano Air Pollution Control District; the portions of the El Dorado
County Air Pollution Control District included in 1990 U.S. Census Tracts 306.01, 307, 308.01,
308.02, 308.03, 308.04, 309.01, 309.02, 310, 311, 312, 315.01, and 315.02; and the portions of
the Placer County Air Pollution Control District included in 1990 U.S. Census Tracts 203, 204,
205, 206.01, 206.02, 206.03, 207.01, 207.02, 207.03, 208, 209, 210.01, 210.02, 211.01, 211.02,
212, 213.01, 213.02, 214, 215.01, 215.02, 216, 218.01, and 218.02; and that area of the Feather
River Air Quality Management District which is south of a line connecting the northern border
of Yolo County to the southwestern tip of Yuba County, and continuing along the southern Yuba
County border to Placer County.
Couple – a pair of geographic areas, one considered upwind and one considered downwind.
Exceedance – any ozone concentration greater than the ambient air quality standard for ozone.
Extreme Concentration – a concentration that is statistically expected to occur less frequently
than once every year
Inconsequential – an ozone transport impact classification describing a condition that exists
when upwind emissions are not transported or do not appear to contribute significantly to a
violation of the State ozone standard in the downwind area. A violation not impacted by
transported emissions is considered local and results when the wind flow patterns and
atmospheric conditions do not strongly suggest responsibility from an upwind area. The
responsibility of “inconsequential” transport lies with the downwind area.
Mitigation – in air pollution control, mitigation refers to those measures that are taken to prevent
or reduce emissions in the atmosphere. Mitigation may include: (1) the adoption and
enforcement of local District rules and regulations to regulate emissions from stationary sources;
(2) land-use and transportation control measures achieved through the California Environmental
Quality Act (CEQA); and (3) the adoption of State and national regulations to reduce emissions
through fuel reformulation and new engine technologies.
Model – a computer-based representation of atmospheric processes used to develop emission
inventories, determine dispersion of pollutants, and predict downwind concentrations and
impacted areas.
Overwhelming – an ozone transport impact classification describing a condition which exists
when emissions from an upwind area independently cause a violation of the State ozone standard
in a downwind area on any given day. This classification assumes that significant emission
sources in the downwind area were not in the pathway of the air parcel being transported from
the upwind area. The responsibility for a violation caused by “overwhelming” transport lies with
the upwind area.
19Particulate Matter any material, except uncombined water, that exists in finely divided form
as a liquid or solid at standard conditions.
Precursor a directly emitted pollutant that, when released to the atmosphere, forms, or
contributes to the formation of a secondary pollutant for which an ambient air quality standard
has been adopted
Precursor Secondary Air
Reactive Organic Compound Photochemical Oxidants (Ozone)
The Organic Fraction of PM10
Nitrogen Oxides Nitrogen Dioxide
The Nitrate Fraction of PM10
Photochemical Oxidants (Ozone)
Sulfur Oxides Sulfur Dioxide
Sulfates
The Sulfate Fraction of PM10
Profiler – equipment that provides continuous winds aloft measurements using the Doppler shift
principle and radar waves.
Reactive Organic Gases any compound of carbon, other than the following: methane, carbon
monoxide, carbon dioxide, carbonic acid, metallic carbides or carbonates, ammonium
carbonates, and halogenated hydrocarbons.
Significant – an ozone transport impact classification describing a condition in which the
emissions from the upwind area contributed measurably to a violation of the State ozone
standard in the downwind area on any given day, but did not “overwhelm” the area. A violation
is considered to be caused by “significant” transport if the emissions from sources within the
downwind area combine with the transported air parcel carrying ozone or ozone precursors from
the upwind area. A violation classified as “significant” is considered shared, with responsibility
lying with both the upwind and downwind areas.
Transport – horizontal movement of air pollution or air pollution precursors at the earth's
surface or aloft. Vertical movement of air pollution is referred to as mixing.
Upper Sacramento Valley (USV) - includes the Colusa, Butte, Glenn, Tehama, and Shasta
County Air Pollution Control Districts, and that area of the Feather River Air Quality
Management District which is north of a line connecting the northern border of Yolo County to
the southwestern tip of Yuba County and continuing along the southern Yuba County border to
Placer County.
IV. 3 BACKGROUND
The CCAA requires each District in which a State ambient air quality standard for ozone, carbon
dioxide, sulfur dioxide, or nitrogen dioxide is exceeded to develop a plan and an emission
control program in order to attain the State standard(s). The CCAA recognizes that ozone and
20ozone precursors can be transported by winds over long distances and thereby contribute to air
quality problems outside of the District or air basin of origination. To address this, the CCAA
requires upwind Districts to mitigate the impacts to downwind areas by pollutants that are
originally emitted in the upwind Districts (see section 39610 of the H&S Code) even though the
downwind District may have a shared or sole responsibility for air quality impacts. The CCAA
directs the CARB to assess the impacts of such transport and to establish mitigation requirements
for upwind Districts.
In terms of identifying transport couples and assessing the downwind impacts, the CCAA directs
the CARB to:
1. Identify downwind areas affected by transported air pollutants and the upwind air basins
or regions that are the sources of the pollutants;
2. Assess the relative contribution of upwind emissions to downwind ozone concentrations
as “overwhelming”, “significant”, “inconsequential”, or some combination thereof, to
the extent permitted by available data [H&S Code, section 39610(a) and (b)]; and
3. Update this analysis at least once every three years [H&S Code, section 39610(d)].
In terms of transport mitigation the CCAA requires that:
Districts within the areas of origin of transported air pollutants shall include sufficient emission
control measures in their Attainment Plans for ozone in order to mitigate the impacts of pollution
sources within their jurisdictions on ozone concentrations in downwind areas. At a minimum,
the Attainment Plans for Districts within the BSA shall conform to the following requirements:
1. Require the adoption and implementation of best available retrofit control technology (as
defined in H&S Code, section 40406) on all existing stationary sources of ozone
precursor emissions as expeditiously as practicable. At a minimum, the Plan shall
provide for the adoption of rules that represent best available retrofit control technology
for source categories that collectively amount to 75 percent of the 1987 actual reactive
hydrocarbon emissions inventory for permitted stationary sources, and 75 percent of the
1987 actual nitrogen oxides emissions inventory for permitted stationary sources, no later
than January 1, 1994.
2. Include measures sufficient to attain the State ambient air quality standard for ozone by
the earliest practicable date within the USV, except as provided in H&S Code section
41503(d), during air pollution episodes which the State board has determined meet the
following conditions:
a. Are likely to produce a violation of the State ozone standard in the USV or within
the portion of the Mountain Counties Air Basin which is north of the Calaveras-
Tuolumne County border and south of the Sierra-Plumas County border;
b. Are dominated by overwhelming pollutant transport from the BSA; and
c. Are not measurably affected by emissions of ozone precursors from sources
located within the USV or the portion of the Mountain Counties Air Basin which
21is north of the Calaveras-Tuolumne County border and south of the Sierra-Plumas
County border.
Implementation of these requirements will be through the BSA Districts’ Attainment Plans.
IV. 4 The Central California Ozone Study (CCOS)
As a result of the transport assessments performed over the last decade as required by State and
federal transport regulations and more recently by the California Ozone Studies, air quality
professionals have developed a basic understanding of the fundamental transport relationships
between the various upwind and downwind regions of California.
The California Ozone Studies include the 1997 Southern California Ozone Study (SCOS) and
the 2000 Central California Ozone Study (CCOS). The CCOS was conducted on the geographic
region extending from Redding in the north to the Mojave Desert in the south, and from the
Pacific Ocean in the west to the Sierra Nevada Mountains in the east. These studies will be
invaluable in updating transport assessments and preparing future clean air Plans. The CARB
and Districts plan to use the results of the CCOS to prepare the demonstration of attainment for
the ozone standard for non-attainment areas in central California. The data gathering component
of the CCOS was conducted during the summer of 2000. Emission inventory development, data
analysis and modeling are on-going projects.
One goal of the CCOS project is to develop modeled attainment demonstrations which are
required in federal ozone air quality plans. The modeling will also be useful to further refine the
understanding of transport relationships in California during selected ozone episodes. CARB
staff is working with stakeholders to identify approaches to better assess transport impacts using
the study results. These analyses were included in the 2003-2004 SIP development process for
Districts in the CCOS domain – including the San Francisco Bay Area, San Joaquin Valley, and
Sacramento region. A number of CCOS projects are being fast-tracked in order to provide results
that can be used in developing attainment demonstrations for these Districts. As a part of these
analyses, the impact of upwind control strategies on downwind ozone formation will be
evaluated.
Chapter V – District Status of Feasible Control Measures
Under the California Clean Air Act (CCAA), districts are to develop plans to attain the State
ambient air quality standard for ozone by the earliest practicable date. As part of this plan, the
CCAA requires districts that are unable to achieve five percent annual emission reductions to
demonstrate to the ARB's satisfaction that it has included every feasible measure and an
expeditious adoption schedule. Since the CCAA did not define the term, every feasible measure,
the Air Resources Board (ARB) developed a tiered list of measures ARB considers feasible.
Using the definition of “feasible” used for California Environmental Quality Act (CEQA)
guidelines, ARB has determined that, at a minimum, a district consider regulations that have
been successfully implemented elsewhere.
22Using this approach, ARB developed the document “Identification of Performance Standards for
Existing Stationary Sources – A Resource Document.” This document identifies control
measures and ranks them into three tiers, based on their emissions and emission reduction
potential. As part of the Triennial Plan review, member air districts in the Northern Sacramento
Valley Air Basin (NSVAB) reviewed the control measure lists and existing emission inventories
to evaluate potential reductions and prioritize rule development efforts.
Table V identifies and lists these feasible measures. Part I identifies the feasible measures that
are part of the planning strategies and not usually directly associated with stationary sources. Part
II identifies the rule adoption status for each feasible measure by air district in the NSVAB. In
the table, each district has coded and dated the status of a rule to address the measure as adopted
(A), as scheduled (S) or as having been considered by a district board but not adopted (C). Part
III identifies control measures to be considered for model rule development by the NSVAB and a
target date for these rules to be completed. Only those categories applicable to the NSVAB and
showing promise for emission reductions were listed as proposed new measures. Due to the
regional nature of the ozone non-attainment status in the NSVAB, it is anticipated that adoption
of the new regulations to address control measures will benefit air quality for all air districts
within the NSVAB even though some of the sources affected by the control measures may not
exist in each air district within the NSVAB planning area.
Table V-I – Planning Elements
Feather
Planning Element Butte Colusa Glenn Shasta Tehama
River
A A A A A
Air Quality Element C
(01/08) (6/10) (6/93) (04/94) (11/07)
A
Smoking Vehicle Program SVP SVP SVP SVP SVP
(10/01)
Transportation Control Measure / A A S (1/93) A
C
CEQA Guidelines (01/08) (6/10) (2015) A (10/09)
NOTES:
District anticipates considering the rule for adoption, estimated date for
S – Scheduled (date)
consideration
Rule has been considered adopted by District; most recent
A – Adopted (date)
adopted/amended date
C – Considered Rule has been considered, but not adopted by board
SVP – Smoking Vehicle Program District relies on ARB Smoking Vehicle Program
Table V-II – Feasible Measures Considered for Adoption
Feather
Control Measure Butte Colusa Glenn Shasta Tehama
River
C A S A A
Adhesives and Sealants C
(03/08) (05/02) (2017) (07/05) (04/03)
23Feather
Control Measure Butte Colusa Glenn Shasta Tehama
River
A A A S A A
Architectural Coatings
(04/02) (05/91) (05/96) (2014) (07/05) (08/02)
A A A A A A
Automobile Finish Coatings
(06/07) (03/98) (08/98) (05/99) (06/97) (11/98)
A A A A A
Cutback Asphalt NAS
(01/95) (12/93) (09/94) (06/95) (02/94)
A A A A A A
Disposal of Organic Waste
(03/03) (01/96) (08/11) (07/98) (06/95) (03/95)
A A
Gas Turbines NAS
(03/98)
C NAS C (04/98)
Gasoline Terminals and Bulk A A A A A A
Plants (06/05) (03/98) (06/91) (12/72) (06/97) (04/98)
S S (2020 S
Graphic Arts NAS C
( 2015) (2014) S (11/17)
A A A A A A
Industrial Boilers
(03/04) (01/96) (06/06) (07/98) (12/95) (03/95)
A A A A A A
Internal Combustion Engines
(12/04) (03/98) (06/09) (05/10) (04/97) (06/97)
A A A A A
Landfills NAS
(08/02) (06/97) (05/99) (04/97) (06/97)
Metal Parts and Products S A S (2020) S
NAS
Coatings ( 2014) (07/06) (2014) S (11/17)
A A S A A A
Polyester Resin Operations
(09-05) (01/96) (2017) (07/98) (06/95) (03/95)
A S A A (3/95) A
Residential Wood Combustion
(12/08) (2020) (10/09) (11/94) A (03/95)
A A A A (6/95) A
Solvent Degreasing
(09/05) (01/96) (09/11) (07/98) A (03/95)
Vapor Recovery Systems for A A A (12/88) A
NAS
Gasoline Distributors (06/05) (03/98) (11/98) A (04/98)
S A A S
Wood Products Coatings NAS C
(08/13) (12/05) (07/05) (11/17)
NOTES:
District anticipates considering the rule for adoption, estimated date for
S - Scheduled (date)
consideration
Rule has been considered adopted by District; most recent
A - Adopted (date)
adopted/amended date
C - Considered Rule has been considered, but not adopted by board
NAS - No Applicable Sources District does not have applicable sources within District
24Table V-III –Feasible Measures Considered for Basin-wide Model Rule Development and
Subsequent Adoption
Composting Facilities
Fugitive Emissions From Oil and Gas Production
Residential Water Heaters
Surface Coatings of Plastic Parts and Products
Usage of Solvent
Suggested Control Measure for Architectural Coatings (2007 Update)
Suggested Control Measure for Automotive Coatings (2005 Update)
25Appendix A
NSVAB Ozone Trend Table and Graphs
Ozone Trend Summary: Chico - Manzanita Avenue - Butte County
1-Hour
Days > Standard Observations 8-Hour Averages
1- Hour 8-hour National
Maximum Maximum Standard Design
Year State State National Value
2011 0 0 0 0.080 0.068 0.066
2010 0 1 0 0.077 0.070 0.071
2009 0 2 0 0.080 0.073 0.074
2008 2 14 6 0.111 0.096 0.076
2007 0 10 3 0.094 0.084 0.074
2006 0 19 4 0.090 0.080 0.073
Ozone Trend Summary: Chico - Paradise Airport - Butte County
1-Hour
Days > Standard Observations 8-Hour Averages
1- Hour 8-hour National
Maximum Maximum Standard Design
Year State State National Value
2011 0 16 6 0.094 0.081 0.077
2010 0 14 4 0.085 0.078 0.079
2009 1 35 13 0.099 0.088 0.082
2008 3 23 16 0.125 0.108 0.085
2007 1 30 12 0.102 0.095 0.084
2006 8 59 33 0.104 0.094 0.084
Ozone Trend Summary: Colusa - Sunrise Blvd - Colusa County
1-Hour
Days > Standard Observations 8-Hour Averages
1- Hour 8-hour National
Maximum Maximum Standard Design
Year State State National Value
2011 0 0 0 0.090 0.066 0.062
2010 0 1 1 0.082 0.076 0.066
2009 0 0 0 0.078 0.068 0.068
2008 0 6 1 0.091 0.081 0.069
2007 0 0 0 0.080 0.067 0.067
2006 0 2 1 0.084 0.076 0.067
26Ozone Trend Summary: Willows - N. Colusa Street - Glenn
County
1-Hour
Days > Standard Observations 8-Hour Averages
1- Hour 8-hour National
Maximum Maximum Standard Design
Year State State National Value
2011 0 1 0 0.082 0.072 0.065
2010 0 0 0 0.076 0.064 0.066
2009 0 4 0 0.085 0.075 0.069
2008 0 2 0 0.085 0.071 *
2007 0 3 2 0.091 0.078 *
2006 0 0 0 0.086 0.070 *
Ozone Trend Summary: Anderson - North Street - Shasta County
Days > Standard 1-Hour Observations 8-Hour Averages
1- Hour 8-hour National
Maximum Maximum Standard Design
Year State State National Value
2011 0 0 0 0.079 0.065 0.069
2010 0 0 0 0.089 0.075 0.075
2009 0 9 1 0.091 0.077 0.076
2008 1 24 11 0.097 0.091 0.076
2007 0 19 3 0.084 0.080 0.076
2006 0 7 1 0.092 0.079 0.078
Ozone Trend Summary: Lassen Volcanic National Park - Manzanita Lake - Shasta County
Days > Standard 1-Hour Observations 8-Hour Averages
1- Hour 8-hour National
Maximum Maximum Standard Design
State State National Value
Year
2011 0 0 0 0.075 0.066 0.064
2010 0 1 0 0.078 0.072 0.070
2009 0 0 0 0.079 0.066 0.074
2008 2 14 8 0.115 0.104 0.077
2007 0 11 4 0.084 0.078 0.072
2006 0 17 1 0.091 0.077 0.069
27Ozone Trend Summary: Redding Health Dept - Shasta County
1-Hour
Days > Standard Observations 8-Hour Averages
1- Hour 8-hour National
Maximum Maximum Standard Design
State State National Value
Year
2011 0 0 0 0.073 0.064 0.064
2010 0 0 0 0.077 0.065 0.069
2009 0 0 0 0.084 0.069 0.071
2008 0 13 4 0.090 0.082 0.075
2007 0 5 0 0.089 0.073 0.078
2006 2 19 9 0.107 0.086 0.080
Ozone Trend Summary: Shasta Lake - Lake Blvd - Shasta County
1-Hour
Days > Standard Observations 8-Hour Averages
1- Hour 8-hour National
Maximum Maximum Standard Design
Year State State National Value
2011 0 5 1 0.083 0.076 *
2010 0 13 2 0.089 0.076 *
2009 0 1 0 0.081 0.070 *
2008 * * * * * *
2007 * * * * * *
2006 * * * * * *
Ozone Trend Summary: Sutter Buttes - S. Butte Road -Sutter
County
1-Hour
Days > Standard Observations 8-Hour Averages
1- Hour 8-hour National
Maximum Maximum Standard Design
Value
Year State State National
2011 1 8 3 0.096 0.079 *
2010 0 3 0 0.091 0.075 0.076
2009 0 7 2 0.090 0.077 0.079
2008 5 27 12 0.128 0.113 0.085
2007 1 19 7 0.098 0.085 0.081
2006 5 43 23 0.110 0.097 0.082
28Ozone Trend Summary: Yuba City - Almond Street - Sutter
County
1-Hour
Days > Standard Observations 8-Hour Averages
1- Hour 8-hour National
Maximum Maximum Standard Design
Year State State National Value
2011 0 0 0 0.074 0.067 0.065
2010 0 1 0 0.089 0.075 0.066
2009 0 1 1 0.089 0.076 0.068
2008 0 2 1 0.092 0.080 0.072
2007 1 6 3 0.095 0.081 0.074
2006 1 13 4 0.102 0.081 0.074
Ozone Trend Summary: Red Bluff - Oak Street - Tehama County
1-Hour
Days > Standard Observations 8-Hour Averages
1- Hour 8-hour National
Maximum Maximum Standard Design
State State National Value
Year
2011 0 2 0 0.081 0.072 *
2010 1 14 5 0.097 0.081 0.078
2009 0 16 5 0.093 0.080 0.076
2008 1 13 8 0.099 0.092 0.075
2007 0 6 1 0.085 0.076 *
2006 0 15 3 0.094 0.081 *
Ozone Trend Summary: Tuscan Buttes - Tehama County
1-Hour
Days > Standard Observations 8-Hour Averages
1- Hour 8-hour National
Maximum Maximum Standard Design
Year State State National Value
2011 0 14 1 0.082 0.077 0.076
2010 0 14 4 0.090 0.077 0.080
2009 0 27 7 0.088 0.081 0.082
2008 4 31 15 0.118 0.104 0.085
2007 0 32 14 0.091 0.087 0.083
2006 4 48 34 0.099 0.092 0.083
Footnotes:
All concentrations expressed in parts per million (ppm).
State Ozone ambient air quality standard 1- hour is 0.09 ppm.
State Ozone ambient air quality standard 8- hour is 0.07 ppm.
National Ozone ambient air quality standard 8-hour is 0.075 ppm.
* There was insufficient (or no) data available to determine the value.
29You can also read


