2020 Social Impact
Assessment of
Gambling in the
Whanganui District
2020
←
→
Page content transcription
If your browser does not render page correctly, please read the page content below
2020 Social Impact Assessment of Gambling in the Whanganui District 2020
1. Executive summary
This Social Impact Assessment of Gambling in the Whanganui District identifies trends in class 4
gaming machine and TAB gambling in Whanganui and the social impacts on communities for the
review of Council’s existing Gambling Venues Policy 2017 (incorporating both class 4 gambling venues
and TAB venues).
Whanganui District residents are at risk of problem gambling and gambling-related harm due
to: all but one of the class 4 venues are located in high deprivation areas, and 26% and 3.6 per
cent of residents identify as Māori and Pasifika respectively.
Total number of pokies have decreased since 2013 from 257, to 208 as of June 2020;
Whanganui has one standalone TAB venue and 14 class 4 venues.
Whanganui District has a total of 1 electronic gaming machine for every 218 people, slightly
higher than the national average of 1 electronic gaming machine per 338 people.
Gamblers in New Zealand spent $2,402 million dollars on the four main forms of gambling in
the 2019 financial year, 1.2 per cent less than last year, once adjusted for inflation. Gaming
machines outside of casinos saw the greatest share of spend.
For Whanganui, Gaming Machine Proceeds (GMP - total pokie revenue generated minus
payouts) totalled $10,735,860 in 2019. This is an increase of $270,796 (2.5%) on the total in
2018.
GMP per class 4 gaming machine has risen steadily since 2015 in Whanganui despite a
decrease in machine numbers, which could be attributed to more people partaking in class 4
gambling, or people who normally gamble doing so at a higher frequency.
Negative social impacts of gambling include -
o Decrements to physical and mental health (both morbidity and mortality);
o Emotional or psychological distress;
o Financial harm;
o Reduced performance at work or education;
o Relationship disruption and harm to others, including parenting issues and domestic
abuse;
o Criminal activity; and
o Alcohol and other addiction.
Gambling harm is often hidden, but when recognised can manifest itself as crime, violence
and violent crime, issues with physical and mental health, negatively impact relationships, and
loss of productive/employment.
Nationally, 0.2% of the adult population are estimated to be problem gamblers; applied to
Whanganui this is 91 people. However research has suggested that reducing the issue of
gambling to ‘problem’ categories is inadequate to accurately capture harmful gambling
behaviour.
A 2014 local non-representative study found 18% of respondents said gambling had a negative
effect on their lives.
1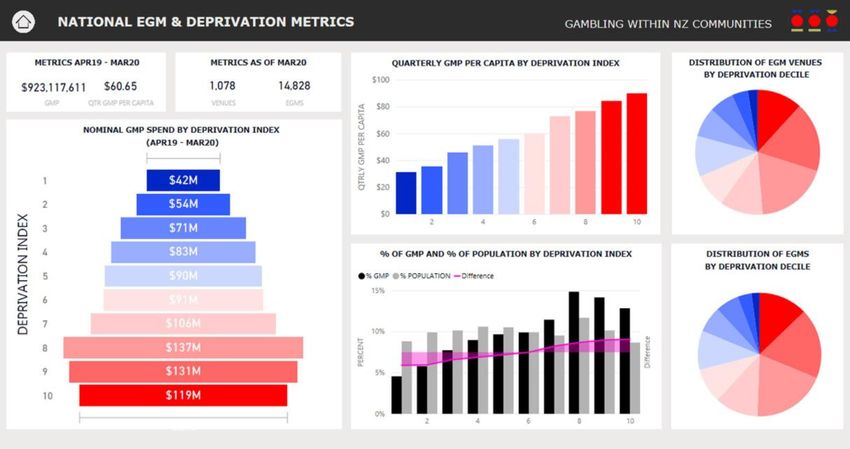
Total clients residing in Whanganui who have accessed gambling harm intervention services
reached a total of 51 in 2017/18; a sharp increase from 2016/17 (27) and above the previous
highest number, 42 in 2014/15.
Whanganui lost $56.88 per head for the 2019 June quarter. This is the 21st highest loss out of
66 territorial authorities.
GMP by June 2020 was at $1,422,993, a nearly 50% decrease on the same period in 2019. This
is likely to do with all venues being closed for around eight weeks due to COVID-19 restrictions,
which could, in turn, connect the availability of gambling venues to gambling spend and other
forms of gambling harm.
Positive social impacts of gambling include:
o Entertainment;
o Job creation; and
o Funding sports groups and community services.
In 2019, $1,236,935.60 was granted to community groups and organisations in the Whanganui
District from GMP.
International and domestic visitors spent a total of $2,580,646 on cultural, recreation, and
gambling services in 2018.
2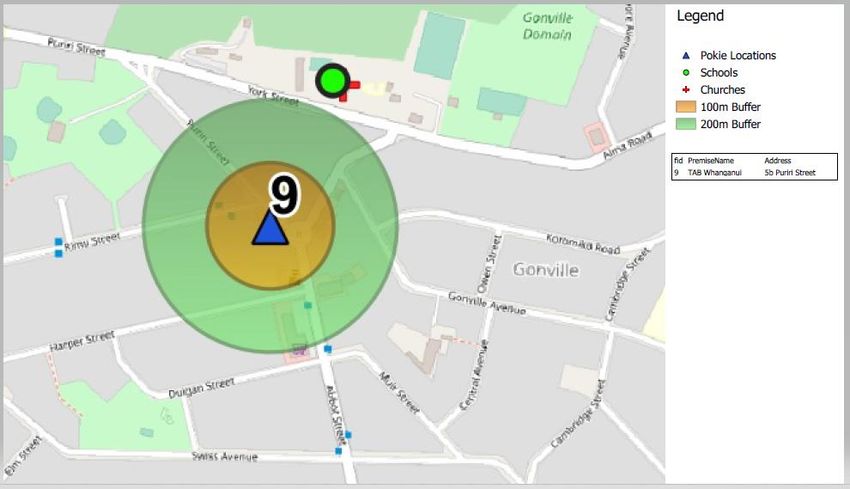
Contents
1.        Executive summary ......................................................................................................................... 1
2.        Introduction .................................................................................................................................... 5
     2.1.        Purpose ................................................................................................................................... 5
     2.2.        Scope ....................................................................................................................................... 5
3.        BACKGROUND ................................................................................................................................. 5
     3.1.        Legislative framework ............................................................................................................. 5
     3.1.1.          Gambling Act 2003 and the Racing Act 2003 ...................................................................... 5
     4.      METHODOLOGY .......................................................................................................................... 6
5.        Results ............................................................................................................................................. 6
     5.1.        Demography of the district’s residents................................................................................... 6
     5.1.1.          Population highlights .......................................................................................................... 6
     5.1.2.          Population ........................................................................................................................... 7
     5.1.3.          Service age groups .............................................................................................................. 8
     5.1.4.          Ethnicity .............................................................................................................................. 8
     5.2.        Class 4 gambling venues ......................................................................................................... 9
          5.2.1.         Number of class 4 gambling machines. .......................................................................... 9
          5.2.2.         Location of class 4 gambling venues. ............................................................................ 10
          5.2.3.         Density .......................................................................................................................... 12
     5.3.        TAB venues............................................................................................................................ 12
     5.4.        Gambling venue locations and socioeconomic deprivation ................................................. 13
     5.5.        National gambling trends...................................................................................................... 16
     5.6.        Gaming Machine Proceeds ................................................................................................... 16
     5.7.        Social impacts of gambling - Costs ........................................................................................ 19
          5.7.1.         Decrements to health ................................................................................................... 20
          5.7.2.         Emotional or psychological distress. ............................................................................. 21
          5.7.3.         Financial harm ............................................................................................................... 21
          5.7.4.         Reduced performance at work or education ................................................................ 22
          5.7.5.         Relationship disruption, and harms to others .............................................................. 22
          5.7.6.         Link between gambling and family violence. ................................................................ 22
          5.7.7.         Criminal activity ............................................................................................................ 23
          5.7.8.         Problem gambling ......................................................................................................... 24
          5.7.9.         Regressive tax effect and economic regional output leakage ...................................... 24
          5.7.10.        Class 4 gambling loss per head ..................................................................................... 25
          5.7.11.        Local evidence of harm from gambling......................................................................... 26
          5.7.12.        Preventing and minimising gambling harm intervention services ............................... 27

                                                                                3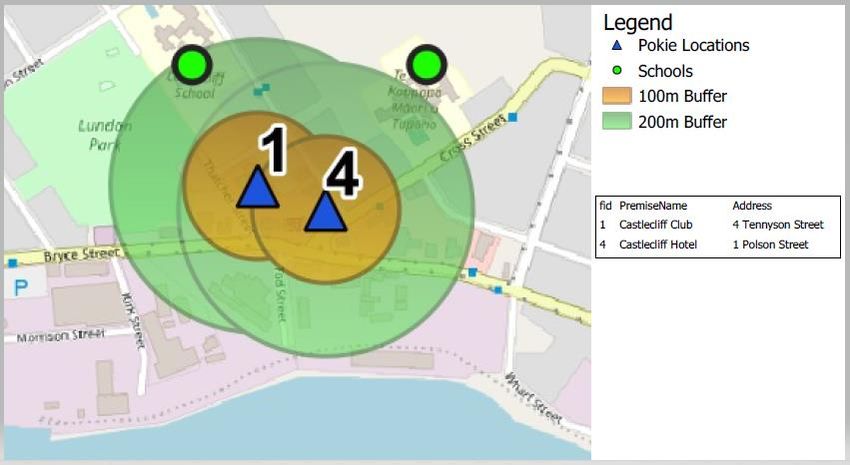
5.8.      Social impacts of gambling - Benefits ................................................................................... 28
       5.8.1.         Distribution of class 4 Gaming Machine Proceeds........................................................ 28
       5.8.2.         Economy and Employment ........................................................................................... 31
       5.8.3.         Entertainment ............................................................................................................... 31
6.     Conclusion ..................................................................................................................................... 32

Figure 1: Number of class 4 gambling machines for Whanganui from 2012 to March 2020 ............... 10
Figure 2: Location of class 4 gambling venues in Whanganui 2020 ..................................................... 11
Figure 3: Location of class 4 gambling venues within 200m of sensitive sites- town centre ............... 11
Figure 4: Location of class 4 gambling venues within 200m of sensitive sites- Gonville ...................... 12
Figure 5: Location of standalone TAB venue in Whanganui- 2020 ....................................................... 13
Figure 6: EGM prevalence and spend by deprivation index ................................................................. 14
Figure 7: Location of class 4 venues vs deprivation .............................................................................. 15
Figure 8: National gambling trends- FY 2010/11 to 2018/19 ............................................................... 16
Figure 9: Gaming machine proceeds Whanganui vs New Zealand- 2012 to 2020 ............................... 17
Figure 10: Social impacts of problem gambling .................................................................................... 19
Figure 11: Class 4 gambling loss per head ............................................................................................ 26
Figure 12: Gambling intervention service client data for Whanganui- FY2011/12 to FY2017/18........ 27
Figure 13: Grants made by pokie trusts ................................................................................................ 29
Figure 14: Grants from gaming machine proceeds to Whanganui by main categories: 1/1/19 –
31/12/19 ............................................................................................................................................... 29
Figure 15: Main recipients of grants distribution from GMP 1/1/2018 – 31/3/2020 .......................... 30
Figure 16: Pokie trusts and share of grants distributed for 1/1/2018 – 31/3/2020 ............................. 30

Table 1: Whanganui District population highlights-2018 ....................................................................... 6
Table 2: Whanganui District population- 2018 ....................................................................................... 7
Table 3: Whanganui District population by census area- 2018 .............................................................. 8
Table 4: Whanganui District usually resident population by age group – 2013 & 2018 ........................ 8
Table 5: Whanganui District population by ethnicity - 2018 .................................................................. 9
Table 6: Number of class 4 gambling machines for Whanganui from 2012 to March 2020 .................. 9
Table 7: Location of class 4 gambling venues in Whanganui- March 2020 .......................................... 11
Table 8: Socioeconomic deprivation dimensions ................................................................................. 14
Table 9: Location of class 4 gaming and TAB venue vs deprivation score ............................................ 15
Table 10: Class 4 gaming machines proceeds for Whanganui .............................................................. 17
Table 11: Gaming Machine Proceeds (GMP) and Electronic Gaming Machines (EGMs)...................... 18

Box 1: Problem gambling and family violence in help-seeking propuatlons: Co-occurance, impact,
and coping-key findings ........................................................................................................................ 23
Box 2: Selection of GMP grant recipients from NZ Community Trust and Lion Foundation (2008) ..... 31

                                                                            4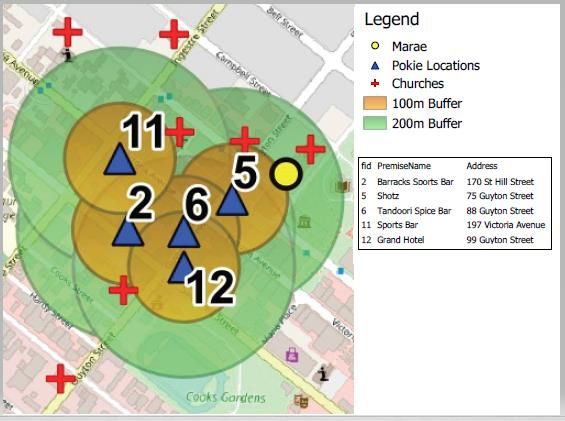
2. Introduction
2.1. Purpose
The purpose of this Social Impact Assessment report (SIA) is to provide necessary information on
gambling-related trends and harm within the Whanganui District to be considered as part of the
review of Whanganui District Council’s Gambling Venues Policy.
2.2. Scope
The scope of this report aligns itself with the requirements made under s101(2) and 96(4) of the
Gambling Act 2003 and Racing Industry Act 2020 respectively in that a territorial authority must have
regard to the social impact of gambling within the territorial authority district.
The SIA looks at the following:
Characteristics of the district
The proximity of kindergartens, early childhood centres, schools, places of worship, and other
community facilities to Gambling venues and TAB venue
Gambling venue locations and socioeconomic deprivation
The number of Class 4 gaming machines
National and local gambling trends
Social impacts of gambling - Costs
Social impacts of gambling - Benefits
3. BACKGROUND
3.1. Legislative framework
3.1.1. Gambling Act 2003 and the Racing Industry Act 2020
Both the Gambling Act 2003 and the Racing Industry Act 2020 allow communities, through territorial
authorities, to place permissive or restrictive controls on class 4 and TAB related gambling.
According to s101(3) of the Gambling Act 2003, a territorial authority’s Gambling Venue Policy:
a) must specify whether or not class 4 venues may be established in the territorial authority
district and, if so, where they may be located;
b) may specify any restrictions on the maximum number of gaming machines1 that may be
operated at a class 4 venue; and
c) may include a relocation policy.
In determining the contents of its policy, s101(4) of the Gambling Act allows territorial authorities to
have regard to relevant matters including:
a) the characteristics of the district and parts of the district;
b) the location of kindergartens, early childhood centres, schools, places of worship, and other
community facilities;
c) the number of gaming machines that should be permitted to operate at any venue or class of
venue;
d) the cumulative effects of additional opportunities for gambling in the district;
1
Gaming machines or class 4 gaming machines as referred to in this report are defined in the Gambling Act
2003 as a device, whether totally or partly mechanically or electronically operated, that is adapted or designed
and constructed for the use in gambling. Also commonly known as ‘pokies’.
5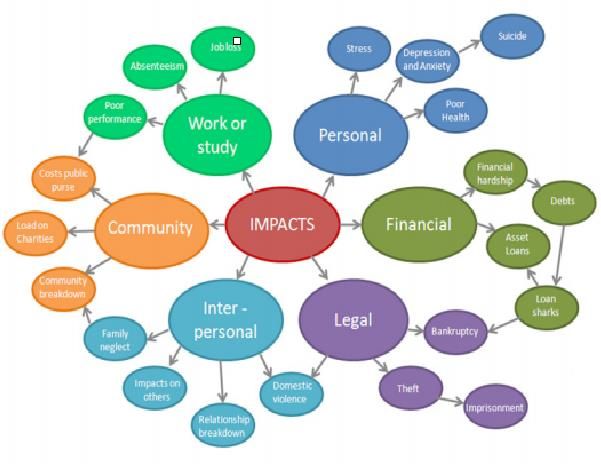
e) how close any venue should be permitted to be to any other venue; and
      f) what the primary activity at any venue should be

Section 96(1) of the Racing Industry Act 2020 states a territorial authority’s TAB venue policy must
specify whether or not new TAB venues2 may be established in the territorial authority district and, if
so, where they may be located. Similarly to the s101(3) of the Gambling Act 2003, s96(4) of the Racing
Industry Act 2020 allows territorial authorities to consider relevant matters including:

      a) the characteristics of the district and parts of the district;
      b) the location of kindergartens, early childhood centres, schools, places of worship, and other
         community facilities; and
      c) the cumulative effects of additional opportunities for gambling in the district.

4. METHODOLOGY
Council officers sourced and reported on data collated from the Department of Internal Affairs,
Statistics New Zealand, and various other resources that are referenced through this report.

5. Results
      5.1. Demography of the district’s residents
          5.1.1. Population highlights
    2018                                                            Number
    Total population                                                45,309
    Median age                                                      43.0
    Average household size                                          2.36
                                                                    % of total population
    Households owned or partly owned or in a trust                  67.2%
    Households renting                                              32.8%
    Higher degree & qualification                                   9.4%
    Māori descent                                                   26.3%
    Median income                                                   $24,400
    Unemployed                                                      5.1%
Table 1: Whanganui District population highlights-20183

2
  Premises that are owned or leased by TAB New Zealand and where the main business carried on at the
premises is providing racing betting or sports betting services under this Act.
3
  Statistics NZ

                                                          6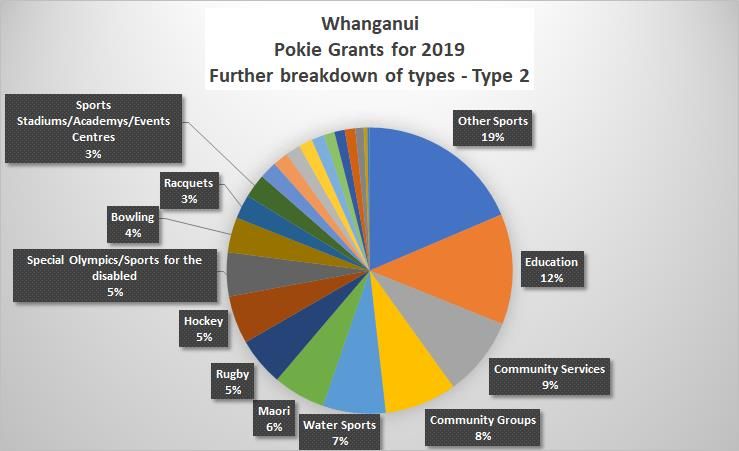
5.1.2. Population
According to 2018 Census data, the total population of Whanganui is 45,309 (Table 2).

                                                                                         % of total
Population                                                           Number (2018)      population
Population (excluding O/S visitors)                                          45,309         100.0
Females                                                                      23,397          51.6
Males                                                                        21,912          48.4
Table 2: Whanganui District population-   20184

    Area                                                             Number (2018)      % of total
                                                                                        population
    Balgownie                                                                   120           0.3
    Bastia-Durie Hill                                                         2,130           4.7
    Brunswick-Papaiti                                                         1,371           3.0
    Castlecliff East                                                          1,917           4.2
    Castlecliff West                                                          1,593           3.5
    College Estate                                                            1,284           2.8
    Cornmarket                                                                1,350           3.0
    Gonville North                                                            2,565           5.7
    Gonville South                                                            2,004           4.4
    Gonville West                                                             1,707           3.8
    Kaitoke-Fordell                                                           1,770           3.9
    Laird Park                                                                2,247           4.9
    Lower Aramoho                                                             1,869           4.1
    Mowhanau                                                                  1,293           2.8
    Otamatea                                                                  1,731           3.8
    Putiki                                                                      666           1.5
    Springvale East                                                           1,452           3.2
    Springvale North                                                            348           0.7
    Springvale West                                                           1,572           3.5
    St Johns Hill East                                                        1,173           2.6
    St Johns Hill West                                                        2,202           4.9
    Titoki                                                                    2,943           6.5
    Upper Aramoho                                                             2,097           4.6

4
    Ibid.

                                                  7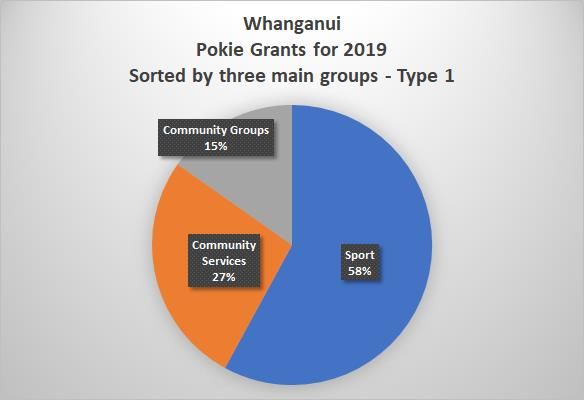
Upper Whanganui                                                                                 1,155            2.5
    Wembley Park                                                                                    1,695            3.7
    Whanganui Central                                                                                 606            1.3
    Whanganui East – Riverlands                                                                     2,184            4.8
    Whanganui East – Williams Domain                                                                2,277            5.0
Table 3: Whanganui District population by census area- 20185

6.5% of Whanganui’s population normally resides in the Titoki statistical area, followed by Gonville
North (5.7%), and Williams Domain, St Johns Hill West, Laird Park, Riverlands and Bastia-Durie Hill,
each of which contain almost 5% of the District’s population.

            5.1.3. Service age groups
Whanganui’s population is usually aged between 45 to 74 years (27.2%) followed by those under 15
years of age (19.7%).

                                                Number         % of total         Number            % of total
    Age group (years)                             2013        population            2018           population
    Under 15 years                                 8,517              20.2              8,937               19.7         ↑
    15-24 years                                    5,070              12.0              5,154               11.4         ↓
    25-34 years                                    3,999                9.5             4,872               10.7         ↑
    35-44 years                                    4,884              11.6              4,743               10.5         ↓
    45-54 years                                    6,027              14.3              5,970               13.2         ↓
    55-64 years                                    5,556              13.2              6,324               14.0         ↑
    65-74 years                                    4,191                9.9             5,112               11.3         ↑
    75-84 years                                    2,769                6.6             2,958                6.5         ↓
    85 years and over                              1,146                2.7             1,242                2.7
    Total                                         42,153               100          45,309              100.0
Table 4: Whanganui District usually resident population by age group – 2013 &   20186

            5.1.4. Ethnicity
79.2% of residents identified themselves as European, 26.3% as Māori, and 3.6% as Pacific peoples.

                                                                                                 % of total % of total
                                                                                                population population
Ethnic group - multi-response                                                 Number               2013       2018
European                                                                       35,874                 81.8       79.2      ↑
Māori                                                                          11,910                 23.0       26.3      ↑
Pacific peoples                                                                 1,617                   2.8        3.6     ↑
Asian                                                                           1,872                   2.9        4.1     ↑
Middle Eastern/Latin American/African                                             213                   0.4        0.5     ↑

5
    Statistics NZ
6
    Statistics NZ – totals may differ from the sum of column entries due to rounding.

                                                              8
Other ethnicity 555 2.0 1.2 ↓
Total 45,309
Table 5: Whanganui District population by ethnicity - 20187
A key population highlight is the proportion of Māori and Pasifika, particularly Māori who represent
26% of the district’s population. A national study showed Māori and Pasifika are disproportionately
affected by problem gambling that tend to occur alongside other issues including hazardous drinking
and smoking. 8
5.2. Class 4 gambling venues
5.2.1. Number of class 4 gambling machines.
Table 6 and Figure 1 demonstrate the number of class 4 gambling machines for the Whanganui District
for the years 2012 through to March 2020.
2014 saw a reduction of 22 electronic gaming machines (EGMs) compared to the previous year.
Numbers of EGMs decreased again in following years, with a further reduction of 18 EGMs between
2018 and 2019. Changes to numbers of EGMs could be explained by a venue housing EGMs having
closed or relocated.
Note: Not all Class 4 gambling venues are currently operating the number of gaming machines they
‘may operate’. They may be operating fewer gaming machines than their notified number, or fewer
gaming machines than the number specified on the territorial consent issued for the venue; or they
may have applied to the Department of Internal Affairs for permission to cease operating gaming
machines for a specified period. Any venue voluntarily operating fewer machines than they ‘may
operate’ can increase to the number they ‘may operate’ without territorial consent.9
Year 2012 2013 2014 2015 2016 2017 2018 2019 2020
total number of 257 257 235 235 232 225 225 207 208
EGMs
Table 6: Number of class 4 gambling machines for Whanganui from 2012 to March 202010
7
Ibid.
8
Thimasarn-Anwar, T., Squire, H., Trowland, H. & Martin, G. (2017). Gambling report: Results from the 2016
Health and Lifestyles Survey. Wellington: Health Promotion Agency Research and Evaluation Unit.
9
Ministry of Health (2009). Problem Gambling Resource for Local Government.
10
Department of Internal Affairs
9Total number of EGMs
257 257
235 235 232 225 225
Number of EGMs
207 208
2012 2013 2014 2015 2016 2017 2018 2019 2020
Year
Figure 1: Number of class 4 gambling machines for Whanganui from 2012 to March 202011
5.2.2. Location of class 4 gambling venues.
Table 7 presents all 14 currently licenced class 4 venues in the Whanganui District by society name,
venue name, physical address, and the number of EGMs.
Society Name Venue Name Venue Physical Address Number of
Gaming
Machines
Infinity Foundation Barracks Sports Bar 170 St Hill Street 18
Limited Whanganui 4500
New Zealand Caroline's Boatshed 181 Somme Parade 12
Community Trust Whanganui 4540
Castlecliff Club Inc Castlecliff Club Inc 4 Tennyson Street 15
Castlecliff, Whanganui 4501
New Zealand Castlecliff Hotel 1 Polson Street 17
Community Trust Castlecliff, Whanganui 4540
Wanganui Club Metro 13 Ridgway Street 15
Cosmopolitan Club Inc Whanganui 4540
New Zealand Red Lion Inn 45-47 Anzac Parade 9
Community Trust Whanganui 4540
New Zealand Shotz 75 Guyton Street 18
Community Trust Whanganui 4540
The Lion Foundation Sportz Bar 197 Victoria Avenue 14
(2008) Whanganui 4540
St John's Club Inc St John's Club 158 Glasgow Street 18
Whanganui 4500
New Zealand Stellar Bar 2 Victoria Street 18
Community Trust Whanganui 4540
Racing Industry TAB Wanganui 5b Puriri Street 9
Transition Agency Gonville, Whanganui 4501
New Zealand Tandoori Spice Bar 88 Guyton Street 18
Community Trust Whanganui 4540
11
Ibid.
10The Lion Foundation The Grand Hotel 99 Guyton Street 9
(2008) Whanganui 4540
Wanganui East Club Inc Wanganui East Club 101 Wakefield Street 18
Whanganui East, Whanganui 4540
TOTAL 208
Table 7: Location of class 4 gambling venues in Whanganui- March 202012
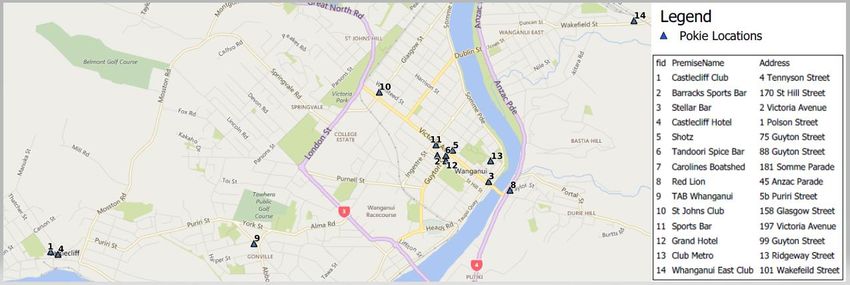
Figure 2 maps information in the table above.
As presented in the map below (Figure 2), the majority of class 4 venues are located within the town
centre.
Figure 2: Location of class 4 gambling venues in Whanganui 2020
Figures 3 and 4 examine the distance between class 4 venues and sensitive sites, the latter defined as
a school (secondary and primary), preschool, marae, and church. Currently no class 4 venues are
determined to be within 100 metres of a sensitive site, but there are five class 4 venues within 200
metres of a sensitive site.
Figure 3: Location of class 4 gambling venues within 200m of sensitive sites- town centre
12
Department of Internal Affairs
11Figure 4: Location of class 4 gambling venues within 200m of sensitive sites- Gonville
5.2.3. Density
It is generally considered that the greater the availability of class 4 gaming machines for a population
or density of electronic gaming machines (EGMs), the greater the risk of problem gambling prevalence
and gambling related harm. A meta-analysis of surveys of problem gambling conducted by Storer et
al. found strong statistical evidence that every one increase of an EGM in an area results in an increase
of 0.8 problem gamblers. There was no evidence of plateauing of problem gambling prevalence when
EGM density increased.13 The study also reported populations displayed adaptation to EGMs with
problem gambling prevalence declining over time.14
For Whanganui, class 4 gambling machines are concentrated within the town centre. Based on the
total amount of the district’s population who are 18 and over, Whanganui District has a total of 1 EGM
for every 166 people, slightly higher than the national average of 1 EGM per 230 people.15
5.3. TAB venues
At present, there is only one standalone TAB venue located in the Whanganui District and its location
is presented in Figure 5 below.
13
Storer, J., Abbott, M., & Stubbs, J. (2009). Access or adaptation? A meta-analysis of surveys of problem
gambling prevalence in Australia and New Zealand with respect to concentration of electronic gaming
machines. International Gambling Studies, 9(3), 225-244.
14
Ibid.
15
These figures were worked out by dividing the total population who identified as 18 and over at the 2018
census by the total amount of EGMs in June 2018.
12Figure 5: Location of standalone TAB venue in Whanganui- 2020
Under the Racing Industry Act 2020, territorial authorities are only empowered to permit or restrict
the establishment and location of TAB venues that are standalone. Other TAB venue types are exempt
from these controls.
5.4. Gambling venue locations and socioeconomic deprivation
Research indicates a relationship between a person’s likelihood to participate in gambling activity is
higher if the person is socioeconomically deprived.16 Research focusing on the distribution of EGMs
across areas of New Zealand showed that the ratio of EGMs to people in higher socio-economic areas
were 1 to 465 compared to 1 to 75.5 in poorer areas of the community.17
Evaluating deprivation and its connection with gambling harm, the New Zealand 2012 National
Gambling Study assessed whether individuals had gone without quality food or home heating. It was
found that almost 75 per cent of people who said they were experiencing problems with gambling
purchased cheaper food in the past twelve months compared to the remaining 25 per cent.18
Data analysis shows that gambling spend in decile 10 communities (highest deprivation) is more than
3 times the spend in decile 1 communities19 (lowest deprivation).
16
Shore. (2008). Assessment of the Social Impacts of Gambling in New Zealand. Auckland: Ministry of Health.
17
Wheeler, B. W., Rigby, J. E., & Huriwai, T. (2006). Pokies and poverty: problem gambling risk factor
geography in New Zealand. Health & place, 12(1), 86-96
18
Abbott, M., Bellringer, M., Garrett, N., & Mundy-Mcpherson, S. (2014a). New Zealand 2012 National
Gambling Study: Gambling harm and problem gambling. Report number 2. Auckland: Auckland University of
Technology, Gambling and Addictions Research Centre.
19
Dot Loves Data Dashboard – Gambling – Accessed 25 September 2020
https://products.dotlovesdata.com/dashboards/report/62ee8967-1244-430d-bed5-38dc7dc80a51
13Figure 6: EGM prevalence and spend by deprivation index
In New Zealand, socioeconomic deprivation is calculated by the Department of Public Health of the
University of Otago. The 2018 Deprivation Index combines nine variables from the 2018 census which
reflect eight dimensions of deprivation. A deprivation score is calculated for each statistical area and
its constituent meshblocks (the smallest geographical units defined by Statistics New Zealand), and
generally contain between 100 and 200 people.
This is done by assessing meshblocks against a set of nine variables which are then scaled from 1 to
10, with 10 being the highest and 1 the lowest (through to nil deprivation). The nine variables are
tabled below in Table 8.
Dimension of deprivation Description of variable
Communication People with no access to the Internet at home
Income People aged 18-64 receiving a means tested
benefit
Income People living in equivalised* households with
income below an income threshold
Employment People aged 18-64 who are unemployed
Qualifications People aged 18-64 without any qualifications
Owned home People not living in their own home
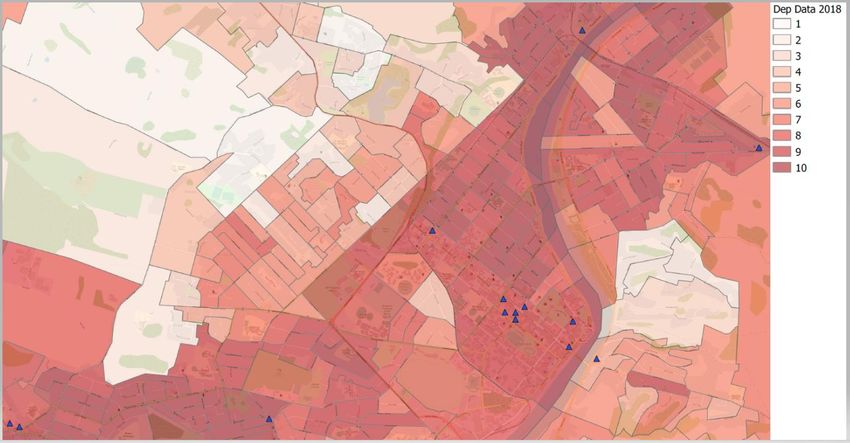
Support People agedFigure 7: Location of class 4 venues vs deprivation
When we examine the location of class 4 venues against highly deprived areas (defined as a
deprivation score between 8 and 10), we find that 13 out of the 14 class 4 venues are located in highly
deprived areas (Table 9).
Venue Deprivation
score
Barracks Sports Bar 9
Caroline's Boatshed 10
Castlecliff Club Inc 9
Castlecliff Hotel 9
Club Metro 9
Red Lion Inn 5
Shotz 9
Sportz Bar 9
St John's Club 9
Stellar Bar 9
TAB Wanganui 10
Tandoori Spice Bar 9
The Grand Hotel 9
Wanganui East Club 10
Table 9: Location of class 4 gaming and TAB venue vs deprivation score
Additionally, as much as 69% of Whanganui’s population live in the highest deprivation, decile 8 – 10
areas.21
21
Dot Loves Data Dashboard – Gambling – Accessed 28 September 2020
https://products.dotlovesdata.com/dashboards/report/93b02fd7-ac3d-4373-85e9-8354f02c0966
155.5. National gambling trends
Gamblers in New Zealand spent $2,402 million dollars (inflation adjusted) on the four main forms of
gambling in the 2018/19 financial year, a decrease of 1.2 per cent from the previous year.22 Gaming
machines (outside of casinos) saw the greatest share of spend over the same period.
National gambling trends
1,000
900
800
700
600
500
400
300
200
100
-
2010/11 2011/12 2012/13 2013/14 2014/15 2015/16 2016/17 2017/18 2018/19
NZ Racing Board (TAB) NZ Lotteries Commission Gambing Machines (outside casinos) Casinos
Figure 8: National gambling trends- FY 2010/11 to 2018/19
TAB saw a progressive increase in spend since 2013/14, with a decline in 2016/17 and again
in 2018/19.
Spend on lottery products saw a marginal decline in 2014/15, rising again in subsequent years
with another decline in 2018/19.
Casinos have seen an increase in spend since 2013/14 with a marginal decline in 2016/17
before rising again in subsequent years.
Gaming machines have seen progressive increases in spend since 2013/14.
In summary, the total reported expenditure over the four main forms of gambling has seen progressive
increases since 2011/12. TABs, Lottery products, and at Casinos have seen fluctuations in spend in
differing years but all have had an overall increase in spend between 2011/12 and 2018/19. Gaming
Machines (outside of casinos) spend has not fluctuated in consecutive years and has seen spend
progressively increase since 2013/14.
An estimated $241 million was distributed to a variety of community purposes from gambling
proceeds in 2019. This amounts to 26% of the $919 million lost on class 4 gambling in that same year.23
TAB gave over $19 million nearly $15 million of which was returned to the racing industry;
The Lottery Grants Board distributed $178 million across a range of sectors.
5.6. Gaming Machine Proceeds
Gaming Machine Proceeds from class 4 gambling machines for Whanganui are presented in Table 10.
22
The Department on Internal Affairs. Summary of gambling expenditure for FY 2018/19
23
PGF Group, Hāpai Te Hauora, The Salvation Army Oasis. (2020). Ending community sector dependence on
pokie funding [White Paper]
162020 1st and
Year 2015 2016 2017 2018 2019 2nd Qtr
WHANGANUI
DISTRICT $9,537,327 $10,022,391 $10,144,537 $10,465,064 $10,735,860 $3,830,919
Table 10: Class 4 gaming machines proceeds for Whanganui
Table 10 shows that Gaming Machine Proceeds (GMP) generated from Whanganui District class 4
machines in 2019 totalled $10,735,860. This is an increase of $270,796 (2.5%) compared to the total
GMP in 2018, and an increase of $591,323 (5.8%) compared to total GMP generated in 2017. As of
third quarter 2020, GMP looks set to be below the amount from 2019. This would be the first time
GMP has decreased in over 5 years.
Figure 9 below presents the total amount of GMP from class 4 gaming machines in the Whanganui
District in comparison to all of NZ for the years 2015 to the first and second quarters of 2020. Changes
in the total GMP collected in Whanganui for the years 2015 to 2020 broadly mirror year on year GMP
from New Zealand in terms of trends.
Gaming Machine Proceeds (GMP) Whanganui vs New Zealand
2015 - 2020
$12,000,000 $1,000,000,000
$900,000,000
$10,000,000
$800,000,000
GMP New Zealand
$700,000,000
GMP Whanganui
$8,000,000
$600,000,000
$6,000,000 $500,000,000
$400,000,000
$4,000,000
$300,000,000
$200,000,000
$2,000,000
$100,000,000
$0 $0
2015 2016 2017 2018 2019 2020
Whanganui District All of NZ
Figure 9: Gaming machine proceeds Whanganui vs New Zealand- 2012 to 2020
Table 11 below expands on the information presented in Figure 9, demonstrating the amount of GMP
per gaming machine. Looking at the GMP/EGM in the Whanganui District, GMP spread equated to
$51,864 per machine in 2019. This saw a significant drop in GMP per EGM in 2020, but a steady rise
every other year. This rise in GMP per EGM despite decreasing accessibility might be attributed to
more people partaking in class 4 gambling, or persons who normally gamble doing so at a higher
frequency.
172020 1st and
Year 2015 2016 2017 2018 2019 2nd Qtr
GMP -
Whanganui
District $9,537,327 $10,022,391 $10,144,537 $10,465,064 $10,735,860 $3,830,919
GMP - All Of
NZ $828,026,639 $858,236,950 $883,384,865 $910,679,549 $939,075,153 $315,399,898
EGMs -
Whanganui
District 235 232 225 225 207 208
EGMs - All of
NZ 16,614 16,274 16,031 15,490 15,118 14,828
GMP/EGM -
Whanganui
District $40,584 $43,200 $45,087 $46,511 $51,864 $18,418
GMP/EGM -
All of NZ $49,839 $52,737 $55,105 $58,791 $62,116 $21,271
Table 11: Gaming Machine Proceeds (GMP) and Electronic Gaming Machines (EGMs)
185.7. Social impacts of gambling - Costs
Figure 10: Social impacts of problem gambling24
Figure 10 depicts the social costs of gambling.
Taken from Measuring the Burden of Gambling Harm in New Zealand25, social impacts of gambling can
be grouped as follows:
Decrements to health (both morbidity and mortality);
Emotional or psychological distress;
Financial harm;
Reduced performance at work or education;
Relationship disruption and harm to others; and
Criminal activity.
It should be noted gambling harm is often considered as hidden. This includes the fact that people
who engage in problem gambling may be disinclined to say or unaware that they have a gambling
24
Problem Gambling Foundation. (2011).Fact Sheet no. 5. Accessed from:
https://www.pgf.nz/uploads/7/1/9/2/71924231/fs05-social_impacts_of_problem_gambling.pdf
25
Browne, M., Bellringer, M., Greer, N., Kolandai-Matchett, K., Rawat, V., Langham, E., Rockloff, M., Palmer Du
Preez, K. and Abbott, M., (2017). Measuring the burden of gambling harm in New Zealand. New Zealand
Ministry of Health.
19problem, but indicators of gambling harm are often difficult to distinguish or be solely attributed to
gambling as a root cause26.
Before delving into specifics of gambling harm, key findings from 2017’s Measuring the burden of
gambling harm in New Zealand27 are provided below to add further context:28
The study estimates that the total burden of harms occurring to gamblers is greater than
common health conditions (such as diabetes and arthritis) and approaches the level of anxiety
and depressive disorders.
Both qualitative and quantitative results suggest that this burden of harm is primarily due to
damage to relationships, emotional/psychological distress, disruptions to work/study and
financial impacts.
The most critical result from the research is regarding absolute scale of harms from gambling
to the New Zealand population. There was an estimated 161,928 years of life lost to disability
as a result of harms from gambling in 2012. Within this number 67,928 years were attributed
to gamblers themselves and 94,729 to people who were effected by someone else’s gambling.
This represents a substantial level of harm compared to other issues. In addition this
calculation does not include harms experienced beyond a 12 month period, meaning that it is
likely to be conservative.
Although some of this ‘burden of harm’ was concentrated in problem gamblers, the results
suggested that at a population level the majority of harm may not be accruing to those who
are problem gamblers.
This paper has recently been challenged by the Gaming Machine Association for errors and selection
biases, with a view to having it officially withdrawn or an official caution against its use.29 As a ruling
has not been made and it is still available via the Ministry of Health, and since its results are mostly
relied on for context, it is relied on as a source in this assessment.
5.7.1. Decrements to health
Most harm to an individual’s health in relation to gambling exposure is related to increased levels of
stress or anxiety30. Comorbidities, when one or more additional diseases or disorders are co-occurring
with a primary disease or disorder, have also been associated with gambling including mental health
26
Bond, K. S., Jorm, A. F., Miller, H. E., Rodda, S. N., Reavley, N. J., Kelly, C. M., & Kitchener, B. A. (2016). How a
concerned family member, friend or member of the public can help someone with gambling problems: a
Delphi consensus study. BMC psychology, 4(1), 6; & Downs, C., & Woolrych, R. (2010). Gambling and debt: the
hidden impacts on family and work life. Community, Work & Family, 13(3), 311-328.
27
Browne, M., Bellringer, M., Greer, N., Kolandai-Matchett, K., Rawat, V., Langham, E., Rockloff, M., Palmer Du
Preez, K. and Abbott, M., (2017). Measuring the burden of gambling harm in New Zealand. New Zealand
Ministry of Health.
28
Officers would like to thank the authors of Measuring the burden of gambling harm which have provided a
framework and evidence used in this report’s assessment of social costs from gambling.
29
True, J. & Cheer, M., (2020). Gaming Machine Gambling Statistics and Research Paper – Information for
Territorial Authorities.
30
Browne, M., Bellringer, M., Greer, N., Kolandai-Matchett, K., Rawat, V., Langham, E., Rockloff, M., Palmer Du
Preez, K. and Abbott, M., (2017). Measuring the burden of gambling harm in New Zealand. New Zealand
Ministry of Health.
20and age related impairments.31 The New Zealand 2012 National Gambling Study32 noted that reported
good health decreased with increasing risk of problem gambling and that those experiencing or at risk
of developing a gambling problem had higher rates of tobacco and substance abuse, including alcohol
and higher smoking prevalence.33
5.7.2. Emotional or psychological distress.
Gambling has also been identified to cause harm in terms of emotional or psychological distress as
experiences of guilt, anxiety, and helplessness; as well as shame, stigma, grief, and self-hatred.34 On a
similar note, the 2014 phase of the New Zealand national gambling study showed 4% of those who
gambled in past 12 months expressed feelings of guilt.35
5.7.3. Financial harm
Financial harm can include escalating harms such as the erosion of savings, juggling or failure to pay
bills, borrowing money, or a decline in the standard of living.36 As reported by Browne et al (2017)
deprivation can occur where individuals go without necessities as a result of increasing or perpetual
gambling behaviours, and that this process (from loss of discretionary consumer items to deprivation
to crisis) differs on other factors such as socio-economic status, income, lifestyle, and severity of the
gambling problem.37
Individuals experiencing gambling problems were more likely to experience higher levels of
deprivation, with close to three-quarters reporting they were forced to purchase cheaper food during
the past twelve months compared to a quarter of adults generally.38
The Salvation Army’s 2005 investigation of Foodbank clients showed that 37% of the people accessing
Foodbank services were either affected by the problem gambling of others or were problem gamblers
themselves.39 One of the findings from a more recent 2010 study was that a higher density of gaming
31
Lorains, F. K., Cowlishaw, S., & Thomas, S. A. (2011). Prevalence of comorbid disorders in problem and
pathological gambling: Systematic review and meta‐analysis of population surveys. Addiction, 106(3), 490-498.
32
Abbott, M., Bellringer, M., Garrett, N., & Mundy-Mcpherson, S. (2014a). New Zealand 2012 National
Gambling Study: Gambling harm and problem gambling. Report number 2. Auckland: Auckland University of
Technology, Gambling and Addictions Research Centre.
33
Ibid.
34
Raisamo, S., Halme, J., Murto, A. & Lintonen, T. (2013). Gambling-related harms among adolescents: a
population-based study. Journal of Gambling Studies / co-sponsored by the National Council on Problem
Gambling and Institute for the Study of Gambling and Commercial Gaming, 29(1), 151-159. doi:
10.1007/s10899-012-9298-9
35
Abbott, M., Bellringer, M., Garrett, N., & Mundy-Mcpherson, S. (2014a). New Zealand 2012 National
Gambling Study: Gambling harm and problem gambling. Report number 2. Auckland: Auckland University of
Technology, Gambling and Addictions Research Centre.
36
Browne, M., Bellringer, M., Greer, N., Kolandai-Matchett, K., Rawat, V., Langham, E., Rockloff, M., Palmer Du
Preez, K. and Abbott, M., (2017). Measuring the burden of gambling harm in New Zealand. New Zealand
Ministry of Health.
37
Ibid.
38
Abbott, M., Bellringer, M., Garrett, N., & Mundy-Mcpherson, S. (2014a). New Zealand 2012 National
Gambling Study: Gambling harm and problem gambling. Report number 2. Auckland: Auckland University of
Technology, Gambling and Addictions Research Centre.
39
Salvation Army & Abacus Counselling & Training Services Ltd. (2005). Salvation Army Social Services Project
Final Report. Manukau City: Salvation Army.
21machines were associated with a higher number of food parcels being given out by the Salvation
Army.40
5.7.4. Reduced performance at work or education
Preoccupation with gambling can impair studying or working relationships which can negatively
impact work performances.41 Absenteeism and theft of resources to support gambling activities are
other manifestations of gambling related problems.42
5.7.5. Relationship disruption, and harms to others
Problem gambling has a strong connection with the breakdown of family and personal relationships.
Research indicates that people experiencing problems with gambling are more likely to be separated
or divorced, and also experiencing higher levels of conflict in other personal relationships.43
Estimates from Australia’s Productivity Commission indicate that one person’s gambling problem
typically affects five to 10 people.44
The New Zealand 2012 National Gambling Study found around one in 12 participants were of the view
that they had been affected personally by another person’s gambling.45 Persons surveyed said they
were affected by adverse financial impacts, relationship break-ups, stress to family, loss of trust,
anger, frustration, and resentment. Furthermore, approximately one in 33 adults reported an
argument about gambling in their household during the past 12 months and around one in 36 reported
that their family or household had gone without something they needed or that bills were not paid
because of gambling.46
Research also suggests that Māori and those who live in high deprivation areas suffer the greatest
impacts from the gambling of others.47 This compounds with the higher gambling rate and higher
problem gambling rate among these demographics, making them significantly more susceptible to
gambling harm.
5.7.6. Link between gambling and family violence.
In a 2016 New Zealand study, 370 gamblers and 84 affected others accessing national problem
gambling treatment services took part in a survey on gambling and family/whānau violence and abuse
(454 total participants).48 Of this sample, the main modes of problematic gambling reported by
40
Wall, M., Peter, M. You, R., Mavoa, S., & Witten, K. (2010). Problem Gambling Research: A study of
community level harm from gambling Phase one Final Report. Auckland: Centre for Social and Health
Outcomes Research and Evaluation.
41
Griffiths, M. (2009). Internet gambling in the workplace. Journal of Workplace Learning, 21 (8), 658-670.
42
Browne, M., Bellringer, M., Greer, N., Kolandai-Matchett, K., Rawat, V., Langham, E., Rockloff, M., Palmer Du
Preez, K. and Abbott, M., (2017). Measuring the burden of gambling harm in New Zealand. New Zealand
Ministry of Health.
43
Ibid.
44
Productivity Commission. (1999). Australia's Gambling Industries: Inquiry Report. Canberra: Commonwealth
of Australia.
45
Abbott, M., Bellringer, M., Garrett, N., & Mundy-Mcpherson, S. (2014a). New Zealand 2012 National
Gambling Study: Gambling harm and problem gambling. Report number 2. Auckland: Auckland University of
Technology, Gambling and Addictions Research Centre.
46
Ibid.
47
Thermasarn-Anwar, T., Squire, H., Trowland, H. & Martin, G. (2017). Gambling report: Results from the 2016
Health and Lifestyles Survey. Wellington: Health Promotion Agency Research and Evaluation Unit.
48
Bellringer, M., Palmer du Preez, K., Pearson, J., Garrett, N., Koziol-McLain, J., Wilson, D., & Abbott, M. (2016).
Problem gambling and family violence in help-seeking populations: Co-occurrence, impact and coping.
22gamblers and affected others49 were pub electronic gaming machines (EGMs) (37% and 35%
respectively), casino table games (23%, 20%), casino EGMs (15%, 8%) and horse or dog race betting
(7%, 16%). The main findings of this study are presented in Box 1.50
The most common abuse was verbal:
37% ‘screamed or cursed at’ another person and 41% were victims of this
34% ‘insulted or talked down to’ another person and 40% were victims of this.
Physical abuse was less common:
7% caused physical harm and 9% were victims of physical harm
9% threatened physical harm and 12% were threatened with physical harm
No participants reported sexually abusing someone but 4% were sexually abused.
More affected others reported committing and being victims of violence and abuse (except for
financial abuse) than gamblers:
57% of affected others committed violence/abuse compared with 41% of gamblers
66% of affected others were victims of violence/abuse compared with 47% of gamblers.
About three-quarters of the family/whānau violence/abuse was to, or from, a current or
ex-partner; the other family members were sons or daughters, and other family/whānau
members.
Box 1: Problem gambling and family violence in help-seeking propuatlons: Co-occurance, impact, and coping-key findings
5.7.7. Criminal activity
In compiling this social impact assessment, officers made contact with Police NZ with regards to
gambling related crime. At present, Police NZ do not code offences in association to gambling or
gambling harm. Regardless, studies tend to support a relationship between problem gambling and
criminal behaviour.
Bellringer et al. suggests a relationship exists between gambling and crime that is somewhat complex,
in that sometimes crimes are committed to pay gambling related debts whilst other cases crimes are
the cause of gambling itself.
In Bellringer et al.’s investigation, a sample of 32 gamblers (26 being classified as problem gamblers)
were interviewed to provide insight into the links between gambling and crime in New Zealand. Almost
two-thirds of participants reported their gambling behaviours were associated with, contributed to,
and/or caused the crimes they had committed.51
Auckland University of Technology, Gambling and Addictions Research Centre and Centre for Interdisciplinary
Trauma Research.
49
Affected others reported the main mode of problematic gambling for the problem gambler they knew.
50
Bellringer, M., Palmer du Preez, K., Pearson, J., Garrett, N., Koziol-McLain, J., Wilson, D., & Abbott, M. (2016).
Problem gambling and family violence in help-seeking populations: Co-occurrence, impact and coping.
Auckland University of Technology, Gambling and Addictions Research Centre and Centre for Interdisciplinary
Trauma Research.
51
Bellringer, M., Abbott, M., Coombes, R., Brown, R., Mckenna, B., Dyall, L., & Rossen, F. (2009). Formative
investigation of the links between gambling (including problem gambling) and crime in New Zealand. Auckland:
Auckland University of Technology Gambling and Addictions Research Centre and the University of Auckland
Centre for Gambling Studies.
23Browne et al. also accounts that there is substantial unreported crime, a large proportion of which is
likely to be related to gambling.52
5.7.8. Problem gambling
Problem gambling refers to gambling that significantly interferes with a person’s life, especially with
their finances, their job, and their relationships with partner, family, and friends.
While exact numbers are difficult to reach, it is suggested that 0.2% of the adult population are
problem gamblers (10,000 people), 1.5% were moderate-risk gamblers (about 76,000 people), 3.3%
were low-risk gamblers (about 168,000 people) and 70% were non-problem gamblers.53
When extrapolated to Whanganui’s population:
91 persons could be identified as problem gamblers.
680 persons could be identified as moderate-risk gamblers.
1495 persons could be identified as low-risk gamblers.
31716 persons could be identified as non-problem gamblers.
Outlined in a 2014 New Zealand gambling study, factors for moving towards risky gambling or
remaining at risk included higher gambling frequency or expenditure, casino or pub pokie machine
gambling, having a lower quality of life, experiencing significant life events, having higher levels of
mental distress and using cannabis. Protective factors were gambling with other people, having a
higher household income and not using illegal drugs.54 Being Māori or Pasifika was associated with
moving towards risky gambling and remaining at risk.55 Being a problem gambler is significantly
associated with living closer to gambling venues.56
It should also be noted that ‘problem gambling’ as a framework has been criticised, with suggestions
that it is not sufficient to accurately capture the level of harm suffered by gamblers as a whole. With
the focus being on categories of gambler, it fails to consider nuances such as the level of harm suffered
by those in lower categories – suggestions being that ‘low-risk’ gamblers suffer as much as 50% of
gambling-related harm – and the harm suffered by those classified as non-problem gamblers57.
5.7.9. Regressive tax effect and economic regional output leakage
A negative consequence of gambling can be attributed to the manner gambling expenditure is
collected and redistributed as a regressive tax. A regressive tax is defined when the collection of
52
Browne, M., Bellringer, M., Greer, N., Kolandai-Matchett, K., Rawat, V., Langham, E., Rockloff, M., Palmer Du
Preez, K. and Abbott, M., (2017). Measuring the burden of gambling harm in New Zealand. New Zealand
Ministry of Health.
53
Thermasarn-Anwar, T., Squire, H., Trowland, H. & Martin, G. (2017). Gambling report: Results from the 2016
Health and Lifestyles Survey. Wellington: Health Promotion Agency Research and Evaluation Unit.
54
M, Abbott; M, Bellringer; N, Garrett; & S, Mundy-McPherson. (2014). New Zealand National Gambling Study:
Wave 3 (2014) - report number 5; Ministry of Health, Wellington.
55
Ibid.
56
Ministry of Health. (2008). Raising the Odds? Gambling behaviour and neighbourhood access to gambling
venues in New Zealand.
Wellington: Ministry of Health.
57
Browne, M., Bellringer, M., Greer, N., Kolandai-Matchett, K., Rawat, V., Langham, E., Rockloff, M., Palmer Du
Preez, K. and Abbott, M., (2017). Measuring the burden of gambling harm in New Zealand. New Zealand
Ministry of Health.
24revenue comes from a higher portion of persons who have lower incomes/experiencing higher
deprivation than those who do not.58
A regional impact analysis measuring the economic impact of electronic gaming machines in
regional areas of Australia found that the distribution of gambling revenue leads to poor relative
performance of the sector and large leakages out of the regional economy and in turn negatively
impacting levels of regional output, income and employment.59
Given that $10,735,860 of proceeds were collected from class 4 gambling machines in the
Whanganui District in 2019, this money could be better spent otherwise and more beneficially to
gamblers, in terms of return (social, cultural, economic capital etc), when taking into account
persons who are more likely to partake in gambling activities are usually deprived.
Estimates suggest that problem gamblers contribute between 30 and 60% of GMP per year, which
would mean that most, if not all, of yearly community grants are made entirely by problem gamblers.60
Furthermore, it can be argued gaming proceeds redistributed back to communities via community
grants are likely to provide marginal benefit to gamblers and their families, who are usually
socioeconomically less off than others, and that benefits would be greater if the gambler spent this
money differently.
5.7.10. Class 4 gambling loss per head
The financial loss per head to pokie machines was calculated from the expenditure figures released
by the DIA divided by the adult population. Whanganui lost $81.98 per head for the year of 2019. This
is the 21st highest loss out of 66 territorial authorities.
58
Livingstone, C., & Adams, P. J. (2011). Harm promotion: observations on the symbiosis between government
and private industries in Australasia for the development of highly accessible gambling markets. Addiction,
106(1), 3-8.
59
Pinge, I. (2000). Measuring the economic impact of electronic gaming machines in regional areas-Bendigo, a
case study. Centre for Sustainable Regional Communities, La Trobe University.
60
PGF Group, Hāpai Te Hauora, The Salvation Army Oasis. (2020). Ending community sector dependence on
pokie funding [White Paper]
25Figure 11: Class 4 gambling loss per head
5.7.11. Local evidence of harm from gambling
In 2014, the Māori Problem Gambling team at Nga Tai O Te Awa did a research project around the
impact gambling may have on individuals, their whanau and community in the Whanganui region.
The project involved the administering of a survey, collecting key local information on gambling within
the Whanganui District. A total of 273 individuals responded to the survey with the following
presenting key highlights:61
Most respondents identified as female (217 female; 56 male); most respondents were aged
25-34 (21%), followed by 35-44 and 65 and above (20% respectively); and 54% of respondents
identified as Māori and 43% as New Zealand/ European.
57% of respondents said that they participated in a form of gambling.
The top three forms of gambling respondents said they participated in were lotto (42%),
scratchies (23%), and pokies (9%); 7% said they participated in TAB/sports betting.
When asked if gambling has had a negative effect, “no” had the highest frequency of
responses at 64%. Of those respondents who were affected 18% said financial
neglect/hardship, followed by mental or physical health (6%), domestic violence (5%),
employment (4%) and crime/theft (4%).
61
Provided by Nga Tai O Te Awa, 2017.
26 82% of those who participated in a gambling activity said that on an average week they spent
between $10-$25.
5.7.12. Gambling harm intervention services
One of the Ministry of Health’s obligations under the Gambling Act 2003 is the provision of high-
quality, effective and accessible services to prevent and minimise gambling harm.62 Accordingly, the
Ministry continues to fund a toll-free helpline offering both referrals to face-to-face services and
intervention services for those without access to face-to-face services or those who prefer a helpline
service.63
Intervention client data for Whanganui
60
51
Number of intervention clients
50
41 42
40
38
36
32
30 29 29 30
27
25
20 19 20
10
8
0
FY 2011/12 FY 2012/13 FY 2013/14 FY 2014/15 FY 2015/16 FY 2016/17 FY 2017/18
New Clients All clients assisted
Figure 12: Gambling intervention service client data for Whanganui- FY2011/12 to FY2017/18
Figure 13 presents a comparison of new clients and the total number of clients (“all clients assisted”)
who have accessed gambling harm intervention services determined to reside in the Whanganui
District over each financial year from 2011/12 to 2017/18. There tends to be an increase of new clients
from 2011/12 onwards with an all-time low for the past 6 years in 2016/17, which then spikes in
2017/18, taking it to its highest measured point.
All clients assisted followed a similar curve, with a drop between 2014/15 and 2016/17, followed by a
spike upwards in 2017/18.
As clients accessing these intervention services are self-selective, and not neglecting those clients that
were encouraged to access these services by a relative, a gambling venue as part of the gambling Act’s
regulations, or a public health professional, the numbers presented likely under-represent the number
of persons experiencing gambling harm. A final note on gambling harm intervention services, is that
they do not discriminate the form of gambling practiced by clients. Clients assisted by gambling harm
services presented in Figure 13 captures clients experiencing harm from all forms of gambling
including online, class 4 machines, etc.
62
Ministry of Health. (2020). Strategy to Prevent and Minimise Gambling Harm 2019/20 to 2021/22.
Wellington: Ministry of Health.
63
Ibid.
27You can also read