State of the District - 2020 Report
←
→
Page content transcription
If your browser does not render page correctly, please read the page content below
State of the District
2020 Report

              1
Contents

Introduction ……………………………………………………………………………………           3
Overview     ……………………………………………………………………………………           4
Population ……………………………………………………………………………………             6
Health and Wellbeing ….……………………………………………………………………       11
Employment and Unemployment ……………………………………………………………     18
Support for Vulnerable Groups ……………………………………………………………   22
Education and Skills    ….……………………………………………………………………    29
The Economy …..……………………………………………………………………………            32
Economic Opportunity      ……………………………………………………………………    35
Housing      ……………………………………………………………………………………           37
Access to Services ……………………………………………………………………………        41
Crime …………………………………………………………………………………………                42
Sport and Leisure ……………………………………………………………………………         44
Energy and the Environment    ……………………………………………………………   46
Sources      ……………………………………………………………………………………           48

                           2
Introduction
Welcome to West Lindsey District Council’s annual State of the District Report for 2020. In
alignment with the Council’s Corporate Plan, the report focuses on two of its main priority
areas; ‘People’ and ‘Place’. The State of the District Report is designed to support and
inform the Council’s decision making; as well as acting as a source of information for other
stakeholders in the District.
This report provides important information relating to the District of West Lindsey, such as
the economy, health and wellbeing, employment, education, housing and public safety. It
also provides up to date facts and figures about the demography of the District.
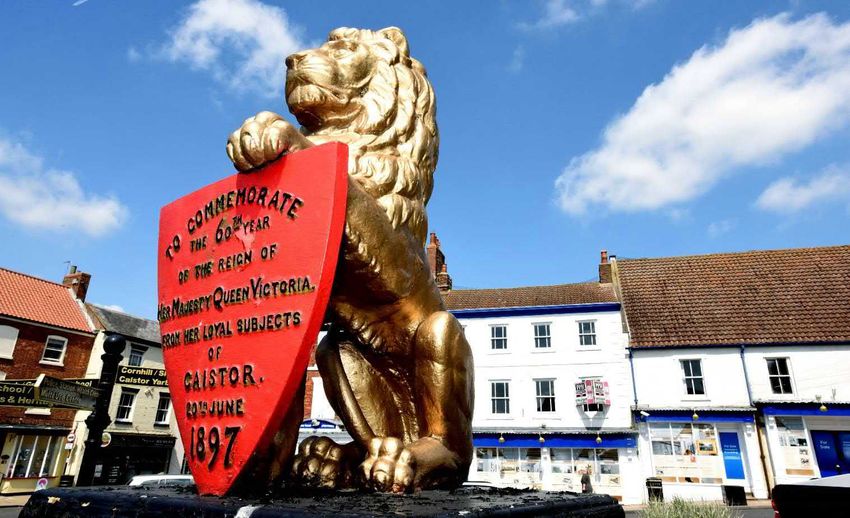
West Lindsey is one of the largest districts in England and one of the most rural in the
County of Lincolnshire. One of seven District areas in the County, West Lindsey covers
1,156km2 (447 square miles), with the administrative centre in Gainsborough on the River
Trent to the west, and the smaller market towns of Caistor and Market Rasen to the east.
Following boundary changes in 2015, West Lindsey is currently made up of 20 wards with a
total of 97 parishes within the District.
Information is intended to be as up to date as possible and the most up to date statistics are
always used in compiling this report. In a small number of cases, a given dataset has not
been updated since the 2011 Census and this is highlighted in the report where applicable.
Where possible, information in this report is presented at ward level.
3
Overview
There are great differences in the characteristics and levels of need across the district.
Some wards experience the highest levels of deprivation in the country while others are
amongst the most affluent. This range of characteristics, such as wealth, accessibility,
infrastructure and deprivation have a varied effect on the needs and aspirations of local
people and the delivery of services in the District.

Overall, it can be said that the state of the district remains mixed. Progress has been made
in some areas, but a number of persistent challenges remain, and worsening trends are
beginning to emerge. It is inevitable that the ongoing global COVID-19 pandemic will have
an impact on health and economic outcomes in West Lindsey, some of which is already
apparent in the employment figures for the first quarter of 2020. The fuller impact is more
likely to emerge in 2021, which will be reflected in that year’s State of the District Report.

West Lindsey residents continue to benefit from good mental health, but physical health is
worsening compared to last year with higher than average obesity rates for both adults and
children. Whilst the rest of the region and country as a whole is experiencing increasing
homelessness, for West Lindsey the rates of homelessness remain low. Conversely, the
mortality rate has risen while the birth rate is decreasing which will place additional
pressure on local services if the trend continues as predicted. Life expectancy is slightly
lower than last year for both men and women but is still higher than average. Rates of
dementia are increasing and the number of people with a disability is expected to increase
over the next 20 years. The gap in the employment rate for people with a long-term health
condition is widening, placing West Lindsey in the bottom quartile nationally.

In terms of the District’s economy, business confidence has decreased due to continued
uncertainty and a stagnant economy; however, gross value added has increased by £68m.
Weekly earnings are higher than the regional average for men and the gender pay gap has
begun to narrow although women in West Lindsey continue to earn below the regional and
national average. The District benefits from a higher than average number of managers,
professionals and skilled tradespeople compared to the rest of the region. For the first time,
the gap between West Lindsey’s skills profile and the rest of the country has narrowed, with
record numbers in the district achieving at least a level 2 NVQ (equivalent to five good
GCSE passes).

Employment rates have risen significantly above both the regional and national average,
however, the youth unemployment rate has also risen significantly, and is higher than both
the regional and national averages, placing West Lindsey in the bottom quartile.
Additionally, the number of people currently claiming out of work benefits has increased. As
the economic effects of the global COVID-19 pandemic continue to take hold, it is likely that
unemployment across all age groups will increase over the next 12 months. The number of
people living in fuel poverty remains higher than the regional and national average and is
rising across all wards in the district with the exception of Gainsborough (all wards) and
Nettleham.

                                              4
While the average house price in the district has increased to record levels, the affordability
ratio remains static and is worse than the regional and national average. Access to
superfast broadband has also remained static over the last year with just over 88% of
households now connected to a superfast service; a figure which is below the government’s
target for 2020 of 97%. Levels of public safety are high and although crime levels have
risen over the past year, the overall crime rate remains low and is the third lowest in
Lincolnshire.

                                               5
Population
The mid-year population estimate for 2019 is 95,667, an increase of 798 or 0.84%
compared to 2018. While West Lindsey’s population growth rate has remained steady,
mainly as a result of internal migration, the UK’s population growth rate was the slowest
rate since 2004 at 0.5%, down from 0.6% in the previous year. According to the Office for
National Statistics (ONS), this is due to the lowest birth rate in 14 years, increased
emigration and a fall in international immigration.

ONS population projections suggest that the population of West Lindsey will continue to rise
to 105,700 by 2041, an overall increase of 10%. The East Midlands has experienced the
fastest population growth rate (0.98%) of all the regions in the UK.

The ONS has released experimental ward-based population data based on 2018 figures.
This is set out in the table below. Overall, women make up 51.06% of the district’s
population compared to 48.94% for men.

                           Geographical        Total           Female           Male
Ward
                              Area           Population       Population      Population

Bardney                       6,255.72           2,636           1,337           1,299

Caistor and
                              6,930.63           5,425           2,830           2,595
Yarborough

Cherry Willingham             4,561.18           7,542           3,953           3,689

Dunholme and Welton           9,535.60           8,479           4,364           4,115

Gainsborough East              293.81            7,807           4,080           3,727

Gainsborough North             239.45            7,380           3,801           3,579
Gainsborough South-
                               437.10            5,488           2,734           2,754
West

Hemswell                      9,593.48           2,852           1,377           1,475

Kelsey Wold                   7,926.32           2,746           1,373           1,373

Lea                           2,818.09           2,112           1,127            985

Market Rasen                 15,310.58           8,935           4,559           4,376

Nettleham                     1,945.98           4,093           2,135           1,958

Saxilby                       5,111.49           5,572           2,838           2,734

Scampton                      5,092.64           2,867           1,390           1,477

Scotter and Blyton           10,245.62           7,774           4,000           3,774

Stow                          3,328.55           2,329           1,192           1,137

                                             6
Sudbrooke                                     1,348.34                          2,681                        1,374                           1,307

Torksey                                       4,349.78                          2,967                        1,469                           1,498

Waddingham and
                                              7,816.05                          2,505                        1,219                           1,286
Spital

Wold View                                     12,431.32                         2,579                        1,292                           1,287

Total                                                -                         94,869                       48,444                       46,425

                                                                                             Source: Office for National Statistics

Population Change

In 2018, there were 875 lives births (the second lowest in the County), compared with 1,091
deaths the third lowest in the County) which is a difference of -216. The live birth rate has
increased by 0.46% compared to 2017, while the death rate has increased by 6.86%. The
growth in the district’s population can be attributed to migration; notably internal migration.

Population Projections

By 2041, the total population is projected to be 105,700, an overall increase of 10,033
people (10.49%)

                                West Lindsey Population Projection (1000s)

 54000

 52000

 50000

 48000

 46000

 44000

 42000
                                                                                     2029

                                                                                                          2032
           2019
                  2020
                         2021
                                2022
                                       2023
                                              2024
                                                     2025
                                                            2026
                                                                   2027
                                                                              2028

                                                                                            2030
                                                                                                   2031

                                                                                                                 2033
                                                                                                                        2034
                                                                                                                               2035
                                                                                                                                      2036
                                                                                                                                              2037
                                                                                                                                                     2038

                                                             Female                     Male

                                                                          7
Age Distribution

In line with the national trend, West Lindsey continues to have an ageing population with an
average age of 47. This is significantly higher than the UK average of 40 and the County
average of 41.4.

The number of children aged 0-15 is projected to rise from 16,000 in 2020 to 16,200 in
2029, an increase of 2.5%. From 2030 up to 2041, the population of this age group is
projected to decline steadily back down to 2019 levels.

There are approximately 56,600 people of working age in the district and this number is not
projected to alter significantly until 2035 when numbers start to decline to the mid-50,000s
leading up to the year 2041.

The number of people between state pension age and 84 years is projected to rise
continuously every year from 21,325 in 2020 up to 27,179 in 2043. Likewise, the number of
very elderly people in the district, classified as 84+ is also projected to rise continuously
from 2,795 in 2020 up to 5,481 in 2043. The current old age dependency ratio (the ratio of
people aged 64 years and over expressed per 100 persons of working age) stands at 41.1
and, based on current projections, this is set to rise to 44.78 by 2043.

                                          Population Projection by age group: 2019-2041

                                  120.0
  Population projection (1000s)

                                  100.0

                                   80.0

                                   60.0

                                   40.0

                                   20.0

                                    0.0
                                          2026

                                          2028

                                          2030

                                          2041
                                          2019
                                          2020
                                          2021
                                          2022
                                          2023
                                          2024
                                          2025

                                          2027

                                          2029

                                          2031
                                          2032
                                          2033
                                          2034
                                          2035
                                          2036
                                          2037
                                          2038
                                          2039
                                          2040

                                                                    Year

                                                         0-15   16-65      66-84   85+

The map below shows rates of ageing across the District which range from slightly ageing
in Gainsborough, Hemswell and Scampton to rapid ageing in Lea and the Lincoln Fringe
areas of Torksey, Saxilby, Cherry Willingham and Nettleham.

                                                                8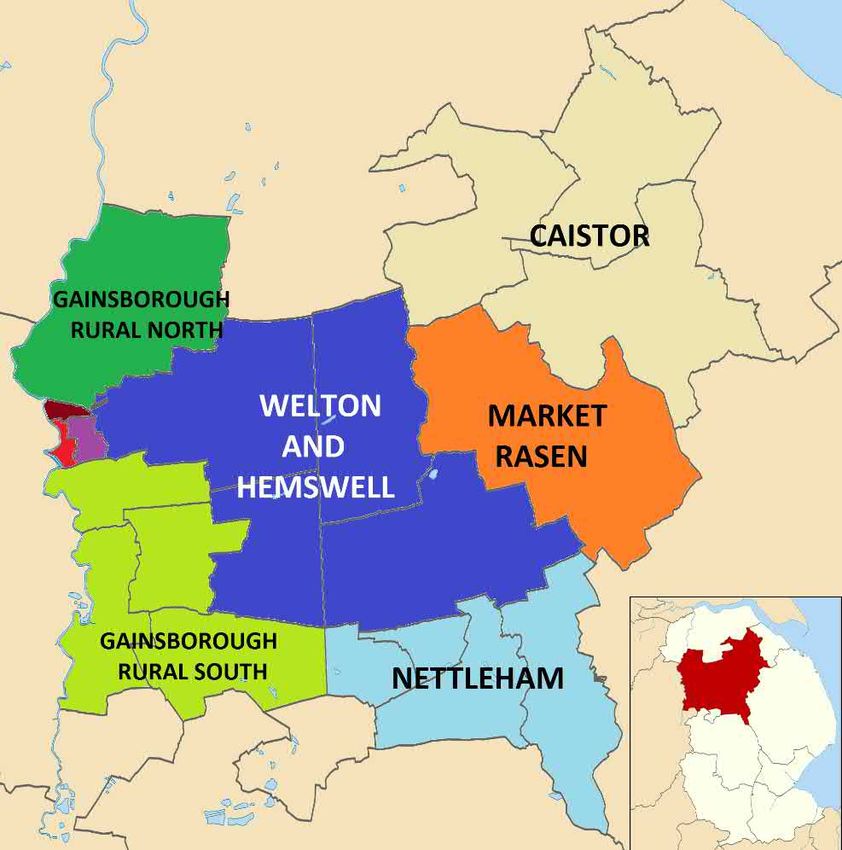
Ethnicity

N.B there has been little update on these statistics since the 2011 Census, with the next
update due following the 2021 Census.

As of 2011, 3.6% of West Lindsey residents were classed as Black and Minority Ethnic
(BAME). The highest proportion of the BAME population can be found in Gainsborough
South-West (8.2%) and Sudbrooke (6.9%) whilst the lowest proportion is in Stow (0.01%).

Migration

The internal migration flow (the difference between the inflow and outflow of people) has
increased over the last year, up from 412 people in 2017 to 650 people in 2018, a
difference of 57.7%. The international migration flow has fallen significantly, down by 55%
from 120 in 2017 to 54 in 2018.

                                             9
Localised Population Growth

The Central Lincolnshire Local Plan forms the framework of where growth sits. This allows
modelling to take place to show where in the district growth is likely to take place.

Gainsborough

The population of Gainsborough expanded by 1.11% to 20,523 in 2017. The current growth
rate suggests a projected population of between 26,514 and 31,869 by 2036, making it
likely that the Growth Point target of 30,000 will be met.

Market Rasen and Caistor

As of 2017 (the latest data available), Market Rasen had a population of 8,919. The ward is
growing faster than the district as a whole and contains 9.5% of the district’s overall
population; a figure which is predicted to grow further based on current growth rates.
Caistor’s population currently stands at 5,466.

Lincoln Fringe

There is a mixed picture for the Lincoln Fringe in terms of population growth. The Dunholme
and Welton areas have experienced slow growth since 2011 compared to more rapid
growth around Cherry Willingham and Bardney. Growth around Saxilby has been moderate
but overall, growth for the Lincoln Fringe area has been slower since 2011 than it has for
Gainsborough and the surrounding area.

                                            10
Health and Wellbeing
Heath Profile
The health of residents in West Lindsey is varied compared with the England average.
Across the District 18% (2,700) of children live in low income families. In the most deprived
areas of the district, life expectancy is 7.0 years lower for men and 6.9 years lower for
women compared to the least deprived. Overall, life expectancy is above the national
average.
The number of people killed or seriously injured on the district’s roads remains higher than
the national average, placing the district in the bottom quartile for what is the single biggest
health and road safety concern in West Lindsey.
The gap in the employment rate between those with a long-term health condition and the
overall employment rate is 38.7%. This has widened significantly compared to the previous
year (27.8%) and places West Lindsey in the lowest 25th percentile nationally.
Obesity rates in children of primary school age have fallen and are below the national
average but the picture worsens into adulthood where the obesity rate is higher than the
regional and national average.
Life Expectancy
There is a strong correlation between life expectancy and deprivation. The average life
expectancy at birth for females is 83.5 years, down from 84.2 years the previous year but
still higher than the national average (83.2) and still within the top quartile nationally. Men
born in the district in 2019 can expect to live to an average age of 79.6, down slightly from
80 the previous year but on a par with the national average. This is the first year that the
figures have decreased since 2007.
The under 75 mortality rates for all causes has increased to 311 per 100,000; up from 302
the previous year. This latest figure remains lower than the national and regional average
(330 and 334 respectively). Whilst mortality rates for cancer have been declining in West
Lindsey since 2011, there has been a slight increase to 128.8 (per 100,000) from 123.2 the
previous year. Again, this figure remains better than both the regional (133.4) and national
(132.2) averages. The excess winter mortality ratio stood at 38.0% (or 120 people) in 2018,
an increase of 17.9% on the previous year.
Child Health
Obesity levels amongst children in reception year (aged 5-6) have increased from 8.71% in
2016/17 to 10.1% (or 103 children) in 2018/19 which is higher than both the regional (9.3%)
and national (9.7%) average. This increase follows a period of steadily declining childhood
obesity from 2009 through to 2017. The picture worsens as children progress through
primary school, with 18.8% (or 182) of children classed as obese by the age of 11. This is
an increase of 1% on the previous year. This figure is lower than the regional average
(19.7%) and national average (20.2%).
11% of children overweight or obese in reception year
18.00%
16.00%
14.00%
12.00%
10.00%
8.00%
6.00%
4.00%
2.00%
0.00%
2009/10
2010/11
2011/12
2012/13
2013/14
2014/15
2015/16
2016/17
2017/18
2018/19
overweight obese
Source: Public Health England, National Child Measuring Programme
Children overweight or obese in year 6
25.00%
20.00%
15.00%
10.00%
5.00%
0.00%
2009/10
2010/11
2011/12
2012/13
2013/14
2014/15
2015/16
2016/17
2017/18
2018/19
overweight obese
Source: Public Health England, National Child Measuring Programme
12Lifestyles
Obesity is a growing problem in the UK. Adults living in the most deprived areas are 46%
more likely to be obese compared to the least deprived areas. In West Lindsey, 68.5% of
adults are classed as obese, up 0.4% from the previous year. This is significantly higher
than the national and regional averages and places West Lindsey in the bottom quartile for
England.
Nationally, smoking prevalence has been in gradual decline over the last 15 years and data
for West Lindsey broadly follows this trend. In total, 15.4% of adults in West Lindsey smoke,
down from 18% in the previous year but slightly higher than the national average of 14.9%.
At 16.2 (per 100,000), rates of smoking during pregnancy are significantly higher than the
national average (10.6), placing West Lindsey in the bottom quartile nationally. Smoking is
more common amongst those in routine and manual occupations with a rate of 22.1%
amongst this cohort. This represents a significant decrease, down from 38.4% for the
previous year.
The rate of alcohol related hospital admissions among adults in West Lindsey is 536 (per
100,000 of the population) which equates to 548 hospital stays in 2018. This figure has
been in steady decline since 2014 and is better than the national average, placing West
Lindsey in the top quartile nationally.
Mental Health
The overall picture for mental health is positive for West Lindsey when compared to the
country as a whole. The rate of hospital admissions as a result of self-harm is 157 (per
100,000 of the population) which is better than the national average.
At 9.1 (per 100,000), the suicide rate is in line with the national average and figures have
remained broadly similar since 2012.
Since 2011, the Office for National Statistics have asked personal well-being questions to
adults in the UK in order to gain a better understanding of how they feel about their lives.
Respondents are asked to state how satisfied they feel with their lives on a scale of 0 (not
at all) to 10 (completely). The table below shows that West Lindsey residents remain highly
satisfied with their lives overall and that levels of anxiety remain low; figures that have been
broadly static since 2011.
Feelings of Wellbeing – Average Response
Direction of
Question West Lindsey UK
Travel
How satisfied are you with your life
8.08 ↑ 7.71
nowadays?
To what extent do you feel that the
8.12 ↑ 7.78
things in your life are worthwhile?
How happy did you feel yesterday? 7.7 ↓ 7.56
How anxious did you feel yesterday? 2.66 ↓ 2.87
13The estimated prevalence of mental health disorders in children and young people (aged 5-
16) is 9.1%, matching the figure for the country as a whole. There is not enough data
available to identify trends for previous years but the overall picture for the UK points to an
increase in demand for Child and Adolescent Mental Health Services (CAMHS) and this is
likely to be the case in West Lindsey.
It is not possible to analyse information relating to diagnoses of dementia at district level,
however, the latest figures available for Lincolnshire as a whole show that the proportion of
over 65s with a diagnosis of dementia stands at 3.95%, lower than the national average of
4.33%. By 2035, a total of 2,555 adults aged 65 or over in West Lindsey are predicted to
have a diagnosis of dementia which equates to 7.81% of the population aged 65 and over.
Projected figures from the Lincolnshire Joint Strategic Needs Assessment (JSNA) show
that, by 2035, 2,730 residents (8.3%) aged 65 and over are predicted to suffer from
depression, with 897 (2.7%) of these predicted to suffer with severe depression.
Disability
Data from the 2011 Census (the latest available) showed that 18.7% of the working age
population described themselves as having a long-term health condition, illness or
disability, which is comparable to the national average. Just under 11% of people stated
that they provide some form of unpaid care to friends, family members or neighbours which
is also in line with the national average.
More recent data at a local level is not available, however, projections from the JSNA show
that by 2030, 4,274 adults in West Lindsey will have a moderate physical disability or
sensory impairment; 1,319 adults will have a serious disability or sensory impairment, and
1,237 adults are predicted to have a learning disability. In total, these figures equate to
20.9% of the projected working age population. Figures are not available for children under
18.
Recent studies by the ONS and disability charity Scope show that people living with long-
term health conditions and disabilities face significant challenges. They are more likely to
live in poverty and less likely to be in employment. Currently, ONS figures show that the
national gap between people with a disability in employment and those without a disability
in employment stands at 30 percentage points.
Nationally, one-third of people living with a disability or long-term health condition do not
access public, commercial and leisure goods or services and one-fifth experience regular
difficulties accessing public transport, a problem that is particularly prevalent in rural areas.
One in three people living with a disability live in poor quality or unsuitable accommodation
and these are all factors to be taken into consideration at a local level.
14Participation in Physical Activity
The proportion of adults reporting participation in physical activity (defined as moderate
activity for at least 150 minutes per week) is 65.9%, an increase of 4.5 percentage points
on 2018 and above the county average of 63.11%. Adult participation in sport (defined as at
least 30 minutes of moderate intensity of sport per week) has also increased, up 3.7
percentage points from 2018 to 35.8%. This is the second highest result in Lincolnshire
after North Kesteven and higher than the County average of 30.8%. By comparison, 26.0%
of adults report being physically inactive, an increase of 2.1% compared to 2018 and higher
than the country as a whole (22.2%).
Adult participation in weekly sport and physical activity
80.00%
70.00%
60.00%
50.00%
40.00%
30.00%
20.00%
10.00%
0.00%
Boston
North Kesteven
Lincolnshire
City of Lincoln
East Lindsey
South Kesteven
South Holland
West Lindsey
% of adults participating in sport % of adults participating in physical activity
Source: Active Lincolnshire
Walking is widely recognised as one of the easiest forms of exercise in terms of cost,
accessibility and effectiveness in aiding fitness and weight loss. In West Lindsey 20.6% of
West Lindsey adults report walking for travel at least three days per week, higher than the
regional average of 18.8%.
15Cycling rates for adults in the district have fallen over the last year with 3.2% of adults
reporting that they cycle for travel at least three days per week compared to 4.9% the
previous year. However, this is still on a par with the national average and is higher than the
regional average of 2.6%.
The number of people using the West Lindsey Leisure Centre fluctuated on a monthly basis
throughout 2019. From a low of 18,138 in December of that year, there was a significant
increase in usage up to January 2020 (28,815). As a result of the Coronavirus pandemic,
government restrictions on gyms and leisure centres meant that the West Lindsey Leisure
Centre was closed between March and July 2020 and so comparable usage figures beyond
January are not available. In June 2020, West Lindsey District Council opened a new
Leisure Centre in Market Rasen.
Usage of West Lindsey Leisure Centre Facilities April 2019 - March 2020
35,000
30,000
25,000
20,000
15,000
10,000
05,000
00,000
Apr May Jun Jul Aug Sep Oct Nov Dec Jan Feb Mar
16Physical Activity in Children
In December 2019, Sport England released the second Active Lives Children and Young
People Survey which is based on responses from children aged 5-16 between November
2018 and November 2019.
The picture for West Lindsey is poor. Figures show that 51.8% of children undertake the
recommended level of at least 150 minutes of activity every week which places the district
second bottom in the County (where the average is 57.4%) and below the national average
of 63.3%. Likewise, 57.2% of children in West Lindsey are classed as inactive (no physical
activity in the last 28 days), the highest figure in Lincolnshire and above the national
average of 56.5%. A total of 11.4% of children did not participate in any sport or physical
activity in the last year, significantly higher than both the Lincolnshire (8.4%) and national
(5.4%) averages.
% of children taking part in sport or physical activity for at least 150 minutes per
week
England Boston East Lincoln North South South West
(63.3%) (52.7%) Lindsey (65.6%) Kesteven Holland Kesteven Lindsey
(55.1%) (66.8%) (51.0%) (58.6%) (51.8%)
Source: Sports England
17Employment and Unemployment
Employment and Unemployment Rates
As of December 2019, there were 46,000 economically active people resident in West
Lindsey. Of these, 45,400 or 81.8% were in employment, up from 74.9% the previous year.
This is significantly higher than both the regional (76.9%) and national average (75.8%).
When split by gender, the picture varies with a higher than average rate of employment for
men (86.9% compared to a national average of 79.9%) compared to a lower rate for women
(76.9% compared to a national average of 71.7%).
West Lindsey East Midlands Great Britain
Economically active 82.8% (46,000) 80% 78.9%
Employed 81.8% (45,400) 76.9% 75.8%
6,500
Self-employed 10% 10.9%
(% suppressed)
Economically inactive 17.2% (9,200) 20% 21.1%
Source: NOMIS
Whilst employment rates have remained fairly stable in recent years at a national and
regional level, West Lindsey has experienced fluctuations since 2004 although the number
of people in employment has risen significantly since September 2018.
West Lindsey Employment Rate Over Time
47,000
45,000
43,000
41,000
39,000
37,000
35,000
January 2004 to December 2019
Source: NOMIS
18In the 12 months to December 2019, the unemployment rate in West Lindsey stood at 3.8%
which equates to 1,800 adults, an improvement of 1.2% on the previous year. This is on a
par with both the regional (3.7%) and national rate (3.9%). At the height of the economic
downturn, the unemployment rate in West Lindsey was as high as 8.4% after which it went
in to steady decline until June 2016 when it began to rise again for a short period before
falling to current levels. Nationally, the unemployment rate has been in steady and
continuous decline since 2012, however, the economic impacts of the global COVID-19
pandemic are likely to lead to an increase in unemployment locally and nationally in the
coming months.
Unemployment Rates Over Time
25.0
20.0
15.0
10.0
5.0
0.0
January 2004 to December 2019
West Lindsey East Midlands Great Britain
Source: NOMIS
Economic inactivity is defined as the section of the working age population which is not in
employment and not actively seeking employment. This includes students, those looking
after a family or home, people who are temporarily or long-term sick and those who are
retired. In West Lindsey, the overall figure for economic inactivity stands at 12,400 people
or 22.1% of the population, higher than both the regional (21.7%) and national average
(21.5%). It is not possible to break the overall figure down further due to suppression of
data for reasons of data protection.
19Youth Unemployment
Youth unemployment, traditionally defined as the proportion of people aged 16-24 in receipt
of unemployment related benefits, experienced a sharp rise to 10% (or 605 people) in May
2020, compared to 4.1% (345 people) in May 2019. This is higher than both the regional
(8.1%) and national averages (9.3%) and means that West Lindsey remains in the bottom
quartile of all local authorities. Whilst the youth claimant count is a persistent and ongoing
issue for the District, such a sharp increase during the first half of 2020 is likely to be a
result of unemployment caused by the COVID-19 pandemic. Early indications from the
Office for National Statistics show that youth unemployment both locally and nationally is
likely to increase further over the coming months. While figures for the number of young
people not in education or training (NEETs) is not available at district level, for Lincolnshire,
the number stood at 740 in February 2020, an improvement of 12% compared to the
previous year.
Youth Unemployment in West Lindsey Over Time
700
650
600
550
500
450
400
350
300
250
200
January 2013 to May 2020
Source: NOMIS
20Claimant Count
Universal Credit (UC) began to be rolled out across West Lindsey in 2018. This replaced
previous out of work benefits such as Job Seeker’s Allowance and Incapacity Benefit.
Under Universal Credit, a broader span of claimants are required to look for work and as
Universal Credit continues to roll out, the claimant count is expected to increase.
As of May 2020, there were 2,975 working age people claiming key out of work benefits in
the district, representing 5.4% of the working age population. This is an increase of 90.71%
compared to the same time last year (or 1,415 people) but is lower than the regional (5.7%)
and national averages (6.4%). As with youth unemployment, the significant increase in the
number of working age people claiming out of work benefits is likely to be a direct
consequence of the COVID-19 pandemic and early indications by the Office for National
Statistics show that this figure is also likely to increase over the coming months.
Claimant Count Over Time
18.0
16.0
14.0
12.0
10.0
8.0
6.0
4.0
2.0
0.0
January 2013 to May 2020
West Lindsey East Midlands Great Britain
Source: NOMIS
Jobs Density
Jobs density is defined as the number of jobs in an area divided by the resident population.
For example, a density of 1.0 would mean there is one job for every resident aged 16-64.
In West Lindsey, latest figures for 2018 show that there was a total of 31,000 jobs, equating
to a density of 0.56 which is a reduction of 2,000 jobs compared to the previous year. This
is lower than both the regional (0.80) and national density (0.86). The number of employee
jobs in 2018 (which excludes self-employment, government supported trainees and HM
Forces) in the district stands at 25,000. Of these, 16,000 are full-time (68%) and 9,000
(36%) are part-time, a ratio that is on a par with the regional and national average.
21Support for Vulnerable Groups
Homelessness
In 2018, a total of 69 households were accepted as being homeless and in priority need, an
increase of 26 on the previous year although the homelessness rate (0.02 per 1,000
households) remains significantly below the national and regional averages.
In the 12 months leading up to March 2019, a total of 192 households were prevented from
becoming homeless in West Lindsey, compared to 227 households the previous year. A
total of 197 nights were spent in bed and breakfast accommodation with the average stay in
temporary accommodation at 35.9 days.
Poverty
Poverty is influenced by factors such as long-term worklessness; low earnings, educational
attainment, family instability and drug and alcohol dependency. Projections by the Institute
for Fiscal Studies show that absolute poverty, and absolute child poverty is predicted to rise
sharply in the East Midlands in the next three years.
Child Poverty
The table below shows a mixed picture for child poverty rates across West Lindsey as of
December 2018 (latest figures available). Before housing costs are taken into
consideration, 14% of children are living in poverty across West Lindsey as a whole, an
increase of 2.2 percentage points on the previous year.
After housing costs are taken into consideration, the percentage of children living in poverty
has marginally reduced over the last 12 months by 1.59 percentage points to 24%. Figures
range from 13.6% in Sudbrooke to 36.4% in Gainsborough East. Rates of child poverty
have improved for 12 wards; particularly Gainsborough North where the rate has improved
by 8.97 percentage points. For the remaining 13 wards, child poverty levels have worsened,
particularly in Lea, Scampton, Scotter, Stow and Fiskerton.
22Child Poverty in West Lindsey – December 2018 (based on 2013 wards)
% of children % of children
% change % change
in poverty in poverty
from from
Ward (before (after
December December
housing housing
2017 2017
costs) costs)
Bardney 9.3% -4.04% 19.5% -1.85%
Caistor 11.4% -4.59% 24.0% -1.11%
Cherry Willingham 9.3% -2.58% 19.5% +0.42%
Dunholme 9.2% -1.69% 20.5% -2.92%
Fiskerton 9.3% +2.32% 19.5% +8.06%
Gainsborough East 30.1% +2.99% 36.4% -4.81%
Gainsborough North 23.7% -1.22% 29.0% -8.97%
Gainsborough South-
28.2% +4.46% 30.7% -5.5%
West
Hemswell 13.9% -3.76% 24.8% -2.91%
Kelsey 11.4% -6.6% 24.0% -3.95%
Lea 9.2% +1.45% 22.4% +9.71%
Market Rasen 15.2% -6.69% 26.0% -7.48%
Middle Rasen 15.2% +3.37% 26.0% +7.04%
Nettleham 7.3% +0.43% 13.6% +2.32%
Saxilby 10.4% -2.86% 22.3% +1.17%
Scampton 12.0% +3.34% 23.4% +9.28%
Scotter 11.6% +1.72% 24.5% +8.47%
Stow 9.2% +0.56% 22.4% +8.37%
Sudbrooke 7.3% +2.54% 13.6% +5.67%
Thonock 11.6% -4.85% 24.5% -1.3%
Torksey 9.2% -5.06% 22.4% -0.24%
Waddingham and
13.9% +3.12% 24.8% +7.42%
Spital
23Welton 9.2% -3.3% 20.5% +0.51%
Wold View 13.1% -3.08% 24.9% -0.59%
Yarborough 11.4% -0.99% 24.0% +4.14%
West Lindsey 14% +2.2% 24.0% -1.59%
Source: National Children’s Bureau
Fuel Poverty
A household is said to be in fuel poverty if required fuel costs are above the national
average level and the residual income that a household is left with after fuel costs is below
the official poverty line.
Fuel poverty varies across West Lindsey but, overall, Department for Business, Energy and
Industrial Strategy (DFBEIS) figures show that 5,207 households (12.8%) in the district are
living in fuel poverty, an increase of 376 households (or 7.78%) on the previous year. This
is higher than the County (11.8%), regional (10.9%) and national averages (11.8%).
Number of Households in Fuel Poverty by Ward
Wold View
Waddingham and Spital
Torksey
Sudbrooke
Stow
Scotter
Scampton
Saxilby
Nettleham
Market Rasen
Lea
Kelsey
Hemswell
Gainsborough South-West
Gainsborough North
Gainsborough East
Dunholme and Welton
Cherry Willingham
Caistor and Yarborough
Bardney
0 100 200 300 400 500 600
Source: DFBEIS
24Fuel Poverty in West Lindsey (2018)
Number of % of
% change from
Ward households in households in
2016
fuel poverty fuel poverty
Bardney 147 15.1% +20.5%
Caistor and Yarborough 371 14.4% + 20.85%
Cherry Willingham 308 10.4% + 3.7%
Dunholme and Welton 332 9.5% + 13.7%
Gainsborough East 359 11.3% - 15.1%
Gainsborough North 428 13.5% - 15.8%
Gainsborough South-West 390 16.5% - 11.8%
Hemswell 214 19.2% + 28.1%
Kelsey 158 13.6% + 17.9%
Lea 141 14.3% + 18.5%
Market Rasen 545 13.8% + 29.5%
Nettleham 194 8.8% - 11.0%
Saxilby 291 12.1% + 9.8%
Scampton 192 14.6% + 23.1%
Scotter 432 13.0% + 13.68%
Stow 137 13.5% + 18.1%
Sudbrooke 106 9.5% + 16.5%
Torksey 143 10.8% + 31.2%
Waddingham and Spital 169 15.3% + 18.2%
Wold View 150 14.6% + 23.9%
West Lindsey 5,207 12.8% + 7.78%
25In-Work Poverty
The real living wage is independently calculated every year by the Real Living Wage
Foundation. It is higher than the national living wage (£8.72 per hour) but calculated
independently to determine the minimum amount of money a worker needs to be paid
based on the actual cost of living in the UK. The real living wage is currently defined as
£9.30 per hour.
Figures from the Office for National Statistics show that, as of May 2019, 7,000 workers in
West Lindsey earned below the real living wage, which equates to 30.5% of the working
population in the district. Of this number, part-time workers are more affected with 5,000 of
this cohort taking home less than the Living Wage; 71.4% of the overall figure.
Of all full-time jobs in the district, 22% are paid below the real living wage.
Deprivation
The Indices of Multiple Deprivation (IMD) were last updated in 2019. The IMD uses a series
of indicators based on crime to measure deprivation (which is different to poverty) down to
district and lower super output area (LSOA) level.
Overall, West Lindsey ranks 146th most deprived of 317 local authorities, a decline of one
place since 2015 and placing the district slightly above the median.
The highest levels of deprivation can be found within the Gainsborough East and
Gainsborough South-West wards while the least deprived areas can be found within
Dunholme and Welton. The following map shows the overall rank broken down by LSOA
with areas marked in light blue experiencing the lowest levels of deprivation graduating to
dark blue for areas with the highest deprivation.
2627
Place

 28
Education and Skills
Education Profile

For the first time, the gap between the skills profile for West Lindsey and the rest of the country has
narrowed. In 2019, 40,600 people (76.3%) gained at least a level 2 qualification (equivalent to 5 good
GCSEs), which is higher than both the regional (74.4%) and national average (75.6%) for the first
time. The gap that exists for post-16 education has narrowed with 28,300 people (53.1%) gaining a
Level 3 qualification (equivalent to A Level) compared to 56.4% for the East Midlands and 58.5% for
the country as a whole.

Over the past decade, the proportion of the population with a level 4 qualification (equivalent to
HND, degree level or higher) has fluctuated although it has declined for the first time since 2012;
down by 3.7% on the previous year. There are currently 17,600 people in the district that hold at
least a level 4 qualification.

                 Educational attainment as a % of people aged 16-64 (2019)
                                                  % change              East
                             West Lindsey                                                England
                                                from last year        Midlands
   No qualifications          Suppressed               N/A              7.0%               6.7%
  Level 1 and above              90.9%              + 8.4%              85.5%              85.6%
  Level 2 and above              76.3%              + 6.4%              74.4%              75.6%
  Level 3 and above              53.1%              + 6.1%              56.4%              58.5%

                                                                                     Source: NOMIS

Employment by Sector

As of 2018, manufacturing, construction, education and human health activities were the
predominant employment industries in the District. In contrast, finance and insurance,
information and communication and professional, scientific and technical activities are the
sectors that have the lowest employment levels in the district when compared to the
national average.

                                                  29
Employee jobs by Industry
Industry West Lindsey East Midlands Great Britain
Mining and quarrying 0.3% (75) 0.2% 0.2%
Manufacturing 14% (3,500) 12.9% 8.1%
Electricity, gas, steam and air
0.1% (20) 0.8% 0.5%
conditioning supply
Water supply; sewerage, waste
management and remediation 1.8% (450) 0.7% 0.7%
activities
Transportation and storage 3.6% (900) 5.5% 4.8%
Accommodation and food service
7.0% (1,750) 7.0% 7.6%
activities
Information and communication 1.8% (450) 2.9% 4.2%
Financial and insurance activities 0.5% (125) 1.7% 3.5%
Real estate activities 2.4% (600) 1.3% 1.7%
Professional, science and technical
6.0% (1,500) 6.4% 8.7%
activities
Administrative and support service
6.0% (1,500) 8.7% 9.1%
activities
Public administration and defence;
5% (1,250) 3.7% 4.3%
compulsory social security
Education 10% (2,500) 9.2% 8.9%
Human health and social work
10% (2,500) 13.1% 13.2%
activities
Arts, entertainment and recreation 3.2% (800) 2.6% 2.5%
Other service activities 1.8% (45) 2.0.% 2.0%
Source: Office for National Statistics
30Self-employment
The number of people who are self-employed in the district stands at 5,600, down from
6,400 the previous year. Percentages have been suppressed by the Office for National
Statistics so it is not possible to make regional and national comparisons for this dataset.
Earnings
As of December 2019, the average gross weekly earnings stood at £558.90, up £9.40 on
the previous year. This is higher than the regional average (£547.40) but lower than the
national average (£587.00). Men in full-time employment in West Lindsey earn £128.60 per
week more than women, a gap that has narrowed by £27.40 per week compared to the
previous year. This gender gap is wider than both the regional average (£114.20 per week)
and the national average (£103.10 per week).
The average hourly rate of pay for full-time workers stands at £14.37 which is above the
regional average (£13.63) but lower than the national average (£14.88), Again, there is a
gender gap for those in full-time employment with women having a lower rate of pay
(£13.49 per hour) than men (£14.81) though this gap has narrowed for the first time.
Average Gross-Weekly Earnings (2019)
£700.00
£600.00
£500.00
£400.00
£300.00
£200.00
£100.00
£0.00
West Lindsey East Midlands Great Britain
Full-time workers Female full-time Male full-time
31The Economy
Occupations
Compared to the rest of the region and the country as a whole, West Lindsey has a higher
proportion of professional occupations (25.9%). The district also has a significantly higher
proportion of skilled trades occupations (15.2%) compared to the rest of the region (11.9%).
A full breakdown is detailed in the table below, except where figures have been suppressed
for data protection reasons.
West Lindsey
Occupation West Lindsey East Midlands Great Britain
(numbers)
Managers, Directors
4,900 11.7% 11.1% 11.6%
and senior officials
Professional
10,800 25.9% 18.3% 21.5%
occupations
Associate
professional and Suppressed Suppressed 13.5% 14.7%
technical
Administrative and
4,500 10.8% 9.5% 9.7%
secretarial
Skilled trades 6,300 15.2% 11.7% 9.9%
Caring, leisure and
4,600 11.1% 9.1% 9.0%
other services
Sales and customer
Suppressed Suppressed 7.3% 7.0%
services
Process, plant and
Suppressed Suppressed 8.4% 6.0%
machine operatives
Elementary
Suppressed Suppressed 10.9% 10.2%
occupations
Source: NOMIS
32Number of Businesses
The number of active business counts in West Lindsey rose by 10 over the last year to
3,740. The number of local units (i.e. business locations) within West Lindsey also rose, up
by 5 on the previous year to 4,190.
Micro enterprises (employing 0-9 people) make up 86.4% of all business in the district, with
3,620 such enterprises as at December 2019. There are 485 small businesses employing
between 10 and 49 people, an increase of 185 on the previous year. There a total of 80
medium size businesses employing 50 to 249 whilst large businesses employing 250+
people total five.
Economic Performance
The output of the local economy can be measured by its Gross Value Added (GVA). This is
a measure of economic output calculated as the value of output minus the value of
intermediate consumption. ONS figures show that West Lindsey’s GVA was £1.43 billion in
2018, an increase of £68 million from the previous year. This is the third highest rise in
Lincolnshire.
GVA over time – all Lincolnshire Districts (£ million)
3,000
2,800
2,600
2,400
2,200
2,000
1,800
1,600
1,400
1,200
1,000
2010 2011 2012 2013 2014 2015 2016 2017 2018
Boston East Lindsey Lincoln
North Kesteven South Holland South Kesteven
West Lindsey
Source: Office for National Statistics
33Business Confidence
The Lincolnshire Chamber of Commerce surveys business confidence within the county
every quarter. The latest published results for quarter four of 2019 show that, for the first
time since 2015, business confidence in Lincolnshire has decreased. This significant
decline in confidence is attributed to long-term uncertainty, rising business costs and a
continued slowing global economy. Confidence regarding profitability amongst Lincolnshire
businesses has fallen, showing a marked decline on the previous year. The latest results
for the survey point to a reduction in overseas orders and worsening cashflow, however,
workforce levels have been maintained. Confidence levels around future turnover and
profitability have slumped and it is likely that the next published set of results will see a
continuation of this trend as the economic impact of COVID-19 becomes evident.
34Economic Opportunity
Grant Thornton Sustainable Growth Index
Grant Thornton’s Sustainable Growth Index (previously the Vibrant Economy Index)
measures six groups of variables (Prosperity, Dynamism and Opportunity, Inclusion and
Equality, Health, Wellbeing and Happiness, Resilience and Sustainability and Community,
Trust and Belonging).
Overall, West Lindsey’s is ranked 264th out of 324 local authority areas, a drop of 15 places
on the previous year, placing the district in in the bottom quartile.
Source: Grant Thornton
Within specific indices, West Lindsey ranks best for Health, Wellbeing and Happiness
(125th), and worst for community, trust and belonging (292nd).
35Social Mobility
The Social Mobility Index compares the chances that a child from a disadvantaged
background will do well at school and get a good job for each of the 324 local authority
areas. It sets out the differences between where a child grows up and the chances they
have of doing well in adult life.
West Lindsey’s overall social mobility rank has fallen according to the government’s latest
assessment (2017), placing the district below the median (168th out of 324). The district
ranks in the top 20% for Early Years education and high for primary education but the trend
continues downwards with the district placed in the bottom quartile by the time a child
finishes secondary education.
Source: Social Mobility Commission
36Housing
Overview
West Lindsey is committed to housing growth and economic development, primarily through
the development of new housing. The Central Lincolnshire Local Plan commits to building
4,435 new homes in West Lindsey by 2036. There are currently 42,369 dwellings in West
Lindsey.
House Prices and Affordability
As of January 2020, the average house price in West Lindsey stood at £178,000, the
highest ever recorded for the district. In line with overall trends, this represents an increase
on the previous year of £9,144 (or 5.4%) but remains lower than the regional average of
£194,000. While house prices have increased, the affordability ratio, calculated by dividing
the median house price by median annual earnings, stands at 5.87 which is worse than
both the national and regional averages.
Tenure
According to the Building Research Establishment (BRE), across the district 69% of
dwellings are owner occupied, with 19% privately rented and 12% social rented.
Rates of home ownership have fallen 3.6% in relative terms across West Lindsey since
2011, while the private rented sector has grown by 5.3%.
The most drastic change has occurred within Gainsborough South-West, where home
ownership rates fell by 10.97% and private renting rates increased by 10.43%.
Housing Stock
Around 23% of all houses in the district were built before 1919 (on par with the England
Average). In Gainsborough South-West Ward the figure rises to 62%. Only 6% were built
between 1919 and 1944. Post 1990, 69% were built (but not in Gainsborough South-West,
where the figure is 32%).
Of all households 22.9% (or 9,461 households) are not in receipt of mains gas, and this is
mostly concentrated in a band running from the Thonock and Blyton areas north of
Gainsborough south-east to Welton, taking in Waddingham and Hemswell. Being off grid
for fuel can carry fuel poverty implications for such households.
Of the 42,369 properties in the district as at March 2019, band A and B properties made up
56.02%.
Empty Homes
The number of empty homes has increased by 10 to 583 in 2019. Gainsborough south-west
ward has the highest number of empty homes, followed by Caistor and Yarborough, Market
Rasen and Scotter and Blyton.
37Number of Vacant Dwellings in West Lindsey
1,100
1,000
900
800
700
600
500
400
2004
2014
2015
2005
2006
2007
2008
2009
2010
2011
2012
2013
2016
2017
2018
Source: Office for National Statistics
Condition surveys
Excess cold is a particular issue in rural areas and in West Lindsey, the highest
concentration of households in excess cold are Waddingham and Spital, Hemswell and
Wold View. The BRE found that, overall, 10% of households are in excess cold,
significantly higher than the national average of 5%. When broken down by tenure, social
housing stock is more thermally efficient than private rented stock; a result of more stringent
requirements placed on social housing providers. Private rented housing stock in the district
also has a higher risk of hazards (21%), disrepair (7%) and fuel poverty (15%), figures that
are all higher than the national average. The table below shows the number and
percentage of hazards, excess cold, and disrepair by ward.
38No of All Excess Fall
Ward Disrepair
dwellings hazards cold hazards
Bardney 1,215 231 (19%) 131 (11%) 123 (10%) 59 (5%)
Caistor and Yarborough 2,611 412 (16%) 187 (7%) 236 (9%) 108 (4%)
Cherry Willingham 3,336 368 (11%) 167 (5%) 215 (6%) 105 (3%)
Dunholme and Welton 3,398 443 (13%) 270 (8%) 213 (6%) 91 (3%)
Gainsborough East 3,292 313 (10%) 23 (1%) 229 (7%) 84 (3%)
Gainsborough North 3,308 640 (19%) 107 (3%) 442 (13%) 196 (6%)
Gainsborough South-West 3,098 813 (26%) 129 (4%) 535 (17%) 277 (9%)
Hemswell 1,226 438 (36%) 325 (27%) 137 (11%) 81 (7%)
Kelsey Wold 1,125 356 (32%) 278 (25%) 112 (10%) 57 (5%)
Lea 986 226 (23%) 150 (15%) 103 (10%) 49 (5%)
Market Rasen 4,122 841 (20%) 516 (13%) 358 (9%) 204 (5%)
Nettleham 1,893 177 (9%) 50 (3%) 128 (7%) 73 (4%)
Saxilby 2,541 425 (17%) 259 (10%) 202 (8%) 115 (5%)
Scampton 1,207 249 (21%) 124 (10%) 127 (11%) 69 (6%)
Scotter and Blyton 3,353 698 (21%) 455 (14%) 288 (9%) 140 (4%)
Stow 1,065 196 (18%) 106 (10%) 97 (9%) 43 (4%)
Sudbrooke 1,077 75 (7%) 39 (4%) 44 (4%) 25 (2%)
Torksey 982 226 (23%) 199 (20%) 59 (6%) 28 (3%)
Waddingham and Spital 1,128 483 (43%) 372 (33%) 150 (13%) 77 (7%)
Wold View 1,171 393 (34%) 299 (26%) 116 (10%) 66 (6%)
Source: Building Research Establishment
39Housebuilding
Housebuilding rates in West Lindsey have fluctuated over the last decade, with the number
of housing completions declining slightly compared to the previous year.
Year Completions Population Change Population/House
2005-06 860 +1,226 1.43
2006-07 850 +1,493 1.76
2007-08 670 +916 1.37
2008-09 510 +355 0.70
2009-10 490 +748 1.53
2010-11 350 -114 -0.33
2011-12 220 +797 3.62
2012-13 240 +668 2.78
2013-14 320 +1,072 3.35
2014-15 390 +1,025 2.63
2015-16 330 +922 2.79
2016-17 170 +566 3.32
2017-18 170 +569 2.24
Source: ONS
40Access to Services Overview Access to services in West Lindsey such as local shops, schools and urban amenities is generally moderate to poor by Lincolnshire standards in areas outside Gainsborough, Market Rasen, or nearby wards such as Thonock. There have been significant improvements to the number of households with access to superfast broadband over the last year. Broadband Superfast broadband is defined as equal to, or greater than, 24Mbp/second. Access to high speed broadband is to become a legal right delivered by a universal service obligation (USO) to provide everybody with access to speeds of at least 10Mbp/second. By 2020, it was anticipated that 98% of the country would be able to order a fixed, superfast broadband connection. OnLincolnshire have made a commitment to provide faster broadband to over 9,000 premises county wide as part of the roll out of phase 3, with 97% of these being in rural or very rural areas. As of May 2020, superfast broadband is available to 88.47% of households in West Lindsey, an increase of 0.45% compared to the previous year and lower than the national figure of 97%, meaning that OnLincolnshire’s target has not been met. Access to broadband remains an issue across the district due to its size, topography and rural nature. Rural and very rural areas continue to experience the slowest progress in terms of access to superfast broadband with 3.75% of households still restricted to
Crime

Lincolnshire Police neighbourhoods in West Lindsey, including Gainsborough Town North
    (dark red), Gainsborough Town South (bright red), and Gainsborough Uphills (purple)

                                         42
Overall Crime
Crime rates continue to increase in West Lindsey and Lincolnshire Police recorded the
overall crime rate for the district as 55.67 per 1,000 of the population in 2018, an increase
from 50.89 in 2017; 45.7 per 1,000 in 2016; 40.0 during 2015 and 39.5 in 2014.
The district has the third lowest crime rate in the county. Overall, there were 5,737 recorded
crimes in the 12 months to December 2019, an increase of 778 on 2018. Lincolnshire
Police data shows that West Lindsey has the second lowest crime rate in the county which
has an average crime rate of 79 per 1,000.
Types of crime
Amongst individual crimes, major types include theft offences and burglary, criminal
damage and arson, shoplifting and violent crime.
The table below shows a breakdown of crime by type. With the exception of bicycle theft
and homicide, all categories of crime have experienced an increase over the last twelve
months with stalking and harassment offences seeing the biggest increase, up from 26 in
2018 to 407 in 2019.
Category Dec 2015 Dec 2016 Dec 2017 Dec 2018 Dec 2019
All other theft offences 594 566 703 695 710
Bicycle theft 45 55 77 50 45
Criminal damage and arson 568 704 781 810 832
Death and serious injury
0 0 1 1 3
caused by illegal driving
Domestic burglary 269 322 507 471 489
Drug offences 107 101 135 120 131
Homicide 0 2 0 1 1
Miscellaneous crimes
65 63 88 107 115
against society
Non-domestic burglary 519 553 316 176 191
Possession of weapons
32 29 29 50 62
offences
Public order offences 103 77 102 265 304
Robbery 34 16 32 26 34
Sex offences 95 136 147 212 237
Shoplifting 367 364 584 437 485
Stalking and harassment
50 94 98 26 407
offences
Theft from the person 16 19 16 16 19
Vehicle offences 333 532 465 328 342
Violence with injury 332 386 433 562 607
Violence without injury 172 232 256 606 723
West Lindsey Total 3,369 4,251 4,770 4,959 5,737
Source: Office for National Statistics
43You can also read