How Bad is Delhi's Air? - Results from a Clean Air Asia Public Perception Survey on Air Pollution in Delhi
←
→
Page content transcription
If your browser does not render page correctly, please read the page content below
How Bad is
 Delhi’s Air?
   Results from a Clean Air Asia Public
Perception Survey on Air Pollution in Delhi
How Bad is
 Delhi’s Air?
   Results from a Clean Air Asia Public
Perception Survey on Air Pollution in Delhi
©2017 Clean Air Asia. All rights reserved.

Clean Air Asia 2017. “How Bad is Delhi’s Air? Results from a Clean Air Asia Public Perception
Survey on Air Pollution in Delhi”.

This publication may be reproduced in whole or in part in any form for educational or non-profit
purposes without special permission from the copyright holder, provided acknowledgment of the
source is made. Clean Air Asia would appreciate receiving a copy of any publication that uses this
Clean Air Asia publication as a source. No use of this publication may be made for resale or for any
other commercial purpose whatsoever, without prior permission in writing from Clean Air Asia.

Disclaimer
The views expressed in this publication are those of Clean Air Asia staff, consultants and
management, and do not necessarily reflect the views of the Board of Trustees of Clean Air Asia.
Clean Air Asia does not guarantee the accuracy of the data included in this publication and does
not accept responsibility for the consequences of its use.
Contents
 Acknowledgement ...................................................................................................... vii

 Preface .......................................................................................................................... ix

 About Clean Air Asia ................................................................................................. xi

 YCan ............................................................................................................................. 01

 1. Introduction .................................................................................................... 02

 2. Public Perception Survey ................................................................................ 04

 3. Methodology and Sample ............................................................................... 06

 4. Results .............................................................................................................. 13

       •      4.1 Understanding the issue of Air Pollution
       •      4.2 Effects of Air Pollution on Quality of Life
       •      4.3 Causes of Air Pollution
       •      4.4 Initiatives to Tackle Air Pollution
       •      4.5 Government Initiatives
       •      4.6 Access to Air Quality
       •      4.7 Trends in Air Quality
       •      4.8 Proposed Large Scale Initiatives
       •      4.9 Proposed Individual Level Initiatives
 Way Forward ....................................................................................................... 25

 Appendices

 i. Schedule ................................................................................................................... 28

 ii. Perception Survey Questionnaire ....................................................................... 29

 iii. Bibliography .......................................................................................................... 33

 iv. List of Figures ........................................................................................................ 34

 v. List of Embassy Volunteers ................................................................................... 35

 vi. List of Ycan Volunteers ........................................................................................ 36
Credits
Overall Supervision and Editing: Prarthana Borah

Data Analysis and Report Writing: Vasundhara Bhojvaid

Comments and Inputs: Bjarne Pederson
Data Collection: YCan members, CAA team and volunteers from Embassy of the United
States of America, Embassy of Spain, Canadian High Commission and Embassy of Sweden

Data Entry and Assessment: Navjit Babrah
Design and Layout: Jharna Gurung and Bani Bains
Support: Geeta Chaudhary and Aarushi Tanwar
Acknowledgements
 Clean Air Asia (CAA) would like to thank the Embassy of the United States of America in India for
 joining hands to partner in conducting this perception survey as part of the Earth Day Celebrations
 in New Delhi.

 We thank YCan, our enthusiastic youth group for planning and spending two days in the streets of
 Delhi interviewing all the participants of this perception survey. We would also like to say thank you
 to the volunteers from the Embassy of the United States of America, Canadian High Commission,
 Embassy of Sweden and Embassy of Spain, who took time off to be a part of the programme,

 A special thanks to Dr. Craig L. Dicker (Counselor for Cultural Affairs), Richard Pinkham (Director
 of Programmes, North India Office) and Ayesha Gideon (Cultural Affairs Specialist) from Embassy of
 the United States of America, New Delhi for their support to this survey.
Preface
While air quality today is a topic frequently discussed and reported by media as well as a theme for much
discussion in various forums in Delhi, we at Clean Air Asia were curious to find out how much of this
discussion percolates beyond the air quality community to the public. It is with this objective that we
conducted a perception survey with 1500 people through a process of random sampling in 4 different
zones in Delhi.

Our perception survey explores people’s understanding of common terminologies for air pollution like
‘particulate matter’ as well as attempts to understand people’s awareness of the relation between air and
health. The questionnaire is adapted from the Clean Air Asia Perception Survey questionnaire for Asian
Cities.

While the report in itself is an exercise to gauge awareness levels, we are happy to say that the process of
conducting the perception survey has in itself been an exercise for promoting awareness. This was possible
because of the support of Embassy of the United States in India who aligned the data collection process
with their Earth Day celebrations with the theme of Better Air Better Earth. It was also very encouraging to
have so many volunteers from the Embassy of Spain, Canadian High Commission, Embassy of Sweden and
Australian High Commission to join us in this endeavour of collecting data and talking about air quality
to random people in the streets of Delhi. Of course, Clean Air Asia’s strength was much enhanced because
over 60 volunteers from YCAN- Youth for Clean Air Network joined us in conceptualising the survey,
planning the two days for data collection and generating so much data in such a short span of time

The results are interesting. There is definitely air pollution awareness, but it emerges that this is linked
to vehicular emissions. In fact, it was interesting that people connected pollution to traffic immediately
but very few talked about waste and transboundary issues. Also, pollution and its impacts were more
familiar to people who had a direct impact from it like roadside tea stall owners, auto rickshaw drivers
and women who used traditional cookstoves. With regard to health impacts more people could make a
connection especially because itchy eyes and cough are becoming more and more common for them in
Delhi. Unfortunately, people although eager to take action, did not seem to be much aware on what needs
to be done, and could not think beyond planting a tree. The odd and even scheme of the government that
regulated the use of cars based on the number plate was however hailed as a pro-active measure of the
government to address air pollution.

This report presents a more detailed analysis of the data collected. We hope that it will give us a better idea
of the awareness levels for air pollution in Delhi and be a useful document for all those who are involved in
the clean air movement in Delhi.

Prarthana Borah
India Director
Clean Air Asia was established in 2001 by the Asian
Development Bank, the World Bank and USAID. Today, we are
registered as an international non-governmental organization
About
that leads the regional mission for better air quality and
healthier, more livable cities in Asia. We aim to reduce air Clean
pollution and greenhouse gas emissions in 1000+ cities in Asia
through policies and programs that cover air quality, transports,
industrial emissions and energy use. We work with ministries
Air Asia
(energy, environment, health and transport), cities in Asia,
private sector and development agencies to provide leadership
and technical knowledge for Air Quality Management. Clean Air
Asia is headquartered in Manila and has offices in Beijing and
New Delhi.
Clean Air Asia (CAA)’s work in India involves engaging with
Indian cities for better air quality management (AQM). This
aligns with the overall CAA work program on broad air quality
(AQ) interventions. CAA’s work in India involves providing
scientific inputs to city governments for better air quality,
sustainable transport/ mobility programmes and education/
communication for cleaner air. The focus of CAA’s work in India
is on cities with high impact potential as well as potential for
leveraging wider change.
CAA is working in thirty cities in India to assess air quality
management capacity leading to preparation of air action plans.
Towards this, CAA is also supporting capacity building activities
for air quality management. Clean Air Asia India has also
facilitated the Clean Air Knowledge Network (CAKN),
(www.allaboutair.in), a forum that connects air quality experts
and practitioners from across India and city officials with an
objective to promote knowledge sharing across cities on AQ
issues and share best practices.
A major component of CAA’s India programme is Education for
better air quality. The Train for Clean Air: Clean Air for Kids is
a bilingual (English and Hindi) programme for school children
between the age of 12-14 years that engages with children to
teach air quality issues. The programme involves interactive
classroom and citizen science activities. CAA also works with
primary school children to promote the message of clean air.
Clean Air Asia actively engages youth for technological solution
and innovative ideas to improve Air Quality. CAA’s Youth Clean
Air Network (YCan) is a volunteer program where youth can
passionately work together for better air quality.
Clean Air Asia has been actively working in India since 2008.
In the past, the India team has worked on green freight and
sustainable mobility projects, conducting Walkability Studies in
Indian cities, Walkability App, the National Bus Fuel Efficiency
Framework, the Green Trucks Toolkit for India, and an online
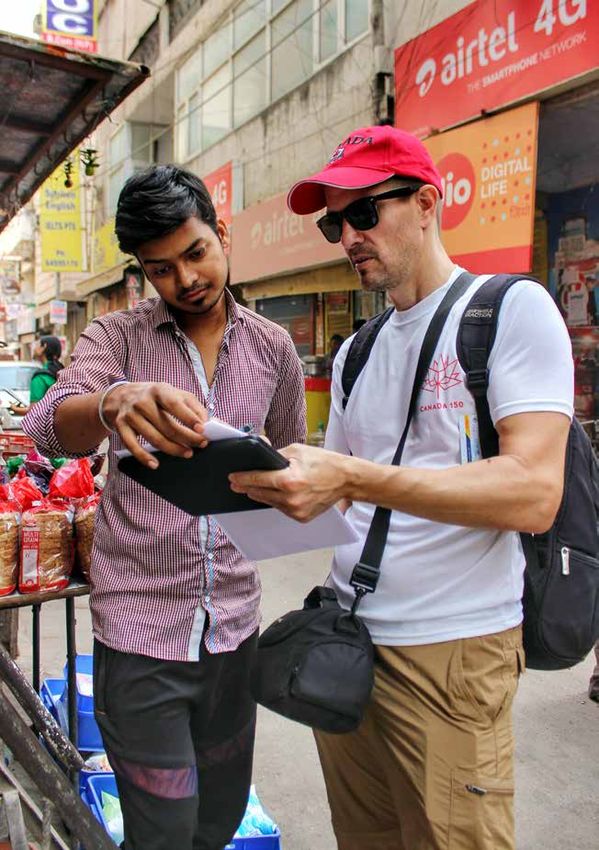
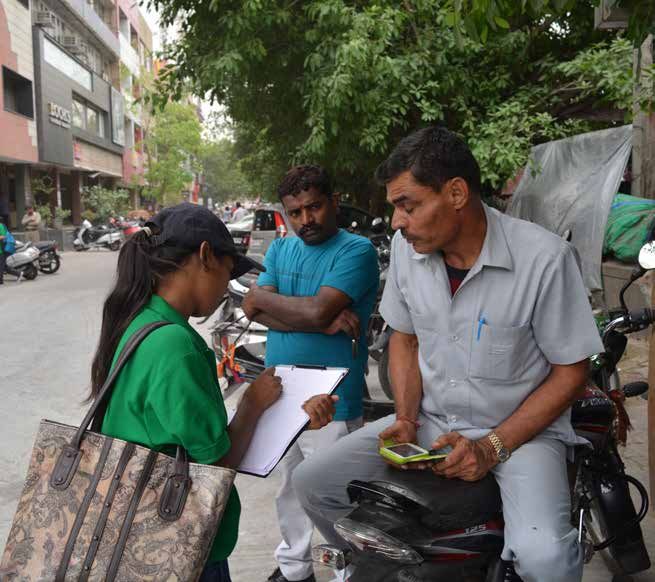
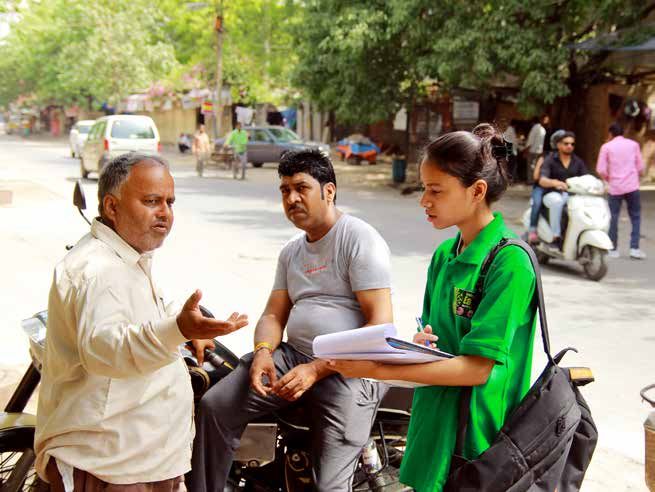
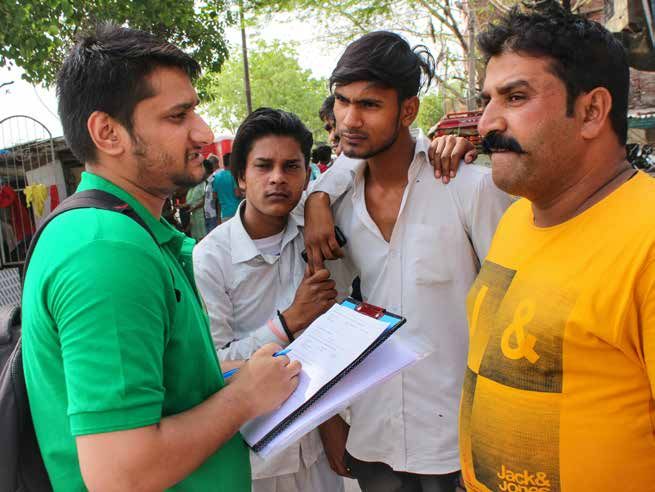
freight brokerage platform etc.In order to engage the youth and spread awareness on air quality, Clean Air Asia launched the Youth Clean Air Network (YCan), in December 2016, as a voluntary platform to engage young people in finding solutions for better air quality in Indian cities. YCan is involved primarily in evidence based advocacy and finding local innovative solutions to meet the challenge of air pollution. The activities of YCan and volunteer opportunity can be found on the website http://youthforcleanair.com/. This report is the result of a survey project launched and conceptualized by YCan and Clean Air Asia (CAA). The youth members that compose the YCan in Delhi, worked with CAA India to learn about air pollution issues, devise the survey tool, brainstorm on the methodology and implement the survey, followed by assisting in the analyses of data. Fifty YCan members implemented the survey tool on Earth Day (22nd April, 2017) across 15 locations in Delhi in a sample of 1,500 respondents. These regions were chosen by YCan members and volunteers as neighbourhoods in which they lived and as areas with major air pollution sources keeping in mind a certain distinguishing criterion with regards to sources of air pollution. YCan members and volunteers met with Clean Air Asia on weekends over 4 months to learn and discuss about air pollution data, pollutants, causes and issues in the city and ways to identify solution based actions. The survey, its design, implementation and analysis of data accrued was developed through a consultative process with YCan members. This report summarizes the results of the survey.
How Bad is Delhi’s Air?
1. Introduction
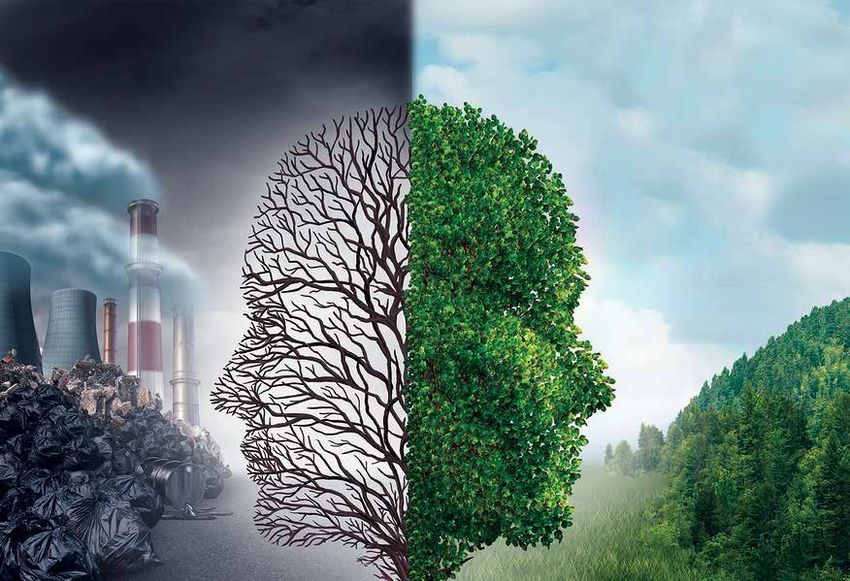
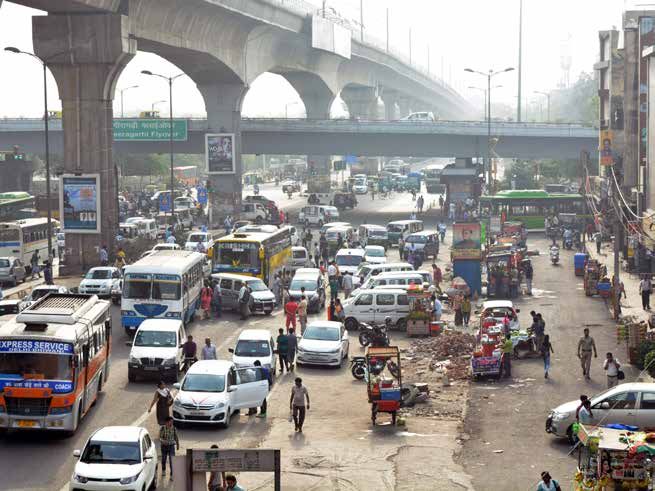
Increasing urbanization and the rapid pace of industrial growth, has
led to an acceleration in the percentage of pollutants and particulate
Air pollution has matter in the atmosphere. Common pollutants include – sulphur
become one of the chief dioxide, carbon monoxide, nitrogen dioxide, ozone and particulate
environmental concerns matter (PM10 and PM2.5). Urban centres are the sites of the highest
across the world today. It concentrations of pollutants as they are the locations of rapid
has implications for human development and increasing population density. The share of the
health, urban development, world’s population living in cities has grown from 35% in 1970 to 50%
and sustainable growth. in 2001, and is estimated to cross 70% in 2030 (UN-Habitat 2001).
WHO (2016) estimates Thus, a majority of the world’s population will soon be living in the
that air pollution is the most polluted areas of the world.
cause of one in nine deaths
across the world of which, Within India, Delhi is a booming metropolis with deteriorating air
nearly 3 million deaths are quality situations. A major cause of these alarming levels of pollution
attributable to ambient has been a sharp rise in the number of cars; dust from road and
or outdoor air pollution, construction activities, burning of municipal solid waste and industrial
affecting people across emissions. But most, importantly, expert studies have shown that
regions, socio-economic Delhi’s location in the Indo-Gangetic Plains, and the transboundary
categories and age groups. air pollution from adjoining states, causes it to become a funnel for
pollutants to accumulate (Kumar et al. 2015; Narain and Krupnick
2007; Ghosh et.al 2014). Although, scientific research on air pollution
in Delhi is developing steadily there is a crucial need to involve citizens
and especially the youth to not only understand the repercussions of air
pollution but to spearhead individual and collective efforts and spread
awareness on the issue of air pollution to lead to effective solutions.
022017-2018
03How Bad is Delhi’s Air?
2. About the Public
Perception Survey
A public perception survey is an opinion poll that is a scientific and unbiased
method to gather and analyse the opinions held by a population about a given issue.
Paul Edwards (2010) a historian of information, to the effects and scenario of air pollution
has argued that it has become increasingly that such changes will take place. Thus, an
difficult to talk of global ecology without intrinsic knowledge in people’s perceptions
making reference to expert-driven models. of air pollution is seminal (Bickerstaff and
This is the result of knowledge production Walker 2001). It is within this setting that this
and policy on environmental issues being study was undertaken. Further, while there has
an exclusively expert driven domain which been exponential growth in techno-scientific
places any involvement of the non-specialized research on air pollution in the recent past,
lay person as being inferior or unworthy. in terms of emission sources, technologies to
The YCan led public perception survey combat air pollution, health effects and air
was an effort to combat this trend, to make pollution, yet there is a paucity of research on
conversations around pollution and air quality the behavioural response to air pollution. In
more accessible to the larger public. This is 2013, Centre for Science and Environment
crucial as a collaborative change in air quality (CSE) undertook a perception survey for
is possible only with the active involvement of residents of Delhi on the link between air
Delhi’s citizens in changing their lifestyle and pollution and health. According to the survey, a
demanding effective policy measures and laws. majority of respondents felt that there was a link
between health and air pollution. In 2014, CSE
In ‘Public Understanding of Air Pollution: the also undertook a rapid perception survey for
‘localisation’ of environmental risk’ (2001), residents of Gurugram, which brought out that
Bickerstaff and Walker demonstrate the need a majority of the citizens feel that respiratory
to study public perception with special regard health is being affected as a result of air
to air pollution by arguing that ‘air pollution pollution. The survey undertaken by CAA in
represents a thoroughly social problem’ 2017 is an addition to prior perception changes
(Bickerstaff and Walker 2001; 133). That is, if as a means to document changing trends,
a sustained improvement in air quality is to but most importantly it differs from previous
be achieved a change in personal behaviour is attempts in that it was conceptualized and
necessary, such as decisions that mark a move implemented by a network of young individuals
towards more sustainable ways of living. It is who conscientiously want to address the issue of
only when people are engaged and perceptive air pollution in their city.
1
http://www.cseindia.org/content/perception-survey-outdoor-air-pollution-and-its-impact-our-health-0
2
http://www.cseindia.org/content/concern-over-poor-air-quality-and-traffic-congestion-gurgaon-action-must-gather-
momentum-pro
042017-2018
I spoke to a rickshawpuller, he said that air pollution really doesn’t make a
difference to him as he is poor and it’s the job of government to look after
such matters; his only aim is to earn and meet his and his family’s needs.
- Shreya
YCan Volunteer
05How Bad is Delhi’s Air?
3.Methodology and
Sample
In order to conduct this survey, the city of Delhi was divided into five zones -
North, South, East, West and Central. In each zone three regions were chosen to
conduct the survey. These regions were chosen by YCan members and volunteers as
neighbourhoods in which they lived and as areas with major air pollution sources.
From each zone 300 respondents were chosen across gender, occupation, and age
and randomly surveyed through face to face questioning. The survey had a sample of
1500 respondents in all. The choice of the region in each zone was a selection made by
the youth volunteers keeping in mind a certain distinguishing criteria with regard to
sources of air pollution. For instance, in Central Delhi, Pragati Maidan was chosen as
a potential site of inquiry because of a nearby construction site. Rohini, Punjabi Bagh
and ITO were chosen as they are commercial areas with heavy traffic. A break up of the
sample with the main identified pollution source is given in the below table.
Zone Region Main Source of Pollution Surveys
North Haiderpur Badli Waste burning and construction 100
Hudson Lane/GTB Nagar Residential and commercial area with heavy traffic 100
Rohini Commercial area with heavy construction 100
South Satya Niketan Student area with construction activity 100
Okhla Landfill Area Heavy construction and traffic 100
South Ex Flyover Landfill and slum area 100
East Laxmi Nagar Busy market and commercial area 100
Nirman Vihar Construction area 100
Mayur Vihar Construction and residential area 100
West Punjabi Bagh Busy market and residential area 100
Peeragarhi Chownk Construction and heavy traffic area 100
Kirti Nagar Residential, industrial, garbage and landfill area 100
Central Mandi House Residential area 100
Pragati Maidan Construction site 100
ITO Heavy traffic area 100
Total Surveys 1500
Figure 1: Sample break-up according to zone, region and main source of pollution.
062017-2018
07How Bad is Delhi’s Air?
The respondents were chosen randomly in each region across the five zones. The gender break up across
each zone is given in the figure below:
Gender Distribution
250
200
150
Males
100 Females
50
0
East South Central West North
Figure 2: Gender distribution across five zones in Delhi.
082017-2018
In the Haiderpur area most respondents live in slums. They identified
waste burning as a huge issue that causes air pollution. But, when
authorities came to the area to oppose the practice, residents of the area
resisted as there were no other waste disposal options.
- Anirudh
YCan Volunteer
09How Bad is Delhi’s Air?
In each zone, the female population interviewed was more than 50 while the male population fell between
the ranges of 200 – 250. That is about 24.15% of the sample size was composed of women and the rest were
men.
Similarly, the distribution of residents to migrants was fairly equitable with the exception of the East zone
which had a larger number of residents than migrants. Respondents were asked to identify themselves as
being either a migrant or resident of the city according to their own perception. The intent was to see if a
migrant perceived air pollution in Delhi differently on account of having come to the city from another
town/city/village with varying pollution conditions versus an individual that had spent the larger part of
their life in Delhi and was able to identify a change over time in the same city. This became an important
factor as a YCan Volunteer from the east zone shared that while conducting the survey, a respondent
who identified himself as a migrant consistently remarked that Delhi was much more polluted than their
hometown on account of the high vehicle density in the city.
Resident/Migrant
200
180
160
140
120
Resident
100
Migrant
80
60
40
20
0
East South Central West East
Figure 3: Resident/Migrant distribution across five zones in Delhi.
102017-2018
The age distribution of the sample is given below. The range of respondent’s age was from 16 years to 90
years, with the bulk of the respondents falling in the category of 18 – 45 years of age.
Age Groups
250
200
150
0-18
100 18-45
45-90
50
0
East South Central West East
Figure 4: Age distribution across five zones in Delhi
11How Bad is Delhi’s Air?
One woman invited me to her house to have a more detailed discussion on air pollution.
She thought I was from the government and we were trying to come up with solutions.
She was severely affected by air pollution related ailments due to road side dust and
construction activities right next to her house. When I approached her for the survey
she was pouring water on the road outside her house to dissipate the movement of dust.
- Paragi
YCan Volunteer
122017-2018
4. Results
4.1. Understanding the issue of Air Pollution
Respondents were asked what sorts of pollution they identified as
perceptibly harming the city. Interestingly, air pollution (55.63%) emerged as
the most important cause of concern, over water (17.88%), waste (26.49%)
and other types of pollution (0.0%). Every respondent in the sample
indicated that one of the sources of pollution – water, air, waste – were
important issues and no respondent chose the ‘others’ or ‘pollution is not
an issue’ option. This is indicative of a slow but steady realization amongst
the citizenry of the city on the manner in which air pollution is becoming
an issue in the city. The importance attached to air pollution was spread
differently across both genders, about 84% of male respondents identified air
pollution as the most important type of air pollution plaguing the city, while
68.45% of female respondents attached primary importance to air pollution.
Types of Pollution
0%
Water
Waste
Air
Other
Figure 5: Types of pollution that are most detrimental to the city of Delhi
This survey changed my thinking and it also helped me raise my confidence. I
think that there is a lack of awareness due to which air pollution is increasing.
- Mukul
YCan Volunteer
13How Bad is Delhi’s Air?
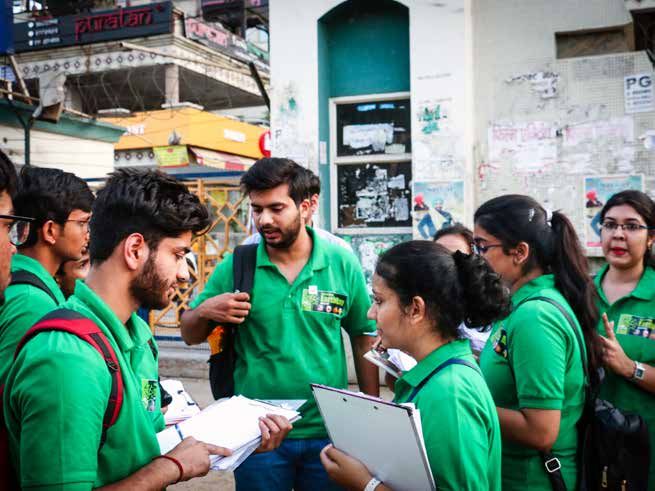
Photo credit: Jyoti Singh
142017-2018
4.2. Effect of Air Pollution on Quality of Life
Among the aspects of people’s lives severely affected by air pollution, health stood
out across all five zones followed closely by environment, difficulty in commuting
and effect on livestock. In each zone, more than 50% of respondent’s adjudged
that air pollution led to detrimental health effects which were related to issues of
breathlessness, an increase in respiratory disorders and desire to move out of the
city due to general discomfort. Whereas 72% of female respondents identified the
detrimental effects of air pollution on health, 74.88% of male respondents had
similar perception with regard to the link between air pollution and health. One
female respondent in the East zone, highlighted that she was especially perceptive
of the negative effects of air pollution on health as she suffered from asthma.
Thus, the realization that air pollution is becoming an important issue in the city
is manifested for people in the negative health effects they experience and this
is potentially an indication of an increased identification of the link between air
pollution and health.
Effects of Air Pollution
70.00%
60.00%
50.00% Health
40.00% Environment
30.00% Commute
20.00% Livestock
10.00% Quality of Life
0.00%
East West North South Central
Figure 6: Zonal Distribution of effects of Air Pollution
15How Bad is Delhi’s Air?
4.3. Causes of Air Pollution
Forty-five percent of respondents Main Sources of Air Pollution
identified vehicular pollution as the
most potent cause of air pollution
in the city. Fugitive dust emerged as
the second most important cause,
followed by burning of municipal
solid waste and industrial Vehicles
emissions. Thus, the realization
Industry
that air pollution is a complex
issue and a result of diverse Fuel
sources is still nascent. This could
Waste Burning
be linked to two reasons; firstly,
the lack of source apportionment Dust
studies and emissions inventories
on air pollution in Indian cities
and secondly, the inability to
communicate the learnings from Figure 7: Main Sources of Air Pollution in Delhi
these kinds of research to the
general citizenry through outreach and education. In order to bridge this gap Clean Air Asia, has
been implementing air pollution outreach programs and is working with various stakeholders on
the issue.
162017-2018
The perception survey was a good learning experience for me. While
talking to different people I learnt that unless they are directly
affected by air pollution they are not perceptive to it. One respondent
told me that he had asthma and had immense difficulty in breathing.
He was willing to do anything to improve the quality of air.
- Mughil
YCan Volunteer
17How Bad is Delhi’s Air?
4.4. Initiatives Taken to Tackle Air Pollution
Each zone identified different initiatives taken to abate air pollution. Banning burning of waste
accounted for the most important initiative (33%) undertaken for respondents in the South
zone; while restriction on vehicular movement emerged as the most important initiative in the
Central zone (29%). For respondents from the East zone the usage of masks emerged as the most
important initiative (27%) while for the North and West zone the two most important initiatives
were restriction on vehicular movement and banning waste burning. Such responses indicate
that people are aware of the efforts that are being undertaken by the state (restricting of polluting
vehicles), judiciary (ban on burning of waste) and individual efforts (such as wearing protective
masks) to curb the detrimental effects of air pollution.
Intiatives Taken to Mitigate Air Pollution
40.00%
35.00%
30.00%
Ban on waste burning
25.00%
Restriction on movement
20.00%
Closing of power plants
15.00% Usage of Masks
10.00% Air Purifiers
5.00%
0.00%
East South Central West North
Figure 8: Zonal Distribution of initiatives taken to mitigate air pollution
Photo credit: Jyoti Singh
182017-2018
Government Sponsored Intiatives
4.5. Government Initiatives
When asked about government initiatives
to reduce air pollution, the majority of
respondents (68%) identified the Odd-
Even rule and the Swach Bharat Abhiyaan
Yes as interventions to reduce air pollution.
That said, most respondents felt that these
No initiatives did not achieve their intended
goals. Respondents in the East zone told
YCan volunteer that they were aware of
the PUC, that is the pollution check for
vehicles in Delhi and thought it needed to be
Figure 9: Government Initiatives implemented better.
I remember talking to a middle-aged man who was the security guard in a company.
What started as a simple conversation with a few questions from the survey, took a
turn when the conversation got intense and we discussed education, human health,
pollution and government activities. The kind of awareness this man had about all the
happenings in his locality and air pollution astonished me. It made me realize that
one’s willingness to bring change is really what is needed to lead to effective change.
- Aashima
YCan Volunteer
19How Bad is Delhi’s Air?
4.6. Access to Air Quality Data
Access to Air Quality Data A large proportion of the sample was not aware
that they had access to air quality data. Those
who did, relied mainly on mobile phone apps
and the internet as resources for accessing such
data. Among the 1500 respondents only 26.19%
agreed to having access to air quality data.
Of this the majority was composed of male
Yes
respondents (88%) and 12% of respondents
who has access to air quality data were women.
No
Figure 10: Accessibility to Air Quality Data
202017-2018
4.7. Trend in Air Quality
2.20%
Overall Air Quality
4.00%
Most respondents identified
a decline in the air quality
Much better
of Delhi. As much as 40% of
the sample thought that the Little Better
air quality was much worse
than the year before while Same
the remaining respondents
felt that either the air quality Little Worse
was the same or a little worse
Much Worse
when compared to the year
before. Don't Know
Figure 11: Perception of Overall Air Quality in Comparison to the Previous Year.
Overall Air Quality : Zonal
60.00%
50.00%
40.00% East
South
30.00%
Central
20.00%
West
10.00% North
0.00%
Much little Same Little Much Don't
better better Worse Worse Know
Figure 12: Zonal Perception of Overall Air Quality in Comparison to the Previous Year.
I was pleasantly surprised how people took out time to speak to us about air pollution.
I learned new things in the process, such as how people are affected by air pollution.
- Pallavi
YCan Volunteer
21How Bad is Delhi’s Air?
4.8. Proposed Large Scale Initiatives
Respondents identified large scale initiatives that they thought would improve the quality of air
of which banning polluting vehicles was foremost followed by clean fleet management, better
government initiatives and a strong legal framework for implementation of existing policies.
Proposed Intiatives to Mitigate Air Pollution
3.00% 0.50%
Ban polluting vehicles
Strong Legal framework
Shift Industries
Air Quality Plans
Eco Friendly technologies
Improve fuel quality
Use CNG Vehicles
Involve RWA
Other
Figure 13: Proposed Large Scale Initiatives in Delhi to Decrease Air Pollution
People were only willing to participate in those activities which seemed possible and
effective in their view. If we want more participation from people to decrease air
pollution, we need to make them understand that it isn’t an impossible issue to deal
with and there are initiatives that can lead to change.
- Kamna
YCan Volunteer
222017-2018
4.9. Proposed Individual Level Initiatives
On an individual level Proposed Individual Initiatives to Mitigate Air Pollution
as an effort to reduce air
pollution, respondents 0.50%
highlighted that they
would be willing to use
public transport, carpool Public Transport
and plant more trees.
Spreading awareness Donate money
about air pollution and
Better waste management
practicing better waste
management practices practices
were also identified as Plant more trees
important solutions. Of
the individual initiatives Spread awareness
identified, 48% of female
respondents felt that other
planting of more trees
followed by better waste
Figure 14: Individual Initiatives to Abate Air Pollution in Delhi
management practices
were the key solutions
to the issues to take up. Of the male respondents 51% felt that choosing public transport over private
transport, followed by better waste management practices were the two main initiatives to take up.
Figure 14: Individual Initiatives to Abate Air Pollution in Delhi
23How Bad is Delhi’s Air? 24
2017-2018

Way Forward
   The perception survey is part of CAA’s efforts to increase the general knowledge base and intensify
   outreach for action on air pollution in cities of India. Increasingly, there is an acceptance of the fact
   that collaborative efforts between the government, civil society, industry and general citizenry will
   be needed to make cities cleaner and liveable in the future. In order to move in this direction, CAA
   has launched the Clean Air Knowledge Network to serve as a platform for collaborative efforts,
   repository for knowledge and sharing of best practices across civil society, the government and
   specialists across cities in India.

   Simultaneously, CAA continues to engage with YCan in Delhi and increase the networks of
   volunteer for which a website has been launched: youthforcleanair.com. YCan has also been
   launched in Gandhinagar and we are in the process of starting the YCan in Guwahati. In the
   foreseeable future, we aim to take the YCan to other Indian cities to carry on the campaign for
   clean air with the youth, while strengthening the Clean Air Knowledge Network to encourage city
   level symbiotic efforts at the inter and intra city level to conceive and implement solutions on air
   quality management.

                                                                                                           25
How Bad is Delhi’s Air? 26
2017-2018

            Appendices

                         27
How Bad is Delhi’s Air?
Appendix i
Schedule
Date: 22nd and 23rd April, 2017
Zone 1: North
Haidarpur Badli
Hudson Lane/GTB Nagar
Rohini
Zone 2: South
Satya Niketan
Okhla Landfill Area
South Ex Flyover
Zone 3: East
Laxmi Nagar
Nirman Vihar
Mayur Vihar
Zone 4: West
Punjabi Bagh
Peeragarhi Chowk
Kirti Nagar
Zone 5: Central
Mandi House
Pragati Maidan
ITO
282017-2018
Appendix ii
Perception Survey Questionnaire
Respondent Details
Name: ................................................................................................
Gender:..............................................................................................
Age:....................................................................................................
Occupation: .....................................................................................
Neighbourhood: ...............................................................................
Resident/Migrant: ............................................................................
Perception Survey Questionnaire
1. What are the types of pollution in your city? (Tick more than one)
Water Waste/Garbage Air (If yes, go to Q.3, If no, go to Q.2
and finish survey)
Other (Please Specify)
2. Why do you think the air in your city is not polluted?
Not experienced any difficulty I have never thought about it
Water and waste are bigger concerns
Other (Please Specify)
3. What aspects of your life is air pollution affecting? (Tick more than one)
Health Environment/Climate Change/Weather
Commuting in the city Livestock
Other (Please Specify)
29How Bad is Delhi’s Air?
4. In which of the following ways do you think you are affected? (Tick more than one)
Breathlessness/Difficulty in Breathing/Asthma Respiratory issues during diwali
and seasonal changes
Doing less outdoor activities Doing more to stay healthy
Want to move to other less polluted areas Feeling depressed/cold/dizziness
Irritation to eyes/nose/throat/Poor Visibility Worrying about the living
environment of children
Other (Please Specify)
5. What do you think are the sources of Air Pollution in your area? (Tick more than one)
Vehicles Power Generation Plants/Industry Roadside Dust
Unit Burning of Fuel/Biomass Waste Disposal/Waste Burning
Other (Please Specify)
6. What are some initiatives in your area to tackle air pollution? (Tick more than one)
Ban on waste burning Restriction on vehicular movement
Closing of power plants Masks Air Purifiers
Other (Please Specify)
7. Do you have access to air quality data?
YES (Go to Q.8) NO (Go to Q.10)
8. How do you access air quality data for your city/locality? (Tick more than one)
Newspaper CPCB/DPCC website Television
Internet Display Boards Mobile App
Through friends and family
Other (Please Specify)
9. Have you heard of any of these pollutants? (Tick more than one)
PM 2.5 PM 10 O3
NOX CO2/CO SO2
Other (Please Specify)
302017-2018
10. How do you compare overall air quality in your area in compare to last year?
Much better Little better About the same
Little worse Much worse Don’t know
11. Do you know of any government sponsored initiative to tackle air pollution in the city?
No
Yes (please specify)
12. What initiative must be taken to reduce air pollution in your area? (Tick more than one)
Monitor and ban vehicles that fail emission tests and prohibit old vehicles from entering city
Stronger and mandatory legal framework implemented by the government which prohibits
industries, vehicles owners and others to emit pollutants into the air
Shift the industries outside the city
Government should establish air quality plans, short and long term plans that look at
controlling emissions from all sectors
Industry and power sector should adopt innovative and eco-friendly technologies for
controlling and monitoring the release of emissions into the air
Improve the quality of fuel and establish independent fuel quality testing mechanism
Use of Electric or CNG vehicles instead of fuel running vehicles
RWA to get involved in air pollution control
Other (Please Specify)
13. What measures are you ready to take to reduce air pollution in your area? (Tick more than
one)
Use public transport/Carpooling more frequently
Donate some money/time to organisations that works for improving Air Quality
Better Waste Management Practices
Planting more trees in your area and caring for them
Spread awareness among friends and family
31How Bad is Delhi’s Air? 32
2017-2018

Appendix iii

Bibliography
    •   Bickerstaff, Karen and Walker, Gordon. 2001. ‘Public understandings of air pollution: the
        ‘localisation’ of environmental risk’. In Global Environmental Change. Vol. 11, pp – 133-145.

    •   Edwards, Paul. 2010. A Vast Machine: Computer Models, Climate Data and the Politics of Global
        Warming. Cambridge: MIT Press.

    •   World Health Organization. 2016. Ambient Air Quality: A Global Assessment of Exposure and
        Burden of Disease. Geneva: WHO.

    •   United Nations Centre for Human Settlements (UN-Habitat). 2001. The State of the World’s
        Cities, 2001. Nairobi: UN –Habitat.

    •   Kumar, Prashant et al. 2015. ‘New Directions: Air Pollution Challenges for Developing Megacities
        like Delhi’ in Atmospheric Environment. Vol. 22.

    •   Narain, Urvashi and Krupnick, Alan. 2007. The Impact of Delhi’s CNG Program on Air Quality.
        (Discussion Paper) Resources from the Future. Available at: http://www.rff.org/research/
        publications/impact-delhis-cng-program-air-quality (accessed on June 10, 2017)

    •   Ghosh, Saikat et al. 2014. ‘An Investigation of Potential Regional and LOCAL Source Regions
        Affecting Fine Particulate Matter Concentrations in Delhi, India’ in The Journal of the Air and
        Waste Management Association. Vol. 65 (2).

                                                                                                          33
How Bad is Delhi’s Air?
Appendix iv
List of figures
Figure 1: Sample break-up according to zone, region and main source of pollution. .................... 06
Figure 2: Gender distribution across five zones in Delhi. ................................................................... 08
Figure 3: Resident/Migrant distribution across ................................................................................... 10
Figure 4: Age distribution across five zones in Delhi .......................................................................... 11
Figure 5: Types of pollution that are most detrimental to the city of Delhi ..................................... 13
Figure 6: Zonal Distribution of effects of Air Pollution ...................................................................... 15
Figure 7: Main Sources of Air Pollution in Delhi ................................................................................ 16
Figure 8: Zonal Distribution of initiatives taken to mitigate air pollution ....................................... 18
Figure 9: Government Initiatives ........................................................................................................... 19
Figure 10: Accessibility to Air Quality Data ......................................................................................... 20
Figure 11: Perception of Overall Air Quality in Comparison to the Previous Year. ....................... 21
Figure 12: Zonal Perception of Overall Air Quality in Comparison to the Previous Year. ............ 21
Figure 13: Proposed Large Scale Initiatives in Delhi to Decrease Air Pollution ............................. 22
Figure 14: Individual Initiatives to Abate Air Pollution in Delhi ...................................................... 23
342017-2018
Appendix v
Volunteers (Embassies and
High Commissions)
Clean Air Asia would like to put on record the efforts of the many officials from different
missions based in Delhi, who joined us in our endeavour to gauge people’s perception
of air quality in Delhi. While this may not be a comprehensive list, we would like to
acknowledge the work of the following volunteers whose names are in our records.
Embassy of the United States of America
Chetna Khera
Andrea Robles-Olson
Brian Smyser
Richard Pinkham
Ayesha Gideon
Jonathan Kessler
Embassy of Spain
Varoon P. Anand
Dr. Teresa Barres Benlloch
Embassy of Sweden
Sofia Nyström
Sanir Singh Rana
Marcus Holknekt
Lena Malmqvist
High Commission of Canada
Rajeshwari D Rao
Aditya Rao
Arpith
Dipanshu
Matt Friesen
Shriya Ramachandran
Johnny Joseph
Bernard Francis
Ronny D’souza
Jasvinder Kaur
Sreemoyi Sanyal
Pearl Wierenga
35How Bad is Delhi’s Air?
Appendix vi
Ycan Volunteers
Aadyaa Singhania Aman Shaikh Diksha Rai
Aahan Malhotra Anchal Kamboj Divya Mishra
Aakash Arora Animesh Deepak Gautam Aggarwal
Aashima Bhutani Anirudh Goel Gautam Aggarwal
Aastha Jain Anjali Thagela Haika Bhat
Abhimanshu Singh Anju Kushwaha Himanshu
Abhishek Dasgupta` Anshu Jaideep Nath Sharma
Abhishek Saroha Anurag Jaideepnath
Aditi Anurag Agarwal Jaideepnath
Aditi Arundhati Tewari Jyoti Singh
Agip Dhar Aryan Singh Jyotsana Pandey
Akanksha Singhal Ayushi Singh Kadambini Arora
Akanksha Subhash Ayyanna Gurikar Kamna Nanda
Khakse
Banas Kanika
Akash Rathi
Bani Bains Kashif Mahfooz
Akashlina Basu
Bhawna Upadhyay Kavita Meena
Akshata Verma
Chirag Luthra Kirtika Tolia
Aleena
Deepanshu Kriti Sapra
Aleena Malik
Deepika Kshitij Gupta
Aman Agrawal
Devansh Gupta Kunti Kumari
Aman Bajaj
Devika Sen Manasi
362017-2018
Mansi Pooja Dubey Smriti Gupta
Mansi Bansal Pooja Misra Sohana Debbarma
Manya Aggarwal Pradhuman Yadav Sonal
Megha Preeti Gupta Sourav Lohia
Meghna Tugnait Rajat Garg Srishti Sharma
Mohit Rajat S.Kakde Sumedha
Mona Rajitha Tammineni Sumit Aggarwal
Mughil Ravi Kumar Jaiswal Surbhi Pal
Mukul Kundra Rhythm Swarnima Singh
Neha Saini Rishabh Indoria Tania
Nidhi Ritvik Gupta Tanuja
Niharika Gupta Rohit Kumar Taranpreet Kaur
Nishant Ajnoti Rukhsaar Tarun Kaushik
Nishant Yadav Sahil Popli Tushar
Nitin Shokeen Shalu Ujjwal Kumar
Onia Khrasi Sherin Kaul Urmila Yadav
Palak Gupta Shivani Basoya Vani Jain
Paragi Neema Shrayoshi Choudhary Yusra
Pavani Chopra Shreya Aggarwal Yusra Rafiq
Piyush Raj Shreya Jain
Pooja Choudhary Shubhangi AggarwalHow Bad is Delhi’s Air? 38
Clean Air Asia Center Office
Unit 3505 Robinsons Equitable Tower
ADB Avenue, Pasig City, 1605 Philippines
Tel +63 2 631 1042
Fax +63 2 6311390
center@cleanairasia.org

Clean Air Asia China Office
11-152, JianGuoMenWai Diplomatic
Residence Compound, No.1 XiuShui
Street, ChaoYang District
Beijing 100600 China
Tel/Fax: + 8610 8532 6172
china@cleanairasia.org

Clean Air Asia India
Basement C-3, Green Park
New Delhi 110016, India
Tel +91 11 65451100
india@cleanairasia.org

                                       Country Networks in
           China, India, Indonesia, Malaysia, Nepal, Pakistan, Philippines, Sri Lanka, Vietnam

                                           www.cleanairasia.org
You can also read