An Explainable DL-Based Condition Monitoring Framework for Water-Emulsified Diesel CR Systems
←
→
Page content transcription
If your browser does not render page correctly, please read the page content below
electronics
Article
An Explainable DL-Based Condition Monitoring Framework
for Water-Emulsified Diesel CR Systems
Ugochukwu Ejike Akpudo                     and Jang-Wook Hur *

                                          Department of Mechanical Engineering (Department of Aeronautics, Mechanical and Electronic Convergence
                                          Engineering), Kumoh National Institute of Technology, 61 Daehak-ro (yangho-dong), Gumi 39177, Korea;
                                          akpudougo@gmail.com
                                          * Correspondence: hhjw88@kumoh.ac.kr

                                          Abstract: Despite global patronage, diesel engines still contribute significantly to urban air pol-
                                          lution, and with the ongoing campaign for green automobiles, there is an increasing demand for
                                          controlling/monitoring the pollution severity of diesel engines especially in heavy-duty industries.
                                          Emulsified diesel fuels provide a readily available solution to engine pollution; however, the inher-
                                          ent reduction in engine power, component corrosion, and/or damage poses a major concern for
                                          global adoption. Notwithstanding, on-going investigations suggest the need for reliable condition
                                          monitoring frameworks to accurately monitor/control the water-diesel emulsion compositions for
                                          inevitable cases. This study proposes the use of common rail (CR) pressure differentials and a
                                          deep one-dimensional convolutional neural network (1D-CNN) with the local interpretable model-
                                          agnostic explanations (LIME) for empirical diagnostic evaluations (and validations) using a KIA
                                          Sorento 2004 four-cylinder line engine as a case study. CR pressure signals were digitally extracted at
                                various water-in-diesel emulsion compositions at various engine RPMs, pre-processed, and used
                                   for necessary transient and spectral analysis, and empirical validations. Results reveal high model
Citation: Akpudo, U.E.; Hur, J.-W.        trustworthiness with an average validation accuracy of 95.9%.
An Explainable DL-Based Condition
Monitoring Framework for                  Keywords: common rail; fault detection and isolation; water-emulsified diesel fuel; condition
Water-Emulsified Diesel CR Systems.       monitoring; convolutional neural network
Electronics 2021, 10, 2522. https://
doi.org/10.3390/electronics10202522

Academic Editors: Paolo Castaldi and      1. Introduction
Silvio Simani
                                               For several decades, diesel engines have served profitably for high-power energy/power
                                          generation across industries, and with several innovations, their cost efficiency, output
Received: 23 August 2021
Accepted: 12 October 2021
                                          optimization, and process design/control have significantly improved [1–3]. On the down-
Published: 15 October 2021
                                          side, the emissions from these engines contain high amounts of harmful compounds—
                                          nitrogen oxides (NOx), particulate matter (PM), and carbon monoxide (CO). These pollu-
Publisher’s Note: MDPI stays neutral
                                          tants contribute nearly 30% of greenhouse effects and several health and environmental
with regard to jurisdictional claims in
                                          problems. Although an aggressive campaign is ongoing for renewable non-combustible
published maps and institutional affil-   energy sources; particularly for transportation, the necessary resources required for such
iations.                                  a transition are yet to be fully harnessed on a global scale while the increasing energy
                                          demand still remain [2,4]. Studies on the Asia–Pacific and European regions suggest there
                                          will be a 75% increase in energy demand for transportation by 2040. This also suggests
                                          there would be an 85% increase in demand for heavy-duty diesel fuels and a 10% decrease
Copyright: © 2021 by the authors.
                                          in demand for gasoline fuels [5].
Licensee MDPI, Basel, Switzerland.
                                               The impact of fuel quality on combustion engine efficiency, power, and durability can-
This article is an open access article
                                          not be overemphasized; however, there is a need to minimize the amount of pollution while
distributed under the terms and           maintaining engine efficiency [6,7]. A common, cost-efficient, and reliable emission control
conditions of the Creative Commons        method for diesel engines is the use of water-in-diesel emulsified fuels. This is because the
Attribution (CC BY) license (https://     physio-chemical properties of emulsion fuels disfavours NOx, CO, and PM production—
creativecommons.org/licenses/by/          the major pollution-causing compounds. Nonetheless, the composition percentage of water
4.0/).                                    by volume of diesel should be kept in check to avoid engine power losses, component

Electronics 2021, 10, 2522. https://doi.org/10.3390/electronics10202522                                https://www.mdpi.com/journal/electronics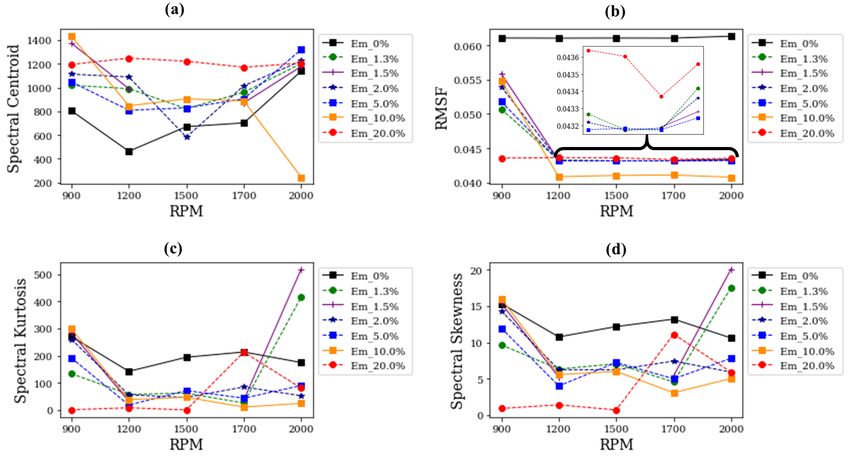
Electronics 2021, 10, 2522                                                                                           2 of 21

                             corrosion, seal damage, and other injection system problems [8–10]. Consequently, there
                             is a need for accurate condition monitoring methods for emulsified diesel fuel engines.
                             Although regular engine checkups and routine maintenance provide long-lasting engine
                             durability, such mechanical methods may be cost-inefficient and unreliable considering
                             the emergence and availability of real-time intelligent alternative methods—data-driven
                             predictive maintenance [11].
                                   Several studies provide some validation on the efficiencies associated with emulsified
                             diesel fuels; yet, only a few works have been recorded on the reliability of using emulsi-
                             fied diesel fuels. Uncertainty and stability issues with mixing conditions (temperature,
                             compositions, etc.) are enough motivation for designing accurate monitoring/diagnostic
                             frameworks to ensure that acceptable hydrophilic-lipophilic balance (HLB) in the emulsion
                             and engine efficiencies are maintained at all times [12,13]. To achieve these, studies have
                             shown that leveraging the dynamics and vulnerabilities of CR systems are quite reliable,
                             and with recent advancements in dynamic modelling (which are artificial intelligence
                             (AI)–driven), accurate real-time monitoring and diagnostics can be achieved with minimal
                             false alarm rates [1,6]. Beyond the limitations of traditional machine learning techniques
                             like the support vector machines (SVM), random forests and decision trees, DL techniques
                             like the convolutional neural networks (CNN), recurrent neural networks (RNN), etc. come
                             with diverse advantages including big data compatibility, automated feature engineering,
                             and ease-of-use [14,15]. On the other hand, processing these signals using befitting signal
                             processing techniques further enhances the accuracy, reliability, and acceptability of the
                             inherent model(s) for practical use [1,6,15].
                                   In our quest for investigating diesel engine behaviour by leveraging the character-
                             istics of CR fluctuations in a water-emulsified fuel diesel engine, our study makes the
                             following contributions:
                             •    An investigative study was conducted on a commercial diesel engine operating on
                                  varying water-in-diesel compositions and engine speeds. Using the CR pressure
                                  signals, empirical analyses were conducted to understand the characteristics of CR
                                  fluctuations over these conditions.
                             •    A hybrid diagnostic scheme is proposed for condition monitoring. This model lever-
                                  ages the discriminative properties of the first-order differential of CR pressure signals
                                  on one hand, and the superior diagnostic property of the 1D–CNN on the other hand.
                             •    Using the LIME algorithm [16], our study provides empirical explanations on the faithful-
                                  ness of predictions made by the diagnostic model. These explanations/interpretations
                                  by the LIME algorithm primarily functions by approximating local predictions with an
                                  interpretable model.
                                  To provide a clear road-map to the rest of this paper, the next section presents a
                             detailed overview of the materials and methods employed herein (an overview of CR
                             systems, test engine and fuels, and the experimental procedure). Section 2 provides the
                             proposed diagnostic system model and key theoretical background while Section 4 presents
                             the empirical assessments and validation from the case study. Section 5 summarizes some
                             related works and open issues while Section 6 concludes the paper.

                             2. Materials and Methods
                                  This section presents an overview of the diesel engine CR system and the specifics of
                             the test engine (and fuels) used in this study.

                             2.1. Common Rail Injection System
                                  Figure 1 presents an illustration of a typical high-pressure (HP) injection system
                             consisting of the major parts—HP pump (HPP), CR system, fuel injector , and the electronic
                             control unit (ECU) [17]. The injection process starts via the yellow lines whereby the
                             low-pressure pump (LPP) delivers fuel from the reservoir through a filter to the HPP. The
                             HPP pumps the fuel at a high pressure (in red) to the CR which distributes the fuel to the
                             injector(s) through the accumulator for spraying in the combustion chambers.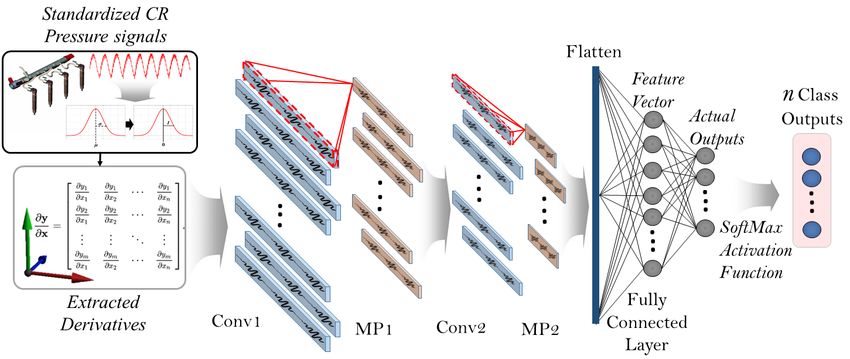
Electronics 2021, 10, 2522 3 of 21
Figure 1. A typical Common rail diesel fuel injection system.
The pressure control valve (PCV) curtails abnormal fuel flow in the CR pipe via a
throttling behaviour induced by the ECU. The ECU is primarily the brain of the CR system
since it controls the opening and closing of the injectors, and the throttling behaviour of
the PCV especially under varying engine speeds. Every spray in the combustion chamber
induces an instant pressure drop in the CR pipe which causes the HPP and its regulator to
compensate for this pressure drop. These fluctuations in pressure are reflected by the CR
sensor and provide reliable condition monitoring measurements.
The CR system dynamics of a diesel engine is quite reflective of the engine’s per-
formance and running conditions. The spectral and transient information underlying
in the CR signal; when properly harnessed, can provide reliable diagnostic/condition
monitoring parameters.
2.2. Test Engine and Fuel Preparation
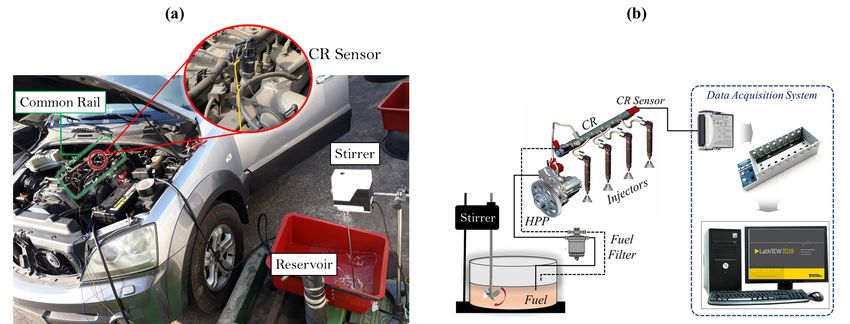
A passenger car, KIA Sorento 2004 model, was used for the proposed study. Figure 2
shows the actual experimental setup while Table 1 provides the engine’s specification. The
experiment was performed during early winter season at an approximate room temperature
of 10 ◦ C with different emulsion compositions (under varying engine speeds).
Table 1. Test engine specifications.
Car Model Engine Type Bore × Stroke (mm) Maximum Power Maximum Torque (Nm/RPM) Compression Ratio Fuel Injection Aspiration
KIA Sorento In-line, 91 × 96 138 hp @ 343 Nm @ 17.6 Common Rail Turbocharged,
2004 Four (4) 3800 RPM 1900 RPM inter-cooled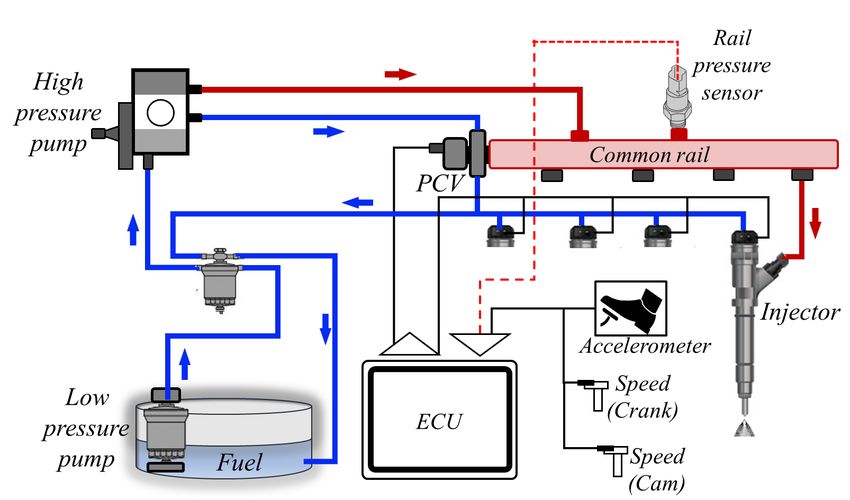
Electronics 2021, 10, 2522                                                                                                     4 of 21

                    Figure 2. A view of (a) the actual experiment setup, (b) schematic view of the experimental setup.

                                        From the car engine’s rail pressure sensor (RPS), pressure measurements were digitally
                                   collected via an NI 9228 at 200 Hz on a NI Compact DAQ 9178 data acquisition system
                                   and a LabView environment. The RPS outputs a maximum of (5 ± 0.25) V at 2200 bar with
                                   a response time (τ10/90 ) ≤ 5 mSecs and a maximum overpressure of 1800 bar (rupture
                                   pressure = 3000 bar). Furthermore, the real-time engine temperature data was collected via
                                   NI 9214 module at 1 KHz with an RTD thermocouple affixed to the exhaust manifold.
                                        Different water compositions are mixed with diesel to form different emulsion compo-
                                   sitions represented as EM-x% (where x represents the concentration of water by volume
                                   in (100 − x )% of diesel. First, the car’s fuel tank was isolated and an external custom
                                   reservoir was designed for the experiment (see Figure 2b). To avoid phase separation, the
                                   water-emulsified fuels were constantly stirred by an overhead stirrer (OSA-10 made by LK
                                   LABKOREA) and tested for stability with a centrifuge. Table 2 shows the different viscosity
                                   values of the emulsion compositions at 10 ◦ C.

                                    Table 2. The viscosity of different water–emulsion compositions.

        Emulsion Composition              EM-0%       EM-1.3%      EM-1.5%       EM-2.0%      EM-5.0%      EM-10.0%      EM-20.0%
   Kinematic Viscosity (cSt) at 10 ◦ C      6.24        9.478         9.49         9.52          9.71         10.01        10.61

                                        As observed, the emulsion viscosity increases linearly as the water composition is
                                   increased. This suggests a possible positive correlation between increasing emulsion
                                   composition and increased engine stress during combustion. For the respective emulsion
                                   conditions, the engine was run for half an hour to ensure the particular emulsion fuel is
                                   evenly running through the whole injection system while maintaining a stable temperature.
                                   To collect data for the next emulsion composition, a one-hour flush is conducted using the
                                   emulsion composition of interest.

                                   3. Proposed System Model
                                        Ideally, CR behaviour is highly correlated with the periodic injection process in the
                                   combustion chamber; therefore, extracting the CR signals’ time-dependent derivatives
                                   helps in stationarizing the signals, identifying injection duration, and providing more
                                   reliable characteristic parameters for condition monitoring/diagnosis [1].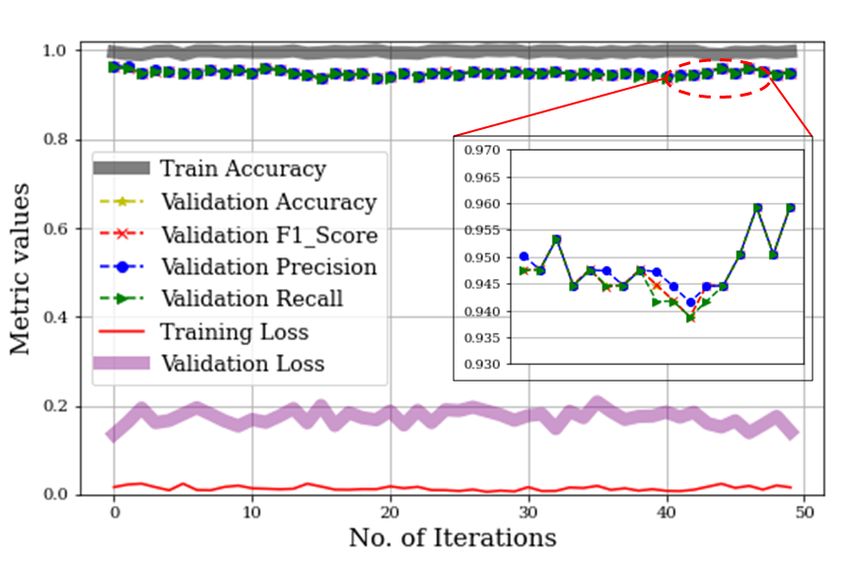
Electronics 2021, 10, 2522                                                                                                 5 of 21

                             3.1. CR Signal Pre-Processing
                                  Figure 3 presents a visual illustration of the proposed DL-based condition monitoring
                             framework. Given the raw CR signals a(t) = { a(t)1 , a(t)2 , . . . , a(t) N }, the model initializes
                             by standardizing the raw CR signals using Equation (1):

                                                                                  a ( t )i − µ
                                                                     x ( t )i =                                               (1)
                                                                                         σ
                             where µ is the mean of the distribution while σ is the standard deviation of a(t).

                             Figure 3. Proposed 1D-CNN-based condition monitoring model.

                                 Next, the model computes the first-order derivatives of standardized signals using
                             Equation (2)
                                                                          x ( t i +1 ) − x ( t i −1 )
                                                             x 0 ( t )i =                                            (2)
                                                                                    2 ∗ ∆t
                                 This is an important step for extracting the time-dependent information peculiar to
                             each signal while also eliminating bias, improving stationarity in the signals, and chiefly,
                             improving discriminance in the inputs.

                             3.2. 1D–CNN Diagnostic Model Overview
                                   Amongst the many ML/DL algorithms, CNNs are unique for their working principle—
                             mimicking the human visual cortex for discriminative feature extraction and identification
                             of labels (objects, conditions, etc.). A typical CNN differs from conventional ML algorithms
                             in the context of feature extraction, whereby it extracts features globally through a number
                             of stacked layers and with fully connected layers, can also act as a classifier. This makes
                             the CNN an all-in-one diagnostic tool since it consists of a feature extractor and classifier.
                                   The uniqueness (and superiority) of CNNs for supervised discriminative predictions
                             have made them very popular for many diagnostic/detection cases including, but not
                             limited to Network Intrusion Detection [18], Theft Detection in Smart Grid Systems [19],
                             speech separation [20], etc. This superiority is attributed to the convolving (Conv) and max-
                             pooling (MP) layers which function as filters for high-level (automatic) feature extraction;
                             and with the fully connected layer(s)—classical artificial neural network (ANN), multi-label
                             predictions can be made [21,22].
                                   As shown in Figure 3, the proposed model’s efficiency relies significantly on the
                             classification/diagnostics module which comprises of two Conv and MP layers with recti-
                             fied linear units (ReLU) in between them– [Conv1–MP1] and [Conv2–MP2], and two fully
                             connected layers with SoftMax–activated outputs for each of the operating conditions.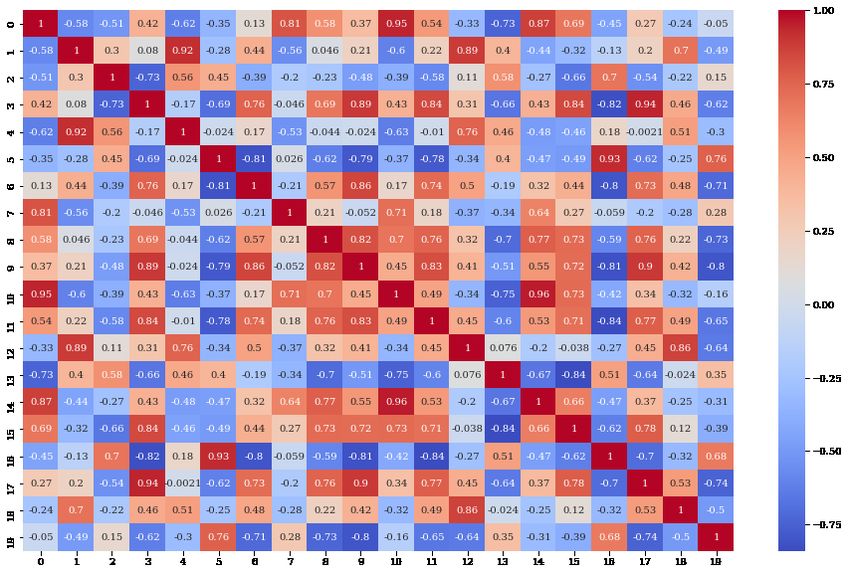
Electronics 2021, 10, 2522                                                                                                    6 of 21

                             Respectively, the Conv layers had 32 and 64 filters with a kernel size of 1 × 5 × M where M
                             represents the depth of the input signals. the filter size for the MP layers was 1 × 5.
                                  Given a set of multi-class CR pressure differentials as inputs—
                               0m
                             Xn = {( x10 , y1 ), ( x20 , y2 ), ..., ( xn0 , yn )}, where xn0 ∈ Rm and yn ∈ {0, 1, ..., n}, the ReLU--
                             activated outputs (features) from the Conv–MP layers are computed using Equation (3):

                                                                      f ( x 0 ) = max(0, x 0 )                                   (3)

                                  The SoftMax–activated predictions from the fully connected layers are obtained using
                             Equation (4) whereby the model returns 1 for highly probable correct label predictions and
                             0 for otherwise predictions.
                                                                                                    0
                                                                                                 e xi
                                                              f ( x 0 ) = SoftMax( x 0 ) =              x 0j
                                                                                                                                 (4)
                                                                                             ∑nj=1 e

                             3.3. LIME and Performance Evaluation
                                   Artificial intelligence (AI) has become predominantly preferable across most disci-
                             plines and this has motivated the significantly high disfavour on the traditional statistical
                             model-based techniques. CNNs and other DL methods are quite popular for high detection
                             accuracy, ease-of-use, and real-time compatibility; however, issues of interpretability, high
                             dependence on excessive parameters, overfitting/underfitting issues, computational cost
                             (and complexity), and the magical defiance from fundamental statistical theory made them
                             practically unreliable for industrial applications [23]. Quite interestingly, the need for
                             interpretability and explainability of these black-box models has motivated the develop-
                             ment of explainable paradigms for empirically assessing the predictive trustworthiness of
                             these models.
                                   Although performance metrics like accuracy, F1-score, precision, recall, etc. provide
                             reliable paradigms for assessing the predictive performance of classifiers, relying on these
                             global assessment metrics may result in fatal consequences under real-life situations. The
                             complex neuron–neuron and layer–layer connections deter human understanding of the
                             rationale behind the models predictive accuracy. The question— Why should I trust this
                             model? (even with mouth-watering accuracies) only verify the need for providing an expla-
                             nation to the complexities found in black-box models. Often times, ANNs learn the complex
                             correlations between inputs and make their judgement based on them; sadly, if humans
                             cannot detect these correlations (and control them) the models would most probably make
                             false predictions in real-world applications. Several methods have been proposed for
                             explaining the logic behind DL model decisions without us knowing how/when/where
                             such wrong predictions were made. These include the assessment of feature importance,
                             layer-wise relevance propagation (LRP), LIME, Shapley additive explanations, and feature
                             visualization [24,25]. Among these, LIME provides a reliable paradigm for locally explain-
                             ing the logic behind the proposed model’s decisions/predictions and was employed in
                             this study.
                                   As proposed by Ribeiro et al. [16], LIME explains a model’s predictions in a faithful
                             manner by approximating it locally with an interpretable model. In other words, it explains
                             individual sample predictions by returning coefficients based on weightages that it assigns
                             each of the features. The local interpretability effectiveness of LIME provides a strong
                             avenue for assessing the prediction of each input sample/feature. This in turn, makes
                             it possible to assess each feature’s contribution to a prediction for any arbitrary sample.
                             Originally, the effectiveness of LIME was assessed on traditional ML-based algorithms [16];
                             however, we have expanded its capability for providing explanation for DL-based models
                             with reliable results.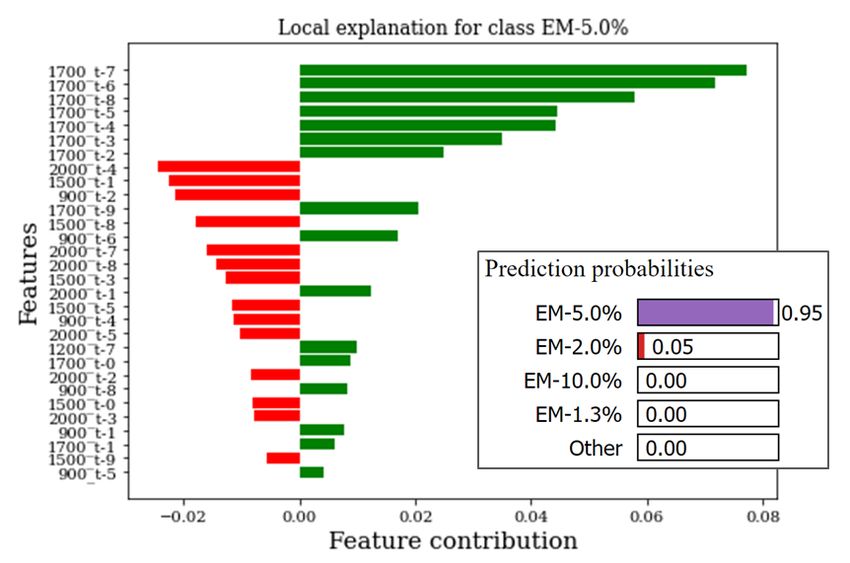
Electronics 2021, 10, 2522                                                                                              7 of 21

                             4. Results and Empirical Analyses
                                   For each of the emulsion compositions summarised in Table 2, it was observed that
                             the exhaust temperature increased as the engine speed is increased in the range— (1200,
                             1500, 1700, and 2000) RPMs; however, as Figure 4 shows, a cooling effect is observed from
                             EM-2.0% (in green) through EM-5.0% (in blue) and then to EM-10.0% (in red) while for
                             EM-20.0% (in black), the engine seemed to be overheating in compensation for the poor
                             combustion process and increased mechanical stress on the engine which collectively, were
                             as a result of the excessive water concentration.

                             Figure 4. Exhaust temperature for different emulsion compositions at increasing engine speeds.

                                  Unfortunately, the temperature history for EM-0%, EM-1.3%, and EM-1.5% were not
                             collected as a result of sensor line malfunction during the experiment.

                             4.1. CR System Characteristics
                                  To validate the need for extracting the first-order CR pressure differentials as inputs
                             for the proposed model, this subsection presents a spectral analysis of the raw CR signals
                             and their respective differentials. As a tool for investigation, the fast Fourier transform
                             (FFT) and power spectral density (PSD) are employed for analyzing the spectral behaviour
                             of the CR system. Invariably, this information provide intuitive knowledge on the unique-
                             ness/discriminance, energy distribution, and characteristics of the respective CR signals for
                             condition monitoring, while also creating an avenue for stationarizing the signals—another
                             key importance of extracting the CR pressure differentials.
                                  A detailed report on the CR signals for different emulsion compositions at different
                             speeds is provided in Figures A1–A5 (Appendix A). It is observed in the figures that for the
                             CR pressure signals at different emulsion compositions (far left column), different spectra
                             are obtained; revealing the effect the constituent frequencies from the FFT outputs (middle
                             column) and energy densities from the PSD plots (far right column). Although the respective
                             spectra are quite intuitive, the effect of non-stationarity in the signals are observed in
                             the lower frequency regions. This hints on a high correlation/similarity between the
                             different conditions—an undesired characteristic needed for accurate diagnostic/condition
                             monitoring. In contrast, Figures A6–A10 (Appendix B) which summarise the CR pressure
                             differentials for different emulsion compositions at different speeds, provides better spectral
                             representations for the different emulsion conditions. With unique frequency distributions
                             across the emulsion compositions (and speeds), the discriminance needed from the signals
                             for accurate condition monitoring is increased. Furthermore, it is observed on the left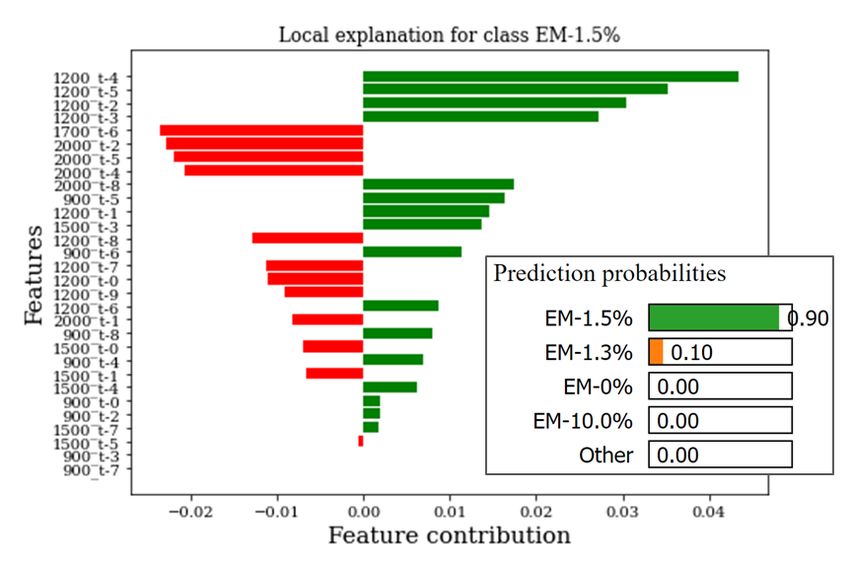
Electronics 2021, 10, 2522                                                                                           8 of 21

                             columns of the Figures A6–A10 (Appendix B) that the differentials are stationary with a
                             zero mean value.
                                  To summarise the spectral behaviour of the CR system at the various emulsion
                             compositions, selected spectral parameters for analysing non-statioanry signals were
                             employed on the raw CR pressure signals—spectral centroid (µ1 ), root mean square fre-
                             quency (RMSF), spectral skewness (SS), and spectral kurtosis (K f ), and are defined in
                             Equations (5)–(8), respectively.
                                                                            b
                                                                           ∑k2=b1 f k sk
                                                                   µ1 =        b
                                                                                                                        (5)
                                                                      ∑k2=b1 sk
                                                                      v
                                                                      u b
                                                                      u ∑ 2 ( f )2
                                                                      u k=b1 k
                                                               RMSF = t    b
                                                                                                                        (6)
                                                                          ∑k2=b s2k       1

                                                                          b               3
                                                                         ∑k2=b ( f k −µ1 ) sk
                                                                              1
                                                                  SS =             b2                                   (7)
                                                                         (µ2 )3 ∑k=b1 sk

                                                                   |S(t, f )|4
                                                           Kf =                    2
                                                                                       − 2,     f 6= 0                  (8)
                                                                  h|S(t, f )|2 i
                             where f k represents the magnitude of bin number k, sk represents the center frequency of k,
                             b1 , b2 are the band edges in bins. h|S(t, f )|i is the short-time Fourier transform (STFT) of
                             the signals.
                                    These parameters further reflect the CR dynamics at the different emulsion and speed
                             conditions [26]. The spectral centroid measures signal’s spectral position and can provide
                             a comparative estimation of the vigorousness in the CR system while RMSF reflects the
                             overall energy level across the spectra. Spectral skewness measures the symmetry of the
                             spectrum around its arithmetic mean while spectral kurtosis reveal how the impulsiveness
                             of the CR pressure signals vary with frequency. Ideally, the skewness return a zero value
                             for a normal distribution and high (positive) values for signals with substantial energy.
                             Figure 5a–d show the comparison using these parameters for different emulsion composi-
                             tions at increasing engine speeds.
                                    Observing the spectral centroid in Figure 5a suggests that the spectral centroid val-
                             ues for EM-1.3%–EM-2.0% seem to be within acceptable ranges for lower engine speeds
                             (900–1500 RPM) regardless of the increasing CR vigorosness caused by W/D emulsions.
                             On the other hand, Figure 5b reveals an overall reduction of CR energy levels are due to
                             increasing W/D emulsions at engine idling condition (900 RPM). There is no significant
                             impact of increasing the engine speed at these conditions on the energy levels, except for
                             high emulsion compositions—EM-10.0% (and above), where the energy levels decrease at
                             increased engine speeds.
                                    As shown in Figure 5c, the lower spectral kurtosis observed for EM-1.3%–EM-20.0%
                             at lower engine speeds (900–1500 RPM) suggest low impulsiveness of the signals unlike for
                             EM-0%. These are also supported by the signals shapes revealed by the spectral skewness
                             values in Figure 5d which provide intuitive information about the contrasting signal wave-
                             forms across the different emulsion compositions at different engine speeds. The compared
                             skewness values in Figure 5d further reveals that small emulsion compositions (EM-1.3%)
                             at slow car speeds (around 1200 RPM of engine speed) produce CR pressure signals similar
                             to using clean diesel fuel (EM-0%); however,at higher engine RPMs (1500–2000 RPM),
                             the correlation between the signal shapes at increasing water-emulsion composition (and
                             increasing speeds) is unclear.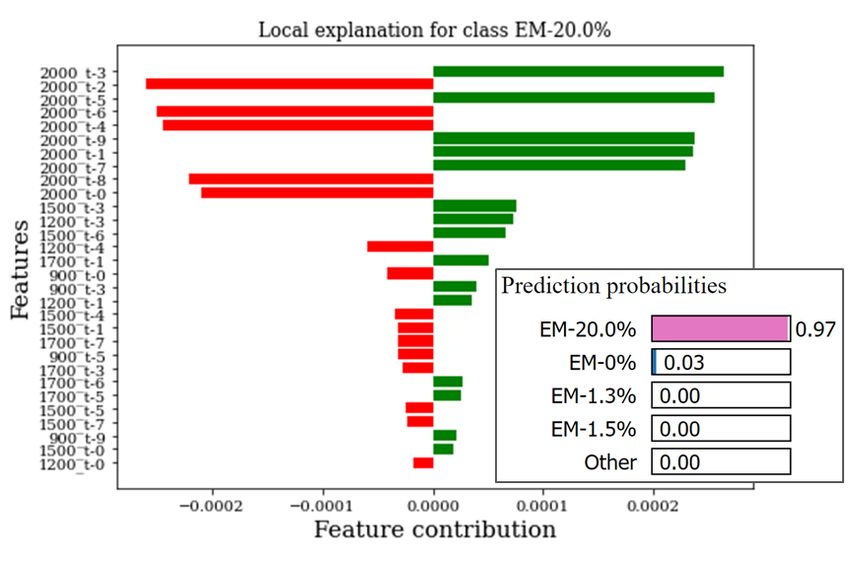
Electronics 2021, 10, 2522                                                                                                    9 of 21

      Figure 5. Spectral parameters of CR pressure differentials for different emulsion compositions (a) spectral Centroid,
      (b) RMSF, (c) Spectral kurtosis, and (d) Spectral skewness.

                                4.2. CNN-Based Diagnosis
                                      The developed model accepts processed CR pressure measurements and outputs
                                normalized class labels. The pressure differentials for each emulsion composition were
                                prepared to form [m × d × n] matrices where m, d, n represent the number of training/test
                                examples, number of time periods, and engine speeds. Consequently, for the training and
                                test datasets, [mtrain × 50 × 5] and [mtest × 50 × 5] were constructed whereby the d = 50
                                samples correspond to 0.1 time periods (1 time periods = 5 KHz).
                                      Using the training set, the developed 1D–CNN model whose architecture is sum-
                                marised in Section 3.2 was employed with a 0.5 dropout over 50 iterations. The results of
                                the training process is summarised in Figure 6 which shows the validation/test accuracy,
                                loss, recall, precision, and F1-score over the 50 iterations for a single training instance.

                                Figure 6. Model training/validation history showing accuracy, loss, precision, recall, and F1-score.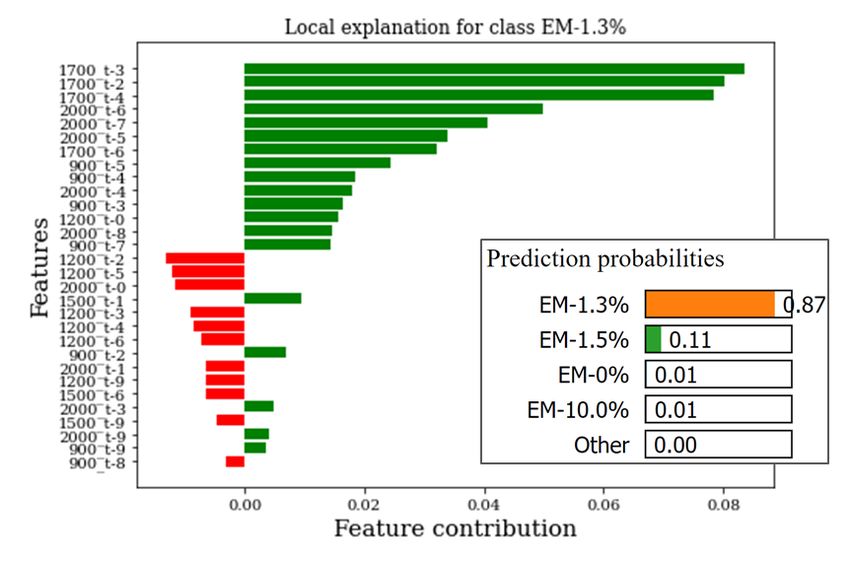
Electronics 2021, 10, 2522                                                                                          10 of 21

                                   As observed, the validation accuracy, recall, precision, and F1-scores range between
                             93.7% and 96% throughout the training process with an average validation loss of 20%
                             (thick purple line). From the zoomed view in Figure 6 above, it can also be observed
                             that the accuracy and losses do not change significantly over the number of iterations
                             until about the 45th iteration where the accuracy increases to a maximum of 96%. The
                             authors believe the marginal difference in accuracy (and loss) levels over the iteration is
                             as a result of quick error convergence of by the model give the high discriminance in the
                             training inputs. Over a 10-fold cross validation, the average accuracy, recall, precision, and
                             F1-scores were recorded as 95.918%, 95.921%, 95.915%, and 95.921% respectively.
                                   Although these global metrics are quite intuitive, the need for an in-depth assessment
                             of the developed model prompted the authors to conduct assessments on the high-level
                             features extracted from the Conv layers. First, a correlation-based assessment of the features
                             were conducted and the results presented in Figure 7. Next, explainable paradigms are
                             employed for local and feature-based model assessments.

                                  Figure 7. Correlation matrix of the high-level features.

                                   As shown, most of the features have negative correlation values (in blue) accompanied
                             by a few other feature pairs with low positive correlation (in light red). These invariably
                             suggest a high discriminance amongst the features and further goes to validating the
                             efficiency of the Conv layers for discriminative high-level feature extraction.

                             4.3. Performance Evaluation
                                   Model inspection for understanding the rationale behind its decision logic has become
                             important for real-life applications. To evaluate the proposed model’s performance, a
                             comparative assessment with other popular high-performing DL models were employed.
                             It is worth noting that these models– gated recurrent units(GRU), long short-term memory
                             (LSTM), and bi-directional LSTM (BI-LSTM) share a similar architecture with the proposed
Electronics 2021, 10, 2522 11 of 21
CNN model in the sens e that they have the same number of nodes and layers (besides the
convolutional layers). This provides a relatively fair standpoint for which an ideally fair
comparison would be made since it would be futile to explore all the possibilities for the
algorithms. In this light, a global evaluation was conducted based on the overall test scores
and the computational costs associated with each algorithm during the analysis. Figure 8a
presents the global test accuracy comparison while Figure 8b presents the computational
costs reported for each algorithm over a 10- fold cross validation.
(a) (b)
Figure 8. Global performance comparison of algorithms (a) Overall test performance; (b) Computational costs.
It is observed in Figure 8a that for each of the models, similar test accuracy, F1-score,
precision, and recall were returned; however, the clear superior predictive capabilities of the
proposed model is observed by ≈96.79% score while the LSTM model ranks second with an
accuracy of ≈88.84%. On the other hand, it is observed from Figure 8b that the stand-alone
CNN models is the most computationally efficient with just 2.2% (54.4 s) whereas the
computational costs for the other models are quite significant with the BI-LSTM’s greed for
computational resources constituting ≈43.1% (1060.8 s). All analyses were conducted in the
Python-based DL library—Keras with Tensorflow back-end to provide compatibility with
GPU environments on a PC with specification—AMD Ryzen 7 (manufactured in Taiwan),
2700 Eight-core 3.20 GHz processor and 16 GB RAM.
In addition to the global prediction performances by the models, a more class-specific
evaluation was conducted using confusion matrices and are presented in Figure 9.
As shown in Figure 9a, out of the 14.29% (100%/7 classes) perfect prediction for each
class, 13.24%, 13.99%, and 13.41% true positives were returned by the model for EM-1.3%,
EM-1.5%, and EM-2.0% respectively while perfect predictions are observed for EM-0%,
EM-5.0%, EM-10.0% and EM-20.0% respectively. On the other hand, it is observed from
the predictions by the other models as shown in Figure 9b–d that the only the TPs for
EM-0% and EM-20.0% were perfect (14.29%) while for the other emulsion compositions,
poor predictions are observed ; especially for EM-1.3% whereby the FPs are higher than
the TPs.
Contrary to the shallow explanation provided by the already-explored metrics and
confusion matrix, the LIME algorithm provides a more in-depth avenue for ensuring
the faithfulness/trustworthiness of the model is well assessed. Since it provides local
interpretability for feature-based (and global) predictions, and being a more reliable state-
of-the-art prediction evaluation algorithm for most classifiers and regressors, its judgement
is better preferred. In addition to the sample prediction trustworthiness, it returns the
feature importance and their contributions to the predictions. Figure 10 show the feature
importance and trustworthiness of the sample predictions on different (randomly selected)
test samples for each of the emulsion compositions.Electronics 2021, 10, 2522 12 of 21
(a) (b)
(c) (d)
Figure 9. Confusion matrices on test samples from (a) CNN (b) LSTM (c) GRU and (d) BI-LSTM.
As shown, the algorithm does not only provide the prediction probabilities of the
model on the respective samples (for each class), it also reveals the feature importance/
contributions to the predictions. This way, human interpretations of the model’s trust-
worthiness and feature assessments can be conducted. For instance, a closer look at
Figure 10a shows that for the single row explanation provided therein for EM-1.3%, the
model is 87% confident that the input corresponds to EM-1.3% while it is only 11% con-
fident that it corresponds to EM-1.5%. Invariably, a clear explanation for why the model
predicted the inputs to be EM-1.3% is provided visually while also revealing the features
(and their contributions) for making the prediction. It also reveals that for EM-0% EM-1.3%,
EM-5.0%, and EM-20.0% (see Figure 10b, Figure 10e, and Figure 10g, respectively) most
of the important (the highest contributing) features are found in the higher engine speeds
(1700–2000 RPM) whereas for EM-1.5% and EM-10.0% (see Figure 10c and Figure 10f, re-
spectively), the most important features are found within lower engine speeds (1200 RPM).Electronics 2021, 10, 2522 13 of 21
(a) (b)
(c) (d)
(e) (f)
(g)
Figure 10. LIME-based explanations, faithfulness, and feature importance/contributions for the proposed model predictions
on samples of the different emulsion compositions. (a) EM-0%, (b) EM-1.3%, (c) EM-1.5%, (d) EM-2.0%, (e) EM-5.0%, (f)
EM-10.0%, and (g) EM-20.0%.Electronics 2021, 10, 2522 14 of 21
5. Related Works, Discussions and Open Issues
A closer look into water emulsified diesel fuels reveals that diesel chemical property is
improved by emulsification and this can be attributed to the phenomena— micro explosions.
At high temperatures, emulsion droplets evaporate faster which invariably triggers puffing
and micro-explosions to produce smaller droplets that improve miscibility between both
fluids. In turn, the high production of the pollution-causing compounds are reduced [9,27].
A study by Greeves et al. [28] suggests that water emulsified fuels resulted in a 70%,
50%, and 50% reduction of NO, CO, and smoke, respectively, accompanied with small
improvements in specific fuel consumption. Furthermore, their study provided a leeway
for other researches on investigating the effect and advantages of several water/diesel
mixture ratios [7,9,29]. Some of these studies include Azimi et al.’s investigation on the
effect of water emulsified diesel fuels on exhaust emissions and engine noise using a
water-cooled, four-stroke, four cylinder-engine (direct injection type). Their investigation
showed that a 2% water-in-diesel emulsion reduced overall engine noise [7]. Another study
by Marchitto et al. [29] revealed that using emulsified diesel fuels is associated with a
significant reduction and improvement in mixture over-fuelling and fuel efficiency, respec-
tively. Furthermore, the authors in [9] investigated for thermal efficiency and conducted
several pollution emission analysis of a light-duty diesel engine generator fueled with
water-emulsified diesel. Their study recorded a (18.3 to 45.4)% NOx reduction and about
(1.2 to 19.9)% thermal efficiency. These studies all hint on the efficiencies and advantages
of using water-emulsified diesel fuels; yet, the challenge of knowing the globally accept-
able water composition still remains due to global differences in climate, usability, engine
configuration, diesel fuel quality, durability of engine components, and a host of many un-
certainties. Nonetheless, two contradictory facts still remain—the use of water-emulsified
fuels have eco-friendly benefits on one hand and long-term wear/corrosion effects on
injection system components on the other hand. This contradiction is still a major concern
for its adoption.
Although existing studies reveal encouraging paradigms for the use of water-emulsified
diesel fuels for improved fuel efficiency and a more eco-friendly environment, the reliabil-
ity of such methods remains open for continued discussions. Issues on stability, mixing
conditions, temperature, and mixing compositions greatly influence the reliability of water-
emulsified diesel fuels; nonetheless, as this study proposes, using a highly reliable condition
monitoring framework may help curtail injection system damage by using acceptable/safe
water emulsions to save cost, minimize engine thermal stress, and reduce pollution-causing
emissions while it lasts. The information provided in this study validates the use of small
water-emulsion compositions (less than 5% by volume), above which, the CR system
may operate less efficiently as reflected by the spectral parameters for higher emulsion
compositions. Besides, against the cost-efficiency of using water-emulsified fuels at lower
engine speeds, the irregular fluctuations in the CR system at higher engine speeds may
result in poor engine performance.
6. Conclusions
Diesel engine emissions contain high amounts of harmful compounds which con-
tribute nearly 30% of greenhouse effects and a host many health and environmental
problems. The use of water-emulsified diesel fuels provide a possible solution for curbing
these effects yet, due to the corrosion on engine components from water inclusion to diesel
fuels, the need for accurate condition monitoring remains high. This study presents a
hybrid deep learning-based condition monitoring framework which relies of the use of
standardized CR pressure differentials as inputs and 1D-CNN classifier for diagnostics.
Using a KIA Sorento 2004 four-cylinder line engine as a case study. CR pressure signals
were digitally extracted at various water-in-diesel emulsion compositions at various engine
RPMs. Extensive empirical assessments were conducted on the proposed model for:Electronics 2021, 10, 2522 15 of 21
• Understanding the spectral dynamics in the CR system as a result of diesel emulsifi-
cation using FFT, PSD and spectral statistical features over different water-in-diesel
compositions and engine speeds.
• Exploring (and validating) the proposed diagnostic model for CR diagnosis given the
CR pressure differentials on a real case study.
• Providing explanations on the proposed model’s reliability and trustworthiness. These
were achieved using diverse conventional diagnostic evaluation metrics and the LIME
algorithm. In addition, the cost implications were assessed form a comparative
standpoint between the proposed model and other deep learning models.
On a different note, the results from the case study presented in this study were
achieved under passive parameter controls—operating conditions and model parameters.
Since the emulsion compositions were pre-designed and the model parameters chosen
arbitrarily, future research would emphasize on the automation potentials of the proposed
model to avoid human errors. Furthermore, to achieve generality of the proposed model,
additional tests on different engine models (and configuration) may be needed to fully
ascertain with surety the damage severity of diesel emulsification on diesel engines fuel
injection system.
From a generalization point of view, the authors believe that beyond the presented
case study, the proposed algorithm can flourish (with minor re-configuration) on different
applications ranging from fault detection, fraud detection, anomaly detection, and more
interestingly, for separation of the emulsion during operations. This is yet another open
research path very fertile for exploration and shall motivate our continued research in
the domain.
Author Contributions: conceptualization, U.E.A.; methodology, U.E.A.; software, U.E.A.; formal
analysis, U.E.A.; investigation, U.E.A.; resources, U.E.A. and J.-W.H.; data curation, U.E.A.; writing—
original draft, U.E.A., writing—review and editing, U.E.A. and J.-W.H; visualization, U.E.A.; supervi-
sion, J.-W.H.; project administration, J.-W.H.; funding acquisition, J.-W.H. All authors have read and
agreed to the published version of the manuscript.
Funding: This research was supported by the MSIT (Ministry of Science and ICT), Korea, under the
Grand Information Technology Research Center support program (IITP-2020-2020-0-01612) super-
vised by the IITP (Institute for Information & communications Technology Planning & Evaluation).
Data Availability Statement: The data presented in this study are available on request from the
corresponding author. The data are not publicly available due to laboratory regulations.
Acknowledgments: Early preliminary research was supported by Min Seop Kim affiliated with the
Department of Mechanical Engineering (Department of Aeronautics, Mechanical and Electronic
Convergence Engineering), Kumoh National Institute of Technology.
Conflicts of Interest: The authors declare no conflict of interest.
Appendix A. CR Pressure Signal Characteristics
This document presents the raw CR pressure characteristics using FFT and PSD for the
various water emulsion compositions at different engine speeds. Figures A1–A5 present
these results for 900, 1200, 1500, 1700, and 2000 RPMs, respectively.
On the left columns of each figure are the standardized CR pressure signals. On
the middle are their corresponding FFT spectra while the PSDs are presented on the far
right columns. Across the rows are the time-series signal, FFT, and PSD outputs for the
respective water emulsion compositions (represented with unique colors as shown in the
figure labels at the extreme right corner). As shown, the dynamics in their respective time-
series characteristics can be visually observed; however, the spectral characteristics help
provide a more reliable understanding of the CR system whereby the various constituent
frequencies in the time-series are visually observed in the FFT output. This is further
evaluated by the respective PSDs which provide the spectral energy distribution found
in the signals. It can be observed that across the different conditions, the signals oscillateElectronics 2021, 10, 2522 16 of 21
predominantly at lower frequencies (0–200 Hz) and this is due to the non-stationarity in
the signals.
Figure A1. CR signals and their FFT and PSD outputs at 900 RPM for the emulsion compositions.
Figure A2. CR signals and their FFT and PSD outputs at 1200 RPM for the emulsion compositions.Electronics 2021, 10, 2522 17 of 21
Figure A3. CR signals and their FFT and PSD outputs at 1500 RPM for the emulsion compositions.
Figure A4. CR signals and their FFT and PSD outputs at 1700 RPM for the emulsion compositions.Electronics 2021, 10, 2522 18 of 21
Figure A5. CR signals and their FFT and PSD outputs at 2000 RPM for the emulsion compositions.
Appendix B. CR Pressure Differential Characteristics
This document presents the CR pressure differentials and their corresponding spectra
(using FFT and PSD) for the various water emulsion compositions at different engine
speeds. Figures A6–A10 present these results for 900, 1200, 1500, 1700, and 2000 RPMs, re-
spectively. Similar to the arrangement in the figures Appendix A, the pressure differentials
are presented on the left columns of each figure while on the middle and far right columns,
are their corresponding FFT and PSD spectra.
As shown the non-stationary behaviour observed in the raw CR pressure signals are
eliminated by extracting differentials. In addition, unique spikes are observed across the
different emulsion conditions (and speeds); hence suggesting the discrimnance achieved
from computing the pressure differentials. In addition, this inherent discriminance and
stationarity better enhances the diagnostic efficiencies of any classifier.
Figure A6. CR differentials and their FFT and PSD outputs at 900 RPM for the emulsion compositions.Electronics 2021, 10, 2522 19 of 21
Figure A7. CR differentials and their FFT and PSD outputs at 1200 RPM for the emulsion compositions.
Figure A8. CR differentials and their FFT and PSD outputs at 1500 RPM for the emulsion compositions.Electronics 2021, 10, 2522 20 of 21
Figure A9. CR differentials and their FFT and PSD outputs at 1700 RPM for the emulsion compositions.
Figure A10. CR differentials and their FFT and PSD outputs at 2000 RPM for the emulsion compositions.
References
1. Krogerus, T.; Huhtala, K. Diagnostics and Identification of Injection Duration of Common Rail Diesel Injectors. Open Eng. 2018, 8,
1–6. [CrossRef]
2. Krishnamoorthi, M.; Malayalamurthi, R. The influence of charge air temperature and exhaust gas recirculation on the availability
analysis, performance and emission behavior of diesel–bael oil–diethyl ether blend operated diesel engine. J. Mech. Sci. Technol.
2018, 32, 1835–1847. [CrossRef]
3. Hossain, F.M.; Nabi, M.N.; Rahman, M.M.; Bari, S.; Van, T.C.; Rahman, S.M.A.; Rainey, T.J.; Bodisco, T.A.; Suara, K.; Ristovski,
Z.; et al. Experimental Investigation of Diesel Engine Performance, Combustion and Emissions Using a Novel Series of Dioctyl
Phthalate (DOP) Biofuels Derived from Microalgae. Energies 2012, 12, 1964. [CrossRef]
4. Ryu, K.; Oh, Y. A study on the usability of biodiesel fuel derived from rice bran oil as an alternative fuel for IDI diesel engine.
KSME Int. J. 2003, 17, 310–317. [CrossRef]
5. Kalghatgi, G.; Johansson, B. Gasoline compression ignition approach to efficient, clean and affordable future engines. Proceedings
of the Institution of Mechanical Engineers.Part D J. Automob. Eng. 2018, 232, 118–138. [CrossRef]
6. Song, E.; Ke, Y.; Yao, C.; Dong, Q.; Yang, L. Fault Diagnosis Method for High-Pressure Common Rail Injector Based on IFOA-VMD
and Hierarchical Dispersion Entropy. Entropy 2019, 21, 923. [CrossRef]Electronics 2021, 10, 2522 21 of 21
7. Azimi, M.; Mirjavadi, S.S.; Davari, E.; Seifi, M.R. The effect of water-diesel emulsion usage on a tractor engine performance and
emission. Russ. Agricult. Sci. 2016, 42, 488–492. [CrossRef]
8. Iordache, R.; Petrea, N.; Bujoreanu, C. Wear’s issues on high-pressure common rail pumps. In Proceedings of the International
Conference on Tribology (ROTRIB’ 19), Cluj-Napoca, Romania, 19–21 September 2019. [CrossRef]
9. Syu, J.Y.; Chang, Y.Y.; Tseng, C.H.; Yan, Y.L.; Chang, Y.M.; Chen, C.C.; Lin, W.Y. Effects of water-emulsified fuel on a diesel engine
generator’s thermal efficiency and exhaust. J. Air Waste Manag. Assoc. 2014, 64, 970–978. [CrossRef]
10. Li, A.; Zheng, Z. Effect of Spark Ignition Timing and Water Injection Temperature on the Knock Combustion of a GDI Engine.
Energies 2020, 13, 4931. [CrossRef]
11. Çiçek, K.; Turan, H.H.; Topcu, Y.; Searslan, M.N. Risk-based preventive maintenance planning using Failure Mode and Effect
Analysis (FMEA) for marine engine systems. In Proceedings of the 2010 Second International Conference on Engineering System
Management and Applications, Sharjah, United Arab Emirates, 30 March–1 April 2010; pp. 1–6.
12. Suresh, V.; Amirthagadeswaran, K.S. The role of water-in-diesel emulsion and its additives on diesel engine performance and
emission levels: A retrospective review. Alex. Eng. J. 2016, 55, 2463–2472. [CrossRef]
13. Shyam, P.H.; Joseph, G.; Vijay, V.S. Effect of Introduction of Water into Combustion Chamber of Diesel Engines—A Review.
Energy Power 2015, 5, 28–33. [CrossRef]
14. Sundaram, K.M.; Hussain, A.; Sanjeevikumar, P.; Holm-Nielsen, J.B.; Kaliappan,V.K.; Santhoshi, B.K. Deep Learning for Fault
Diagnostics in Bearings, Insulators, PV Panels, Power Lines, and Electric Vehicle Applications—The State-of-the-Art Approaches.
IEEE Access 2021, 9, 41246–41260. [CrossRef]
15. Akpudo, U.E.; Hur, J.W. An Automated Sensor Fusion Approach for the RUL Prediction of Electromagnetic Pumps. IEEE Access
2021, 9, 38920–38933. [CrossRef]
16. Ribeiro, M.T.; Singh, S.; Guestrin, C. “Why Should I Trust You?”: Explaining the Predictions of Any Classifier. arXiv 2016,
arXiv:1602.04938.
17. Kim, M.-S.; Akpudo, U.E.; Hur, J.-W. A Study on Water-Induced Damage Severity on Diesel Engine Injection System Using
Emulsified Diesel Fuels. Electronics 2021, 10, 2285. [CrossRef]
18. Kim, J.; Kim, J.; Kim, H.; Shim, M.; Choi, E. CNN-Based Network Intrusion Detection against Denial-of-Service Attacks. Electronics
2020, 9, 916. [CrossRef]
19. Hasan, M.N.; Toma, R.N.; Nahid, A.-A.; Islam, M.M.M.; Kim, J.-M. Electricity Theft Detection in Smart Grid Systems: A
CNN-LSTM Based Approach. Energies 2019, 12, 3310. [CrossRef]
20. Yuan, C.M.; Sun, X.M.; Zhao, H. Speech Separation Using Convolutional Neural Network and Attention Mechanism. Discret.
Dyn. Nat. Soc. 2020, 2020, 2196893. [CrossRef]
21. Chen, C.C.; Liu, Z.; Yang, G.; Wu, C.C.; Ye, Q. An Improved Fault Diagnosis Using 1D-Convolutional Neural Network Model.
Electronics 2021, 10, 59. [CrossRef]
22. Wang, Y.; Ma, S.; Shen, X. A Novel Video Face Verification Algorithm Based on TPLBP and the 3D Siamese-CNN. Electronics 2019,
8, 1544. [CrossRef]
23. Akpudo, U.E.; Hur, J.W. Towards bearing failure prognostics: A practical comparison between data-driven methods for industrial
applications. J. Mech. Sci. Technol. 2020, 34, 4161–4172. [CrossRef]
24. Tjoa, E.; Guan, C. A Survey on Explainable Artificial Intelligence (XAI): Toward Medical XAI. IEEE Trans. Neural Netw. Learn.
Syst. 2020, 1–21. [CrossRef] [PubMed]
25. Lee, N.; Azarian, M.H.; Pecht, M.G. An Explainable Deep Learning-based Prognostic Model for Rotating Machinery. arXiv 2020,
arXiv:2004.13608.
26. Gronfors, T.; Sihvonen, T.; Lamsa, V.; Paivinen, N. Spectral Factors and Medical Parameters of EMG Signals. In Proceedings of
the 2006 IET 3rd International Conference On Advances in Medical, Signal and Information Processing—MEDSIP 2006, Glasgow,
UK, 17–19 July 2006; pp. 1–4. [CrossRef]
27. Madan, M.A.; Thanos, M.; Jun, X.; Ganippa, L. Experimental understanding on the dynamics of micro-explosion and puffing in
ternary emulsion droplets. Fuel 2019, 239, 1284–1292. [CrossRef]
28. Greeves, G.; Khan, I.M.; Onion, G. Effects of water introduction on diesel engine combustion and emissions. Symp. (Int.) Combust.
1977, 16, 321–336. [CrossRef]
29. Marchitto, L.; Tornatore, C.; Costagliola, M.A.; Lacobacci, A. Effect of Water Injection on Fuel Efficiency and Gaseous and PN
Emissions in a Downsized Turbocharged SI Engine. J. Energy Eng. 2018, 144, 04018044. [CrossRef]You can also read