Three-Dimensional Telomeric Analysis of Isolated Circulating Tumor Cells (CTCs) Defines CTC Subpopulations1,2 - ScreenCell
←
→
Page content transcription
If your browser does not render page correctly, please read the page content below
Tr a n s l a t i o n a l O n c o l o g y                                              Volume 6 Number 1                February 2013           pp. 51–65       51
www.transonc.com

         Three-Dimensional Telomeric                                         Julius Adebayo Awe*,†,‡, Mark Chu Xu*,
                                                                             Janine Wechsler§,¶, Naoual Benali-Furet§,
         Analysis of Isolated Circulating                                    Yvon E. Cayre§,#, Jeff Saranchuk**,
                                                                             Darrel Drachenberg** and Sabine Mai*
         Tumor Cells (CTCs) Defines
         CTC Subpopulations1,2                                               *Manitoba Institute of Cell Biology, University of Manitoba,
                                                                             CancerCare Manitoba, Winnipeg, Manitoba, Canada;
                                                                             †
                                                                              Department of Clinical Genetics, Institute of Biomedicine,
                                                                             Sahlgrenska Academy, University of Gothenburg, Gothenburg,
                                                                             Sweden; ‡Systems Biology Research Centre, School of
                                                                             Life Sciences, University of Skovde, Skovde, Sweden;
                                                                             §
                                                                               ScreenCell, Paris, France; ¶Department of Pathology,
                                                                             Hôpital Henri Mondor, Créteil, France; #Hôpital Robert
                                                                             Debré and Pierre and Marie Curie University, Paris,
                                                                             France; **Manitoba Prostate Center, Section of Urology,
                                                                             Department of Surgery, University of Manitoba, Winnipeg,
                                                                             Manitoba, Canada

         Abstract
         Circulating tumor cells (CTCs) have been identified with the potential to serve as suitable biomarkers for tumor stage
         and progression, but the availability of effective isolation technique(s) coupled with detailed molecular characterization
         have been the challenges encountered in making CTCs clinically relevant. For the first time, we combined isolation of
         CTCs using the ScreenCell filtration technique with quantitative analysis of CTC telomeres by TeloView. This resulted
         in the identification and molecular characterization of different subpopulations of CTCs in the same patient. Three-
         dimensional (3D) telomeric analysis was carried out on isolated CTCs of 19 patients that consisted of four different
         tumor types, namely, prostate, colon, breast, melanoma, and one lung cancer cell line. With telomeric analysis of the
         filter-isolated CTCs, the level of chromosomal instability (CIN) of the CTCs can be determined. Our study shows that
         subpopulations of CTCs can be identified on the basis of their 3D telomeric properties.

          Translational Oncology (2013) 6, 51–65

Introduction                                                                 cells—or one in a billion blood cells (including erythrocytes), has
Circulating tumor cells (CTCs) are cells dispersed into the bloodstream      made the task of efficiently isolating and quantifying CTCs in the
by both primary and metastatic cancers [1,2]. While some CTCs die in         circulation quite challenging [5,6]. CTCs found in the peripheral
circulation, others are able to proliferate and invade, thereby forming      circulation may be distinct representations of the different pheno-
metastatic deposits at distant organ sites [3]. The spread of CTCs to dis-   types of cancer cells seen in the primary tumors from which they
tant sites such as bone, brain, lung, and liver has made cancer manage-
ment difficult despite improved early diagnosis [4]. Evidence exists that
                                                                             Address all correspondence to: Sabine Mai, PhD, 675 McDermot Avenue, Winnipeg,
CTCs are detectable even in the earliest stages of cancer [3]; thus, this    MB R3E0V9 Canada. E-mail: smai@cc.umanitoba.ca
                                                                             1
potentially permits the use of CTC detection and analysis in the early         This study was supported with funds from Canadian Institutes of Health Research,
diagnosis of cancer. The combination of an efficient isolation technique     CIHR (S.M.), Mitacs Accelerate with CancerCare Manitoba and Carl Zeiss Canada
                                                                             ( J.A.A.), and the University of Manitoba Undergraduate Research Award (M.C.X.).
and a suitable biomarker, that is uniformly present in all tumor cell        2
                                                                               This article refers to supplementary material, which is designated by Figure W1 and is
types, to characterize CTCs will permit advances in both cancer research     available online at www.neoplasia.com.
and the development of personalized medicine for cancer patients.            Received 21 October 2012; Revised 11 November 2012; Accepted 12 November 2012
   The very low number of CTCs in the bloodstream, which can be              Copyright © 2013 Neoplasia Press, Inc. All rights reserved 1944-7124/13/$25.00
as low as one CTC in 1 to 10 million peripheral blood mononuclear            DOI 10.1593/tlo.12361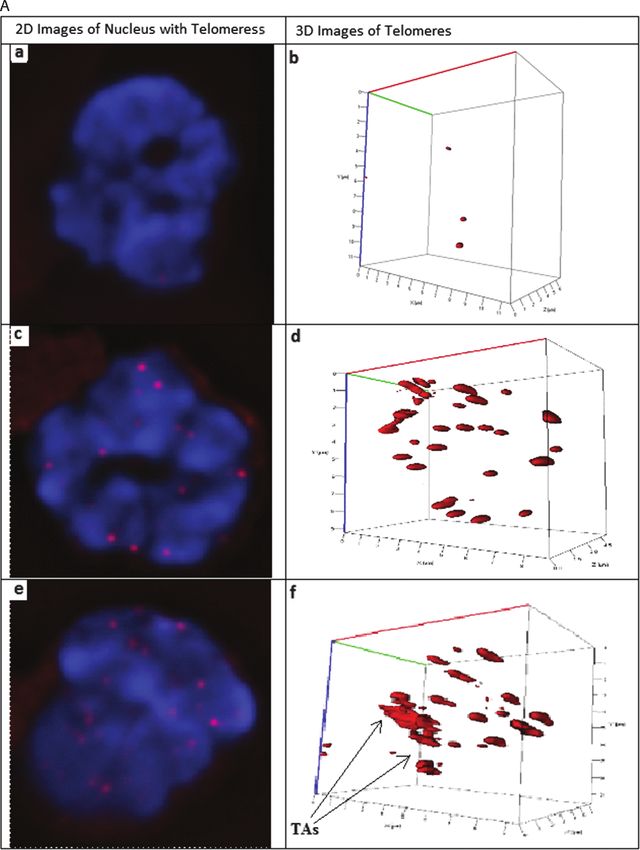
52      Three-Dimensional Telomeric Analysis      Awe et al.                                     Translational Oncology Vol. 6, No. 1, 2013

originated. This can be explained due to the fact that a biopsy of the      normal, preneoplastic, and tumor cells and between tumor stages [23,24].
primary tumor cannot identify each and every phenotypic variant             In the present study, we have isolated by filtration CTCs from patients
present in the primary tumor irrespective of the number of biopsy           with colon cancer, prostate cancer, breast cancer, and melanoma and
cores taken.                                                                also examined one cultured lung cancer cell line followed by 3D quan-
    It is believed that only a small percentage of cancer cells in the      titative analysis of their telomeric signatures using the TeloView [15].
primary tumor develop the ability to disseminate and exhibit meta-          This combined approach resulted in the identification of CTCs and
static behavior and also CTCs can evolve further while in circulation.      detection of CTC subpopulations for each tumor type.
For example, some of these CTCs may lack tumor initiating capabil-             In conclusion, we have, for the first time, characterized CTC
ities, whereas other cells have undergone epithelial-to-mesenchymal         subpopulations in different tumors based on their 3D nuclear telo-
transition [7]. Despite their heterogeneity and rarity in circulation,      meric profiles, thereby encouraging studies in larger patient cohorts
CTCs have been shown to have the potential to enhance cancer                to determine if the 3D telomeric profiles of CTCs can serve as
staging, prognosis determination, and eventually personalized manage-       surrogate biomarkers.
ment of cancer [8]. Thus, the need for a highly efficient isolation tech-
nique and a suitable biomarker, which analyzes CTCs irrespective of
their surface antigen expression which may not be conserved, has to         Materials and Methods
be met.
    Telomeres, found at the terminal ends of eukaryotic chromosomes,        Patients
serve to protect chromosomes and preserve their integrity. In verte-           This research was approved by the Research Ethics Board on
brates, telomeres consist of tandem repeated DNA sequences,                 human studies at University of Manitoba (Ethics Reference No.
(TTAGGG)n, with an average length of 5 to 15 kbp in humans                  H2011:336) and in Paris, France [Committees for the Protection of
[9,10]. Telomere dysfunction has been shown to promote numerical            Persons (CPP) Registration No. ID-RCB 2010-A01148-31]. Ten fil-
and structural chromosomal instability (CIN), which is a common             tered patient samples and one lung cancer cell line were received from
feature in cancer [11]. In normal cells, telomeres are arranged in a        France. Additional nine prostate cancer samples were obtained from the
specific nonoverlapping manner in the three-dimensional (3D) space          Prostate Cancer Centre of CancerCare Manitoba. Patients’ consents
of the nucleus [12,13]. At interphase, the nuclei of cancer cells exhibit   were obtained before enrollment in the study. The patient population
telomeric aggregates (TAs), aberrant telomeric clusters that are asso-      consists of nine prostate cancer, one colon cancer, three breast cancer,
ciated with an altered 3D telomeric organization in the nuclear space       and six melanoma cases and one lung cancer cell line (Table 1).
of cancer cells [14,15]; such clusters of telomeres are independent of         There was no prior knowledge of the clinical data of the patients
telomerase activity and telomere size [15]. These changes in nuclear        involved to enable an unbiased analysis of the samples. The classifi-
architecture of tumor cells have been associated with CIN and a measure     cation of patients into stages of cancer was done blindly on the basis
of the degree of these alterations depicts the advancement and aggres-      of the 3D profiles of telomeres observed in their CTCs and was con-
siveness of the tumor at that particular time [16,17]. Previous work done   firmed with clinical parameters in post hoc fashion.
by our group showed that alterations in the 3D organization of telo-
meres occur in different cancer types, thus making altered 3D nuclear
telomeric profiles a common feature for assessment of many cancer types
                                                                            CTC Isolation by Filtration
                                                                               Unlike most isolation techniques, the ScreenCell filtration device
[17]. Cancer cell nuclei sometimes also feature elongated telomeres
                                                                            isolates the total CTC population, and not subpopulations, from
with the presence of different subpopulations of telomere lengths in
the same nucleus [17,18].                                                   3 ml of patients’ blood [6]. This isolation is done by size with the
    On the basis of the above findings, we postulated that investigat-      aid of a microporous membrane filter; therefore, expression levels
                                                                            and/or absence of cell surface antigens play no role in the separation.
ing the 3D nuclear telomere organization of CTCs may be key to
                                                                            The 19-cm-long device consists of a filtration tank, a filter, and a
efficiently characterizing the associated cancer into different stages
                                                                            detachable nozzle attached to it. This nozzle guides the insertion
of aggressiveness, therefore providing better monitoring of disease
                                                                            of a collection EDTA tube to it to gently vacuum suction the blood
progression, prognosis determination, and even post-therapy follow-
                                                                            through the filter membrane leaving the CTCs on the membrane
up for possible relapse in the future. Previous studies of telomeres
                                                                            [6]. The 18-μm-thick polycarbonate membrane has circular pores
have shown significant differences between normal and tumor cells,
premalignant and malignant cells, and tumor cell subpopulations in          (7.5 ± 0.36 μm) that are randomly distributed throughout the filter
different cancer types like plasmacytoma [15], cervical cancer [17,19],     (1 × 10⁵ pores/cm2) [6]. The filtration process is quick (2–3 minutes),
                                                                            and it preserves both the CTC morphology and microclusters/
Burkitt lymphoma [12], head and neck cancer [12], Hodgkin’s lym-
                                                                            microemboli (Figure 1, B–E ). The filtration method was validated
phoma [20], glioblastoma [21], and myelodysplastic syndromes/acute
                                                                            with spiked tumor cells; when two and five spiked cells per 1 ml of blood
myeloid leukemias [22].
                                                                            were used, the average number of cells recovered were 1.48 (SD, 0.71)
    In this study, we have, for the first time, combined a filtration-
                                                                            and 4.56 (SD, 0.71), respectively [6].
based CTC isolation technology from ScreenCell, which isolates
tumor cells from a simple phlebotomy blood sample by capturing
the CTCs that cannot pass through its pores (7.5 ± 0.36 μm in diam-         Three-dimensional Quantitative Fluorescence
eter) [6], and our 3D telomere profiling technology that uses quantita-     In Situ Hybridization
tive imaging and software (TeloView) to determine the 3D nuclear               Quantitative fluorescence in situ hybridization was carried out on
profiles of normal versus tumor cells [22]. The 3D telomeric organiza-      the nuclei of the CTCs captured by the filters according to the pro-
tion of lymphoid and nonlymphoid cancers has been examined in the           tocol earlier described by our laboratory group [12,15,20,21]. In
past by our laboratory and significant differences were found between       brief, the cells on the filters are incubated in 3.7% formaldehyde/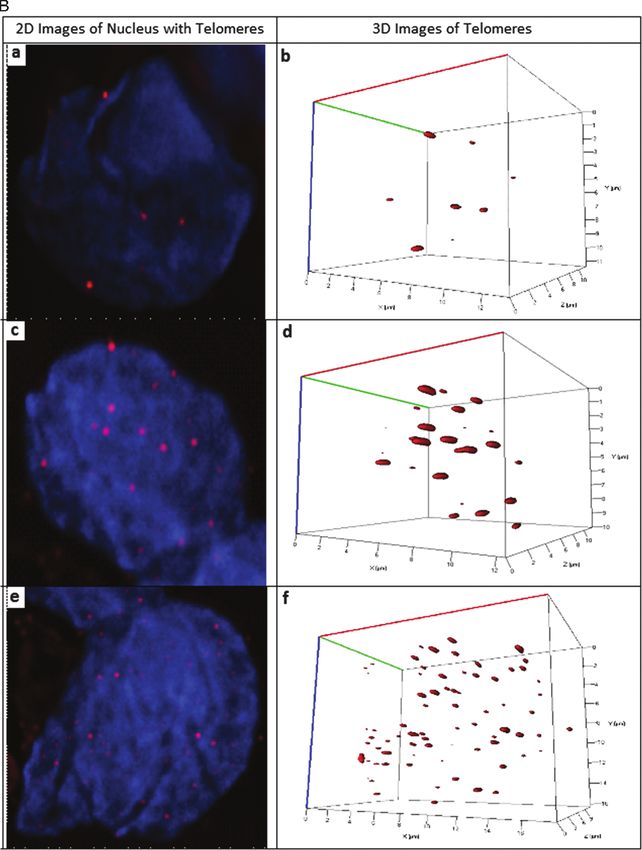
Table 1. Clinical Data of the Patients Who Participated in the Study.

Patient ID          Demography              Lifestyle                                Family History                         Comorbidities       Investigations and Management with Dates

                    Age/Ethnicity           Smoking/Pack Years/         Alcohol/     Relation/Domain/Cancer                                     Pathology/Laboratory Findings              Treatment with Dates
                                            Year Quit                   Frequency

MB0181PR            59 Caucasian            Ex-smoker                   Occasional   Unknown                                None                PSA: 4.42 μg/l (6/11);                     TRUS (2/2012)
                                                                                                                                                  5.95 μg/l (9/11);
                                                                                                                                                  9.26 μg/l (1/12).
                                                                                                                                                Gleason score N/A
                                                                                                                                                Small cell carcinoma
MB0182PR            73 Black                Unknown                                                                         Hypertension        PSA: 9.51 μg/l (6/11)                      TRUS (8/2011)
MB0189PR            66 Caucasian            Ex-smoker/unknown/40        Occasional   Brother/immediate/prostate cancer      Paget’s Dx          Adenocarcinoma                             TRUS (2007–2011)
                                                                                                                            Hypertension        PSA: 4.46 to 7.49 μg/l                     Radical prostatectomy with bilateral
                                                                                     Sister/immediate/kidney cancer         Dysplasia             (2007–2011)                                pelvic lymphadenectomy (3/12/2012)
                                                                                                                            Glaucoma            Gleason: 6–7 (2007–2012)
MB0211PR            62 Caucasian            Nonsmoker                   Daily        Grandfather/unknown/prostate cancer    Hypothyroid         Adenocarcinoma                             TRUS (3/15/2012)
                                                                                                                                                                                                                                  Translational Oncology Vol. 6, No. 1, 2013

                                                                                     Father/immediate/lung cancer                               PSA: 4.55–6.04 μg/l                        Radical prostatectomy with bilateral
                                                                                                                                                  (2009–2012)                                pelvic lymphadenectomy
                                                                                                                                                Gleason: 7 (2012)                            (5/31/2012)
MB0213PR            50 Caucasian            Smoker/N/A                  Never        Father/immediate/prostate cancer       None                Adenocarcinoma                             TRUS (3/14/2012)
                                                                                     Grandfather/paternal/prostate cancer                       PSA: 3.15 μg/l (2012)
                                                                                                                                                Gleason: 7 (2012)
MB0216PR            65 Caucasian            Nonsmoker                   Never        Father/immediate/prostate cancer       None                Benign adenocarcinoma                      TRUS (1/4/2011)
                                                                                                                                                PSA: 5.6–1.52 μg/l                         TRUS (6/12/2012)
                                                                                                                                                  (2008–2012)
                                                                                                                                                Gleason: 9 (2012)
MB0217PR            57 Caucasian            Nonsmoker                   Never        Mother/immediate/unknown               None                Benign adenocarcinoma                      Radical prostatectomy with bilateral
                                                                                                                                                PSA: 80.91 μg/l (2007);                      pelvic lymphadenectomy (6/5/2008)
                                                                                                                                                  60.28 μg/l (2008);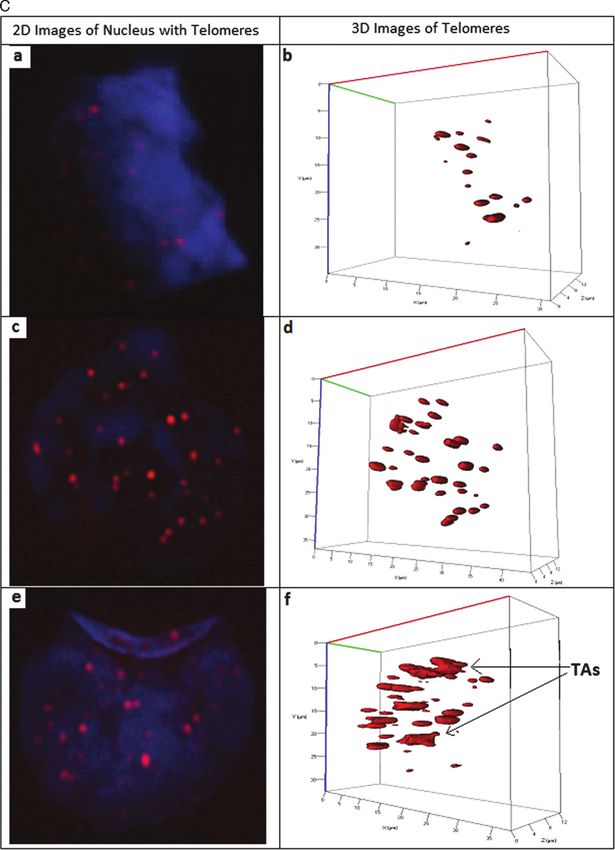
54 Three-Dimensional Telomeric Analysis Awe et al. Translational Oncology Vol. 6, No. 1, 2013
1× phosphate-buffered saline for 10 minutes followed by a 10-minute
treatment with 50 μg/ml pepsin in 0.01 N HCl. The CTCs are
Tumor excision (30/11/2010)
Tumor excision (23/7/2010)
postfixed to the filters with 3.7% formaldehyde/1× phosphate-buffered
Tumor excision (23/7/2010)
Tumor excision (28/6/2010)
saline for 10 minutes before 8 μl of Cyanine 3 (Cy3)–labeled peptide
Treatment with Dates
nucleic acid probe purchased from DAKO (Glostrup, Denmark) is
applied to them. The coverslipped and rubber cement–sealed filters on
slides then undergo a 3-minute denaturation at 80°C followed by a
Cell line
2-hour hybridization at 30°C. The CTCs containing filters are washed
twice 15 minutes each in 70% formamide/10 mM Tris (pH 7.4),
subjected to a 5-minute wash in 0.1× SSC at 55°C, then washed twice
5 minutes each in 2× SSC/0.05% Tween 20. Finally, the nuclei are
Investigations and Management with Dates
Nodular MM* grade 4; thickness, 4.6 mm
stained with 50 μl of 0.1 μg/ml 4′,6-diamindino-2 phenylindole
(DAPI), dehydrated in graded concentrations of ethanol, and cover-
SSM* grade 4; thickness, 2.5 mm
SSM* grade 4; thickness, 4 mm
slipped with Vectashield (Vector Laboratories, Burlington, Ontario)
Pathology/Laboratory Findings
reagent ready for imaging.
Nodular MM* grade 4;
thickness, 7 mm
Three-Dimensional Image Acquisition
Images are acquired using a Zeiss AxioImager Z2 microscope (Carl
Cell line
Zeiss, Toronto, Ontario), equipped with AxioCam HR B&W camera
and 63×/1.4 oil objective. The microscope is equipped with a Cy3
filter for detection of peptide nucleic acid probe–hybridized telomeres
and a DAPI filter for nuclear DNA detection with AXIOVISION 4.8
Basal cell carcinoma
Basal cell carcinoma
TRUS, transrectal ultrasound; PSA, prostate-specific antigen; PR, prostate; MB, Manitoba; MM, malignant melanoma; SSM, superficial spreading melanoma.
software (Carl Zeiss). The Zeiss AxioImager Z2 was programmed to
Comorbidities
Hypertension
Benign nevus
take 80 stacks of images at x and y = 102 nm and z = 200 nm to
Diabetes
Cell line
capture the different planes of the CTCs that are observed beside
the pores or slightly in the pores. The same acquisition time was used
to acquire Cy3 images of telomeres from each tumor type for quan-
titative comparison and analysis. The acquisition times used in milli-
seconds were given as follows: melanoma, 1290; colon cancer, 212;
breast cancer, 212; prostate cancer, 546; lung cancer cell line, 173.6.
Thirty interphase nuclei were imaged for analysis; deconvolution of
Relation/Domain/Cancer
the images was performed with a constrained iterative algorithm
[25]. The reconstructed 3D images were then exported as .tiff files
Family History
into our TeloView program for analysis [25].
Unknown
Cell line
None
None
None
TeloView Enabled 3D Image Analyses and
Statistical Considerations
TeloView quantifies the telomere numbers, signal intensity, sizes,
Frequency
Unknown
Unknown
Unknown
Unknown
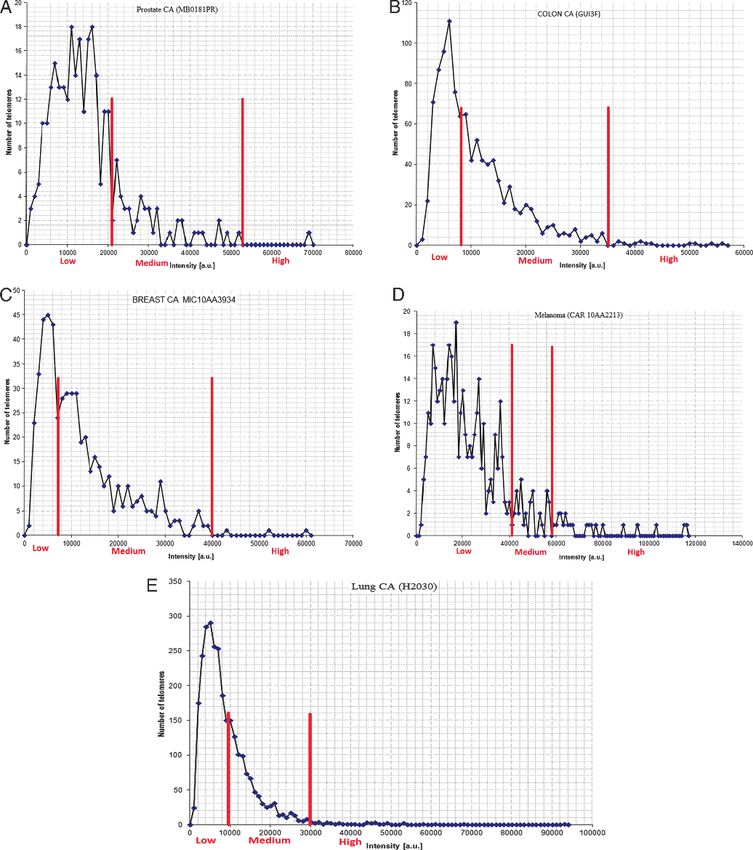
distribution, TAs, and nuclear volume for each sample. A graph of
Cell line
Alcohol/
telomere numbers (y-axis) against signal intensity (x-axis) is plotted
for each sample giving a first overview of the CTC 3D telomere pro-
files and of the presence/absence of subpopulations (Figure 3, A–E ).
In addition, aggregate numbers and nuclear volumes are calculated
Smoking/Pack Years/
and included in the analysis.
Statistical parameters considered for characterizing the CTCs in
each patient sample into subpopulations are given as follows: 1) per-
Unknown
Unknown
Unknown
Unknown
Year Quit
Cell line
Lifestyle
centage of cells with aggregates (PCA), 2) average number of telo-
meres per cell (ANTC), 3) average number of aggregates per cell
(ANAC), and 4) average nuclear volume (ANV).
Nested factorial analysis of variance was used to analyze the
M/78 Caucasian
M/74 Caucasian
F/72 Caucasian
F/80 Caucasian
Age/Ethnicity
Demography
parameters above.
Cell line
Table 1. (continued )
Results
This study was designed to adequately characterize CTCs and poten-
Mela CHAN
10AA2408
10AA2621
10AA3836
10AA4280
tial subpopulations of CTCs in different cancer types using aberra-
Mela GAU
Mela ROB
Patient ID
Mela SAU
H2030
Lung CA
tions in the 3D architecture of telomeres due to telomere dysfunction
as a common biomarker of CIN and a potential surrogate of tumor
Translational Oncology Vol. 6, No. 1, 2013                                       Three-Dimensional Telomeric Analysis     Awe et al.     55

                                                                      aggressiveness. CTCs of prostate, colon, breast, melanoma, and nuclei
                                                                      of a cultured lung cancer cell line were analyzed and at least two
                                                                      distinguishable subpopulation patterns were seen in each patient
                                                                      sample in all of the tumor types (Figures 2 and 3).
                                                                         The telomeres of five different tumor types were analyzed using
                                                                      TeloView, which measures the number and size of telomeres and
                                                                      also identifies the presence of TAs [23,24]. Table 2 shows the differ-
                                                                      ent parameters computed by the TeloView program such as PCA,
                                                                      ANTC, ANAC, and ANV. With these data, the degree of telomere
                                                                      dysfunction can be assessed, thus giving insight into the level of CIN
                                                                      for each patient. The measurements offer the chance for earlier tumor
                                                                      detection and better cancer classification. Table 2 shows CTC nuclei
                                                                      of patient samples MB0189PR, MB0216PR, MB0222PR, COLON
                                                                      GUI3F, and BR MERT10AA5083PR and nuclei of H2030 lung cancer
                                                                      cell line with percentage of cells with TAs greater than 80%, patients
                                                                      MB0213PR, MB0217PR, COLON GUI5F, BR MIC10AA3956,
                                                                      BR WUR10AA2499, and BR MIC10AA3934 between 60% and
                                                                      80%, and the remaining MB0211PR, MB0181PR, MB0182PR,
                                                                      COLON GUI2F, Mela GOD10AA4991, Mela CAR10AA2213, Mela
                                                                      SAU 10AA2408, Mela ROB10AA2521, Mela GAU10AA3836, and
                                                                      Mela CHAN10AA4280 less than 60%. Other important parameters
                                                                      that vary among the samples are the ANTC and the ANAC. Both the
                                                                      ANTC and ANAC have corresponding variations among the samples
                                                                      (Table 2). These data obtained from TeloView can be used to predict
                                                                      the complexity of genomic instability of the tumors. The TeloView
                                                                      analysis of CTCs of these five cancer types was done without prior
                                                                      knowledge of the patients’ clinical data. The deductions and classifica-
                                                                      tions resulting from the TeloView analysis was then compared with the
                                                                      clinical data obtained (Table 1).

                                                                      Morphology of the Filter Captured CTC Nuclei
                                                                         The distinct 3D nuclear architecture of the CTCs was visualized
                                                                      through the DAPI filter before image acquisition. The captured
                                                                      CTCs were found either as solitary or clustered cells scattered around
                                                                      and sometimes slightly within the pores (Figure 1). In animals, the
                                                                      importance of CTC clusters and tumor-lymphocyte mixed clusters as
                                                                      prognostic factors in metastasis process has been mentioned [26,27].
                                                                      The CTCs are often irregularly shaped (Figures 1 and 2) and larger
                                                                      than other blood cells enabling their isolation due to their inability
                                                                      to pass through the filters’ pores (7.5 ± 0.36 μm) [6]; for example,
                                                                      the prostate cancer cell size ranges between 15 and 25 μm [28].
                                                                      Figure 1A shows hematoxylin and eosin (H&E)–stained prostate
                                                                      cancer CTCs (pointed out by arrows) captured by the filter device.
                                                                      These CTCs are clearly two and three times larger than the pores.
                                                                      The identities of the cells were confirmed by pathologic examination.
                                                                      CTCs sometimes display chromatin condensation, unlike most of
                                                                      the lymphocytes. Solitary lymphocytes mostly pass through the pores
                                                                      of the filter except in some instances where they are found in
                                                                      between pores. Lymphocytes sometimes also form lymphocyte-
                                                                      lymphocyte clusters or lymphocyte-CTC clusters that cannot go
                                                                      through the pores.
                                                                         At ×40 microscope magnification, the density of the CTCs present
                                                                      can be appreciated in each sample with the presence of varying
                                                                      number of clusters noted. Both the density of the CTCs captured
Figure 1. H&E-stained filters with isolated CTCs and CTC clusters
pointed out. (A and B) Filtered prostate and colon cancer CTCs sur-   from 3 ml of each sample and the frequency of the clusters observed
rounded by pores of the filters. The shapes and sizes of the CTCs     can give a preliminary insight to the status of the disease at the point
can be acknowledged. (C and E) Clustered breast CTCs and lung         when the sample was collected [29]. Figure 1, B–E, shows the isolation
cancer cell line captured by the filter. (D) Melanoma microemboli.    and preservation of CTC clusters in the filtered patients’ blood.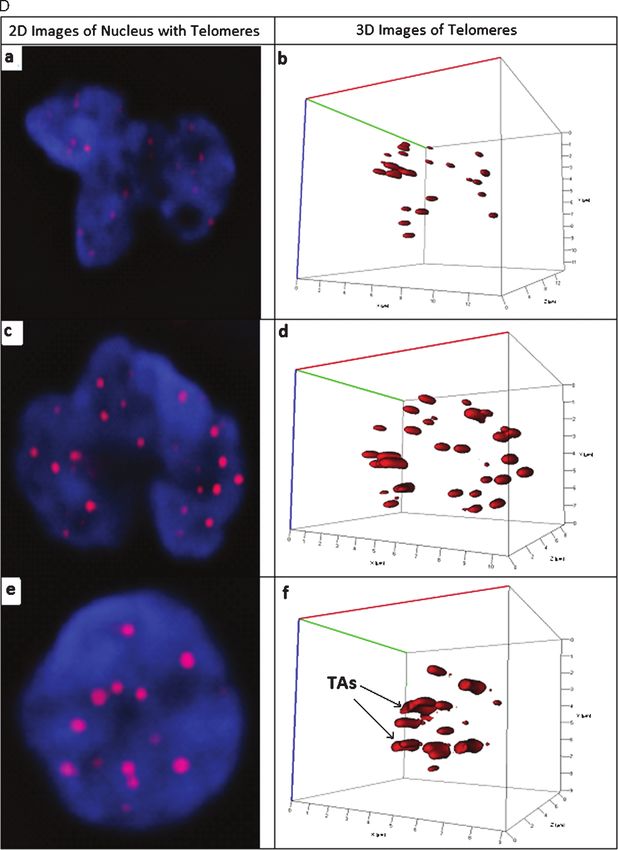
56      Three-Dimensional Telomeric Analysis     Awe et al.                                     Translational Oncology Vol. 6, No. 1, 2013

   At ×60 oil magnification, the varying sizes of the CTCs were            GUI3F (Figure 2B) with increasing numbers of telomeres seen along
observed with associated different chromatin condensation seen.            the classes of CTCs but a higher than normal number of telomeres ob-
Further analysis using TeloView measures the nuclear volume and            served in CTCs that belong to the high intensity subpopulation (Fig-
this distinguishes CTCs from captured clumped lymphocytes that             ure 2, Be and Bf ). This irregularly high number of telomeres seen is one
are smaller in size individually (Table 2). A switch to the Cy3 filter     of the features of cancer cells that result from CIN [17]. Figure 2C
shows the hybridized telomere signals with varying signal intensity        shows 2D and 3D images of cells representing subpopulations in a
and numbers that give the first suggestion of different subpopula-         breast cancer patient: BR MIC10AA3934, with low (Figure 2, Ca
tions within CTCs of the same patient’s filtered blood.                    and Cb), medium (Figure 2, Cc and Cd ), and high (Figure 2, Ce
                                                                           and Cf ) intensity telomere signals. Figure 2D shows subpopulations
                                                                           in a melanoma patient: Melanoma CAR10AA2213, which is similar
Telomere Numbers and TAs in CTCs                                           to subpopulations in breast cancer patient (BR MIC10AA3934)
   Cancer cells commonly exhibit an altered telomere number per            (Figure 2C ) except for the presence of more TAs (Figure 2Df ) in
cell nucleus with the telomeres often being shorter than those in nor-     the melanoma patient. The lung cancer subpopulations in cell line
mal cells. These alterations from the normal cell telomeres have been      H2030 are shown in Figure 2E. It was noted that this lung cancer cell
attributed to aneuploidy and genomic instability [18].                     line generally has high telomere numbers, but their telomere sizes vary.
   In this study, Cy3-stained telomeres were analyzed and their signal     The telomere size was used to group the CTCs into subpopulations
intensities evaluated by TeloView. The telomere signal intensity of a      (Figure 2E ).
CTC nucleus is dependent on the number of TAs present in that                 From the results shown in Figure 2, it is clear that different sub-
CTC. This can be projected for the whole sample by calculating             populations of CTCs are present in the same cancer patients and
the PCA and the ANAC (Table 2). The program also calculates                that these subpopulations can be identified by TeloView analysis.
the ANTC in each nucleus. The variation in ANTC in the same                In the same tumor type, the variations in telomere intensities in addi-
sample may be an indication of the presence of CTC subpopulation           tion to the presence and frequency of TAs may, in the future and
and level of tumor aggressiveness [17,21,22]. In Figures 2 to 3, dif-      with larger patient cohorts, permit the classification of cancer into
ferent subpopulations of CTCs in the same patient are shown. The           stages of progression and aggressiveness with the prospects of improving
subpopulations of CTCs are identified on the basis of the differences      cancer management.
in their telomere intensities, which can be due to varying number of
telomeres, size of telomeres, or presence/absence of TAs. TAs are
commonly seen in tumor cells [14,17] (Figure 2, Af, and Cf–Ef              Telomere Numbers versus Telomere Intensity
show prominent TAs) and their analyses has been shown to be useful         Measured in CTCs
in tumor characterization [12,17].                                            Our analysis tool, the TeloView program [23,24], plots a graph of
   Figure 2 shows representative 2D and 3D images of isolated              telomere length (signal intensity) on the x-axis against the number
CTCs. The figure represents different subpopulations of CTCs pres-         of telomeres on the y-axis. The signals with the same intensity fall
ent in the same prostate cancer patient (MB0181PR). In Figure 2,           on the same spot on the graph and this gives a picture of the distri-
the nuclear DNA is stained with DAPI (blue) and telomeres (red),           bution of CTC subpopulations within each patient’s filtered blood.
which are within the nuclei, are Cy3 stained. Images in Figure 2, Aa       For normal cells, this plot usually has a single peak, which ranges
and Ab, are of a cell that represents the subpopulation with low telo-     between 40 and 60 telomeres per nucleus on the y-axis [13]. A direct
mere intensity in this prostate cancer patient evident by the scanty       comparison of prostate cancer CTCs and lymphocytes from the same
number of signals observed. The two other CTC subpopulations               patient (MB0239PR) is shown in Figure W1. Not only are the
represented in the same prostate cancer patient are the medium             numbers of telomeres detected different between CTCs and lympho-
(Figure 2, Ac and Ad ) and high (Figure 2, Ae and Af ) telomere inten-     cytes of the same patient but also did we measure a size difference
sity CTCs. A similar classification is shown in the colon cancer patient   between the two cell types with average sizes of CTC nuclei being

Figure 2. (A) 2D (Aa, Ac, and Ae) and 3D (Ab, Ad, and Af) images of sample MB0181PR prostate cancer CTCs. At least three different
subpopulations of CTCs were identified and depicted in this patient. Images Aa and Bb show cells with scanty telomeres in contrast to
Ac and Ad, which represent population of CTCs with higher telomere intensity. In images Ae and Af, the cells show the presence of TAs,
thus signal intensities are even higher than seen in Ac and Ad. (B) 2D and 3D representations of different subpopulations in colon cancer
patient sample GUI3F. In the 2D images (Ba, Bc, and Be) the telomere signals are represented by the red dots and the corresponding
signals of all image stacks are shown in the 3D images beside them. There is a graduated increase in signal intensity along the CTC
subpopulations shown in Bb, Bd, and Be, respectively. Image Bb represents the low extreme, whereas image Be shows an extremely
high number of signals with a shorter than normal telomeres, a feature of advanced cancer stage. (C) Representations of three different
subpopulations of CTCs in the same breast cancer patient (Br 3934 MIC) are shown in both 2D and 3D images. The signal intensity
increases from Ca and Cb to Cc and Cd with increased numbers of telomeres. Subpopulation of cells with high number of TAs is rep-
resented by image Cf. (D) 2D and 3D images of melanoma CTCs showing different subpopulations. The nuclear architecture is outlined
in blue by DAPI in the 2D images. Images Da and Db have fewer telomeres; more signals are present in subpopulation represented by
image Dd with few TA formation. The last subpopulation represented here by image Df has many TAs giving it a high signal intensity.
(E) Representative images of lung cancer cell line, which were found to be generally larger than the other tumors examined. All the
subpopulations found in the H2030 lung cancer examined had more than normal number of telomeres. The different subpopulations
are identified using the difference in signal intensities in the nuclei with the low signals represented by images Ea and Eb, medium
intensity by Ec and Ed, and high intensity subpopulation as images Ee and Ef.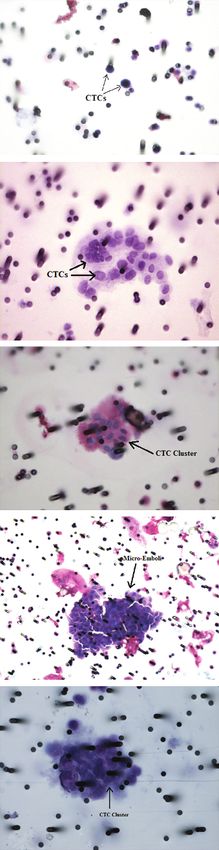
Translational Oncology Vol. 6, No. 1, 2013 Three-Dimensional Telomeric Analysis Awe et al. 57
58      Three-Dimensional Telomeric Analysis   Awe et al.   Translational Oncology Vol. 6, No. 1, 2013

Figure 2. (continued).
Translational Oncology Vol. 6, No. 1, 2013   Three-Dimensional Telomeric Analysis   Awe et al.   59

Figure 2. (continued).
60      Three-Dimensional Telomeric Analysis   Awe et al.   Translational Oncology Vol. 6, No. 1, 2013

Figure 2. (continued).
Translational Oncology Vol. 6, No. 1, 2013   Three-Dimensional Telomeric Analysis   Awe et al.   61

Figure 2. (continued).
62      Three-Dimensional Telomeric Analysis   Awe et al.                                   Translational Oncology Vol. 6, No. 1, 2013

more than three-fold larger than those of the lymphocytes of the        numbers against their intensities. Many deviations from the 3D telo-
same patient, captured on the same filter (Figure W1).                  mere profiles of normal cells [12,13,23] (Figure W1) were observed;
   CTCs of all patients give 3D telomeric profiles with either a very   the striking regular finding in the graphs from these CTCs is the
high number or very low number of telomeres (Figure 3, A–E ). Fig-      presence of multiple peaks, which represent different subpopulations
ure 3 shows plots of the different representative CTCs’ telomere        in the samples. The plots revealed the different subpopulations of

Figure 3. Telomere numbers against telomere intensities for the five different tumor types (A–E). The uniqueness of the tumor types is
depicted in these plots and the multiple peaks indicate the different subpopulations of telomeres present in the same patient blood
sample. Note that the scales of the graphs are not the same; they were adjusted to give a clear presentation of the subpopulations
observed in each patient sample.
Translational Oncology Vol. 6, No. 1, 2013                                                                   Three-Dimensional Telomeric Analysis             Awe et al.      63

Table 2. Summary of Data Obtained from 22 CTC Samples of Five Different Cancer Types Analyzed and the Calculated Parameters Used in Characterization of the CTCs.

CTC Sample                            Percentage of Telomere Intensity                        PCA            ANTC             ANAC              ANV (μm3)           Average Nuclear
                                      Subpopulations in the Same Patient                                                                                            Diameter (μm)

                                      Low               Medium              High

MB0181PR                               83.39            14.84                1.77              46.66           9.43            0.5               235.50              7.66
MB0182PR                               94.58             0                   5.42              37.04           8.88            0.48              294.54              8.25
MB0189PR                               38.16            58.74                3.1               82.35          28.44            2.18             1443.89             14.02
MB0211PR                               33.61            63.92                2.47              53.33          16.17            0.93             1154.02             13.01
MB0213PR                               52.06            45.27                2.67              63.33          16.2             1.267            1062.18             12.66
MB0216PR                               71.45            23.36                5.19              86.66          21.83            1.8              1032.66             12.54
MB0217PR                               46.94            48.98                3.67              66.66          16.33            1.3               702.76             11.03
MB0222PR                               32.17            65.22                2.61              86.66          23               2.367             657.97             10.79
MB0239PR                              100                0                   0                 80             36.4             3.4               211.47              7.39
Colon GUI 2F                           58.16            38.27                3.57              26.66           6.53            0.26              212.04              7.40
Colon GUI 3F                           54.34            36.82                6.99              83.33          35.3             3.7               633.79             10.66
Colon GUI 5F                           64.42            33.85                1.73              66.66          17.33            1.33              485.32              9.75
BR MERT 10AA5083                       34.87            58.9                 6.23              83.33          22.5             2.03              480.24              9.72
BR MIC 10AA3956                        77.36            20.22                2.42              70             24.73            1.73              469.73              9.64
BR WUR 10AA 2499                       54.98            39.58                2.44              75             19.19            1.66              413.92              9.25
BR MIC 10AA3934                        35.38            62.01                2.61              73.33          17.9             1.66              564.07             10.25
Mela GOD 10AA4991                      57.82            12.24               29.93              33.33           9.93            0.66              224.98              7.55
Mela CAR 10AA2213                      85.52            37.17                3.36              36.66          13.9             0.46              292.49              8.24
Mela SAU 10AA2408                      73.1             24.83                2.07              53.33           9.66            0.76              374.48              8.94
Mela ROB 10AA2521                      76.64            21.77                1.13              63.33          14.7             1.1               866.57             11.83
Mela GAU 10AA3836                      68.58            29.67                1.75              70             13.36            1.1               420.05              9.29
Mela CHAN 10AA4280                     79.31            13.79                6.89              73.33          12.57            1.1               398.80              9.13
Lung CA Cell Line H2030                66.32            32.22                1.46             100            104.057          12.81             1893.97             15.35

PR, prostate cancer; Colon, colon cancer; Br, breast cancer; Mela, melanoma; Lung CA, lung cancer.

CTCs in the same patient shown by the red line demarcations in the                               and Ef ). The peculiarities seen in telomeres of different tumor types
graphs. The subpopulations can be identified according to their signal                           are also exhibited in the plots of their telomere numbers against telo-
intensities, i.e., low, medium, and high intensities (Figure 3, A–E ).                           mere intensities (Figure 3, A–E ). The architectural alterations seen in
Figure 3A is a plot of a prostate patient’s signal intensity against num-                        the telomeres seem to be specific to each cancer type.
ber of telomeres, the telomere numbers peak at 18 (below the normal
range [12,13,23]), and there are three populations identified by red
line demarcations on the plot, i.e., low, medium, and high intensity                             Frequencies of CTC Subpopulations
groups (Figure 3, A–E ). The plot for GUI3F (Colon CA) in                                           Three milliliters of blood per patient captures CTCs present in
Figure 3B is a sharp contrast to Figure 3A with telomere numbers                                 this volume of blood and allows for the detection of those CTCs that
having a peak at 110 (Figure 3B ). This disparity in different cancer                            are present in that sample. Duplicate and triplicate samples taken at
types should be studied further with larger cohorts of the same cancer                           the same time and from the same patient will result in the isolation of
type. Although the plot for BR MIC10AA3934 (Figure 3C ) has a                                    varying numbers of CTCs due to their rare presence per milliliter
telomere number peak of 45, it has multiple peaks that signify the                               blood. This will also impact on the frequencies of individual sub-
different subpopulations present in the same patient (Figure 3C ).                               populations detected. We can therefore only conclude that CTC sub-
The zigzag nature of the plot for melanoma gives it a peculiar pattern                           populations are present, but the frequency of each population may vary
(Figure 3D); it also has its highest telomere number peak at 19 (below                           in small sample volumes. Two examples are provided here to illustrate
the normal range). Three distinct subpopulations of telomere inten-                              this point. Patient GUI with colon cancer had three 3-ml blood
sities can be identified in this plot (Figure 3D). The plot for lung                             samples examined (2F, 3F, and 5F) and their 3D nuclear architecture
cancer cell line depicts its high telomere number with a peak of telo-                           analyzed. 2F, 3F, and 5F have telomeres with low intensity at 58.16%,
mere numbers at 290, most of which are short telomeres as earlier                                54.34%, and 64.42%, respectively; medium intensity telomeres were
shown in 3D images (Figure 2D, images b and d ).                                                 found at 38.27%, 36.82%, and 33.85%, respectively, and high inten-
                                                                                                 sity telomeres had frequencies of 3.57%, 6.99%, and 1.73%, respec-
                                                                                                 tively (Table 2). This is a fairly consistent representation of the telomere
Uniqueness of Telomere Structural Changes in Cancer Types                                        intensity subpopulations in three different samples of the patient GUI.
   When analyzing five different cancer types, it was observed that                                 A different example is represented by the breast cancer patient
there might be a characteristic feature in the 3D telomere architec-                             MIC. Two different samples (10AA3956 and 10AA3934) were
tural changes seen in each of these cancer types. Although they all                              obtained at the same time from the patient, and the 3D nuclear
exhibit the presence of subpopulations of CTCs in the same patient                               analysis of the CTCs revealed the presence of three different telomere
sample, the telomeres of these cancer cells may tend to have similar                             subpopulations. 10AA3956 and 10AA3934 had percentages of
features in each tumor type. The prostate, melanoma, and breast can-                             telomeres with low intensity of 77.36 and 35.38, medium intensity
cer CTCs may tend to form high numbers of TAs (Figure 2, Af, Df,                                 of 20.22 and 62.01, and then high intensity of 2.42 and 2.61, respec-
and Cf ). The colon cancer CTCs and lung cancer cell line may tend                               tively (Table 2). The frequency of each population is more variable
to have significantly increased numbers of telomeres (Figure 2, Bf                               (except in the high telomere intensity group) than it was in patient
64 Three-Dimensional Telomeric Analysis Awe et al. Translational Oncology Vol. 6, No. 1, 2013
GUI. Therefore, the average of multiple samples obtained at the The ScreenCell device we used here makes the analysis of the
same time will only provide confirmation of the presence of distinct entire population of CTCs in a patient’s blood sample possible by
CTC subpopulations in a patient but will not give an absolute dis- its non–antigen-specific filter isolation technique [6]. With an iso-
tribution frequency. lation of the entire population of CTCs dispersed from a solid tumor,
we are equipped with a better representation of the tumor than biopsy
Discussion or dissection can offer. The combination of isolation of CTCs by the
Our study showed that CTCs isolated from patients with different ScreenCell device and analysis of 3D architecture of telomeres by Telo-
cancers including breast, prostate, melanoma, and colon exhibit View permits the identification and characterization of the different
unique 3D telomeric profiles. We observe distinct subpopulation constituent subpopulations of CTCs in the same patient. This combi-
in each CTC/tumor type, based on quantitative analysis of 3D nation of techniques has the potential of providing a suitable surrogate
nuclear telomeric images using TeloView [23]. Our study is a biomarker for efficient assessment of different types of tumors as dem-
proof-of-principle analysis that illustrates the feasibility of 3D quan- onstrated with the hope that this will, in the future, translate into
titative fluorescence in situ hybridization analysis of CTCs isolated improved prognostication abilities and therapeutic planning for differ-
using a filtration device and the subsequent quantitative analysis of ent tumor types.
3D telomeric profiles of CTCs leading to the identification of unique In addition, the presence and frequency of circulating tumor micro-
subgroups of CTCs. emboli in circulation as shown in Figure 1, B–E, H&E-stained filtered
This analysis gives a snapshot of the molecular makeup of a melanoma blood, can be estimated using the combination of CTC iso-
patient’s tumor cells at a specific point of assessment. It is known lation by filtration and 3D analysis of CTCs. These circulating tumor
that cancer evolves [30]; therefore, profiling of CTCs using their microemboli can lead to clogging of small blood vessels, thus causing
telomeres as a potential future biomarker may permit the assessment anemia in the region supplied by the affected vessels [36]. This can
of CIN at specific time points of their evolution and natural history result in increased morbidity and could be included as a prognosticator
[22]. The 3D profiles of the CTCs of each type of cancer appear that could enhance the classification and management of cancer patients.
tumor type–specific. To validate the accuracy of telomeric classifica- Filtration and 3D analysis of CTCs from cancer patients may lead
tion of cancer progression, a larger cohort of patients with the same to early detection of abnormal cells in circulation and this detection
cancer type of varying clinical stages and pathologic grades will need will be followed by extensive diagnostic tests to achieve a possible
to be analyzed and validated according to clinical parameters and lifesaving early diagnosis. Furthermore, response to cancer manage-
treatment outcome. ment may be monitored using changes in 3D telomeric profiles of
As previously shown, the 3D telomeric organization is altered CTCs and drugs can be designed to target-specific subpopulation(s)
within the nucleus of cancer cells. 3D nuclear architecture of telo- of CTCs that may have been identified to be resistant to an earlier
meres has been used to assess and profile many cancer types, includ- therapy regimen. In conclusion, our study demonstrates that it is
ing our recent work in the profiling of myelodysplastic syndromes feasible to isolate and characterize different subpopulations of CTCs
and acute myeloid leukemias into subgroups using their 3D telomeric in cancer patients by analyzing their 3D telomeric architectures after
architecture [22]. Other tumors that display alterations in their 3D ScreenCell filter isolation.
telomeric architecture have been studied, including plasmacytoma
[15], cervical cancer [17,19], Burkitt lymphoma [12], head and neck
cancer [12], Hodgkin’s lymphoma [20], and glioblastoma [21]. The
Acknowledgments
use of telomeric profiling technique on CTCs of cancer patients over
The authors thank the patients who contributed blood samples to
time may help the understanding of cancer evolution/progression
this study. Samples from France were provided by Marie-Françoise
and eventually lead to improvements in cancer management.
Avril and Françoise Boitier (Service de Dermatologie, Hôpital Cochin,
The importance of CTCs as possible biomarkers for the analysis of
Université-Paris 5, Paris, France) and Alain Pigné and Patrice Langlois
tumors has been acknowledged, and this explains the many methods
(Unité Chirurgicale, Clinique Geoffroy Saint-Hilaire, Paris, France).
that have been attempted to isolate CTCs in the past. One recent
technique is an assay using an anti–epithelial cell adhesion molecule
(anti-EpCAM) antibody to capture CTCs expressing this antigen on
their surfaces with the CellSearch System [31]. The CTCs must have References
>2000 EpCAM molecules on their surfaces for them to be captured [1] Beitsch PD and Clifford E (2000). Detection of carcinoma cells in the blood of
breast cancer patients. Am J Surg 180, 446–449.
[31]. This method lacks efficiency because of tumor cell hetero- [2] Fehm T, Sagalowsky A, Clifford E, Beitsch P, Saboorian H, Euhus D, Meng S,
geneity, low EpCAM expression levels on some CTCs, or EpCAM- Morrison L, Tucker T, Lane N, et al. (2002). Cytogenetic evidence that circu-
deficient CTCs like melanoma CTCs. In addition, because the lating epithelial cells in patients with carcinoma are malignant. Clin Cancer Res
EpCAM expression levels may change as cells become CTCs, many 8, 2073–2084.
CTCs will not be captured because they do not express the “adequate” [3] Nakagawa T, Martinez SR, Goto Y, Koyanagi K, Kitago M, Shingai T, Elashoff
DA, Ye X, Singer FR, Giuliano AE, et al. (2007). Detection of circulating tumor
amount of EpCAM [31,32]. cells in early-stage breast cancer metastasis to axillary lymph nodes. Clin Cancer
Because of the extremely low number of CTCs [33], reverse Res 13, 4105.
transcription–polymerase chain reaction–based assays have been [4] Stott SL, Lee RJ, Nagrath S, Yu M, Miyamoto DT, Ulkus L, Inserra EJ, Ulman
previously used to isolate CTCs. The major pitfalls of this method M, Springer S, Nakamura Z, et al. (2010). Isolation and characterization of cir-
of CTC isolation were the destruction of the cells’ integrity during culating tumor cells from patients with localized and metastatic prostate cancer.
Sci Transl Med 25, 25ra23.
RNA extraction and also the ineffectiveness of reverse transcription– [5] Gross HJ, Verwer B, Houck D, Hoffman RA, and Recktenwald D (1995).
polymerasechain reaction to distinguish between circulating tumor Model study detecting breast cancer cells in peripheral blood mononuclear cells
and nontumor cells [34,35]. at frequencies as low as 10−7. Proc Natl Acad Sci USA 92, 537–541.Translational Oncology Vol. 6, No. 1, 2013 Three-Dimensional Telomeric Analysis Awe et al. 65
[6] Desitter I, Guerrouahen BS, Benali-Furet N, Wechsler J, Jänne PA, Kuang Y, [21] Gadji M, Fortin D, Tsanaclis AM, Garini Y, Katzir N, Wienburg Y, Yan J,
Yanagita M, Wang L, Berkowitz JA, Distel RJ, et al. (2011). A new device for Klewes L, Klonisch T, Drouin R, et al. (2010). Three-dimensional nuclear telo-
rapid isolation by size and characterization of rare circulating tumor cells. Anti- mere architecture is associated with differential time to progression and overall
cancer Res 31, 427–441. survival in glioblastoma patients. Neoplasia 12, 183–191.
[7] Klein CA, Blankenstein TJ, Schmidt-Kittler O, Petronio M, Polzer B, Stoecklein [22] Gadji M, Awe JA, Rodriguez P, Klewes L, Kumar R, Houston DS, Falcao RP,
NH, and Riethmüller G (2002). Genetic heterogeneity of single disseminated de Oliveira FM, and Mai S (2012). Three-dimensional nuclear telomeric archi-
tumour cells in minimal residual cancer. Lancet 360, 683–689. tecture defines cytopenias of myelodysplastic syndrome and its transformation
[8] Danila DC, Fleisher M, and Scher HI (2011). Circulating tumor cells as bio- to acute myeloid leukemia. Clin Cancer Res 18, 3293.
markers in prostate cancer. Clin Cancer Res 17, 3903–3912. [23] Vermolen BJ, Garini Y, Mai S, Mougey V, Fest T, Chuang TC, Chuang AY,
[9] Moyzis RK, Buckingham JM, Cram LS, Dani M, Deaven LL, Jones MD, Wark L, and Young IT (2005). Characterizing the three-dimensional organiza-
Meyne J, Ratliff RL, and Wu J-R (1988). A highly conserved repetitive DNA tion of telomeres. Cytometry A 67, 144–150.
sequence, (TTAGGG)n, present at the telomeres of human chromosomes. Proc [24] Knecht H and Mai S (2011). 3D imaging of telomeres and nuclear architecture:
Natl Acad Sci USA 85, 6622–6626. an emerging tool of 3D nano-morphology-based diagnosis. J Cell Physiol 226,
[10] Blackburn EH (2000). The end of the (DNA) line. Nat Struct Biol 7, 847–850. 859–867.
[11] DePinho RA and Polyak K (2004). Cancer chromosomes in crisis. Nat Genet [25] Schaefer LH, Schuster D, and Herz H (2001). Generalized approach for accel-
36, 932–934. erated maximum likelihood based image restoration applied to three-dimensional
[12] Chuang TC, Moshir S, Garini Y, Chuang AY, Young IT, Vermolen B, fluorescence microscopy. J Microsc 204, 99–107.
van den Doel R, Mougey V, Perrin M, Braun M, et al. (2004). The three- [26] Molnar B, Floro L, Sipos F, Toth B, Sreter L, and Tulassay Z (2001). Circu-
dimensional organization of telomeres in the nucleus of mammalian cells. lating tumor cell clusters in the peripheral blood of colorectal cancer patients.
BMC Biol 2, 12. Clin Cancer Res 7, 4080.
[13] De Vos WH, Hoebe RA, Joss GH, Haffmans W, Baatout S, Van Oostveldt P, [27] Glaves D (1984). Correlation between circulating tumor cancer cells and inci-
and Manders EM (2009). Controlled light exposure microscopy reveals dence of metastases. Br J Cancer 50, 159–166.
dynamic telomere microterritories throughout the cell cycle. Cytometry A 75A, [28] Zheng S, Lin H, Liu JQ, Balic M, Datar R, Cote RJ, and Tai YC
428–439. (2007). Membrane microfilter device for selective capture, electrolysis and
[14] Mai S and Garini Y (2005). Oncogenic remodeling of the three-dimensional genomic analysis of human circulating tumor cells. J Chromatogr A 1162,
organization of the interphase nucleus: c-Myc induces telomeric aggregates whose 154–161.
formation precedes chromosomal rearrangements. Cell Cycle 4, 1327–1331. [29] Budd GT, Cristofanilli M, Ellis MJ, Stopeck A, Borden E, Miller MC, Matera
[15] Louis SF, Vermolen BJ, Garini Y, Young IT, Guffei A, Lichtensztejn Z, Kuttler J, Repollet M, Doyle GV, Terstappen LWMM, et al. (2006). Circulating tumor
F, Chuang TC, Moshir S, Mougey V, et al. (2005). c-Myc induces chromosomal cells versus imaging—predicting overall survival in metastatic breast cancer. Clin
rearrangements through telomere and chromosome remodeling in the interphase Cancer Res 12, 6403.
nucleus. Proc Natl Acad Sci USA 102, 9613–9618. [30] Weinberg RA (2006). The Biology of Cancer. Garland Science, New York, NY.
[16] Saito T, Hama S, Izumi H, Yamasaki F, Kajiwara Y, Matsuura S, Morishima K, [31] Coumans FAW, Doggen CJ, Attard G, de Bono JS, and Terstappen LW
Hidaka T, Shrestha P, Sugiyama K, et al. (2008). Centrosome amplification (2010). All circulating EpCAM+CK+CD45− objects predict overall survival in
induced by survivin suppression enhances both chromosome instability and castration-resistant prostate cancer. Ann Oncol 21, 1851–1857.
radiosensitivity in glioma cells. Br J Cancer 98, 345–355. [32] Schwarzenbach H, Hoon DS, and Pantel K (2011). Cell-free nucleic acids as
[17] Mai S and Garini Y (2006). The significance of telomeric aggregates in the biomarkers in cancer patients. Nat Rev Cancer 11, 426–437.
interphase nuclei of tumor cells. J Cell Biochem 97, 904–915. [33] Pelkey T, Frierson HJ, and Bruns D (1996). Molecular and immunological
[18] Meeker AK, Hicks JL, Iacobuzio-Donahue CA, Montgomery EA, Westra WH, detection of circulating tumor cells and micrometastases from solid tumors. Clin
Chan TY, Ronnett BM, and De Marzo AM (2004). Telomere length abnor- Chem 42, 1369–1381.
malities occur early in the initiation of epithelial carcinogenesis. Clin Cancer Res [34] Louha M, Nicolet J, Zylberberg H, Sabile A, Vons C, Vona G, Poussin K,
10, 3317–3326. Tournebize M, Capron F, Pol S, et al. (1999). Liver resection and needle liver
[19] Guijon FB, Greulich-Bode K, Paraskevas M, Baker P, and Mai S (2007). Pre- biopsy cause hematogenous dissemination of liver cells. Hepatology 29, 879–882.
malignant cervical lesions are characterized by dihydrofolate reductase gene [35] Cama C, Olsson C, Buttyan R, De Vries G, Wise G, and Katz A (1997).
amplification and c-Myc overexpression: possible biomarkers. J Low Genit Tract Molecular staging of prostate cancer. III. Effects of cystoscopy and needle biopsy
Dis 11, 265–272. on the enhanced reverse transcriptase polymerase chain reaction assay. J Urol 157,
[20] Knecht H, Sawan B, Lichtensztejn D, Lemieux B, Wellinger RJ, and Mai S 1748–1751.
(2009). The 3D nuclear organization of telomeres marks the transition from [36] Kane RD, Hawkins HK, Miller JA, and Noce PS (1975). Microscopic pulmo-
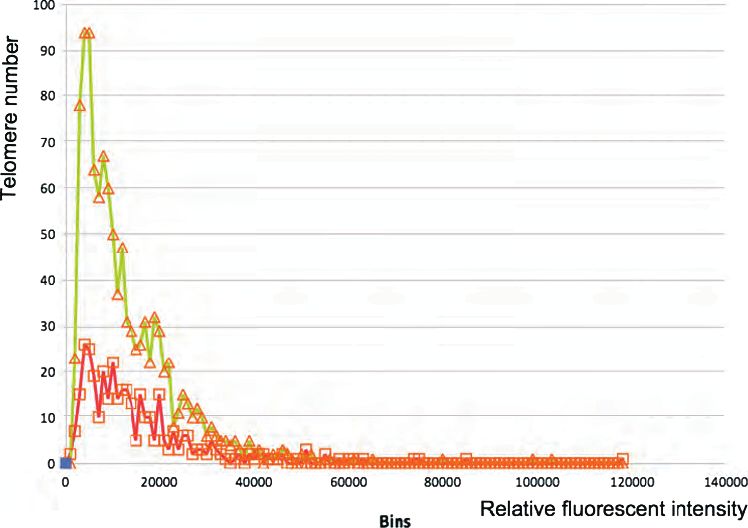
Hodgkin to Reed-Sternberg cells. Leukemia 23, 565–573. nary tumor emboli associated with dyspnea. Cancer 36, 1473–1482.Figure W1. Comparison of 3D nuclear telomere profiles of CTCs isolated from prostate cancer patient MB0239PR with lymphocytes from the same patient captured on the same filter. Green, 3D nuclear telomere profile of CTCs from the patient. Red, 3D nuclear profile of lymphocytes from the same patient. The average 3D volume of lymphocytes is 211.47 μm3 and the nuclear diameter is 7.39 μm. The ANV of CTCs of this patient is 665.99 μm3 and the average nuclear diameter is 10.78 μm. The ANV of lymphocytes is 3.15 times smaller than that of average CTC in this same patient. Note that due to filtration, 10% less telomeric signals are detectable in 3D nuclei in normal lymphocytes than have been reported by us and others [12,13,23].
You can also read