Synergistic melanoma cell death mediated by inhibition of both MCL1 and BCL2 in high-risk tumors driven by NF1/PTEN loss - Nature
←
→
Page content transcription
If your browser does not render page correctly, please read the page content below
www.nature.com/onc                                                                                                                                       Oncogene

ARTICLE                 OPEN

Synergistic melanoma cell death mediated by inhibition
of both MCL1 and BCL2 in high-risk tumors driven by
NF1/PTEN loss
              ✉
Shuning He 1 , Mark W. Zimmerman 1, Hillary M. Layden 1, Alla Berezovskaya1, Julia Etchin1, Megan W. Martel1, Grace Thurston1,
Chang-Bin Jing , Ellen van Rooijen2, Charles K. Kaufman2, Scott J. Rodig3, Leonard I. Zon 2, E. Elizabeth Patton4,
              1
                      ✉                          ✉
Marc R. Mansour 1,5 and A. Thomas Look 1

© The Author(s) 2021

   Melanomas driven by loss of the NF1 tumor suppressor have a high risk of treatment failure and effective therapies have not been
   developed. Here we show that loss-of-function mutations of nf1 and pten result in aggressive melanomas in zebrafish, representing
   the first animal model of NF1-mutant melanomas harboring PTEN loss. MEK or PI3K inhibitors show little activity when given alone
   due to cross-talk between the pathways, and high toxicity when given together. The mTOR inhibitors, sirolimus, everolimus, and
   temsirolimus, were the most active single agents tested, potently induced tumor-suppressive autophagy, but not apoptosis.
   Because addition of the BCL2 inhibitor venetoclax resulted in compensatory upregulation of MCL1, we established a three-drug
   combination composed of sirolimus, venetoclax, and the MCL1 inhibitor S63845. This well-tolerated drug combination potently and
   synergistically induces apoptosis in both zebrafish and human NF1/PTEN-deficient melanoma cells, providing preclinical evidence
   justifying an early-stage clinical trial in patients with NF1/PTEN-deficient melanoma.

   Oncogene (2021) 40:5718–5729; https://doi.org/10.1038/s41388-021-01926-y

INTRODUCTION                                                                             NF1-mutant melanomas. It is unlikely that the FDA-approved
Cutaneous melanoma accounts for the vast majority of skin                                BRAF-mutant-specific inhibitors will be beneficial against BRAF-
cancer-related deaths. More than 100,000 newly diagnosed cases                           wild-type, NF1-mutant melanomas. Moreover, analysis of multiple
of melanoma are projected in the United States for 2020 together                         clinical trials indicate that the NF1-mutant subtype has the worst
with ∼6800 melanoma-related deaths [1]. The Cancer Genome                                outcome among all metastatic melanomas [8]. Clearly, a better
Atlas (TCGA) classified cutaneous melanomas into four molecular                           understanding of the molecular pathogenesis of NF1-mutant
subtypes: BRAF-mutant (47.5%), RAS-mutant (29%), NF1-mutant                              melanomas is needed to improve the design and hence the
(9%), and triple-wild type (14.5%) [2]. The NF1-mutant category                          outcome of treatments for this subtype of melanoma.
refers to cases lacking either BRAF or RAS mutations, whereas NF1                           A major impediment to the development of targeted therapies
mutations can also arise as a mechanism of resistance to RAF/                            for patients with NF1-mutant melanomas has been the lack of
MEK-targeted therapies in BRAF-mutated melanoma [3, 4]. Thus,                            suitable animal models. For example, both the BRAF-mutant and
NF1 mutations have been reported in 13–17% of cutaneous                                  RAS-mutant subtypes of melanoma have been successfully
melanomas overall [2, 5, 6].                                                             modeled in mice [9] and zebrafish [10] by combining the
   The NF1 gene encodes neurofibromin, a 2818-amino-acid                                  melanoma-associated mutations in these genes with mutation
protein whose GTPase-activating protein-related domain nega-                             or loss of p53 or Cdkn2a, which are both typically inactivated in
tively regulates RAS signaling by catalyzing the hydrolysis of RAS-                      human melanoma [2, 11]. However, Nf1-loss was not sufficient to
GTP into RAS-GDP. Thus, one consequence of NF1-loss is the                               induce melanoma tumorigenesis in mice [3, 12] or zebrafish [13],
aberrant activation of RAS signaling [7]. In primary melanoma                            either alone or in combination with p53 loss. As the NF1-mutant
patient biopsies, NF1 mutations were not correlated with hot-spot                        melanomas often harbor a high mutation load [14, 15], we
BRAF mutations, a finding consistent with a redundant role for                            reasoned that genetic or epigenetic alterations affecting genes
these two types of mutations in activating RAS-MAPK signaling.                           other than p53 and Cdkn2a are likely required in combination with
   Recent efforts to develop improved targeted therapies for                             NF1-loss to initiate melanoma transformation in vivo. Because a
melanoma have mainly focused on the BRAF-mutant subtype,                                 significant subset of human NF1-mutant melanomas harbor
leaving a paucity of treatment options for patients with                                 genetic alterations leading to activation of the PI3K-AKT-mTOR

1
 Department of Pediatric Oncology, Dana-Farber Cancer Institute, Harvard Medical School, Boston, MA, USA. 2Stem Cell Program and Division of Hematology/Oncology,
Children’s Hospital Boston, Howard Hughes Medical Institute, Boston, MA, USA. 3Department of Pathology, Brigham and Women’s Hospital, Boston, MA, USA. 4MRC Human
Genetics Unit, MRC Institute of Genetics and Molecular Medicine, University of Edinburgh, Edinburgh, UK. 5Department of Hematology, UCL Cancer Institute, University College
London, London, UK. ✉email: shuning_he@dfci.harvard.edu; m.mansour@ucl.ac.uk; Thomas_Look@dfci.harvard.edu

Received: 1 July 2020 Revised: 10 June 2021 Accepted: 24 June 2021
Published online: 30 July 2021
S. He et al.
                                                                                                                                                                5719
                  pathway [2, 5], we hypothesized that targeting this pathway            eight tumors revealed only wild-type alleles of these two genes in
                  through inactivation of ptena/ptenb would drive melanomagen-           each tumor (Supplementary Fig. S5). Hence, similar to the NF1-
                  esis in nf1/p53-mutant zebrafish.                                       mutant class of human cutaneous melanomas [2], the loss of nf1 is
                                                                                         sufficient to provide RAS pathway activation, and zebrafish
                                                                                         melanomas in this background do not contain braf/nras hot-
                  RESULTS                                                                spot mutations.
                  Loss-of-function mutations of nf1 and pten cooperate to drive
                  melanomagenesis in p53-deficient zebrafish                               nf1/pten-mutant melanomas exhibit aberrant activation of the
                  We previously reported the development of nf1a+/−;nf1b−/−              RAS and PI3K pathways and are highly proliferative
                  zebrafish lines with the loss of three of the four functional alleles   Since NF1 and PTEN are well-established negative regulators of
                  of nf1 [13]. These animals develop spontaneous malignant               RAS and PI3K signaling [7, 22], respectively, we postulated that the
                  peripheral nerve sheath tumors (MPNSTs) with low penetrance,           nf1/pten-mutant melanomas would exhibit activation of effector
                  but not melanomas, beginning at the age of 1.5 years, indicating       pathways downstream of RAS and PI3K. Indeed, we detected high
                  that nf1-loss alone is not sufficient to drive melanomagenesis          levels of phosphorylated ERK (pERK), phosphorylated AKT (pAKT),
                  (Supplementary Fig. S1). When we bred the nf1a+/−;nf1b−/− line         and phosphorylated S6 ribosomal protein (pS6, an mTOR down-
                  into a p53-deficient (p53M214K/M214K) background, the compound          stream effector) by immunohistochemistry (IHC) in the nf1/pten-
                  mutant fish developed MPNSTs or high-grade gliomas [13].                mutant melanomas (Fig. 1f), indicating hyperactivation of both
                  Although rare spontaneous melanomas were also detected, they           RAS and PI3K pathways. Because these pathways drive prolifera-
                  had a very low penetrance (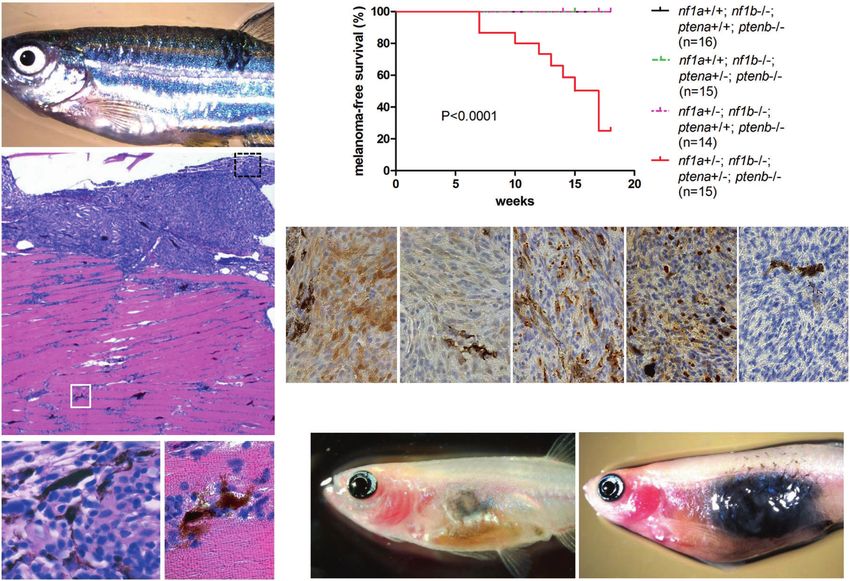
S. He et al.
5720

       Fig. 1 nf1a+/−;nf1b−/−;ptena+/−;ptenb−/−;p53M214K/M214K zebrafish spontaneously develop melanomas with rapid growth. a Representa-
       tive 16-week-old nf1a+/−;nf1b−/−;ptena+/−;ptenb−/−;p53M214K/M214K zebrafish with one spontaneous melanoma (indicated by arrow).
       b Hematoxylin and eosin (H&E) staining of the melanoma tumor shown in panel a (×5 magnification, scale bar = 200 μm). c Melanoma
       tumor cells from the black box in (b), magnified ×100. d Melanoma tumor cells that have invaded into the dorsal muscle from the white box in
       (b), magnified ×100. e Cumulative frequency of spontaneous melanomas arising in zebrafish with the indicated genotypes (generated by the
       inbreeding of the nf1a+/−;nf1b−/−;ptena+/−;ptenb−/−;p53M214K/M214K line, p < 0.0001, log-rank test). f Immunohistochemical analysis of
       melanoma tumor sections using antibodies to detect phosphorylated ERK1/2 (pERK), phosphorylated AKT (pAKT), phosphorylated S6 (pS6),
       proliferating cell nuclear antigen (PCNA) and cleaved caspase 3 (CC3) (×63 magnification, scale bar = 20 μm). The percentage of PCNA+ cells
       was determined by manually counting positive and negative melanoma cells in one representative high-power field (150–200 cells per field)
       within three independent tumor samples. g Pigmented nf1/pten-mutant melanoma cells were transplanted intraperitoneally into adult
       rag2−/− Casper zebrafish. The implanted melanoma cells (left panel, arrow) grew rapidly into secondary tumors (within 2 weeks; right panel).

       transplantation (Fig. 2a). Single-agent treatment with either MEK       its inhibition of tumor growth persisted for 1 to 2 weeks post
       or PI3K inhibitors from days 2–8 post transplantation at each of        treatment, in marked contrast to the rapid tumor regrowth in
       their maximum tolerated dosages (MTDs; Supplementary Fig. S7a)          fish treated with MEK and PI3K inhibitors (Figs. 2c, e, 3 and
       did not affect the growth of tumors (Figs. 2b and S7b). Even when       S10). We also treated nf1/pten-mutant melanomas with ever-
       tumor-bearing recipient fish were treated with a combination of          olimus and temsirolimus, two FDA-approved analogs of
       trametinib and buparlisib at their MTDs (Supplementary Fig. S7a),       sirolimus. The three rapalogs showed similar abilities to
       tumor growth was only transiently inhibited during treatment,           durably inhibit melanoma cell growth (Fig. 2c, e), which
       followed by rapid regrowth after drug removal, resulting in the         uniformly translated to improved overall survival, indicating
       lack of improvement in overall survival (Fig. 2d).                      that rapalogs may provide a useful treatment option for these
                                                                               melanomas in vivo.
       Inhibition of mTOR suppresses the growth of nf1/pten-mutant                Primary nf1/pten-mutant tumors are invariably melanotic, but
       melanomas in vivo                                                       after serial transplantation, the tumor cells often become
       To broaden the coverage of candidate pathway inhibitors, we             amelanotic [26]. In order to track the melanoma cells using EGFP
       next tested a panel of antitumor drugs targeting the RAS-MEK-           instead of melanin, we bred the sox10:EGFP fluorescent zebrafish
       ERK and receptor tyrosine kinase-PI3K-AKT-mTOR pathways in              line into our nf1/pten-mutant line to aid in visualization of the
       our nf1/pten-mutant melanoma model by assessing tumor-cell              transplanted melanoma cells, as they expressed high levels of the
       growth and overall survival of recipient rag2−/− fish after              neural crest progenitor marker sox10 (Supplementary Fig. S11)
       6 days of treatment (Figs. 2, S8 and S9). Among the 14 tested           [24]. When transplanted into 3-week-old rag2−/− zebrafish and
       drugs, each at their MTD, only the rapamycin family of mTOR             treated for 6 days with multiple different inhibitors, the EGFP-
       inhibitors (rapalogs) showed selective activity against nf1/pten-       expressing amelanotic cells responded poorly to single-agent
       mutant melanoma in vivo as single agents. Interestingly, four           treatment with either trametinib or buparlisib, had only temporary
       different mTOR kinase inhibitors did not show activity against          responses to the trametinib–buparlisib combination, but showed
       nf1/pten-mutant melanomas at their MTD (Supplementary Fig.              more durable responses to sirolimus and temsirolimus (Supple-
       S9). During the 6-day treatment course, sirolimus (rapamycin)           mentary Fig. S12). Thus, the amelanotic melanoma cells appear to
       clearly suppressed the appearance of detectable tumors, and             respond in a similar fashion to the melanotic melanoma cells,

                                                                                                                    Oncogene (2021) 40:5718 – 5729
S. He et al.
                                                                                                                                                       5721

Fig. 2 mTOR inhibitors achieve a durable antitumor effect in nf1/pten-mutant melanoma. a Schematic of the melanoma tumor
transplantation assay. b, c Transplanted nf1/pten-mutant melanoma tumor cells were monitored daily in 3-week-old rag2−/− recipient zebrafish
treated with DMSO (CTR; n = 12), 80 nM trametinib (n = 11), 2 μM buparlisib (n = 11), or the combination of 80 nM trametinib and 2 μM
buparlisib (n = 12) for 6 days. Kaplan–Meier curves for progression-free survival (PFS, b) and overall survival (OS, c) are shown. Statistical
analyses were performed by log-rank test, comparing drug-treated with DMSO-treated zebrafish. d, e Transplanted nf1/pten-mutant
melanoma tumor cells were monitored daily in 3-week-old rag2−/− recipient zebrafish treated with DMSO (CTR; n = 12, same values as in b, c),
20 μM sirolimus (n = 12), 20 μM everolimus (n = 11) or 40 μM temsirolimus (n = 11) for 6 days. Kaplan–Meier curves are shown, with statistical
analyses performed as in b, c. For all experiments involving drug treatments, drugs were replenished every 2 days during the 6-day course of
treatment (black arrows).

reinforcing the dependence of both subtypes of melanoma on               increase and then sustained loss of pERK levels (Figs. 4a, b and 5)
mTOR signaling for malignant cell growth in vivo.                        and suppression of proliferation (Fig. 4). Thus, the sustained
                                                                         compensatory upregulation of the ERK pathway induced by
Cell growth in nf1/pten-mutant melanomas depends on mTOR                 buparlisib was not evident when mTOR-mediated phosphoryla-
signaling                                                                tion was specifically inhibited by sirolimus.
The RAS-MEK-MAPK and PI3K-AKT-mTOR pathways negatively                      To assess the durability of pathway suppression by inhibitor
regulate each other, such that a drug-induced blockade of one            treatment, we treated nf1/pten-mutant-melanoma recipients with
pathway results in increased activity of the other [27, 28]. To test     the inhibitors for 6 days, then analyzed the tumors after 4 days in
whether these drugs act on the expected pathways in inhibitor-           the absence of the drugs. Sirolimus led to sustained reductions in
treated nf1/pten-mutant melanomas, we analyzed treated tumors            pERK, pAKT, pS6, and PCNA levels at 4 days post treatment
by IHC, observing that treatment with the MEK inhibitor                  (Fig. 5a–c), as part of a cytoprotective autophagy stress response
trametinib leads to a reduction in pERK levels (Fig. 4a, b), as          (Fig. 6a). By contrast, the initial signaling and antiproliferative effects
expected; while levels of pAKT and pS6 are increased (Fig. 4a, c, d),    of the trametinib-buparlisib combination (Fig. 4) were short-lived, as
reflecting the loss of RAS-MEK-MAPK-mediated cross-inhibition of          4 days after drug removal, the pERK, pAKT, pS6, and PCNA levels
PI3K-AKT-mTOR signaling [27]. Similarly, treatment with the PI3K         were returning to normal (Fig. 5). Similar to sirolimus, temsirolimus
inhibitor buparlisib led to a reduction in pAKT and pS6 levels, with     also induced durable inhibition of pS6 and sustained suppression of
loss of RAS-MEK-MAPK-mediated cross-inhibition, resulting in             pERK, pAKT, and tumor proliferation (Supplementary Fig. S13). Thus,
increased pERK levels (Fig. 4a–d). This concomitant upregulation         in contrast to combined inhibition of PI3K and MEK, mTOR
of an alternative pathway explains why neither buparlisib nor            inhibition alone leads to the sustained suppression of RAS and
trametinib alone inhibited tumor-cell proliferation (Fig. 4a, e). The    PI3K pathways and tumor-cell growth in transplanted melanomas.
trametinib–buparlisib combination readily inhibited both the RAS
and PI3K pathways, leading to a significant, though modest,               Co-inhibition of BCL2 and MCL1 synergizes with sirolimus to
decrease in tumor-cell proliferation (Fig. 4). Thus, these two           cause apoptotic cell death nf1/pten-mutant melanomas in vivo
pathways appear to function redundantly in driving the prolifera-        It is important to emphasize that while either sirolimus or
tion of nf1/pten-mutant melanomas. Interestingly, 2 days of              temsirolimus can induce prolonged proliferative arrest based on
sirolimus treatment resulted in undetectable levels of                   the absence of PCNA staining, we did not detect cleaved caspase
pS6 staining (Fig. 4a, d), reflecting mTOR inhibition with transient      3 in treated tumor cells (Figs. 4a, 5a, and S13), indicating that

Oncogene (2021) 40:5718 – 5729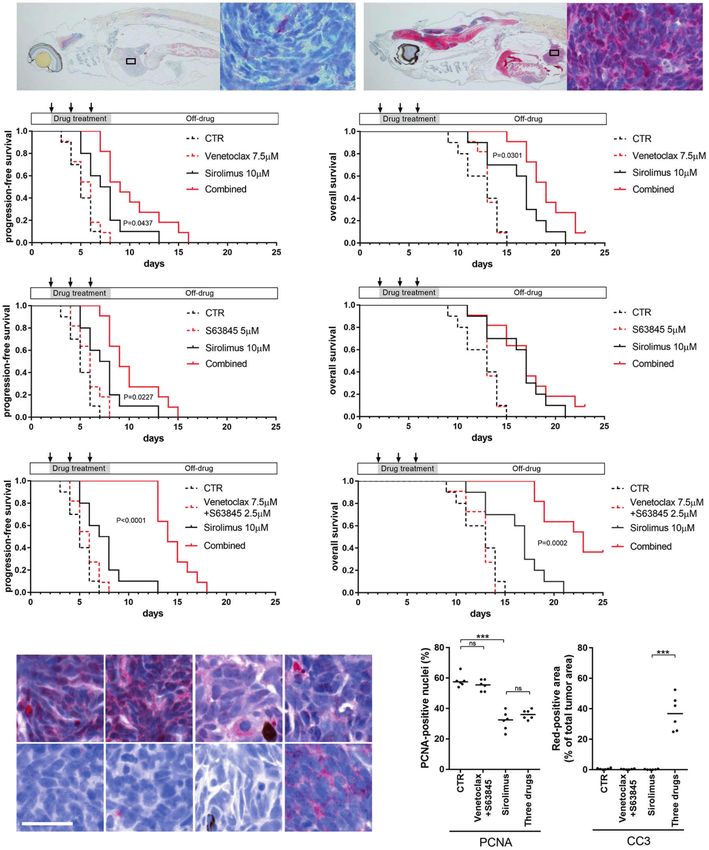
S. He et al.
5722

       Fig. 3 Sirolimus, but not trametinib or buparlisib, prevents rapid relapse of nf1/pten-mutant melanoma following treatment. Three-week-
       old rag2−/− zebrafish transplanted with pigmented nf1/pten-mutant melanoma cells were treated for 6 days with DMSO, 80 nM trametinib,
       2 μM buparlisib, the combination of 80 nM trametinib and 2 μM buparlisib, or 20 μM sirolimus. a, c, e, g, and i Representative zebrafish at the
       end of the 6-day drug treatment. b, d, f, h, and j Representative zebrafish at 4 days following the end of drug treatment. k Quantification of
       melanotic nf1/pten-mutant tumor-cell area at the end of the 6-day course of drug treatment (left), and 4 days later (right). ns p > 0.05, *p < 0.05,
       **p < 0.01, ***p < 0.001 by two-tailed, unpaired t-test. Scale bar = 1 mm.

       neither agent is cytotoxic as a single agent. To query further the          animals (Fig. 6a). The absence of a cytotoxic effect and initiation of
       proliferative arrest induced by these rapalogs, we studied the              autophagy as a cell survival mechanism would likely limit the
       autophagy marker LC3 by IHC. This analysis revealed autophagy               therapeutic potential of rapalogs in nf1/pten-mutant melanomas.
       not only of the tumor cells by LC3 staining, but also striking levels       Thus, we analyzed a panel of antitumor drugs to identify those
       of autophagy in the brain and liver of the sirolimus-treated                with the potential to synergize with sirolimus by inducing

                                                                                                                           Oncogene (2021) 40:5718 – 5729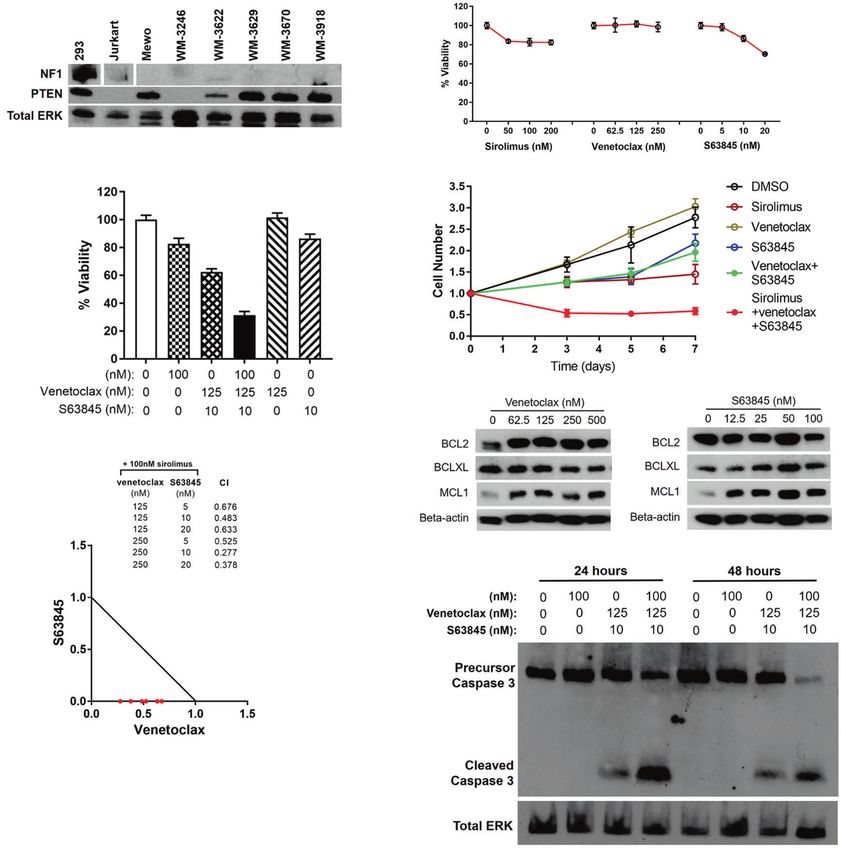
S. He et al.
                                                                                                                                              5723

Fig. 4 Sirolimus strongly inhibits proliferation in nf1/pten-mutant melanomas. a Representative tissue sections from a transplanted nf1/
pten-mutant melanoma tumor after 2 days of treatment with DMSO (CTR), 80 nM trametinib, 2 μM buparlisib, the combination of 80 nM
trametinib and 2 μM buparlisib, or 20 μM sirolimus. Sections were immunostained using antibodies to detect pERK, pAKT, pS6, PCNA, and
cleaved caspase-3 (CC3). pERK-, pAKT- and pS6-positive tumor areas, as well as PCNA-positive nuclei, are quantified post-treatment in (b–e).
“T + B” refers to trametinib plus buparlisib. ns p > 0.05, *p < 0.05, **p < 0.01 by Mann–Whitney test. Scale bar = 20 μm.

apoptosis, thus converting “cytostatic autophagy” to “cytotoxic         venetoclax, and S63845 (MTD determination see Supplementary
autophagy” [29]. This evaluation included MEK inhibitors trame-         Fig. S14).
tinib and cobimetinib, the PI3K inhibitors buparlisib and apitolisib,      As shown in Supplementary Fig. S15, none of the drugs delayed
the pan-RAF inhibitor sorafenib, the PARP inhibitor olaparib, the       tumor progression when given alone to 3-week-old fish-bearing
autophagy inhibitor chloroquine, and inhibitors of the BCL2 family      nf1/pten-mutant melanomas, and only sirolimus in combination
of pro-survival proteins including sabutoclax, obatoclax,               with venetoclax showed overall survival benefit compared to

Oncogene (2021) 40:5718 – 5729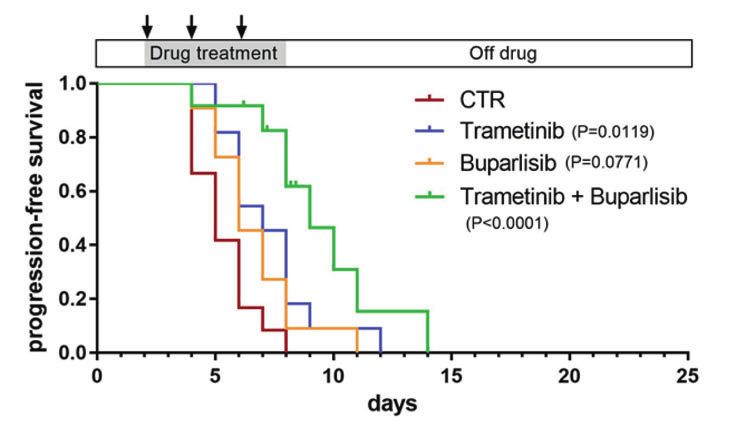
S. He et al.
5724

       Fig. 5 Sirolimus induces a durable cytostatic effect in nf1/pten-mutant melanomas. a Representative tissue sections from a transplanted
       nf1/pten-mutant melanoma tumor at 4 days after a 6-day drug treatment with DMSO (CTR), 80 nM trametinib, 2 μM buparlisib, the
       combination of 80 nM trametinib and 2 μM buparlisib, or 20 μM sirolimus. Sections were immunostained using antibodies to detect pERK,
       pAKT, pS6, PCNA, and CC3. pERK-, pAKT- and pS6-positive tumor areas, as well as PCNA-positive nuclei, are quantified in (b–e). “T + B” refers to
       trametinib plus buparlisib. ns p > 0.05, *p < 0.05, **p < 0.01, ***p < 0.0001 by Mann–Whitney test. Scale bar = 20 μm.

       sirolimus alone. In particular, the autophagy inhibitor chloroquine      massive post-treatment death of the recipient fish as early as
       markedly delayed tumor progression when combined with                    4 days after drug administration, presumably due to autophagy of
       sirolimus, presumably by blocking the ability of the autophago-          normal tissues such as liver (Figs. 6 and S15). Thus, we sought to
       somes to fuse with lysosomes, thus preventing both tumor and             identify drugs that would modify the autophagy response not
       normal cells from accessing the nutrients sequestered in the             directly as in the case of chloroquine but selectively by promoting
       autophagosome [30–32]. However, its use with sirolimus caused            apoptosis.

                                                                                                                       Oncogene (2021) 40:5718 – 5729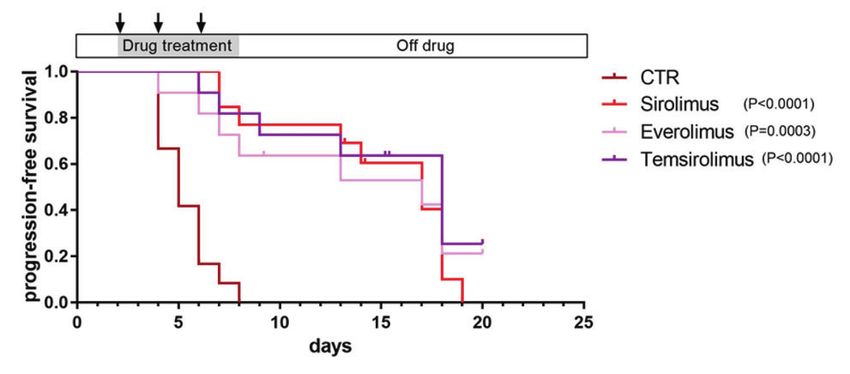
S. He et al.
                                                                                                                                                  5725

Fig. 6 Sirolimus synergizes with venetoclax and S63845 to suppress nf1/pten-mutant melanoma tumor growth and extend the survival
of tumor-bearing zebrafish. a Representative sagittal tissue sections from a transplanted nf1/pten-mutant melanoma tumor treated for 2 days
with the indicated drugs. Sections were immunostained with antibodies to detect LC3A/B. Left panels: E = eye, B = brain, G = gut, K = kidney,
L = liver, S = swim bladder, T = tumor. Right panels: ×63 magnification of tumor cells from the small black boxes in left panels.
b–g Transplanted nf1/pten-mutant melanoma tumor cells were monitored daily in 3-week-old rag2−/− recipient zebrafish treated with DMSO
(CTR), venetoclax, S63845, sirolimus, or the drug combinations (n = 11 or 12 for each curve; doses as indicated). Kaplan–Meier curves for PFS
(b, d, and f) and OS (c, e, and g) were compared using a log-rank test. Drugs were refreshed every 2 days during the 6-day course of treatment,
as indicated by black arrows. h Representative tissue sections from transplanted nf1/pten-mutant melanoma tumors treated for 2 days with
DMSO (CTR), 7.5 μM venetoclax and 2.5 μM S63845, 10 μM sirolimus, and the three-drug combination. Sections were immunostained using
antibodies to detect PCNA and CC3 and quantified in (i). ns p > 0.05, ***p < 0.0001 by Mann–Whitney test. Scale bars = 20 μm.

  Pro-survival members of the BCL2 family of proteins are                BH3-only initiators of apoptosis, leading to an increased propen-
required for the survival of cells undergoing autophagy [33], with       sity to undergo apoptosis through a mechanism called “apoptotic
tumor cells typically showing greater dependence on these pro-           priming” [34]. Thus, since pro-survival BCL2 family proteins are
survival effects because of their higher-than-normal expression of       essential in the high-stress environment induced by sirolimus,

Oncogene (2021) 40:5718 – 5729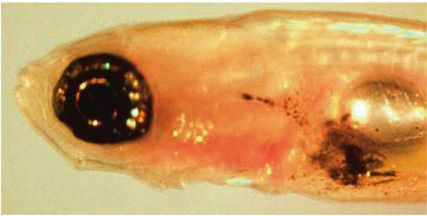
S. He et al.
5726
       their inhibition would be expected to induce tumor cells to             combination but not with sirolimus alone (Fig. 7g), validating the
       undergo apoptosis before normal cells [35–38]. Therefore,               induction of apoptosis by co-inhibition of BCL2 and MCL1 in
       inhibitors of pro-survival BCL2 family proteins should have a           sirolimus-sensitized NF1/PTEN-deficient human melanoma cells.
       therapeutic index based on synergy with the effects of sirolimus in        We also tested the three-drug combination identified in our
       targeted therapy for “primed” NF1/PTEN-mutant tumor cells, while        NF1/PTEN-mutant melanoma model in BRAF-mutant melanomas
       sparing normal tissues.                                                 with PTEN mutations, because BRAF activation by mutation is
          To test this hypothesis, we focused on two inhibitors,               more prevalent than biallelic inactivating mutations of NF1.
       venetoclax (inhibiting BCL2) [39] and S63845 (inhibiting MCL1)          Although each of these drugs demonstrated little or no activity
       [40]. Interestingly, although venetoclax alone had no effect on         as single agents, the three-drug combination showed significant
       tumor growth at a dose of 7.5 μM, its combination with 10 μM            activity against the BRAF-mutant melanoma cells harboring
       sirolimus significantly delayed tumor progression (Fig. 6b, c).          PTEN-mutation (Supplementary Fig. S16). Furthermore, the
       Similarly, S63845 alone did not affect tumor growth at a dose of        venetoclax-S63845 combination potentiated melanoma cell
       5 μM, but in combination with 10 μM sirolimus, it augmented the         killing caused by the BRAFV600E inhibitor darafenib in BRAF-
       growth suppressive effects of sirolimus (Fig. 6d, e).                   mutant melanoma cells (Supplementary Fig. S16), suggesting
          It is known that each member of the pro-survival BCL2 family         that co-inhibition of BCL2 and MCL1 as a strategy to enhance
       proteins, including BCL2 and MCL1, can bind and sequester BH3-          the induction of apoptosis has broad utility as a means to
       only proteins independently and thereby prevent these BH3-only          potentiate the activity of targeted therapies in disseminated
       proteins from inducing apoptosis by activating BAX and BAK [39].        human melanomas.
       We previously discovered in vivo synergistic anti-leukemia activity
       of venetoclax and S63845, as each drug causes marked
       compensatory upregulation of MCL1 and BCL2 protein levels               DISCUSSION
       when used as single agent in zebrafish [41]. Hence, we reasoned          Loss-of-function mutations of the NF1 tumor suppressor in human
       that co-inhibition of BCL2 and MCL1 in nf1/pten-mutant mela-            melanoma cells were first identified by us and others in the early
       noma cells might produce an even greater synergistic antitumor          1990s [42, 43]. The TCGA program subsequently undertook a
       effect than observed with either inhibitor given individually with      multiplatform characterization of cutaneous melanoma samples at
       sirolimus. Indeed, when we combined 7.5 μM venetoclax and               the DNA, RNA, and protein levels, in which NF1-mutant melanoma
       2.5 μM S63845 with 10 μM sirolimus, we observed greatly                 emerged as an important subtype within a genomic classification
       enhanced growth suppression of nf1/pten-mutant melanoma cells           framework [2]. Although highly useful as a means to identify
       (Fig. 6f, g). To determine the basis for this boosted effect, we        cooperative molecular aberrations that might serve as druggable
       analyzed the contributions of these three agents to tumor-cell          targets or predictive biomarkers, this genomic approach did not
       proliferation and apoptosis. 7.5 μM venetoclax and 2.5 μM S63845        suggest a therapeutic strategy for tumors linked to NF1 loss. Using
       had no effect on proliferation or apoptosis, while 10 μM sirolimus      a zebrafish experimental system that models human NF1-mutant
       significantly inhibited proliferation but failed to induce apoptosis     melanomas, we show that activation of both the RAS and PI3K
       (Fig. 6h, i). In combination, however, the three drugs effectively      pathways in a background of pten loss is required to initiate
       inhibited proliferation, and dramatically increased levels of           melanomas in nf1-deficient animals. However, the RAS and PI3K
       apoptosis (Fig. 6h, i). Importantly, the fish tolerated this drug        pathways function redundantly in tumor maintenance, due to
       combination without noticeable toxicity. Thus, our results indicate     compensatory upregulation of either pathway when the other is
       that tumor cells sensitized by sirolimus become more dependent          inhibited (Figs. 4 and 5). Even simultaneous inhibition of both
       than normal cells on BCL2 and MCL1 for sustained survival, thus         pathways only transiently inhibited the growth of nf1/pten-mutant
       increasing their susceptibility to apoptosis in the absence of these    melanomas, such that the overall survival of tumor-bearing fish
       key pro-survival proteins.                                              was unaffected (Figs. 2, S7 and S10). This result contrasts with
                                                                               findings in basal-like breast cancer cell lines, in which the
       Co-inhibition of BCL2 and MCL1 synergizes with sirolimus to             combination of MEK and PI3K inhibitors produced cytotoxic
       induce apoptosis in human NF1/PTEN-deficient melanoma                    antitumor effects [44].
       cells                                                                      Given the superiority of sirolimus in suppressing the growth of
       To validate the efficacy of our three-drug combination, we turned        transplanted nf1/pten-mutant melanomas while inducing autop-
       to studies using human NF1/PTEN-deficient melanoma cells. For            hagy in normal tissues, we faced a major challenge: to identify
       this purpose, we first evaluated the expression level of neurofi-         drugs that could selectively cause apoptosis in sirolimus-sensitized
       bromin and PTEN in a panel of human melanoma cell lines and             melanoma cells. Such studies require an animal model that allows
       identified one cell line, WM-3246, that lacked detectable expres-        one to simultaneously assess both antitumor effects and toxicity
       sion of either neurofibromin or PTEN (Fig. 7a). Then, using WM-          to normal tissues, a criterion that was readily met by our zebrafish
       3246 cells, we tested the effects of sirolimus, venetoclax and          model. Indeed, while the antitumor response of nf1/pten-mutant
       S63845 on the viability of NF1/PTEN-deficient melanoma cells. As         melanomas to the combination of sirolimus and chloroquine
       a single agent, sirolimus induced only modest levels of cytostatic      initially appeared promising, the treated fish died due to toxicity
       growth suppression at concentrations >50 nM (Fig. 7b–d).                to normal tissues (Supplementary Fig. S15), illustrating the
       Venetoclax did not produce effects on WM-3246 cell growth at            importance of analyzing this drug combination in an in vivo
       concentrations up to 250 nM, whereas S63845 suppressed cell             model system. By contrast, the combination of sirolimus with
       growth in a dose-dependent manner at doses >5 nM (Fig. 7b, c).          inhibitors of the anti-apoptotic proteins BCL2 (venetoclax) and
       The greatest impact on cell growth was evident when sirolimus           MCL1 (S63845) was both well tolerated by normal tissues
       was tested in combination with venetoclax and S63845 (Fig. 7c, d);      and highly active in inducing apoptosis in tumor cells (Figs. 6, 7,
       synergy was obtained by isobologram analysis over a range of            and S15). This selectivity apparently results from the fact that the
       drug concentrations (Fig. 7e), indicating that these cells depend       malignant cells are “primed” to undergo apoptosis, while normal
       on both BCL2 and MCL1, as well as on mTOR signaling, for cell           cells do not harbor the same levels of upregulation of BH3-only
       growth and survival. Western blot analysis showed compensatory          death proteins and can survive and maintain mitochondrial
       upregulation of MCL1 in cells treated with venetoclax (Fig. 7f),        integrity despite the simultaneous inhibition of two major pro-
       confirming the molecular basis for the synergy between S63845            survival proteins.
       and venetoclax in sirolimus-treated WM-3246 cells. Furthermore,            Our results underscore the advantages of using a reliable in vivo
       cleaved caspase 3 in WM-3246 cells treated with the three-drug          preclinical model to analyze the effects of simultaneously

                                                                                                                    Oncogene (2021) 40:5718 – 5729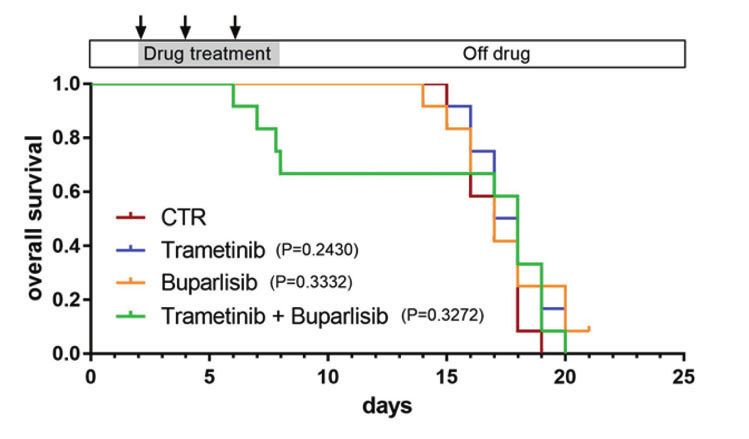
S. He et al.
                                                                                                                                                   5727

Fig. 7 Venetoclax and S63845 synergize with sirolimus to induce apoptosis in human NF1/PTEN-deficient melanoma cells. a Western blots
for NF1 and PTEN in a panel of human melanoma cell lines. HEK293 and Jurkart cells were included as positive and negative controls. The
levels of total ERK1/2 expression serve as the loading control. b Relative cell viability of WM-3246 cells (Cell Titer Glo assay) upon treatment
with sirolimus, venetoclax, or S63845 for 6 days. Mean ± s.d. values. c Relative cell viability of WM-3246 cells (Cell Titer Glo assay) upon
treatment with the combination of sirolimus, venetoclax, and S63845 for 6 days. Mean ± s.d. values. d WM-3246 cell growth kinetics after
treatment with the combination of sirolimus, venetoclax, and S63845 (for doses see panel c). Mean ± s.d. values. e Synergistic effects of
venetoclax and S63845 on suppression of sirolimus-sensitized WM-3246 cells were analyzed by isobologram analysis. f Western blots for BCL2,
BCLXL, and MCL1 in WM-3246 cells treated with venetoclax or S63845 for 24 h. g Western blots for cleaved caspase-3 in WM-3246 cells treated
with the combination of sirolimus, venetoclax, and S63845.

inhibiting multiple pathways with small-molecule drugs. Given its         Fig. S16). Furthermore, the venetoclax-S63845 combination
greater efficiency and lower costs compared to murine models,              potentiated melanoma cell killing caused by the BRAFV600E
our zebrafish experimental system appears ideal for pursuing               inhibitor darafenib in BRAF-mutant melanoma cells (Supplemen-
additional classes of pathway inhibitors in NF1/PTEN-mutant               tary Fig. S16). Thus the potentiation of apoptosis induced by co-
melanomas, as single agents and in combination, to define their            inhibition of BCL2 and MCL1 is a strategy with wide applicability to
clinical translational potential. Thus, the three-drug combination        enhance the anti-melanoma activity by targeted therapies in
of sirolimus, venetoclax, and S63845 is well tolerated at effective       malignant melanoma.
dosages in vivo and shows activity against human as well as
zebrafish NF1/PTEN-deficient melanoma cells, providing preclini-
cal evidence justifying an early-stage clinical trial in patients with    MATERIALS AND METHODS
melanomas of this high-risk genomic subtype. Notably, the three-          Zebrafish
drug combination identified in our NF1/PTEN-mutant melanoma                Zebrafish experiments and animal husbandry were performed in
model also showed anti-melanoma activity in BRAF-mutant                   accordance with Dana-Farber Cancer Institute IACUC-approved protocol
melanoma cells harboring PTEN-mutation (Supplementary                     #02-107.

Oncogene (2021) 40:5718 – 5729
S. He et al.
5728
Melanoma tumor watch 7. Maertens O, Cichowski K. An expanding role for RAS GTPase activating proteins
nf1a+/−;nf1b+/−;ptena+/−;ptenb+/−;p53+/M214K mutant zebrafish were (RAS GAPs) in cancer. Adv Biol Regulation. 2014;55:1–14.
incrossed, and offspring were monitored every week, starting at 3 weeks, 8. Cirenajwis H, Lauss M, Ekedahl H, Torngren T, Kvist A, Saal LH, et al. NF1-mutated
for hyperpigmented cell masses indicative of melanoma tumors. Once a melanoma tumors harbor distinct clinical and biological characteristics. Mol
hyperpigmented cell mass was identified, the individual fish was separated Oncol. 2017;11:438–51.
and carefully monitored weekly for at least 3 weeks for tumor progression. 9. Kuzu OF, Nguyen FD, Noory MA, Sharma A. Current state of animal (mouse)
Only fish with expanding hyperpigmented cell masses were scored as modeling in melanoma research. Cancer Growth Metastasis. 2015;8:81–94.
tumor fish and analyzed further by H&E staining and immunohistochem- 10. Kaufman CK. Zebrafish melanoma. Adv Exp Med Biol. 2016;916:439–50.
ical assays. All fish were genotyped for nf1a, nf1b, ptena, ptenb, and p53 at 11. Hodis E, Watson Ian R, Kryukov Gregory V, Arold Stefan T, Imielinski M, Theurillat
the age of 6 weeks. The exact sample size (n) for each experimental group J-P, et al. A landscape of driver mutations in melanoma. Cell. 2012;150:251–63.
is indicated in the figures. 12. De Raedt T, Beert E, Pasmant E, Luscan A, Brems H, Ortonne N, et al. PRC2 loss
amplifies Ras-driven transcription and confers sensitivity to BRD4-based thera-
pies. Nature. 2014;514:247–51.
Tumor-cell transplantation 13. Shin J, Padmanabhan A, de Groh ED, Lee J-S, Haidar S, Dahlberg S, et al. Zebrafish
rag2E450fs(casper) (rag2−/−) zebrafish were anaesthetized with 0.003% neurofibromatosis type 1 genes have redundant functions in tumorigenesis and
tricaine (Sigma-Aldrich, St. Louis, MO) and positioned on a 10-cm Petri embryonic development. Dis Models Mech. 2012;5:881–94.
dish coated with 1% agarose. Primary and serially passaged tumors
14. Garman B, Anastopoulos IN, Krepler C, Brafford P, Sproesser K, Jiang Y, et al.
derived from nf1a+/−;nf1b−/−;ptena+/−;ptenb−/−;p53M214K/M214K and
Genetic and genomic characterization of 462 melanoma patient-derived xeno-
nf1a+/−;nf1b−/−;ptena+/−;ptenb−/−;p53M214K/M214K;Tg(sox10:EGFP) zebrafish grafts, tumor biopsies, and cell lines. Cell Rep. 2017;21:1936–52.
lines were excised from tumor-bearing fish and mechanically dissociated 15. Mar VJ, Wong SQ, Li J, Scolyer RA, McLean C, Papenfuss AT, et al. BRAF/NRAS wild-
with a razor blade in 0.9× PBS + 5% FBS (Life Technologies, Carlsbad, CA) type melanomas have a high mutation load correlating with histologic and
at room temperature. The collected cell suspension was filtered through a molecular signatures of UV damage. Clin Cancer Res. 2013;19:4589–98.
40-μm cell strainer (Falcon, Corning, NY) and resuspended in 0.9× PBS + 16. Faucherre A, Taylor GS, Overvoorde J, Dixon JE, Hertog JD. Zebrafish pten genes
5% FBS. For the intraperitoneal and intramuscular transplantation into 3- to
have overlapping and non-redundant functions in tumorigenesis and embryonic
4-month-old adult rag2−/− fish, a 26 s/2″/2 Hamilton 80300 syringe
development. Oncogene. 2007;27:1079–86.
(Hamilton, Reno, NV) was used [23]. For the intraperitoneal transplantation 17. Gutierrez A, Grebliunaite R, Feng H, Kozakewich E, Zhu S, Guo F, et al. Pten
into 3-week-old juvenile rag2−/− fish, cell suspensions were loaded into mediates Myc oncogene dependence in a conditional zebrafish model of T cell
borosilicate glass capillary needles (1 mm o.d. × 0.78 mm i.d.; Harvard acute lymphoblastic leukemia. J Exp Med. 2011;208:1595–603.
Apparatus, Holliston, MA), and the injections were performed with a 18. Ceol CJ, Houvras Y, Jane-Valbuena J, Bilodeau S, Orlando DA, Battisti V, et al. The
Pneumatic Picopump and a manipulator (WPI, Sarasota, FL) [45].
histone methyltransferase SETDB1 is recurrently amplified in melanoma and
accelerates its onset. Nature. 2011;471:513–7.
Cell culture 19. Dovey M, White RM, Zon LI. Oncogenic NRAS cooperates with p53 Loss to
Melanoma cell lines Mewo, WM-3246, WM-3622, WM-3629, WM-3670 and Generate Melanoma in Zebrafish. Zebrafish. 2009;6:397–404.
WM-3918 were purchased from Rockland (Rockland Immunochemicals Inc, 20. Lister JA, Capper A, Zeng Z, Mathers ME, Richardson J, Paranthaman K, et al. A
Limerick, PA), and maintained in Dulbecco’s modified Eagle’s medium conditional zebrafish MITF mutation reveals MITF levels are critical for melanoma
supplemented with 10% FBS, L-glutamine, and penicillin/streptomycin. promotion vs. regression in vivo. J Investig Dermatol. 2014;134:133–40.
Melanoma cell lines COLO829 and C32 were purchased from ATCC (ATCC, 21. Patton E, Widlund H, Kutok J, Kopani K, Amatruda J, Murphey R, et al. BRAF
Manassas, VA) and maintained according to the provided Culture Methods. mutations are sufficient to promote nevi formation and cooperate with p53 in
HEK-293T cells were purchased from ATCC, and maintained in Dulbecco’s the genesis of melanoma. Curr Biol. 2005;15:249–54.
modified Eagle’s medium supplemented with 10% FBS, L-glutamine, and 22. Cully M, You H, Levine AJ, Mak TW. Beyond PTEN mutations: the PI3K pathway as
penicillin/streptomycin. Jurkart cells were maintained in RPMI-1640 an integrator of multiple inputs during tumorigenesis. Nat Rev Cancer.
medium supplemented with 10% FBS, L-glutamine, and penicillin/ 2006;6:184–92.
streptomycin. The identity of cell lines used in this study was verified by 23. Tang Q, Moore JC, Ignatius MS, Tenente IM, Hayes MN, Garcia EG, et al. Imaging
short tandem repeat analysis using the PowerPlex 1.2 system (Promega). tumour cell heterogeneity following cell transplantation into optically clear
The cell lines were tested for mycoplasma contamination using MycoAlert immune-deficient zebrafish. Nat Commun. 2016;7:10358.
Mycoplasma Detection Kits (Lonza). 24. Kaufman CK, Mosimann C, Fan ZP, Yang S, Thomas AJ, Ablain J, et al. A zebrafish
melanoma model reveals emergence of neural crest identity during melanoma
initiation. Science. 2016;351:aad2197.
Statistical analysis 25. Peng W, Chen JQ, Liu C, Malu S, Creasy C, Tetzlaff MT, et al. Loss of PTEN
Statistical analysis was performed with Prism 5 software (GraphPad). promotes resistance to T cell-mediated immunotherapy. Cancer Discov.
Kaplan-Meier methods and the log-rank test were applied to assess the 2016;6:202–16.
rate of tumor growth in Figs. 1 and S1, and tumor progression in Figs. 2, 6, 26. Chen KG, Leapman RD, Zhang G, Lai B, Valencia JC, Cardarelli CO, et al. Influence
S7, S8, S9, S10 and S15. The quantitative data in Figs. 3, 4, 5 and S12 are of melanosome dynamics on melanoma drug sensitivity. J Natl Cancer Inst.
reported as median values. A Mann–Whitney test with confidence intervals 2009;101:1259–71.
of 95% was used for the analyses in Figs. 3, 4, 5, 6 and S12. 27. Mendoza MC, Er EE, Blenis J. The Ras-ERK and PI3K-mTOR pathways: cross-talk
and compensation. Trends Biochemical Sci. 2011;36:320–8.
28. Yang S, Xiao X, Meng X, Leslie KK. A mechanism for synergy with combined
mTOR and PI3 kinase inhibitors. PLoS ONE. 2011;6:e26343.
REFERENCES 29. Sharma K, Le N, Alotaibi M, Gewirtz DA. Cytotoxic autophagy in cancer therapy.
1. Siegel RL, Miller KD, Jemal A. Cancer statistics, 2020. CA: Cancer J Clinic. Int J Mol Sci. 2014;15:10034–51.
2020;70:7–30. 30. Avniel-Polak S, Leibowitz G, Riahi Y, Glaser B, Gross DJ, Grozinsky-Glasberg S.
2. Akbani R, Akdemir Kadir C, Aksoy BA, Albert M, Ally A, Amin Samirkumar B, et al. Abrogation of autophagy by chloroquine alone or in combination with mTOR
Genomic classification of cutaneous melanoma. Cell. 2015;161:1681–96. inhibitors induces apoptosis in neuroendocrine tumor cells. Neuroendocrinology.
3. Maertens O, Johnson B, Hollstein P, Frederick DT, Cooper ZA, Messiaen L, et al. 2016;103:724–37.
Elucidating distinct roles for NF1 in melanomagenesis. Cancer Discov. 31. Kaneko M, Nozawa H, Hiyoshi M, Tada N, Murono K, Nirei T, et al. Temsirolimus
2013;3:338–49. and chloroquine cooperatively exhibit a potent antitumor effect against color-
4. Whittaker SR, Theurillat J-P, Van Allen E, Wagle N, Hsiao J, Cowley GS, et al. A ectal cancer cells. J Cancer Res Clin Oncol. 2014;140:769–81.
genome-scale RNA interference screen implicates NF1 loss in resistance to RAF 32. Rangwala R, Chang YC, Hu J, Algazy KM, Evans TL, Fecher LA, et al. Combined
inhibition. Cancer Discov. 2013;3:350–62. MTOR and autophagy inhibition: phase I trial of hydroxychloroquine and tem-
5. Hayward NK, Wilmott JS, Waddell N, Johansson PA, Field MA, Nones K, et al. sirolimus in patients with advanced solid tumors and melanoma. Autophagy.
Whole-genome landscapes of major melanoma subtypes. Nature. 2014;10:1391–402.
2017;545:175–80. 33. Macintosh RL, Ryan KM. Autophagy in tumour cell death. Semin Cancer Biol.
6. Krauthammer M, Kong Y, Bacchiocchi A, Evans P, Pornputtapong N, Wu C, et al. 2013;23:344–51.
Exome sequencing identifies recurrent mutations in NF1 and RASopathy genes in 34. Potter DS, Letai A. To prime, or not to prime: that is the question. Cold Spring
sun-exposed melanomas. Nat Genet. 2015;47:996–1002. Harb symposia Quant Biol. 2016;81:131–40.
Oncogene (2021) 40:5718 – 5729S. He et al.
5729
35. Lam LT, Lu X, Zhang H, Lesniewski R, Rosenberg S, Semizarov D. A microRNA Yi Zhou and Andrew Hong for stimulating suggestions; Christine L. Unitt, Benjamin
screen to identify modulators of sensitivity to BCL2 inhibitor ABT-263 (navitoclax). Ferland and Dana-Farber/Harvard Cancer Center Research Pathology Core for
Mol Cancer Ther. 2010;9:2943–50. technical support. This study was funded by Melanoma Research Alliance award
36. McGill GG, Horstmann M, Widlund HR, Du J, Motyckova G, Nishimura EK, et al. #509233.
Bcl2 regulation by the melanocyte master regulator Mitf modulates lineage
survival and melanoma cell viability. Cell. 2002;109:707–18.
37. Mohana-Kumaran N, Hill DS, Allen JD, Haass NK. Targeting the intrinsic apoptosis COMPETING INTERESTS
pathway as a strategy for melanoma therapy. Pigment Cell Melanoma Res. The authors declare no competing interests.
2014;27:525–39.
38. Mukherjee N, Schwan JV, Fujita M, Norris DA, Shellman YG. Alternative treatments
for melanoma: targeting BCL-2 family members to de-bulk and kill cancer stem
ADDITIONAL INFORMATION
cells. J Investig Dermatol. 2015;135:2155–61.
39. Leverson JD, Sampath D, Souers AJ, Rosenberg SH, Fairbrother WJ, Amiot M, et al. Supplementary information The online version contains supplementary material
Found in translation: how preclinical research is guiding the clinical development available at https://doi.org/10.1038/s41388-021-01926-y.
of the BCL2-selective inhibitor venetoclax. Cancer Discov. 2017;7:1376–93.
40. Kotschy A, Szlavik Z, Murray J, Davidson J, Maragno AL, Le Toumelin-Braizat G, Correspondence and requests for materials should be addressed to S.H., M.R.M. or A.T.L.
et al. The MCL1 inhibitor S63845 is tolerable and effective in diverse cancer
models. Nature. 2016;538:477–82. Reprints and permission information is available at http://www.nature.com/
41. Li Z, He S, Look AT. The MCL1-specific inhibitor S63845 acts synergistically with reprints
venetoclax/ABT-199 to induce apoptosis in T-cell acute lymphoblastic leukemia
cells. Leukemia. 2019;33:262–6. Publisher’s note Springer Nature remains neutral with regard to jurisdictional claims
42. Andersen LB, Fountain JW, Gutmann DH, Tarle SA, Glover TW, Dracopoli NC, et al. in published maps and institutional affiliations.
Mutations in the neurofibromatosis 1 gene in sporadic malignant melanoma cell
lines. Nat Genet. 1993;3:118–21.
43. Johnson MR, Look AT, DeClue JE, Valentine MB, Lowy DR. Inactivation of the NF1
gene in human melanoma and neuroblastoma cell lines without impaired reg-
ulation of GTP.Ras. Proc Natl Acad Sci USA. 1993;90:5539–43. Open Access This article is licensed under a Creative Commons
44. Hoeflich KP, O’Brien C, Boyd Z, Cavet G, Guerrero S, Jung K, et al. In vivo anti- Attribution 4.0 International License, which permits use, sharing,
tumor activity of MEK and phosphatidylinositol 3-kinase inhibitors in basal-like adaptation, distribution and reproduction in any medium or format, as long as you give
breast cancer models. Clin Cancer Res. 2009;15:4649–64. appropriate credit to the original author(s) and the source, provide a link to the Creative
45. He S, Lamers GEM, Beenakker J-WM, Cui C, Ghotra VPS, Danen EHJ, et al. Commons license, and indicate if changes were made. The images or other third party
Neutrophil-mediated experimental metastasis is enhanced by VEGFR inhibition in material in this article are included in the article’s Creative Commons license, unless
a zebrafish xenograft model. J Pathol. 2012;227:431–45. indicated otherwise in a credit line to the material. If material is not included in the
article’s Creative Commons license and your intended use is not permitted by statutory
regulation or exceeds the permitted use, you will need to obtain permission directly
from the copyright holder. To view a copy of this license, visit http://creativecommons.
ACKNOWLEDGEMENTS org/licenses/by/4.0/.
We would like to thank John Gilbert for critical review of the manuscript and editorial
suggestions; Kassandra Bacon and Daniel Debiasi for zebrafish husbandry; Jeoren den
Hertog, Alejandro Gutierrez and David M. Langenau for providing zebrafish lines; © The Author(s) 2021
Oncogene (2021) 40:5718 – 5729You can also read