Laser Capture Microdissection of Single Neurons with Morphological Visualization Using Fluorescent Proteins Fused to Transmembrane Proteins
←
→
Page content transcription
If your browser does not render page correctly, please read the page content below
Research Article: Methods/New Tools

Novel Tools and Methods

Laser Capture Microdissection of Single Neurons
with Morphological Visualization Using Fluorescent
Proteins Fused to Transmembrane Proteins
Ching Ching Chang, Hai Tarng Chong, and                          Ayumu Tashiro (田代 歩)

https://doi.org/10.1523/ENEURO.0275-20.2021
School of Biological Sciences, Nanyang Technological University, Singapore 308232

Abstract
Gene expression analysis in individual neuronal types helps in understanding brain function. Genetic methods
expressing fluorescent proteins are widely used to label specific neuronal populations. However, because cell
type specificity of genetic labeling is often limited, it is advantageous to combine genetic labeling with addi-
tional methods to select specific cell/neuronal types. Laser capture microdissection is one of such techniques
with which one can select a specific cell/neuronal population based on morphological observation. However, a
major issue is the disappearance of fluorescence signals during the tissue processing that is required for high-
quality sample preparation. Here, we developed a simple, novel method in which fluorescence signals are pre-
served. We use genetic labeling with fluorescence proteins fused to transmembrane proteins, which shows
highly stable fluorescence retention and allows for the selection of fluorescent neurons/cells based on mor-
phology. Using this method in mice, we laser-captured neuronal somata and successfully isolated RNA. We
determined that ;100 cells are sufficient to obtain a sample required for downstream applications such as
quantitative PCR. Capability to specifically microdissect targeted neurons was demonstrated by an ;10-fold
increase in mRNA for fluorescent proteins in visually identified neurons expressing the fluorescent proteins
compared with neighboring cells not expressing it. We applied this method to validate virus-mediated single-
cell knockout, which showed up to 92% reduction in knocked-out gene RNA compared with wild-type neu-
rons. This method using fluorescent proteins fused to transmembrane proteins provides a new, simple solution
to perform gene expression analysis in sparsely labeled neuronal/cellular populations, which is especially ad-
vantageous when genetic labeling has limited specificity.
Key words: channelrhodopsin; gene expression; halorhodopsin; optogenetics; viral vector

   Significance Statement
   Genetic labeling of specific cell types with reporter fluorescent proteins is widely used for gene expression
   analysis. However, because the specificity of genetic labeling is often limited, an additional method is re-
   quired to collect samples from a specific cell type. Here, we developed a novel method to allow for the se-
   lection of a cell/neuronal type of interest based on morphology before performing sample collection using
   laser capture microdissection. Stable fluorescent signals from fluorescent proteins fused to transmembrane
   proteins allow us to morphologically select and laser capture hundreds of single neurons. This method
   would be applicable to genomic and transcriptomic analysis of different cell/neuronal types and could facili-
   tate our understanding of brain functions.

Received June 23, 2020; accepted July 15, 2021; First published August 16,     Author contributions: C.C.C. and A.T. designed research; C.C.C. and H.T.C.
  2021.                                                                      performed research; C.C.C. and A.T. analyzed data; C.C.C. and A.T. wrote
  The authors declare no competing financial interests.                      the paper.

September/October 2021, 8(5) ENEURO.0275-20.2021 1–11
Research Article: Methods/New Tools      2 of 11

Introduction                                                                     cytometry of primary human fibroblasts (Kalejta et al.,
   Gene expression analysis of specific neuronal types                           1997). This observation made us reason that genetic la-
has been successfully performed using genetic labeling                           beling with fluorescent proteins fused to transmembrane
with reporter fluorescent proteins and fluorescence-                             proteins allows us to identify a cell type of interest based
activated cell sorting (FACS; Xia et al., 2017; Daigle et al.,                   on their morphology and selectively capture them using
2018). However, one technical limitation is that genetic la-                     laser capture microdissection. In this study, we tested this
beling often marks multiple neuronal and/or other cell                           possibility and validated that the use of labeling with fluo-
types (van Praag et al., 2002; Balthasar et al., 2004;                           rescent proteins fused to transmembrane proteins allows
Lagace et al., 2007; Harris et al., 2014), whereas FACS                          us to select neurons over non-neuronal cells and perform
cannot separate such unwanted, labeled cell types. In ad-                        downstream gene expression analyses.
dition, enzyme-mediated cell dissociation procedures
could affect viability and gene expression (Ho et al., 2018;
Hussain et al., 2018; Reichard and Asosingh, 2019). An al-
                                                                                 Materials and Methods
                                                                                   A flowchart of the methodology is shown in Figure 1.
ternative method that allows for separating cell/neuronal
                                                                                 We freshly froze brains after retrieving them from the
types without tissue dissociation steps would be useful as
                                                                                 skull. We sectioned the brains, mounted sections on the
a complementary method.
                                                                                 glass slides and dehydrated/fixed them with ethanol. We
   Laser capture microdissection is a technique that dis-
                                                                                 distinguished neurons from glial cells based on their den-
sects a small piece of tissue or a single cell by a laser and
                                                                                 dritic morphology under a fluorescence microscope, and
collects them with gravity or the assistance of a laser.
                                                                                 then harvested the cell bodies of the selected neurons
Instruments for laser capture microdissection are often
                                                                                 with laser capture microdissection. A total of 100–300 mi-
equipped with a fluorescence light source (Emmert-Buck
                                                                                 crodissected neurons were pooled for RNA extraction. As
et al., 1996; Bonner et al., 1997; Fend and Raffeld, 2000).
                                                                                 examples of downstream gene expression analyses, we
Therefore, one can observe the morphology of genetically
                                                                                 performed quantitative PCR (qPCR) analysis after cDNA
labeled fluorescent cells and select a cell type of interest to
                                                                                 amplification.
capture. However, in practice, this is not a simple task.
Commonly for laser capture microdissection, sections are
prepared from freshly frozen tissue, rather than fixed tissue,                   Mice
to acquire high-quality RNA. In such sections, fluorescent                          We used 6- to 11-week-old C57BL/6 or transgenic mice
proteins diffuse out from cells and their fluorescence signals                   of either sex, housed in a 12 h dark/light cycle with ad libi-
disappear during tissue-processing procedures (Singh et                          tum access to water and food. Transgenic lines used were
al., 2019). Although an optimized protocol can improve the                       floxed NR1 mice (B6.129S4-Grin1tm2Stl/J; Tsien et al., 1996)
issue to some extent, the instability of fluorescence signals                    and Pomc-ChR2 mice, which were produced by crossing
makes it difficult to use fluorescence as a guide to distin-                     two transgenic lines: STOCK Tg(Pomc1-cre)16Lowl/J
guish cell types for laser capture microdissection. A more                       (back-crossed with C57BL/6 mice; Balthasar et al., 2004)
stable fluorescence-labeling method would be valuable for                        and B6.Cg-Gt(ROSA)26Sortm32(CAG-COP4*H134R/EYFP)
solving this technical limitation. In this line, studies (Rossner                Hze/J (Madisen et al., 2012). All three transgenic lines were
et al., 2006; Chatzi et al., 2019) demonstrated that nuclear                     originally purchased from The Jackson Laboratory and bred
targeted fluorescent proteins preserves their signals.                           in our local facilities. All animal procedures were performed
However, because only nuclei, but not processes/neurites,                        according to the approval from the Institutional Animal Care
are visualized, their application to morphological identifica-                   and Use Committee at Nanyang Technological University.
tion of cell types is limited.
   In the course of an experiment for some other purpose,
we happened to find that the fluorescence signals from                           Preparation of brain sections and tissue processing
transmembrane proteins fused with fluorescent proteins                              Mice were deeply anesthetized with isoflurane. Mice
were extremely stable and kept visualizing dendritic mor-                        were decapitated, and their brains were dissected out
phology in air-dried, nonfixed brain sections. We later                          from the skull within 2 min. The brains were transferred
found that similar preservation of fluorescence signals                          onto an embedding mold and frozen in embedding me-
from transmembrane proteins fused with fluorescent pro-                          dium (O.C.T. Compound, Sakura Finetek) with isopentane
teins has been previously described in the context of flow                       on dry ice, which was completed within an additional
                                                                                 1–3 min. Brains were stored at 80°C until cryosection-
  This research was supported by the Ministry of Education, Singapore,           ing. Immediately before cryosectioning, brains were
Academic Research Fund Tier 1 (Grants 2016-T1-001-010, 2018-T1-002-053)          kept at 20°C for at least 30 min. The 10- to 12-mm-
and Tier 3 (Grant MOE2017-T3-1-002).
  Acknowledgements: We thank Miaomiao Han for technical assistance.
                                                                                 thick sections were produced using a cryostat micro-
  Correspondence should be addressed to Ayumu Tashiro at atashiro@               tome at 20°C. Brain sections were mounted on glass
ntu.edu.sg or Ching Ching Chang at chingchingchang65@gmail.com.                  slides and air dried for 5 min. Sections were dehy-
  https://doi.org/10.1523/ENEURO.0275-20.2021                                    drated/fixed in increasing concentrations of ethanol
Copyright © 2021 Chang et al.
                                                                                 (75%, 95%, and then 100%) for 30 s each, followed by
This is an open-access article distributed under the terms of the Creative
Commons Attribution 4.0 International license, which permits unrestricted use,
                                                                                 xylene for 1 min. We performed these procedures im-
distribution and reproduction in any medium provided that the original work is   mediately before fluorescence visualization and laser
properly attributed.                                                             capture microdissection.

September/October 2021, 8(5) ENEURO.0275-20.2021                                                                                       eNeuro.org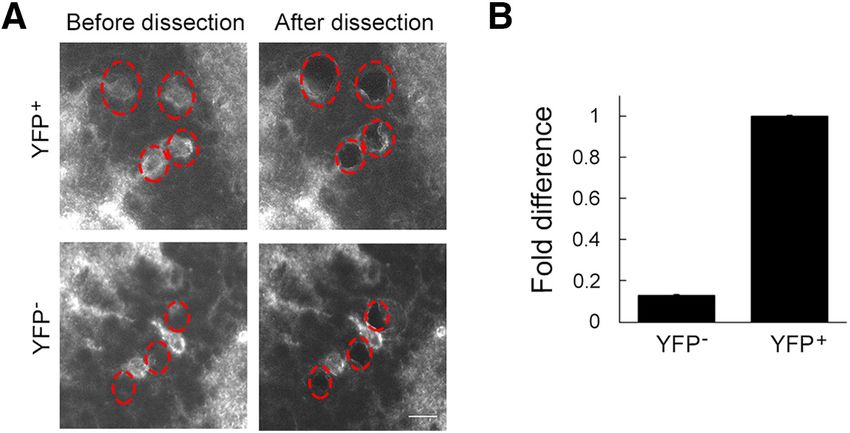
Research Article: Methods/New Tools       3 of 11

Figure 1. Flowchart of methodology.

Fluorescence visualization and laser capture                     Singapore Pte Ltd, using an Agilent RNA 6000 Pico Kit
microdissection                                                  and an Agilent 2100 Bioanalyzer. The quality of RNA was
   We used the PALM MicroBeam System (Zeiss) equipped            determined as the RNA integrity number (Schroeder et al.,
with a fluorescence microscope. Each fluorescently labeled       2006).
cell was selected under the microscope with an LD Plan-
Neofluar objective lens (40/0.6 numerical aperture), and        Preparation of viral vectors
laser captured into an AdhesiveCap 500 opaque (Zeiss). A            We prepared the viral vectors as previously described
sample of up to ;100 cells were collected in a single            (Tashiro et al., 2015a). We used Moloney murine leukemia
AdhesiveCap and lysed with cell lysis buffer. When the collec-
                                                                 virus-based retroviral vectors driving the expression of
tion took more than 1 h, we lysed cells to minimize sample
                                                                 eNpHR3.0-YFP, mCherry, GFP-F, ChR2(SFFO), or bicis-
degradation and continued collection in a new AdhesiveCap.
                                                                 tronically eNPHR3.0YFP and Cre under the control of the
                                                                 CAG promoter (Zhao et al., 2006) and an adeno-associ-
RNA extraction                                                   ated viral vector expressing mCherry-TRPV2 (transient re-
   After cell lysis in the AdhesiveCaps, we extracted RNA        ceptor potential cation channel V2) under the control of
using an Ambion RNA Isolation Kit (Thermo Fisher Scientific)     the CaMKIIa promoter (Kitanishi et al., 2015).
according to the manufacturer protocol. When more than
one Adhesivecap was used for sample collection, cell lysates
from multiple AdhesiveCaps were pooled and passed                Stereotaxic injections
through a single column. RNA concentration was measured             Mice were bilaterally injected with retroviral vectors (1.5 ml,
using Quant-iT RiboGreen (Thermo Fisher Scientific).             titer: 1  107 to 1  108 colony-forming units/ml) into the den-
                                                                 tate gyrus (coordinates: anteroposterior, 2 mm from the breg-
                                                                 ma; mediolateral, 1.5 mm from the bregma; dorsoventral, 2.3
Quantitative PCR                                                 mm from skull surface). Preparation and injection procedures
   Reverse transcription and cDNA amplification were per-        were described previously (Tashiro et al., 2015a). For coinjec-
formed using cDNA SMARTer PCR cDNA Synthesis Kit                 tion, a mixture of virus solutions was prepared with a 1:1 ratio
(Takara Bio) or GeneChip WT Pico Kit (Affymetrix). qPCR          in volume.
was performed with iTaq Universal SYBR Green Supermix
(Bio-Rad) and StepOnePlus Real-Time PCR System
(Thermo Fisher Scientific), using the following gene-specific    Perfusion and fixation
primers: NR1 forward, TGTCCTGGGACTGACTACCC; NR1                    For the purpose of visualizing fluorescence expression in
reverse, CTGACCAGCAGGATGA; yellow fluorescent pro-               neurons (Fig. 2, see also Fig. 7C), brain sections were pre-
tein (YFP) forward, TATATCATGGCCGACAAGCA; YFP re-                pared from brains that were perfusion fixed with 4% parafor-
verse, TGTTCTGCTGGTAGTGGTCG; doublecortin (DCX)                  maldehyde. The procedure was previously described
forward, GAGTGCGCTACATTTATACCATTG; DCX reverse,                  (Tashiro et al., 2015b). Brain sectioning was performed in the
TGACATTCTTGGTGTACTCAACCT; CaMKIIa forward, AG                    same way as described in the subsection Preparation of
GATGAAGACACCAAAGTGC; CaMKIIa reverse, GGTTC                      brain sections and tissue processing. Sections were mounted
AAAGGCTGTCATTCC; b -actin forward, AGCCATGTAC                    on glass slides with coverslips and antifade polyvinyl alcohol
GTAGCCATCC; and b -actin reverse, CTCTCAGCTGTGGT                 mounting medium with DABCO.
GGTGAA. Each sample was amplified in triplicate. We used
mouse liver total DNA (see Fig. 4D) that was included in         Freeze–thaw cycle with HEK293 cell culture with or
cDNA SMARTer PCR cDNA Synthesis Kit (Takara Bio).                without cryoprotectant
                                                                   We seeded 1  105 HEK293 cells in wells in a 12-well
RNA integrity assay                                              plate. Next day, we transfected the cells with one of the
  The quality of RNA samples that we isolated was eval-          plasmids listed below, with a calcium phosphate method
uated by a service provided by NovogeneAIT Genomics              with the following mixture: 500 ng of plasmid DNA in

September/October 2021, 8(5) ENEURO.0275-20.2021                                                                        eNeuro.org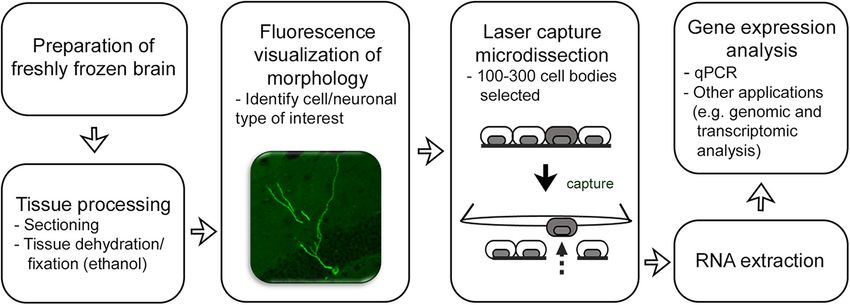
Research Article: Methods/New Tools 4 of 11
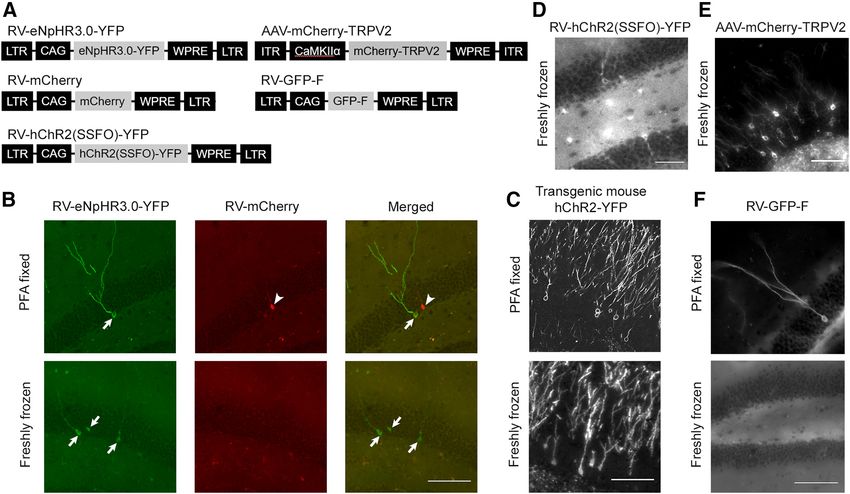
Figure 2. The signals of fluorescent proteins fused to transmembrane proteins are preserved after the standard tissue-processing proce-
dure for laser capture microdissection. A, Schematic structures of the viral vector genomes. B–F, Images of fluorescently labeled granule
cells in the dentate gyrus of mice injected with a mixture of two retroviral vectors expressing YFP-fused enhanced halorhodopsin,
eNpHR3.0-YFP, or mCherry (B); Pomc-ChR2-YFP transgenic mice (C) and mice injected with a retroviral vector expressing ChR2(SSFO)-
YFP (D); an adeno-associated viral vector expressing mCherry-TRPV2 (E) and a retroviral vector expressing a membrane-targeted form of
GFP, GFP-F (F). Brain sections were prepared from paraformaldehyde fixed or freshly frozen brains and went through the standard tissue-
processing procedure. Note that fluorescence signals of eNpHR3.0-YFP (B), ChR2-YFP (C), ChR2(SSFO)-YFP (D), and mCherry-TRPV2 (E),
but not mCherry (B) and GFP-F (F), were preserved in sections prepared from freshly frozen brains. Arrows and arrowheads in B indicate
somata labeled by eNpHR3.0-YFP and mCherry. RV, Retroviral vector; AAV, adeno-associated viral vector; LTR, long-terminal repeat; CAG,
CAG promoter; WPRE, Woodchuck hepatitis virus post-transcriptional regulatory element; CaMKIIa, the CaMKIIa promoter; ITR, inverted
terminal repeat. Scale bars, 100 mm.
640 ml of sterile Milli-Q water and 36 ml of 2 M CaCl2, with such as the green fluorescent protein (GFP), which is
100 ml of 2 HEBS (50 mM HEPES, 280 mM NaCl, 10 mM soluble in the cytoplasm. After tissue-processing proce-
KCl, 1.5 mM Na2HPO4, 12 mM D-glucose, pH 7.05). The dures, fluorescence signals disappeared in sections pre-
plasmid DNAs were retroviral transfer plasmids, RV-CAG- pared from freshly frozen brains, and our attempt failed.
GFP, RV-CAG-mCherry, RV-CAG-eNpHR3.0-YFP, RV- However, in the course of an experiment for some other
CAG-ChR2-mCherry, and RV-CAG-ChR2(SSFO)-YFP. purpose, we happened to find that fluorescence signals
Twenty-four hours after transfection, we removed cul- from fluorescent proteins fused to transmembrane pro-
ture media from the wells and washed twice with PBS. teins are extremely stable even in air-dried, nonfixed
For cells with cryoprotectant, we applied 500 ml of 10%
brain sections prepared from freshly frozen brains.
DMSO/90% fetal bovine serum on top of the cells before
Under the same conditions, the fluorescence signals of
a freeze–thaw cycle. For cells without cryoprotectant, we
air dried and froze/thawed cells without cryoprotectant. regular fluorescent proteins diffuse and dissipate quickly
We froze the cells by keeping the 12-well plate in a 80°C in the order of seconds to minutes. This preliminary find-
freezer for 30 min. We then thawed them at room temper- ing led us to test whether labeling with fluorescent pro-
ature and performed imaging immediately. teins fused to transmembrane proteins is preserved after
the standard tissue-processing procedure for laser cap-
Results ture microdissection.
Figure 2 illustrates the instability of cytoplasmic fluores-
Fluorescence signals from fluorescent proteins fused cent proteins and the stability of fluorescent proteins
to transmembrane proteins are preserved after tissue fused to transmembrane proteins in sections from freshly
processing frozen brains, which we processed by the standard proto-
In preliminary experiments, we tried to laser capture col of tissue processing used for laser capture microdis-
single neurons labeled with regular fluorescent proteins, section. We injected a mixture of two retroviral vectors
September/October 2021, 8(5) ENEURO.0275-20.2021 eNeuro.org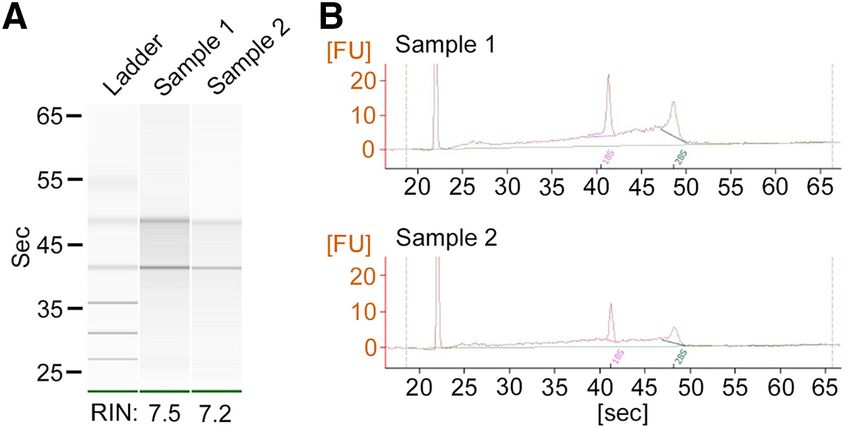
Research Article: Methods/New Tools      5 of 11

                                                                     fused to YFP in a subset of granule cells in the dentate
                                                                     gyrus and (2) adult mice that were injected with retroviral
                                                                     vector expressing a stable step function opsin (SSFO)
                                                                     mutant of ChR2 fused to YFP (Fig. 2A) into the dentate
                                                                     gyrus. Then we performed tissue processing. As shown in
                                                                     Figure 2, C and D, fluorescence signals in neurons were
                                                                     preserved in freshly frozen sections.
                                                                        ChR2 and eNpHR3.0 are structurally similar proteins.
                                                                     To test whether fusion to a different type of transmem-
                                                                     brane proteins also preserves fluorescence signals, we
                                                                     prepared brain sections from mice injected with an
                                                                     adeno-associated viral vector expressing TRPV2 (Fig. 2A)
                                                                     into the dentate gyrus. As shown in Figure 2E, fluores-
                                                                     cence signals were again preserved in freshly frozen
                                                                     sections.
                                                                        To test whether membrane-targeted fluorescent pro-
                                                                     teins with a farnesylation signal are preserved after tissue
                                                                     processing, we injected a retroviral vector expressing
                                                                     GFP fused with a farnesylation signal (GFP-F; Moriyoshi
                                                                     et al., 1996; Jiang and Hunter, 1998; Fig. 2A) into the den-
                                                                     tate gyrus of adult mice. In cells, a farnesyl group is added
                                                                     to GFP-F and facilitates the attachment to cellular mem-
                                                                     brane. Although sections from brains fixed with parafor-
                                                                     maldehyde preserved clear fluorescence labeling of
                                                                     neurons (Fig. 2F, top), no fluorescence signal was de-
Figure 3. Cryoprotectant prevents the loss of fluorescence signals
                                                                     tected in the sections from freshly frozen brains (Fig. 2F,
from regular fluorescent proteins in HEK293 cell culture after a
freeze–thaw cycle. A, Representative images showing fluorescence     bottom). Thus, membrane-targeted fluorescence proteins
signals from regular, cytosolic fluorescent proteins (GFP and        do not preserve its fluorescence signals through the
mCherry) after a freeze–thaw cycle with or without cryoprotectant.   standard tissue-processing procedure.
Fluorescence signals disappeared without cryoprotectant while cry-      We found that the loss of fluorescence signals from reg-
oprotectant preserved fluorescence signals. B, Representative im-    ular fluorescent proteins also occurs in HEK293 cells after
ages showing fluorescence signals from fluorescent proteins fused    freezing and thawing (Fig. 3A). However, when we added
to transmembrane proteins [eNpHR3.0-YFP, ChR2-mCherry, ChR2          cryoprotectant (10% DMSO/90% fetal bovine serum), flu-
(SSFO)-YFP]. Fluorescence signals were preserved without cryo-       orescence signals were retained. This is presumably be-
protectant after a freeze–thaw cycle. Scale bar, 50 mm.
                                                                     cause cryoprotectant prevented the freeze–thaw cycle
                                                                     from rupturing the plasma membrane. In contrast, fluores-
into the dentate gyrus of adult mice (Fig. 2A). One of them          cence signals from fluorescent proteins fused to trans-
was for expressing YFP fused to transmembrane proteins               membrane proteins were preserved after a freeze–thaw
(enhanced halorhodopsin, eNpHR3.0), while the other                  cycle without cryoprotectant (Fig. 3B). The results sug-
was for expressing mCherry, which is cytosolic fluores-              gest that the breakage of plasma membrane caused by
cent proteins. Some of the mice were perfusion fixed with            freezing causes the leakage of regular cytoplasmic fluo-
4% paraformaldehyde, while the brains of the other mice              rescent proteins but still keeps fluorescent proteins fused
were freshly frozen without fixation. All brains were then           to transmembrane proteins in HEK293 cells, which is
subjected to the standard tissue-processing procedure.               likely the same in brain sections.
As expected, paraformaldehyde-fixed brain sections pre-
served both YFP and mCherry signals (Fig. 2B, top). On               Laser capture microdissection of morphologically
the other hand, in sections from freshly frozen brains, YFP          identified neurons
signals were preserved while mCherry signals were com-                  Next, we performed laser capture microdissection of
pletely lost (Fig. 2B, bottom). Thus, fluorescent proteins           single neurons labeled with fluorescent proteins fused to
fused to transmembrane proteins, but not cytosolic fluo-             transmembrane proteins. We injected a retroviral vector
rescent proteins, preserve the fluorescence signals after            expressing eNpHR3.0-YFP into adult mice (Fig. 4A) and,
the standard tissue-processing procedure for laser cap-              after 14 d, harvested their brains and prepared brain sec-
ture microdissection. Importantly, the dendritic morphol-            tions using the standard tissue-processing protocol.
ogy of YFP1 neurons was preserved and clearly                        When injected into the dentate gyrus of adult mice, the
visualized in the sections from freshly frozen brains (Fig.          type of retroviral vectors we used in this study are known
2B).                                                                 to mainly transduce in newly generated neurons in the
   In addition to enhanced halorhodopsin, we tested fluo-            dentate gyrus (Fig. 2B). However, a modest number of
rescent proteins fused to another type of transmembrane              non-neuronal cells are also infected to express trans-
proteins, channelrhodopsin-2 (ChR2). We prepared brain               genes. Under a fluorescence microscope, we were able
sections from (1) Pomc-ChR2-YFP mice expressing ChR2                 to distinguish neurons from non-neuronal cells based on

September/October 2021, 8(5) ENEURO.0275-20.2021                                                                           eNeuro.org
Research Article: Methods/New Tools 6 of 11
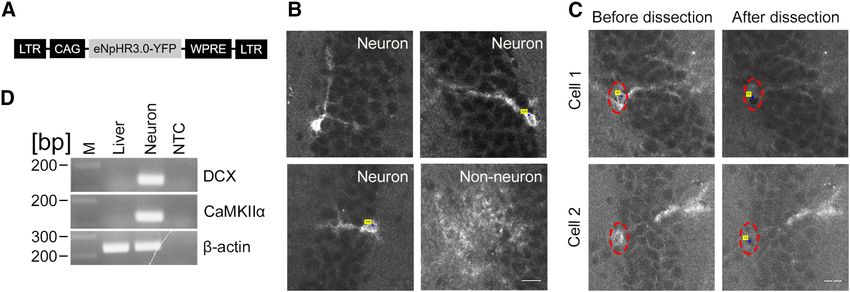
Figure 4. Laser capture microdissection of fluorescence labeled neurons. A, A schematic structure of the viral vector genome. B, Images
of eNpHR3.0-YFP-expressing neurons and non-neuronal cells in the dentate gyrus of mice that were injected with a retroviral vector ex-
pressing eNpHR3.0-YFP. C, Fluorescence images of sections before and after laser capture microdissection. Red dotted ovals show the lo-
cation of somata of fluorescently labeled neurons selected for laser capture microdissection. Blue dots with yellow labels indicate the center
of a selected area used for laser capture. Scale bar, 20 mm. D, An electrophoresis image showing PCR amplification end products for the
DCX, CaMKIIa, and b -actin genes. Note the high expression of neuronal markers in fluorescently labeled neurons compared with a total
liver RNA sample where DCX and CaMKIIa were not detected. M, Molecular marker; NTC, nontemplate control.
their morphology (Fig. 4B). The somata of labeled neurons extra step to potentially reduce RNA quality, and therefore
were quickly identified and laser captured before being we expect that we can achieve the isolation of RNA in
photo-bleached by excitation light. Figure 4C shows fluo- good quality, which is a requirement for the successful
rescence images from sections before and after laser qPCR amplification described above. To confirm this ex-
capture microdissection, which demonstrates the specific pectation, we laser captured individual neurons in the
removal of the fluorescence signals in the somata of sin- granule cell layer one by one and pooled 5000 cells in
gle neurons while maintaining surrounding tissue intact. each sample. Then we evaluated RNA integrity using
Agilent RNA 6000 Pico Kit and 2100 Bioanalyzer
(Schroeder et al., 2006). As described above, the yield of
Successful cDNA preparation and qPCR analysis RNA collected from 100 to 300 cells was sufficient for
We pooled 150 and 300 laser-captured, single neuronal successful downstream qPCR analysis but does not meet
somata and extracted RNA. From these neuronal somata, the minimum sample requirement for the RNA quality test.
we acquired 350 and 900 pg of RNA samples, respec- Therefore, we used larger samples by pooling 5000 cells
tively. These yields of RNA are sufficient for reverse tran- for this analysis.
scription and cDNA amplification using the GeneChip WT As shown in the electrophoresis images and electro-
Pico Kit, which requires a minimum of a 100 pg sample pherogram in Figure 5, two distinct bands of 18S and 28S
input. We used 270 pg of RNA as the sample input and ribosomal RNA were detected. RNA integrity numbers for
acquired a yield of 77.8 mg of cRNA and 19.1 mg of single- two samples reached 7.5 and 7.2 (Schroeder et al., 2006).
strand cDNA (ss-cDNA). qPCR amplification of the cDNA These values indicate a good quality of RNA, which is typ-
for a housekeeping gene, b -actin, showed an amplicon at ically obtained by laser capture methods and is sufficient
the expected molecular size on agarose gel electrophore- for downstream qPCR and transcriptomic applications
sis (Fig. 4D). This result shows that the method for tissue (Butler et al., 2016; Ong et al., 2020). Thus, we validated
processing and microdissection yields sufficient quality of that our hydration, laser capture, and RNA isolation
RNA for downstream qPCR analysis. According to the method produce good-quality RNA.
manufacturer instruction, the cDNA yield we acquired is
also sufficient for a potential application to perform micro-
array analysis (e.g., Whole-Transcriptome Array, Specificity of microdissection
Affymetrix). Using another sample of cDNA prepared in The specificity for microdissection of single neuronal
the same way, we confirmed that the successful laser somata can be an issue since a targeted cell and its
capture collection of neurons by the amplification of the neighboring cells are often in close proximity. In addition,
CaMKIIa (for excitatory neurons) and DCX (for newborn the typical thickness of brain sections (10–15 mm) used for
neurons; Fig. 4D). laser capture microdissection allows multiple neuronal
soma overlap in z-direction. Therefore, a certain degree of
contamination during the isolation is unavoidable. To
Evaluation of RNA quality evaluate specificity of microdissection, we examined YFP
Our method uses conventional freezing, dehydration, gene expression in visually identified YFP1 neurons and
laser capture, and RNA isolation procedures. There is no YFP cells. For this experiment, we used POMC-ChR2-
September/October 2021, 8(5) ENEURO.0275-20.2021 eNeuro.orgResearch Article: Methods/New Tools 7 of 11
Figure 5. RNA quality assay. A, Electrophoresis images of RNA samples. Clear bands of 18S and 28S ribosomal RNAs are visible.
Ladder: 0.2, 0.5, 1.0, 2.0, 4.0, and 6.0 kb. B, Electropherogram showing the distinct peaks of 18S and 28S ribosomal RNAs. FU,
Fluorescence unit; Pink and thick green solid lines, baseline for 18S and 20S peaks, respectively; thin green solid line: overall
baseline.
YFP mice that express ChR2-YFP in ;10% of granule prepared four samples each for control and NR1 knock-
cells in the dentate gyrus. YFP1 granule cells and neigh- out. Extracted RNA was reverse transcribed and am-
boring YFP cells were individually captured (Fig. 6A). plified into cDNA with a GeneChip WT Pico Kit. The
The identity of YFP cells was not confirmed, but most of amplification yielded 63, 101, 203, and 197 mg (control),
them are likely granule cells because we selected them and 62, 102, 178, and 210 mg (NR1 knockout) of cRNA;
from the granule cell layer. Approximately 300 cells were and 14.4, 15.2, 14.4, and 14.5 mg (control), and 14, 15.6,
pooled for each sample of YFP1 and YFP neurons. 14.6, and 14,5 mg (NR1 knockout) of ss-cDNA. qPCR
Collected RNA was reverse transcribed and amplified into analysis showed a 92.2 6 11.0% reduction of the NR1
cDNA with GeneChip WT Pico Kit. The amplification yield gene in the NR1 knock-out neurons compared with the
of 107 mg (YFP1) and 102 mg (YFP ) of cRNA and 16.9 mg control neurons (Fig. 7D,E), validating the successful re-
(YFP1) and 16.6 mg (YFP ) of ss-cDNA. From the ampli- moval of the NR1 gene in Cre-expressing granule cells.
fied cDNA, the amount of YFP mRNA was quantified by
qPCR. The result indicates there was as little as 10% of
YFP mRNA in YFP cells compared with the amount in
Discussion
In this study, we demonstrated that genetic labeling with
neighboring YFP1 granule cells (Fig. 6B), indicating high
fluorescent proteins fused to transmembrane proteins allows
specificity in microdissection of single neuronal somata.
for the selective collection of genetically labeled fluorescent
neurons using laser capture microdissection. Fluorescent
Application of the technique to validate retrovirus- proteins fused to transmembrane proteins preserve fluores-
mediated single-cell gene knockout cence signals in sections prepared from freshly frozen brains
Virus-mediated expression of Cre recombinase has after the standard tissue-processing procedure for laser cap-
been used to achieve sparse, single-cell gene knockout ture microdissection. Stable fluorescence signals allowed us
(Tashiro et al., 2006a,b). Validation of such sparse gene to distinguish neurons from non-neuronal cells and laser cap-
knockout is not straightforward because unaffected wild- ture hundreds of neurons easily. We successfully isolated
type cells are intermixed. We applied our method of laser RNA from the collected neuronal somata and determined
capture microdissection with fluorescent proteins fused that ;100 cells are sufficient to obtain samples required for
to transmembrane proteins to validate that such virus- downstream applications such as qPCR and DNA microarray
mediated single-cell gene knockout affects the expres- analysis.
sion of a target gene. Compared with conventional protocols of laser capture
We used transgenic mice with the floxed NR1 gene, in microdissection, observation and selection of fluores-
which the expression of Cre recombinase results in the cently labeled cells are the only additional step. This addi-
deletion of NR1 gene (also called GluN1) encoding a sub- tional step can be easily performed as far as a genetic
unit of NMDA receptor (Tashiro et al., 2006a). We injected method is available to label a cell type of interest with fluores-
these mice with a bicistronic retroviral vector expressing cent proteins fused to transmembrane proteins. While this re-
YFP-fused enhanced halorhodopsin and Cre (RV-CAG- quirement may be a practical limitation for some applications,
eNpHR3.0-YFP-IRES-Cre) to knock out the NR1 gene. recent popularity in the use of optogenetic transmembrane
For control, transgenic mice were injected with a retrovi- proteins (Deisseroth et al., 2006; Pastrana, 2011; Pathak et
ral vector expressing YFP-fused enhanced halorhodop- al., 2013), which are often fused to fluorescent proteins, low-
sin only. The vector constructs were described in Figure ers a hurdle for this requirement. Plenty of transgenic and
7A. Brain sections were prepared 11 d after virus injec- viral tools expressing channelrhodopsin or halorhodopsin
tion (Fig. 7B,C). For each sample, we captured .100 are available commercially and/or from public depositories
YFP1 neurons and pooled them for RNA extraction. We such as Addgene (http://www.addgene.org), which makes
September/October 2021, 8(5) ENEURO.0275-20.2021 eNeuro.orgResearch Article: Methods/New Tools 8 of 11 Figure 6. Evaluation of specific RNA collection from neurons targeted by laser capture microdissection. A, Images of brain sections sparsely containing YFP1 neurons in the dentate gyrus. The brain sections were prepared from Pomc-ChR2-YFP mice. YFP1 neu- rons (top) and their neighboring YFP cells (bottom) were visually selected for microdissection (red dotted ovals). Scale bar, 20 mm. B, Relative amount of YFP RNA in YFP1 neurons and their neighboring YFP cells, quantified by qPCR analysis. it relatively easy to express fluorescent proteins fused to fluorescence signals, but no regular or membrane-tar- transmembrane proteins in any neuronal (or other cell) geted protein does. However, it is known that freeze– types of interest. thaw cycles damage the plasma membrane, and that We showed that fluorescent proteins fused to three dif- soluble proteins, such as hemoglobin, are released ferent types of transmembrane proteins, ChR2, eNpHR, from cells (Lovelock, 1953). Regular cytoplasmic fluo- and TRPV2, can preserve fluorescence signals. ChR2 and rescent proteins are likely to diffuse out from cell bodies TRPV2 are ion channels formed by multiple subunits with in this way. Transmembrane proteins are anchored multiple transmembrane regions. eNpHR is an ion pump, tightly with and may stay with the plasma membrane, but its structure is similar to that of ChR2. Thus, it is im- while the link with membrane-targeted fluorescent pro- portant to note that we tested relatively similar types of tein might not be strong enough to keep them associ- transmembrane proteins; therefore, it is not clear how ated with the membrane. much our result would be extended to other types of To validate the specificity of the RNA collection from transmembrane proteins, for example, those with a single selected cells, we used transgenic mice expressing transmembrane domain. ChR2-YFP and laser-captured YFP1 and YFP cells We do not know why fluorescent proteins fused to separately. qPCR analysis showed a 10-fold difference those three transmembrane proteins can preserve in the amount of YFP mRNA between YFP1 and YFP Figure 7. Validation of retrovirus-mediated, single-cell gene knockout in adult-born neurons in the dentate gyrus. A, Schematic structures of the viral vector genomes. B, Experimental time line. C, Images of the dentate gyrus of floxed NR1 mice, which was in- jected with a bicistronic retroviral vector expressing eNpHR3.0-YFP and Cre. Scale bar, 50 mm. D, qPCR amplification end products in gel electrophoresis. M, Molecular marker; KO, NR1 knock-out neurons with Cre expression; Control, control neurons without Cre expression; NTC, nontemplate control. E, qPCR quantification of NR1 RNA in Cre-expressing (KO) and control adult-born neurons. Note the ;92% reduction in Cre-expressing neurons. September/October 2021, 8(5) ENEURO.0275-20.2021 eNeuro.org
Research Article: Methods/New Tools      9 of 11

cells, demonstrating the high specificity of RNA collection         “subjective” classification criteria. For this purpose, one
using this method, although a small amount of contamina-            needs to apply a subjective morphological classification and
tion from neighboring cells may not be avoidable.                   to perform gene expression analysis of those neuronal types
   We applied this method to demonstrate the effect of              using our method. If the two neuronal types have a clear dif-
gene removal by viral expression of Cre recombinase in              ference in gene expression, one can conclude that they are
floxed NR1 mice. A bicistronic viral vector expressing              two different neuronal types. If they do not have a difference
eNpHR-YFP and Cre was injected into the dentate gyrus               in gene expression, one can conclude that they may not be
of adult mice, and we laser captured YFP1 cells. The                different neuronal types. Furthermore, if some genes are ex-
amount of NR1 mRNA in these YFP1 cells was reduced                  pressed only in one of two neuronal types, one can use
by up to 92% compared with wild-type neurons. Thus,                 them as a marker for the neuronal type, which would make it
this experiment provides an example of successfully ap-             easier to further confirm and use the classification in future
plying the technique to an actual experiment. This method           studies. When it is difficult to make clear morphological cri-
would be useful for similar experimental needs in validat-          teria, one can test multiple subjective criteria. When the cri-
ing single-cell genetic manipulations (Zong et al., 2005;           teria separate two neuronal types better, the difference in
Judkewitz et al., 2009; Luo et al., 2016; Kaneko, 2017;             gene expression would be clearer. Based on this idea,
Nishiyama et al., 2017).                                            one determines the best version of morphological classi-
   One useful application of this method would be to ex-            fication in terms of a difference in gene expression. Our
amine gene expression in different neuronal types. This             method should be helpful to provide such tentative clas-
sort of gene expression study has been successfully                 sification of neuronal subtypes based on morphology
performed using genetic labeling with regular cytoplas-             with an independent basis/rationale in terms of gene
mic fluorescent proteins and fluorescent-based sorting.             expression.
However, genetic labeling often marks multiple neuro-                  Related to the importance of morphological visualiza-
nal types and/or other cell types (van Praag et al., 2002;          tion, fluorescent proteins fused to transmembrane have
Balthasar et al., 2004; Lagace et al., 2007; Harris et al.,         an additional advantage. Compared with cytosolic fluo-
2014), which makes it difficult to achieve RNA collection           rescent proteins, fluorescent proteins fused to transmem-
from a single neuronal type. For example, while the ex-             brane fluorescence proteins are distributed along cellular
pression of parvalbumin is often used to genetically define         membranes and visualize small processes better than cy-
a subtype of interneurons, it is well known that parvalbumin-       tosolic fluorescent proteins (Moriyoshi et al., 1996; Fig.
expressing interneurons contain multiple neuronal types de-         2B). Such clearer visualization of dendritic morphology fa-
fined morphologically, including basket cells and axo-axonic        cilitates the identification of neuronal types.
cells (Hu et al., 2014; Nassar et al., 2015). In the conventional      In addition to gene expression profiling, laser capture col-
fluorescence-based sorting, these neuronal types cannot be          lection of a selective neuronal population may be applied to
separated. However, using our method, one should be able            different types of genomic analyses. Such applications in-
to separately laser capture these two morphologically dis-          clude chromatin immunoprecipitation sequencing (seq) to
tinct neuronal types and to analyze the gene expression of          identify binding sites for DNA-binding proteins (Park, 2009),
each neuronal type. One caveat for this application is a re-        the assay for transposase-accessible chromatin-seq to map
quirement of relatively sparse labeling to allow for visualiza-     chromatin accessibility (Buenrostro et al., 2013), and ChIA-
tion of the dendrites of individual neurons. For example, in        PET, Hi-C, and HiChip to examine tridimensional chromatin
Pomc-ChR2-YFP mice that we used in this study, ;10% of              conformation (Fullwood and Ruan, 2009; van Berkum et al.,
granule cells express ChR2-YFP (Uemura et al., 2021), and           2010; Mumbach et al., 2016).
we can clearly observe their dendrites (Fig. 2C). However, in          Our study demonstrated the stability of fluorescence
another line of Pomc-ChR2-YFP mice that we used in a dif-           signals of fluorescent proteins fused to transmembrane
ferent study, nearly all granule cells express ChR2-YFP, the        proteins, which allows for selectively collecting a cell type
whole molecular layer of the dentate gyrus, which is occu-          of interest with laser capture microdissection. We vali-
pied by granule cell dendrites, are filled with YFP fluores-        dated that the RNA sample isolated with this method is
cence (Åmellem et al., 2021). In this case, we cannot               suitable for downstream gene expression analysis experi-
visualize the dendritic morphology of individual neurons.           ments such as qPCR. The isolation of single neurons is
Therefore, not all fluorescence-labeling methods work for           specific with minimum contamination from neighboring
                                                                    cells. This methodology provides a novel alternative ap-
this approach, and one may need to select a method for rel-
                                                                    proach for gene expression analysis targeting a specific
atively sparse labeling (Zong et al., 2005; Badea et al., 2009;
                                                                    neuronal/cell type, which is especially advantageous
Judkewitz et al., 2009; Luo et al., 2016; Kaneko, 2017;
                                                                    when the specificity of genetic labeling is not sufficient
Nishiyama et al., 2017).
                                                                    and additional selection based on morphology is
   Some morphological classification of neuronal types is
                                                                    required.
largely subjective, which may make it difficult to reach
agreement on classification among individual research-
ers. Or even if they are visually clearly distinguishable,          References
there is no common ground for judging whether they                  Åmellem I, Yovianto G, Chong HT, Nair RR, Cnops V, Thanawalla A,
should be classified as separate neuronal types. We                  Tashiro A (2021) Role of NMDA receptors in adult neurogenesis
believe that our method could provide a solution for this            and normal development of the dentate gyrus. eNeuro 8:
issue by giving an independent rationale for such                    ENEURO.0566-20.2021.

September/October 2021, 8(5) ENEURO.0275-20.2021                                                                           eNeuro.org
Research Article: Methods/New Tools 10 of 11 Badea TC, Hua ZL, Smallwood PM, Williams J, Rotolo T, Ye X, Kitanishi T, Ujita S, Fallahnezhad M, Kitanishi N, Ikegaya Y, Tashiro A Nathans J (2009) New mouse lines for the analysis of neuronal (2015) Novelty-induced phase-locked firing to slow gamma oscil- morphology using CreER(T)/loxP-directed sparse labelling. PLoS lations in the hippocampus: requirement of synaptic plasticity. One 4:e7859. Neuron 86:1265–1276. Balthasar N, Coppari R, McMinn J, Liu SM, Lee CE, Tang V, Kenny Lagace DC, Whitman MC, Noonan MA, Ables JL, DeCarolis NA, CD, McGovern RA, Chua SC Jr, Elmquist JK, Lowell BB (2004) Arguello AA, Donovan MH, Fischer SJ, Farnbauch LA, Beech RD, Leptin receptor signaling in POMC neurons is required for normal DiLeone RJ, Greer CA, Mandyam CD, Eisch AJ (2007) Dynamic body weight homeostasis. Neuron 42:983–991. contribution of nestin-expressing stem cells to adult neurogenesis. Bonner RF, Emmert-Buck M, Cole K, Pohida T, Chuaqui R, J Neurosci 27:12623–12629. Goldstein S, Liotta LA (1997) Laser capture microdissection: mo- Lovelock JE (1953) The haemolysis of human red blood-cells by lecular analysis of tissue. Science 278:1481, 1483. freezing and thawing. Biochim Biophys Acta 10:414–426. Buenrostro JD, Giresi PG, Zaba LC, Chang HY, Greenleaf WJ (2013) Luo W, Mizuno H, Iwata R, Nakazawa S, Yasuda K, Itohara S, Transposition of native chromatin for fast and sensitive epigenom- Iwasato T (2016) Supernova: a versatile vector system for sin- ic profiling of open chromatin, DNA-binding proteins and nucleo- gle-cell labeling and gene function studies in vivo. Sci Rep some position. Nat Methods 10:1213–1218. 6:35747. Butler AE, Matveyenko AV, Kirakossian D, Park J, Gurlo T, Butler PC Madisen L, Mao T, Koch H, Zhuo JM, Berenyi A, Fujisawa S, Hsu (2016) Recovery of high-quality RNA from laser capture microdis- YW, Garcia AJ, Gu X, Zanella S, Kidney J, Gu H, Mao Y, Hooks sected human and rodent pancreas. J Histotechnol 39:59–65. BM, Boyden ES, Buzsáki G, Ramirez JM, Jones AR, Svoboda K, Chatzi C, Zhang Y, Hendricks WD, Chen Y, Schnell E, Goodman RH, Han X, et al. (2012) A toolbox of Cre-dependent optogenetic trans- Westbrook GL (2019) Exercise-induced enhancement of synaptic genic mice for light-induced activation and silencing. Nat Neurosci function triggered by the inverse BAR protein, Mtss1L. Elife 8: 15:793–802. e45920. Moriyoshi K, Richards LJ, Akazawa C, O’Leary DD, Nakanishi S Daigle TL, Madisen L, Hage TA, Valley MT, Knoblich U, Larsen RS, (1996) Labeling neural cells using adenoviral gene transfer of Takeno MM, Huang L, Gu H, Larsen R, Mills M, Bosma-Moody A, membrane-targeted GFP. Neuron 16:255–260. Siverts LA, Walker M, Graybuck LT, Yao Z, Fong O, Nguyen TN, Mumbach MR, Rubin AJ, Flynn RA, Dai C, Khavari PA, Greenleaf Garren E, Lenz GH, et al. (2018) A suite of transgenic driver and re- WJ, Chang HY (2016) HiChIP: efficient and sensitive analysis of porter mouse lines with enhanced brain-cell-type targeting and protein-directed genome architecture. Nat Methods 13:919– functionality. Cell 174:465–480.e22. 922. Deisseroth K, Feng G, Majewska AK, Miesenböck G, Ting A, Nassar M, Simonnet J, Lofredi R, Cohen I, Savary E, Yanagawa Y, Schnitzer MJ (2006) Next-generation optical technologies for illu- Miles R, Fricker D (2015) Diversity and overlap of parvalbumin and minating genetically targeted brain circuits. J Neurosci 26:10380– somatostatin expressing interneurons in mouse presubiculum. 10386. Front Neural Circuits 9:20. Emmert-Buck MR, Bonner RF, Smith PD, Chuaqui RF, Zhuang Z, Nishiyama J, Mikuni T, Yasuda R (2017) Virus-mediated genome ed- Goldstein SR, Weiss RA, Liotta LA (1996) Laser capture microdis- iting via homology-directed repair in mitotic and postmitotic cells section. Science 274:998–1001. in mammalian brain. Neuron 96:755–768. Fend F, Raffeld M (2000) Laser capture microdissection in pathology. Ong CJ, Tan QX, Lim HJ, Shannon NB, Lim WK, Hendrikson J, Ng J Clin Pathol 53:666–672. WH, Tan JWS, Koh KKN, Wasudevan SD, Ng CCY, Rajasegaran Fullwood MJ, Ruan Y (2009) ChIP-based methods for the identifica- V, Lim TKH, Ong CK, Kon OL, Teh BT, Tan GHC, Chia CS, Soo tion of long-range chromatin interactions. J Cell Biochem 107:30– KC, Teo MCC (2020) An optimised protocol harnessing laser cap- 39. ture microdissection for transcriptomic analysis on matched pri- Harris JA, Hirokawa KE, Sorensen SA, Gu H, Mills M, Ng LL, Bohn P, mary and metastatic colorectal tumours. Sci Rep 10:682. Mortrud M, Ouellette B, Kidney J, Smith KA, Dang C, Sunkin S, Park PJ (2009) ChIP–seq: advantages and challenges of a maturing Bernard A, Oh SW, Madisen L, Zeng H (2014) Anatomical charac- technology. Nat Rev Genet 10:669–680. terization of Cre driver mice for neural circuit mapping and manip- Pastrana E (2011) Optogenetics: controlling cell function with light. ulation. Front Neural Circuits 8:76. Nat Methods 8:24–25. Ho H, Both M, Siniard A, Sharma S, Notwell JH, Wallace M, Leone Pathak GP, Vrana JD, Tucker CL (2013) Optogenetic control of cell DP, Nguyen A, Zhao E, Lee H, Zwilling D, Thompson KR, function using engineered photoreceptors. Biol Cell 105:59–72. Braithwaite SP, Huentelman M, Portmann T (2018) A guide to sin- Reichard A, Asosingh K (2019) Best practices for preparing a single gle-cell transcriptomics in adult rodent brain: the medium spiny cell suspension from solid tissues for flow cytometry. Cytometry A neuron transcriptome revisited. Front Cell Neurosci 12:159. 95:219–226. Hu H, Gan J, Jonas P (2014) Interneurons. Fast-spiking, parvalbumin1 Rossner MJ, Hirrlinger J, Wichert SP, Boehm C, Newrzella D, GABAergic interneurons: from cellular design to microcircuit function. Hiemisch H, Eisenhardt G, Stuenkel C, von Ahsen O, Nave KA Science 345:1255263. (2006) Global transcriptome analysis of genetically identified neu- Hussain RZ, Miller-Little WA, Doelger R, Cutter GR, Loof N, Cravens rons in the adult cortex. J Neurosci 26:9956–9966. PD, Stüve O (2018) Defining standard enzymatic dissociation Schroeder A, Mueller O, Stocker S, Salowsky R, Leiber M, Gassmann G, methods for individual brains and spinal cords in EAE. Neurol Lightfoot S, Menzel W, Granzow M, Ragg T (2006) The RIN: an RNA in- Neuroimmunol Neuroinflamm 5:e437. tegrity number for assigning integrity values to RNA measurements. Jiang W, Hunter T (1998) Analysis of cell-cycle profiles in transfected BMC Mol Biol 7:3. cells using a membrane-targeted GFP. Biotechniques 24:348– Singh S, Wang L, Schaff DL, Sutcliffe MD, Koeppel AF, Kim J, 354. Onengut-Gumuscu S, Park K-S, Zong H, Janes KA (2019) In situ Judkewitz B, Rizzi M, Kitamura K, Häusser M (2009) Targeted single- 10-cell RNA sequencing in tissue and tumor biopsy samples. Sci cell electroporation of mammalian neurons in vivo. Nat Protoc Rep 9:4836. 4:862–869. Tashiro A, Sandler VM, Toni N, Zhao C, Gage FH (2006a) NMDA-re- Kaneko T (2017) Genome editing in mouse and rat by electropora- ceptor-mediated, cell-specific integration of new neurons in adult tion. In: Genome editing in animals (Hatada I, eds), pp 163081– dentate gyrus. Nature 442:929–933. 163089. New York: Springer. Tashiro A, Zhao C, Gage F (2006b) Retrovirus-mediated single-cell Kalejta RF, Shenk T, Beavis AJ (1997) Use of a membrane-localized gene knockout technique in adult newborn neurons in vivo. Nat green fluorescent protein allows simultaneous identification of Protoc 1:3049–3055. transfected cells and cell cycle analysis by flow cytometry. Tashiro A, Zhao C, Suh H, Gage FH (2015a) Purification and injection Cytometry 29:286–291. of retroviral vectors. Cold Spring Harb Protoc 2015:925–931. September/October 2021, 8(5) ENEURO.0275-20.2021 eNeuro.org
Research Article: Methods/New Tools       11 of 11

Tashiro A, Zhao C, Suh H, Gage FH (2015b) Imaging newborn gran-        van Praag H, Schinder AF, Christie BR, Toni N, Palmer TD, Gage FH
  ule cells in fixed sections. Cold Spring Harb Protoc 2015:932–933.     (2002) Functional neurogenesis in the adult hippocampus. Nature
Tsien JZ, Huerta PT, Tonegawa S (1996) The essential role of hippo-      415:1030–1034.
  campal CA1 NMDA receptor-dependent synaptic plasticity in spa-       Xia N, Fang F, Zhang P, Cui J, Tep-Cullison C, Hamerley T, Lee HJ,
  tial memory. Cell 87:1327–1338.                                        Palmer T, Bothner B, Lee JH, Pera RR (2017) A knockin reporter al-
Uemura M, Blankvoort S, Tok SSL, Yuan L, Cobar LF, Lit KK, Tashiro A     lows purification and characterization of mDA neurons from heter-
  (2021) A neurogenic microenvironment defined by excitatory-inhibi-     ogeneous populations. Cell Rep 18:2533–2546.
  tory neuronal circuits in adult dentate gyrus. Cell Rep 36:109324.   Zhao C, Teng EM, Summers RG, Ming GL, Gage FH (2006) Distinct
van Berkum NL, Lieberman-Aiden E, Williams L, Imakaev M, Gnirke          morphological stages of dentate granule neuron maturation in the
  A, Mirny LA, Dekker J, Lander ES (2010) Hi-C: a method to study        adult mouse hippocampus. J Neurosci 26:3–11.
  the three-dimensional architecture of genomes. J Vis Exp 39:         Zong H, Espinosa JS, Su HH, Muzumdar MD, Luo L (2005) Mosaic
  e1869.                                                                 analysis with double markers in mice. Cell 121:479–492.

September/October 2021, 8(5) ENEURO.0275-20.2021                                                                               eNeuro.org
You can also read