Regulation of two insulin granule populations within the reserve pool by distinct calcium sources
←
→
Page content transcription
If your browser does not render page correctly, please read the page content below
Research Article 5873
Regulation of two insulin granule populations within
the reserve pool by distinct calcium sources
Mingming Hao1, Xia Li2, Mark A. Rizzo1, Jonathan V. Rocheleau1, Benoit M. Dawant2 and David W. Piston1,*
1
Department of Molecular Physiology and Biophysics, Vanderbilt University Medical Center, Nashville, TN 37232, USA
2
Department of Electrical Engineering and Computer Science, Vanderbilt University, Nashville, TN 37232, USA
*Author for correspondence (e-mail: dave.piston@vanderbilt.edu)
Accepted 9 September 2005
Journal of Cell Science 118, 5873-5884 Published by The Company of Biologists 2005
doi:10.1242/jcs.02684
Summary
Insulin granule trafficking is a key step of glucose- cytoskeletal network is involved in both types of granule
stimulated insulin secretion from pancreatic  cells. Using movement. The fast-moving granules are correlated
quantitative live cell imaging, we examined insulin granule temporally and spatially to the replacement of the secreted
movements within the reserve pool upon secretory insulin granules, which supports the hypothesis that these
stimulation in TC3 cells. For this study, we developed a granules are responsible for replenishing the readily
custom image analysis program that permitted automatic releasable pool. Our study provides a model by which
tracking of the individual motions of over 20,000 granules. glucose and other secretory stimuli can regulate the readily
This analysis of a large sample size enabled us to study releasable pool through the same mechanisms that regulate
micro-populations of granules that were not quantifiable in insulin secretion.
Journal of Cell Science
previous studies. While over 90% of the granules depend
on Ca2+ efflux from the endoplasmic reticulum for their
mobilization, a small and fast-moving population of Supplementary material available online at
granules responds to extracellular Ca2+ influx after http://jcs.biologists.org/cgi/content/full/118/24/5873/DC1
depolarization of the plasma membrane. We show that this
differential regulation of the two granule populations is Key words: Insulin, Granules, Calcium, Reserve pool, Pancreatic
consistent with localized Ca2+ signals, and that the beta cells
Introduction results in influx of Ca2+ through voltage-gated calcium
Pancreatic  cells play an essential role in glucose homeostasis channels (Berggren and Larsson, 1994). Ca2+ influx can also
by secreting insulin in response to a variety of stimuli, stimulate Ca2+ efflux from the endoplasmic reticulum (ER)
especially a rise in blood glucose levels. Insulin is stored in through a process called Ca2+-induced Ca2+ release (Lemmens
large dense-core secretory granules. Although an individual  et al., 2001). Despite its importance in glucose-stimulated
cell in a mouse islet contains over 10,000 granules (Dean, insulin secretion, the role of Ca2+ in granule mobilization
1973), only a small fraction (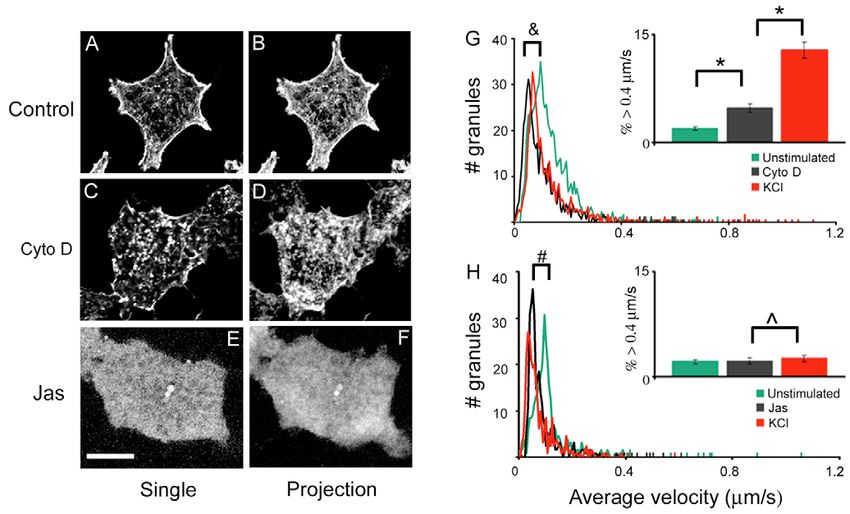
5874 Journal of Cell Science 118 (24)
long distances, limits the analysis to a small fraction of the N3 for ECFP using BamHI and BsrGI restriction sites. The proinsulin-
granules, and is susceptible to bias from the observer-defined EYFP-DsRed construct was also made from proinsulin-ECFP by
granules selected for analysis. We addressed these issues by substitution of the EYFP coding sequence from pEYFP-N3 for ECFP
enabling observer-independent tracking of a large number of using the BamHI and BsrGI restriction sites. The cDNA sequence
fluorescently labeled granules in each cell. We developed encoding DsRed (pDsRed-C1) was then amplified by PCR (sense
primer: 5⬘-TAGGTACCATGGTGCGCTCC-3⬘; antisense primer 5⬘-
custom image analysis software utilizing two different tracking ATGGGCCCCTGAGCAGGAAC-3⬘) and inserted C-terminal to
algorithms designed to specifically track each type of granule EYFP using KpnI and ApaI restriction sites. ECFP-ER was from BD
movement (Li et al., 2004). Our analysis pool of over 20,000 Biosciences. Plasmid DNAs were introduced into TC3 and MIN6
granules allowed us to quantify population dynamics and cells suspended in Dulbecco’s PBS in a 2-mm gapped cuvette by ten
examine potential mechanisms. 50-second square-wave pulses of 300 V at 500-msecond intervals
In this study, we consider how granule mobilization from the with a BTX ECM830 electroporator (Holliston, MA). Transfected
reserve pool may contribute to the refilling of the RRP. Our cells were plated on glass-bottomed coverslip dishes (MatTek Corp.,
analysis quantifies two distinct populations of insulin granules Ashland, MA) in regular growth medium and switched to growth
within the reserve pool identifiable by their relative mobility. medium containing 2 mM glucose for 48 hours. Cells stably
We aimed to explore two questions: (1) are these two transfected with phogrin-EGFP were generated using G418
(Mediatech, Inc., Herndon, VA). Cells were equilibrated in BMHH
populations differentially regulated?; (2) what is the buffer (125 mM NaCl, 5.7 mM KCl, 2.5 mM CaCl2, 1.2 mM MgCl2,
significance of the fast-moving granules? Our results show that and 10 mM Hepes, and 0.1% BSA, pH 7.4) for 4 hours (basal,
the two populations respond differently to stimulation by unstimulated condition) prior to microscopy.
insulin secretagogues and are regulated by separate Ca2+
sources. Extracellular Ca2+ influx activates a small population
of fast-moving granules; intracellular Ca2+ efflux from the ER Fluorescence microscopy
initiates mobilization of the larger population of slow-moving Confocal fluorescence microscopy was performed using an Axiovert
granules. This differential regulation of the two granule 100M inverted microscope equipped with an LSM 510 laser scanning
populations appears to utilize localized distribution of spatially unit and a 63⫻ 1.4 NA plan Apochromat objective (Carl Zeiss, Inc.).
distinct Ca2+ pools. We also show that both granule populations A 40⫻ 1.3 NA plan Apochromat objective was used for FluoZin-3
Journal of Cell Science
experiments. 457, 488 and 514 nm argon and 543 nm helium-neon
require actin rearrangement and microtubule integrity for laser lines were used to excite ECFP, EGFP/Alexa Fluor 488/FluoZin-
movement. Finally, our data are consistent with the model that 3, EYFP, and DsRed, respectively. Emitted light was passed through
the fast-moving granules act as an intermediate pool to enable bandpass filters for collection of ECFP (470-510 nm), EGFP/Alexa
refilling of the RRP. Fluor 488/FluoZin-3 (505-530 nm), EYFP (530-550 nm) and a long-
pass filter (560 nm) was used for DsRed.
The secretion assay was performed with a Nikon TE300 inverted
Materials and Methods wide-field microscope equipped with a 40⫻ 1.3 NA plan Apochromat
Materials objective using a standard GFP filter combination. Images were
Fluorescent protein expression vectors were obtained from BD acquired with MetaMorph imaging software (Universal Imaging
Biosciences (Palo Alto, CA). DNA isolation reagents were from Corp., Downingtown, PA).
Qiagen (Valencia, CA). Restriction enzymes were obtained from New
England Biolabs (Beverly, MA). PCR primers were from Integrated
DNA Technologies (Coralville, IA). FluoZin-3, tubulin antibody, Immunofluorescent staining
jasplakinolide, Alexa Fluor 488 phalloidin and fluorescently labeled Cells were first fixed for 30 minutes with 4% paraformaldehyde in
secondary antibodies were obtained from Molecular Probes (Eugene, PBS at 4°C, permeabilized with 0.1% Triton X-100, and blocked with
OR). Guinea pig anti-insulin was obtained from Linco Research, 5% goat serum. For insulin detection, they were then stained with
Inc. (St Charles, MO). The phogrin construct was a generous guinea pig anti-insulin and Alexa Fluor 546-conjugated goat anti-
gift from John Hutton (University of Colorado, Denver, CO). S- guinea pig antibodies. Mouse ␣-tubulin and Alexa Fluor 488 goat anti-
(–)-1,4-dihydro-2,6-dimethyl-5-nitro-4-[2-(trifluoromethyl)phenyl]-3- mouse antibodies were used to detect microtubule distribution. Alexa
pyridinecarboxylic acid methyl ester (Bay K8644), 1,4-dihydro- Fluor 488 phalloidin was used to identify actin microfilaments.
2,6-dimethyl-4-(3-nitrophenyl)-3,5-pyridinedicarboxylic acid 2-
methoxyethyl 1-methylethyl ester (nimodipine), and all other
chemicals were from Sigma-Aldrich. Cell culture reagents were made Live cell imaging of granule movement
by the Media and Reagents Core of the Diabetes Research and Sequential images of TC3 cells expressing phogrin-EGFP were
Training Center at Vanderbilt University. taken for 2-6 minutes at 1-second intervals. A minimum laser power
that would give us a useful florescence signal was used and the laser
intensity was kept the same for all cells. Cellular phototoxicity caused
Cell culture by laser illumination was tested by mimicking acquisition conditions
TC3 cells secrete insulin in a regulated manner very similar, but not used in real experiments but using the buffer alone as the stimulus.
identical, to that of intact  cells (D’Ambra et al., 1990). TC3 cells Cells were first imaged for 2 minutes to establish the unstimulated
were maintained in sodium bicarbonate-buffered Dulbecco’s modified profile. A 20⫻ concentrated stock of stimulus was then added to the
Eagle’s medium (DMEM) containing 15% horse serum and 2.5% cells on the microscope stage. A final concentration of 20 mM
FBS, 5 mM glucose, 100 IU/ml penicillin, and 100 g/ml glucose, 30 mM KCl, 1 M Bay K8644, 5 M nimodipine, 2 M
streptomycin (Life Technologies, Inc.) in an atmosphere of 5% CO2. thapsigargin, 10 mM caffeine, 10 g/ml cytochalasin D, 1 M
MIN6 cells were cultured in similar DMEM supplemented with - jasplakinolide and 10 mM nocodazole was used. Cells were allowed
mercaptoethanol and 15% heat inactivated FBS. Generation of 2 minutes to react to glucose before the stimulated profile was
phogrin-EGFP was as previously described (Emmanouilidou et al., obtained. In the case of nocodazole, cytochalasin D, jasplakinolide
1999). Proinsulin-EGFP was made from proinsulin-ECFP (Rizzo et and thapsigargin, cells were treated for 20 minutes and a profile taken
al., 2002) by substitution of the EGFP coding sequence of pEGFP- before stimuli were added. All manipulations, as well as fluorescence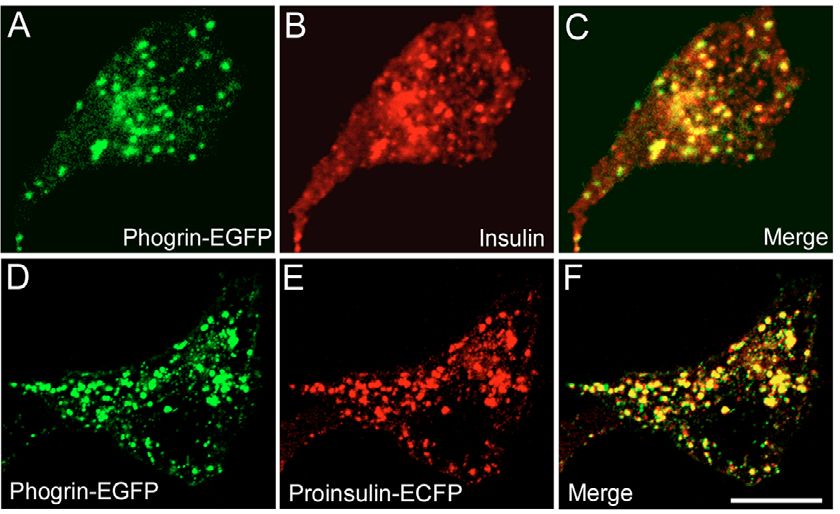
Insulin granule regulation by two Ca2+ pools 5875
microscopy, were done on the temperature-controlled microscope differential interference contrast image. The other group of cells,
stage maintained at 37°C using the Zeiss stage incubator. transfected with phogrin-EGFP, was used to monitor the granule
movement. Time series of granule movement were first taken before
and after adding glucose, and again after glucose wash-out. All time
Image analysis series were acquired for the same field of cells.
Summation projection of all background-corrected confocal slices
was produced using the MetaMorph imaging software (Universal
Imaging Corp., Downingtown, PA). The degree of bleed-through and Granule movement and pH measurement
colocalization between the channels was determined as described Cells were transfected with proinsulin-EYFP-DsRed. One image was
previously (Mallet and Maxfield, 1999; Mukherjee et al., 1999). To taken of EYFP and DsRed for the pH measurement of granules. The
obtain parameters for granule movement, images were first two channels were scanned alternately in a line-by-line fashion,
background corrected (Hao and Maxfield, 2000) using MetaMorph having only one laser line and one detector channel on at each time.
before running through imaging analysis software developed by Li Focusing was done using the DsRed channel, which would result in
et al. (Li et al., 2004). The individual granules are identified ~0.1% photobleaching of DsRed (Baird et al., 2000). A time series
automatically by filtering the images to reduce the noise with wiener was then acquired with only the DsRed channel to measure granule
and median filters, thresholding the images with a combination of movement. To verify pH dependency of proinsulin-EYFP-DsRed,
optimum single and double threshold algorithms, and further cells expressing the construct were fixed with paraformaldehyde and
eliminating spurious points with morphological operations. Two permeabilized with Triton X-100. In situ images were taken of cells
different tracking algorithms were used to track each type of granule incubated with PBS and adjusted to pHs from 7.5 to 5.5 using
movement. Each granule was first subjected to a simple tracking predetermined amounts of HCl. The fluorescence ratio of
algorithm that detected the overlapping regions between successive EYFP/DsRed at each pH was normalized to that at 7.5 in order to pool
frames. If such a region was found, the algorithm would record the the results from different cells. Furthermore, raising the pH with
granule’s position in the current frame. This algorithm worked well NH4Cl caused an increase in the fluorescence ratio of EYFP/DsRed
for the granules that moved short distances. If no overlapping region in live cells. Images of the same field of cells were taken using the
was found, the second tracking algorithm was activated. Briefly, the same settings before and after 30 mM NH4Cl was added. Fluorescence
program calculates parameters about each detected vesicle in the first intensity was normalized to that of the images before NH4Cl was
frame, including size, brightness, and position. Next, a simple linear added.
Journal of Cell Science
model is used to predict the position of the vesicle in the next frame.
Then, the image is segmented locally to find possible granules within
a box placed around the predicted location. When several potential Results
granules are detected within the box the most likely candidate is
chosen based on its size, intensity, and position. When a granule is Targeting phogrin-EGFP to insulin granules in TC3
lost, the tracking program performs analysis only for the frames in cells
which it showed a path. Before the program was applied to all the Visualization of  cell granules has been greatly enhanced by
granules, the output from our tracking software was first manually the utilization of fluorescent proteins targeted to secretory
inspected and then compared with that from Metamorph to ensure granules. Phogrin (phosphatase on granules of insulinoma
accuracy. Our tracking program out performs others by the fact that cells) is well established for the study of granule dynamics in
it not only traces granules with high accuracy, it can track many
granules simultaneously and automatically.
pancreatic  cells because of its specialized localization to the
The mean-square displacement (MSD) was calculated using the insulinoma dense-core granule membranes (Pouli et al., 1998;
following equation (Qian et al., 1991): Wasmeier and Hutton, 1996). We fused phogrin with enhanced
green fluorescent protein (EGFP). To examine whether
N–n phogrin-EGFP, in a stably transfected TC3 cell line, was
冱 {[x(j␦t+n␦t) – x(j␦t)]
1
MSD(n␦t) = 2 targeted to insulin secretory granules, the localization of
N–n phogrin-EGFP was compared with that of immunostained
j=1
+ [y(j␦t+n␦t) – y(j␦t)]2} , insulin. Fig. 1A-C shows that most phogrin-EGFP-labeled
granules contained insulin. In order to avoid artifacts created
where ␦t is the time interval at which images were taken, x(t) and y(t) by the immunofluorescence procedure, we also looked at live
are the coordinates of a granule at time t, and N is the total number cells containing both phogrin-EGFP and an enhanced cyan
of images in a recording. n and j are positive integers with n=1, 2, … , fluorescent protein (ECFP) construct that was targeted to the
(N-1).
interior of secretory granules by the connecting peptide
segment of the murine proinsulin II (proinsulin-ECFP)
Granule movement under different insulin secretion conditions (Watkins et al., 2002; Rizzo et al., 2002). As shown in Fig. 1D-
TC3 cells were plated at a low density and cultured for 3 days after F, phogrin-EGFP colocalized very well with the co-transfected
transfection. A cluster of cells was used to produce a detectable proinsulin-ECFP, with >95% of the phogrin-EGFP-labeled
amount of secreted insulin and Zn2+. Two identical groups of cells granules also containing proinsulin-ECFP. These results
were used for this experiment. One group was used to monitor insulin indicate that most of the phogrin-EGFP expressed in TC3
release using sequential images taken in the presence of 2 M cells was efficiently targeted to the insulin secretory granules.
FluoZin-3 before and after adding glucose. The cells were then
washed three times and incubated for 1 hour in glucose-free buffer,
which was then replaced with fresh glucose-free buffer containing Two types of granule movement upon stimulation
FluoZin-3. A time series was taken after glucose washout. As a
control for autofluorescence and focal plane drift, fluorescence in the Insulin is released from  cells in response to various
extracellular medium was monitored in the absence of FluoZin-3 extracellular stimuli. Of the secretagogues used in this study,
while glucose was added as before. Fluorescence was quantified in KCl causes the largest stimulation of insulin secretion in TC3
three small regions in the extracellular medium as determined by the cells and also the most dramatic change in intracellular granule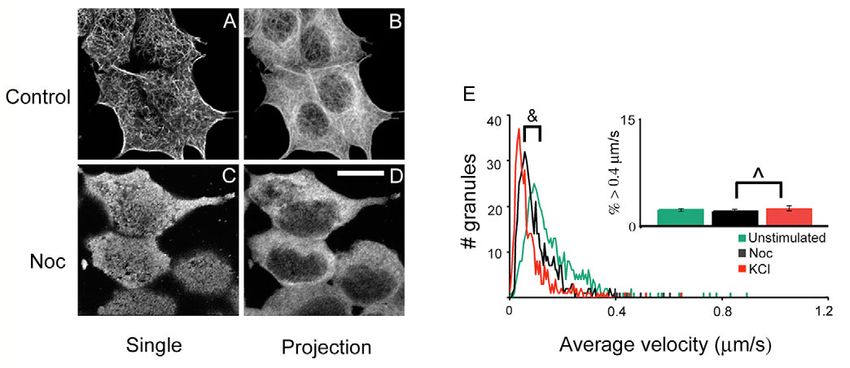
5876 Journal of Cell Science 118 (24)
movement. Sequential images of cells expressing
phogrin-EGFP were taken to examine granule
dynamics in pancreatic  cells. Fig. 2 shows three
frames from a representative set of sequential
images taken of the same cell. Several granules
were selected from each panel (Fig. 2A-C) and
their positions were tracked through 30 frames
(the corresponding lower panels in Fig. 2D-F).
The accompanying time-lapse movie can be seen
in the supplementary material. Most granules
display small, confined movements under basal,
unstimulated conditions (Fig. 2D). Adding KCl
caused a slowing down in the overall granule
dynamics (Fig. 2E). However, a small population
(~8%) of granules underwent much longer
excursions (Fig. 2F). Similar results were obtained
using another  cell line, MIN6 (Table 1). Table
1 lists the changes in granule mobility under all
Fig. 1. Phogrin-EGFP is effectively targeted to the insulin granules in TC3 cells. the experimental conditions used in this study.
(A-C) Cells stably transfected with phogrin-EGFP were plated for 48 hours and Our granule tracking analysis shows that the two
then immunostained with an insulin antibody and an Alexa Fluor 546 secondary subsets of granules respond differently to
antibody. (D-F) Cells were co-transfected with phogrin-EGFP and proinsulin- stimulation. Two distinct types of motion were
ECFP (pseudocolored red). Measures were taken to minimize and correct for observed with KCl (Fig. 2E,F). In order to take a
crossover fluorescence. Bar, 10 m. closer look at each population, we used histograms
to segment the granules according to their
Journal of Cell Science
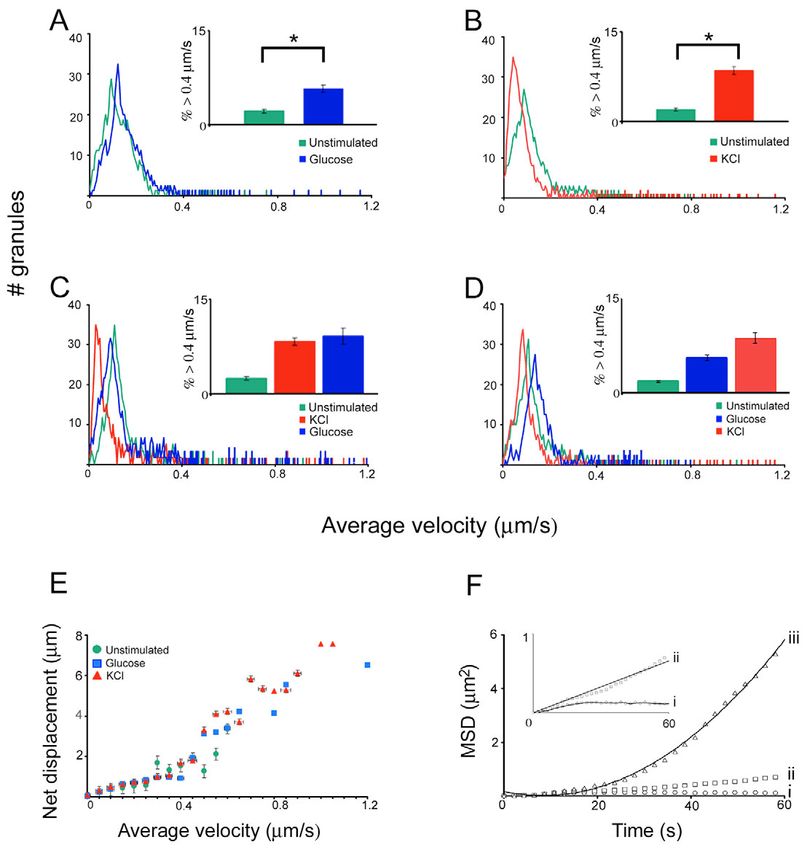
movement (Fig. 3). The peaks in the histograms
Table 1. Insulin granule dynamics in pancreatic  cells represent the slow-moving population. The percentage of fast-
% Change %
moving granules is shown as bar graphs in the inset of each
in granule >0.4 m/ No. of No. of panel. For this study, the fast-moving population was defined as
Treatment movement second cells granules granules with speeds >0.4 m/second, which was at least two
Unstimulated 0 2.1±0.3 21 1138 standard deviations above the average speed (118.3±10.6 to
Photo damage f 3.6±0.7 2.4±0.6 12 646 286±27.5 nm/second) under all conditions. In unstimulated
Glucose F 10.1±1.1 5.8±0.6 16 681 cells, the fast-moving population accounted for only 2.1±0.3%
KCl f 34.9±2.9 8.5±0.7 26 1590 of the total granules. This number increased to 5.8±0.6% and
Glucose+KCl f 12.8±1.4 8.8±0.9 18 756
KCl+glucose f 17.1±2.0 9.2±1.3 11 623 8.5±0.7% when glucose and KCl, respectively, was added (Fig.
Bay K8644 F 11.6±1.2 7.2±1.1 8 424 3A,B, Table 1). To see if glucose had any further effect on the
Glucose+nimodipine f 10.8±1.3 2.1±0.8 8 419 two granule populations segregated by KCl, we included
Glucose+thapsigargin f 20.5±3.4 4.7±0.7 10 429 glucose before and after KCl was added (Fig. 3C,D). Although
Glucose+thapsigargin+KCl f 35.3±4.0 7.8±1.0 10 401
Caffeine F 13.4±2.1 3.2±0.6 9 467
an increase in the speed of the slow-moving granules was seen
Caffeine+KCl f 31.8±3.9 8.4±1.4 9 443 when glucose was present, the fraction of fast-moving granules
Nocodazole f 20.8±2.6 2.1±0.3 17 800 did not increase (Fig. 3C inset, red vs blue bars; compare Fig.
Nocodazole+KCl f 34.5±2.5 2.5±0.3 17 849 3D and B inset red bars, Table 1). These results indicate that
Cytochalasin D f 30.8±2.5 4.8±0.6 15 726 conditions other than ATP production are required to activate a
Cytochalasin D+KCl f 23.3±2.6 12.8±1.1 15 709
Jasplakinolide f 26.3±3.1 2.3±0.4 18 751 large fraction of granules to a more mobile state under KCl
Jasplakinolide+KCl f 30.5±2.5 2.6±0.4 18 738 stimulation.
Unstimulated, cell center* F 17.8±2.0 3.9±0.5 12 759 In addition to the average velocity, we characterized granule
KCl, cell center† f 21.8±2.3 5.2±0.7 12 706 motion using net displacement and mean-square displacement
Unstimulated, MIN6 0 4.5±0.5 13 984
KCl, MIN6 f 29.8±3.6 12.3±0.7 13 936
(MSD). First, we wanted to make sure that the granules with
higher velocities (fast-moving granules) were indeed the ones
TC3 cells were used for all treatments, but the effect of KCl was also that showed greater net displacements. As shown in Fig. 3E,
examined in MIN6 cells. there was correlation of speed and net displacement for
Intracellular movement of insulin granules was analyzed as described in the granules undergoing diffusion. More importantly, this panel
Materials and Methods. Granule movement was compared before and after a
stimulus was added in the same cell. For every condition, a percentage of shows that fast-moving granules were more likely to
change was first calculated in each cell and an average was then taken of all experience directed motion. To confirm this, we selected 20
the cells for the value listed as ‘% change in movement’. The granules imaged granules from each of the three speed intervals: 0.4 m/second, and
(cell periphery) except in experiments designed to look at granule movement
in the cell center.
characterized their motion using MSD. Granule movement
*Granule movement in the cell center versus cell periphery under could be classified into three types (Ivarsson et al., 2004):
unstimulated condition. caged motion, in which the MSD values rapidly reached a
†
Granule movement in the cell center under KCl stimulation versus plateau for longer time intervals (represented by curve i in Fig.
unstimulated condition. Results are expressed as mean±s.e.m. 3F), random diffusion, in which the MSD values were fitted to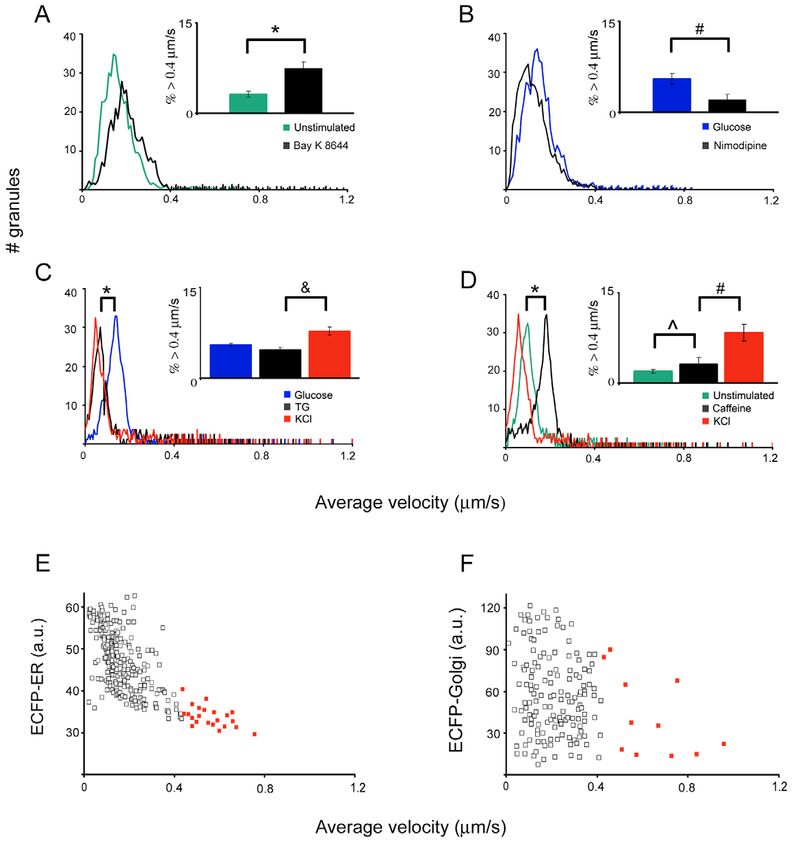
Insulin granule regulation by two Ca2+ pools 5877
Fig. 2. Tracking of insulin granules in TC3
cells reveals two granule populations. (A-C)
Three representative frames, at different time
points, from a time-lapse movie of secretory
granules labeled with phogrin-EGFP before and
after KCl stimulation. The first 60 frames (120
seconds) were taken under unstimulated
condition before 30 mM KCl was added, and the
movie continued for another 120 frames to
record KCl-stimulated granule movement.
Several granules are manually tracked through
30 frames to show their paths in D-F. The movie
can be viewed in the supplementary material.
Bar, 10 m.
Fig. 3. Histograms of
average velocity reveal
segregation of granule
populations upon
stimulation. The histograms
Journal of Cell Science
show the number of granules
at different velocities
traveled. The inset bar graphs
are derived from Table 1 and
show the percentage of
granules with speeds >0.4
m/second, with the error
bars representing s.e.m. For
all panels, a time series of
granule movement was first
taken under unstimulated
condition and then after each
treatment. The treatments
were sequential, in the order
shown in the symbol legend.
Images were taken
immediately after KCl was
added and 2 minutes after
glucose was added.
*P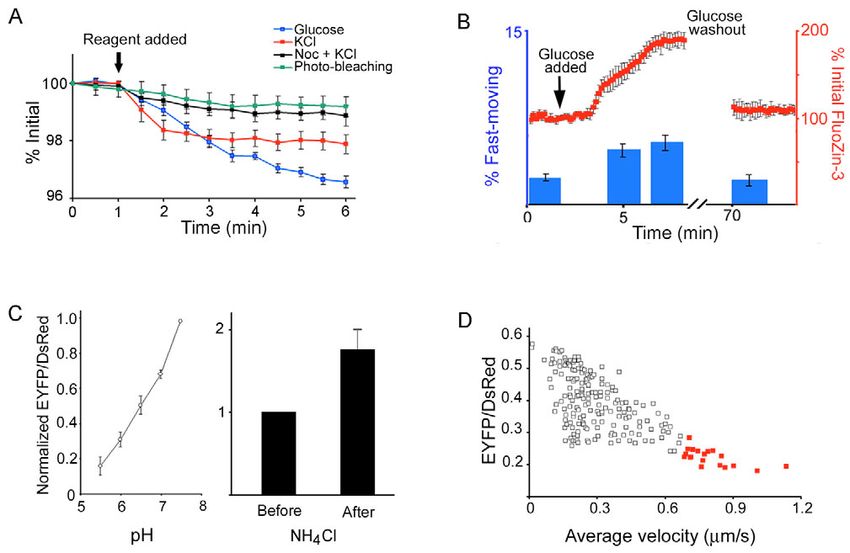
5878 Journal of Cell Science 118 (24)
Table 2. Insulin granule motion characterized based on described previously, the mechanisms regulating these motions
mean-square displacement versus time are unclear. While glucose had a small stimulatory effect on
No. of granules No. of granules No. of granules both populations of granules, KCl significantly activated the
Speed showing curve i showing curve ii showing curve iii fast-moving granules (Fig. 3A,B). Data in Fig. 3C,D also show
(m/second) (caged motion) (random diffusion) (directed motion) that adding glucose with KCl further stimulated only the slow-
0.4 2 5 13 slow-moving granules. This is because high concentrations of
Twenty granules were chosen from each speed interval. For each granule,
KCl are known to induce a much larger and more rapid Ca2+
mean-square displacement values were plotted against time and fitted to one influx than glucose (Graves and Hinkle, 2003), and although it
of the three types of curves shown in Fig. 3F using Microsoft Excel. The increases insulin secretion, raising glucose levels in the
curve was first fitted by a linear regression. If the R2 value, which reveals how presence of high KCl does not further elevate the intracellular
closely the estimated values of the fitted curve correspond to the actual data, Ca2+ concentration (Henquin et al., 2002). We, therefore,
was greater than 0.95, the curve was classified as linear (Fig. 3F, type ii).
Otherwise, the curve was re-fitted to a second degree polynomial in the form hypothesize that intracellular Ca2+ may differentially regulate
of y=ax2+bx+c. The curve was classified as type i (Fig. 3F) if a0. To test this idea, we first looked at changes in granule motion
when cytosolic Ca2+ levels were altered. Bay K8644 is an
established L-type calcium-channel activator that increases the
a linear function (Fig. 3F, curve ii), and directed motion, in mean open time and opening probability of the channels in a
which the MSD values were fitted to a second degree equation variety of cells (Schramm et al., 1983), including pancreatic -
(Fig. 3F, curve iii). Table 2 shows that the slowest granules cells (Larsson-Nyren and Sehlin, 1996; Roe et al., 1996; Smith
largely exhibited caged motion and the fast granules mostly et al., 1989). Nimodipine, which potently inhibits L-type
displayed directed movement. These additional analyses show calcium channels, has been used to prevent the depolarization-
that the granule movement could be quantified using the induced Ca2+ rise in  cells (Garcia-Barrado et al., 1996).
average velocity. When cells were pretreated with these reagents that interacted
Journal of Cell Science
It has been shown that insulin granule exocytosis occurs by with the voltage-dependent calcium channels, the largest
complete fusion and that direct recycling of granules occurs changes in granule movement were seen in the fast-moving
only rarely (Ma et al., 2004). Using evanescence microscopy, granules (Fig. 4A,B insets). This population of granules
it was found that there was a significant decrease in phogrin- significantly increased with Bay K8644 and decreased with
EGFP fluorescence when phogrin-EGFP labeled granules nimodipine. Much smaller changes were observed for the slow-
interacted with the PM (Tsuboi et al., 2000). These data moving population (Fig. 4A,B). These results indicate that the
suggest that the majority of the granules in our analysis have two types of granule motion respond differently to changes in
not undergone exocytosis. To rule out the possibility that cytosolic Ca2+ and that the fast-moving granules are closely
granule ‘kiss and run’ occurrence (Tsuboi and Rutter, 2003) regulated by Ca2+ influx from the L-type calcium channels.
could affect our characterization of the granule movements, we We next examined the other major intracellular Ca2+
used proinsulin-EGFP to image the insulin granules. Unlike the source. Upon stimulation, cytosolic Ca2+ increases as a result
membrane-bound phogrin-EGFP, proinsulin-EGFP was of Ca2+ influx from extracellular media and Ca2+ efflux from
released when insulin granules interacted with the PM, leaving intracellular stores (Rojas et al., 1994; Theler et al., 1992).
the recycled granules non-fluorescent. Using this construct, We tested the role of ER Ca2+ stores in regulating insulin
which excluded granules having already undergone exocytosis, granule movement. Thapsigargin, an inhibitor of ER Ca2+-
we were able to obtain data on glucose- and KCl-stimulated ATPases (Islam and Berggren, 1993), is often used to block
granule movement very similar to that obtained with phogrin- intracellular Ca2+ pumps. Under conditions that depleted the
EGFP (data not shown). ER Ca2+ stores, thapsigargin treatment caused a significant
Most of the granules imaged in this study were situated near decrease in granule movement, even in the presence of
the PM adherent to the coverslip. To confirm that the granule glucose (Fig. 4C; Table 1). However, pretreating the cells
movement in this plane was representative of the entire with thapsigargin had little effect on the stimulation of fast-
cell, we looked at the granules in the cell center (Table 1). moving granules by KCl (compare Fig. 4C and Fig. 3D inset
The overall average speed was higher (17.8±2.0%) under red bars, Table 1, P>0.1). To elicit the opposite effect of
unstimulated condition compared with granules at the PM. thapsigargin, caffeine was used to stimulate Ca2+ release from
Unlike granules near the PM, long-distance moving granules the ER by activating ryanodine receptors located on the ER
at the cell center were only weakly activated by KCl (1.3±1.2% membranes (Islam et al., 1998). Caffeine alone produced a
vs 6.4±1.0% increase, after KCl treatment, of the fast-moving larger stimulatory effect than glucose on the slow-moving
population in the center and at the PM, respectively). This population, but failed to activate the fast-moving population
result suggests that granule mobilization upon KCl stimulation (Fig. 4D, Table 1, P>0.1). Similar to thapsigargin, caffeine
does not occur uniformly in the entire cell and that there is treatment did not affect the fast-moving population when KCl
preferential activation at the cell periphery. was added (Fig. 4D vs Fig. 3B inset red bars, Table 1, P>0.1).
These results indicate that Ca2+ efflux from the ER affects the
majority of insulin granules (slow-moving population),
Two types of granule movement are differentially whereas the small percentage of granules that move
regulated by intracellular Ca2+ long distances (fast-moving population) are regulated
Although two modes of granule movement have been independently of the ER Ca2+ efflux.Insulin granule regulation by two Ca2+ pools 5879
Journal of Cell Science
Fig. 4. Insulin granules are differentially regulated by localized Ca2+ upon stimulation. The histograms in A-D were generated similarly to the
ones described in Fig. 3. TG, thapsigargin. Measurements were taken 2 minutes after the addition of Bay K8644, nimodipine and glucose, and
after 20 minutes of TG treatment. (E) TC3 cells were co-transfected with phogrin-EGFP and ECFP-ER, and stimulated with glucose. An
image of ECFP-ER was taken prior to acquiring the time-lapse movie of phogrin-EGFP labeled granules. The distance of each granule to the
ER, measured by the fluorescence intensity of ECFP-ER at that position, is plotted against the speed of that granule from the tracking analysis.
The fast-moving granules, as defined in this paper, are indicated in red. (F) A similar experiment as in E was performed using ECFP-Golgi
instead of ECFP-ER. *P5880 Journal of Cell Science 118 (24)
Fig. 5. Effects of cytochalasin D
and jasplakinolide on granule
mobility. (A-F) The effects of
cytochalasin D (cyto D) and
jasplakinolide (Jas) treatment on the
actin network in TC3 cells. Cells
were incubated with 10 g/ml Cyto
D or 1 M Jas for 20 minutes at
37°C before being stained with
Alexa Fluor 488-phalloidin. (G,H)
The histogram of average velocity
under basal condition (green), after
Cyto D (G) or Jas (H) treatment
(black), and after adding KCl (red).
The inset bar graphs show the
percentage of granules with speeds
>0.4 m/second, with the error bars
representing s.e.m. *PInsulin granule regulation by two Ca2+ pools 5881
Fig. 7. Secretory granule trafficking is
correlated with insulin secretion and
refilling of the RRP. (A) Cells were
transfected with proinsulin-EGFP and
the overall fluorescence intensity of
background-corrected images was
plotted over time before and after
glucose (blue) or KCl (red) was
added. For nocodazole (Noc)
treatment, cells were incubated with
Noc prior to image acquisition and
KCl was added (black). (B) FluoZin-
3 fluorescence, shown in red,
indicates insulin release before and
after adding glucose and again after
glucose washout. The blue bars show
the percentage of granules with
speeds >0.4 m/second (fast-moving
population), under identical
conditions used to monitor insulin
release with FluoZin-3. n=5
experiments. The error bars represent
s.e.m. (C) pH dependency of
proinsulin-EYFP-DsRed. See
Materials and Methods for details.
Left, normalized fluorescence ratio of EYFP to DsRed is plotted against pH. Right, raising the pH with a permeant base, NH4Cl, caused an
increase in the fluorescence ratio of EYFP/DsRed in live cells. (D) The fluorescence ratio of EYFP to DsRed (the lower the ratio, the more
Journal of Cell Science
acidic) for each granule is plotted against the speed of movement from the tracking analysis. The fast-moving granules are indicated in red. a.u.,
arbitrary units.
Granule mobilization is associated with refilling of the synchronized change in the fast-moving population (blue
RRP bars) and insulin release (indicated by FluoZin-3 in red),
Granule mobilization has been implicated as a major event suggesting that the fast-moving granules are activated upon
leading to insulin secretion. To see if the fluorescently labeled insulin secretion when there is a need to replenish the
granules undergo exocytosis when exposed to glucose or KCl, granules depleted from the RRP, and are reduced when
we monitored the disappearance of proinsulin-EGFP. insulin secretion decreases.
Proinsulin-EGFP is released when insulin granules fuse with To further test if the fast-moving granules could be
the PM, thus the fluorescence of proinsulin is lost. KCl and responsible for refilling the RRP, we examined the pH values
glucose caused a 2.2±0.2% and 3.1±0.3% decrease in of the insulin granules using a pH sensitive construct. We took
fluorescence, respectively, 5 minutes after they were added advantage of the fact that the brightness of enhanced yellow
(Fig. 7A, blue and red lines). Pretreating the cells with fluorescent protein (EYFP) is highly dependent on pH (Llopis
nocodazole severely impeded granule release after the initial et al., 1998), while the red fluorescent protein (DsRed)
exocytosis (Fig. 7A, black line), consistent with our fluorescence is relatively resistant to pH (Baird et al., 2000).
observation that granule movement was significantly reduced The dependence of the fluorescence ratio of proinsulin-EYFP-
in nocodazole-treated cells (Fig. 6E). Our observation also DsRed is demonstrated in Fig. 7C. pH titration of the construct
supports the notion that granule mobilization is required for shows the fluorescence ratio of EYFP to DsRed decreases as
sustained insulin secretion. the pH becomes acidic. Adding a permeant base, NH4Cl,
We hypothesized that the fast-moving granules act as an caused a pH rise, and resulted in an increase in the fluorescence
intermediate pool between the RRP and the traditionally ratio. Fig. 7D shows that there is an overall inverse relationship
defined reserve pool, and may contribute to refilling the between the pH of a granule and its speed of movement. The
exocytosed granules from the RRP. To see whether there fast-moving granules, shown in red, are the most acidic in the
is a correlation between the fast-moving granules and reserve pool. Since granule acidification has been shown as an
insulin release, we measured the size of the fast-moving important step during the preparation of granules for
population under basal and stimulated conditions. Zn2+ exocytosis (Barg, 2003; Hutton, 1989), our data show that the
indicators (such as FluoZin-3) have been successfully used to fast-moving population is well suited to becoming release-
study insulin release in pancreatic  cells because insulin and competent upon stimulation.
Zn2+ are co-stored in secretory vesicles and co-released by
exocytosis (Gee et al., 2002). The FluoZin-3 signal does not
accumulate, consistent with diffusional dilution of released Discussion
Zn2+ (Qian et al., 2000). Granule movement and Zn2+ In this manuscript, we have reported a mechanism whereby
secretion were analyzed under three conditions, i.e. basal secretory granules from the reserve pool can replenish the RRP
unstimulated, stimulated with glucose, and back to basal using the same Ca2+ influx that causes insulin release. One of
condition after glucose washout. Fig. 7B shows a the strengths of this study lies in our ability to automatically5882 Journal of Cell Science 118 (24)
segment and track a large number of granules (over 20,000). slow-moving population is regulated by Ca2+ efflux from the
No prior work in the literature documents such a large scale ER through Ca2+-induced Ca2+ release. We also show that
automated individual granule tracking. Our custom-developed the intracellular localization of insulin granules in relation to
image analysis software (Li et al., 2004) enabled us to assay the PM and the ER is probably the underlying mechanism of
quantitatively the small – yet important – fast-moving such differential regulation by Ca2+ (Fig. 4C). It has been
population within the reserve pool. This subset of granules has shown that Ca2+ distribution resulting from extracellular influx
been described previously with limited quantification (Ivarsson and from intracellular efflux is different (Martin et al., 1997;
et al., 2004; Lacy et al., 1975; Pouli et al., 1998; Somers et al., Theler et al., 1992), and that there exist steep spatial gradients
1979; Tsuboi et al., 2000; Varadi et al., 2003). Owing to limited of Ca2+ within the  cell (Ammala et al., 1993). This
sample size, it was concluded that the intracellular movement heterogeneous distribution of cytosolic Ca2+ from the two
of insulin granules was regulated separately from insulin different sources has been speculated to exert distinct and co-
exocytosis (Hisatomi et al., 1996; Niki et al., 2003). We found operative influences on the  cell secretory machinery (Niki,
this to be true for the slow-moving population, which accounts 1999). The spatially separate Ca2+ pools, such as the glucose-
for over 90% of the granules. However, Ca2+ influx also plays induced microgradients of Ca2+ localized just beneath the PM
a role in insulin granule trafficking through its involvement in of the  cell (Martin et al., 1997), could provide high Ca2+
the fast-moving granules. Our study, therefore, provides concentrations locally for stimulation of subsets of granules.
evidence that both insulin secretion and granule trafficking Indeed, Ca2+ measurements at the surface of  cell granules
respond to a central Ca2+-dependent regulatory machinery in showed that a small population of granules located close to the
pancreatic  cells. Furthermore, our data indicate that fast- PM displayed a greater Ca2+ concentration at the granule
moving granules may contribute to the refilling of the RRP surface compared with granules located farther away from the
(Fig. 7), suggesting that refilling of the RRP could be regulated PM (Emmanouilidou et al., 1999). Differential Ca2+ signaling
by the same mechanism as insulin secretion. caused by extracellular influx and intracellular efflux has been
Granule populations within the  cell are not yet clearly shown to contribute to the release of IL-1  and IL-1 ␣ from
defined but they have often been described in terms of the RRP macrophages (Brough et al., 2003), and replenishment of two
and the reserve pool. The RRP remains very small even under synaptic vesicle pools at the neuromuscular junction are also
Journal of Cell Science
maximal stimulatory conditions (Eliasson et al., 1997). separately mediated by Ca2+ influx and efflux (Kuromi and
Interference with the refilling of the RRP has been suggested Kidokoro, 2003).
to contribute to the secretory defect of type II diabetes Current understanding is limited as to how Ca2+ may
(Rorsman et al., 2000). The sustained phase of insulin secretion regulate insulin granule traffic at the molecular level. Granule
involves the recruitment of granules from an intracellular site movement is believed to involve protein phosphorylation by
(Varadi et al., 2002b). We propose that the fast-moving Ca2+-dependent protein kinases (Ashcroft, 1994). It is
population serves as an intermediate pool that provides a speculated that through the activity of Ca2+/calmodulin-
critical means for replenishing secreted granules in the second dependent protein kinases (Gromada et al., 1999), most likely
phase of insulin secretion. We show that fast-moving granules myosin light chain kinase in  cells (Iida et al., 1997), that
are activated at time points after initial insulin secretion (Fig. energy is generated for granule traffic (Niki, 1999). The
7B). Furthermore, the relatively acidic pH values of the fast- microtubule-associated protein MAP-2 (Krueger et al., 1997)
moving granules are closely associated with those of the and the actin-binding protein synapsin I (Krueger et al., 1999)
granules in the RRP (Fig. 7D). Our data strongly suggest an are both substrates for Ca2+/calmodulin-dependent protein
essential role of the fast-moving population in the translocation kinase II in  cells. In addition, activation of granule
of insulin granules from the reserve pool to the PM. mobilization is impeded when Ca2+/calmodulin-dependent
Nevertheless, our study does not rule out the possibility that protein kinase II is inhibited (Gromada et al., 1999).
the slow-moving granules may also play a role in refilling the The cytoskeleton network plays a key role in insulin
RRP. This population of granules could contribute to transport. It has been shown that actin remodeling is necessary
diffusional granule mobility and facilitate redirection and for glucose-stimulated insulin secretion (Li et al., 1994; Wilson
switching between different microtubules before embarking on et al., 2001). However, whether actin rearrangement also acts
a directed movement (Ivarsson et al., 2004). However, our data, to facilitate the directed movement of the fast-moving granules
and that in the literature, do not support the notion that insulin has not been tested. We show that transient reduction of actin
granules are able to reach the PM by mere diffusion, especially filaments activates both types of granule movement and in turn
over long distances. As pointed out by Ivarsson et al. (Ivarsson promotes refilling of the RRP, leading to greater insulin
et al., 2004), granule diffusion is restricted within functional secretion. F-actin is a target of Ca2+-dependent signaling
‘cages’ of ~0.9 m diameter. Another study also reported that cascades (Staiger and Franklin-Tong, 2003) and increases in
there is a lack of vesicle movement in space not occupied by cytosolic Ca2+ stimulate actin depolymerization (Gilman and
microtubules, and suggested that free diffusion plays a minimal Mattson, 2002; Staiger and Franklin-Tong, 2003). Our data,
role in long-distance transport (Varadi et al., 2003). along with these reports, suggest that glucose and other
A major question in cell biology is how one signaling secretory stimuli exert their effects on granule trafficking partly
molecule such as Ca2+ can activate different mechanisms to through Ca2+-mediated actin rearrangement. Microtubules
control many diverse processes. Here, we provide an example have been shown to be involved in the recruitment of secretory
of two granule populations regulated preferentially by separate vesicles to the PM (Varadi et al., 2002b). We show that both
cytosolic Ca2+ pools (Fig. 4). Our observations indicate that types of granule movement are affected by the nocodazole
while the fast-moving population is activated primarily by Ca2+ treatment, indicating that both populations of granules are
influx through voltage-gated calcium channels on the PM, the attached to the microtubules. Their intracellular movementInsulin granule regulation by two Ca2+ pools 5883
reflects either microtubule remodeling or active transport on Graves, T. K. and Hinkle, P. M. (2003). Ca(2+)-induced Ca(2+) release in
the microtubules. the pancreatic beta-cell: direct evidence of endoplasmic reticulum Ca(2+)
In summary, the use of live cell imaging and advanced image release. Endocrinology 144, 3565-3574.
Gromada, J., Hoy, M., Renstrom, E., Bokvist, K., Eliasson, L., Gopel, S.
analysis reveals a small population of insulin granules within and Rorsman, P. (1999). CaM kinase II-dependent mobilization of
the reserve pool that is highly mobilized upon stimulation of secretory granules underlies acetylcholine-induced stimulation of exocytosis
secretion. This fast-moving population, which is probably in mouse pancreatic B-cells. J. Physiol. 518, 745-759.
responsible for refilling the RRP, accounts for less than 10% Hao, M. and Maxfield, F. R. (2000). Characterization of rapid membrane
internalization and recycling. J. Biol. Chem. 275, 15279-15286.
of granules. A detailed regulatory mechanism can be deduced Henquin, J. C., Ishiyama, N., Nenquin, M., Ravier, M. A. and Jonas, J. C.
only when a vast pool of granules is examined. Unlike (2002). Signals and pools underlying biphasic insulin secretion. Diabetes
conclusions from other studies, we have now shown a potential 51, S60-S67.
mechanism by which the refilling of the RRP is controlled by Hisatomi, M., Hidaka, H. and Niki, I. (1996). Ca2+/calmodulin and cyclic
the same processes that are central to glucose-stimulated 3,5⬘ adenosine monophosphate control movement of secretory granules
through protein phosphorylation/dephosphorylation in the pancreatic beta-
insulin secretion. cell. Endocrinology 137, 4644-4649.
Hutton, J. C. (1989). The insulin secretory granule. Diabetologia 32, 271-
We would like to thank J. C. Hutton for the phogrin construct, L. 281.
Ballester and J. Veale for their contribution to this work, and S. C. Iida, Y., Senda, T., Matsukawa, Y., Onoda, K., Miyazaki, J. I., Sakaguchi,
Gunawardana and L. Sethaphong for helpful discussions. This work H., Nimura, Y., Hidaka, H. and Niki, I. (1997). Myosin light-chain
was supported by NIH Grants DK53434 and GM72048 (D.W.P.), US phosphorylation controls insulin secretion at a proximal step in the secretory
NIH Research Service Awards DK60275 (M.A.R.) and DK59737 cascade. Am. J. Physiol. 273, E782-E789.
(J.V.R.). Software development was supported by the Vanderbilt Islam, M. S. and Berggren, P. O. (1993). Mobilization of Ca2+ by
thapsigargin and 2,5-di-(t-butyl)-1,4-benzohydroquinone in permeabilized
Advanced Computer Center and NIH grant LM07613.
insulin-secreting RINm5F cells: evidence for separate uptake and release
compartments in inositol 1,4,5-trisphosphate-sensitive Ca2+ pool. Biochem.
J. 293, 423-429.
References Islam, M. S., Leibiger, I., Leibiger, B., Rossi, D., Sorrentino, V., Ekstrom,
Ammala, C., Eliasson, L., Bokvist, K., Larsson, O., Ashcroft, F. M. and T. J., Westerblad, H., Andrade, F. H. and Berggren, P. O. (1998). In situ
activation of the type 2 ryanodine receptor in pancreatic beta cells requires
Journal of Cell Science
Rorsman, P. (1993). Exocytosis elicited by action potentials and voltage-
clamp calcium currents in individual mouse pancreatic B-cells. J. Physiol. cAMP-dependent phosphorylation. Proc. Natl. Acad. Sci. USA 95, 6145-
472, 665-688. 6150.
Ashcroft, S. J. (1994). Protein phosphorylation and beta-cell function. Ivarsson, R., Obermuller, S., Rutter, G. A., Galvanovskis, J. and
Diabetologia 37, S21-S29. Renstrom, E. (2004). Temperature-sensitive random insulin granule
Baird, G. S., Zacharias, D. A. and Tsien, R. Y. (2000). Biochemistry, diffusion is a prerequisite for recruiting granules for release. Traffic 5, 750-
mutagenesis, and oligomerization of DsRed, a red fluorescent protein from 762.
coral. Proc. Natl. Acad. Sci. USA 97, 11984-11989. Krueger, K. A., Bhatt, H., Landt, M. and Easom, R. A. (1997). Calcium-
Barg, S. (2003). Mechanisms of exocytosis in insulin-secreting B-cells and stimulated phosphorylation of MAP-2 in pancreatic betaTC3-cells is
glucagon-secreting A-cells. Pharmacol. Toxicol. 92, 3-13. mediated by Ca2+/calmodulin-dependent kinase II. J. Biol. Chem. 272,
Barg, S., Eliasson, L., Renstrom, E. and Rorsman, P. (2002). A subset of 27464-27469.
50 secretory granules in close contact with L-type Ca2+ channels accounts Krueger, K. A., Ings, E. I., Brun, A. M., Landt, M. and Easom, R.
for first-phase insulin secretion in mouse beta-cells. Diabetes 51, S74-S82. A. (1999). Site-specific phosphorylation of synapsin I by Ca2+/
Berggren, P. O. and Larsson, O. (1994). Ca2+ and pancreatic B-cell function. calmodulin-dependent protein kinase II in pancreatic betaTC3 cells:
Biochem. Soc. Trans. 22, 12-18. synapsin I is not associated with insulin secretory granules. Diabetes 48,
Brough, D., Le Feuvre, R. A., Wheeler, R. D., Solovyova, N., Hilfiker, S., 499-506.
Rothwell, N. J. and Verkhratsky, A. (2003). Ca2+ stores and Ca2+ entry Kuromi, H. and Kidokoro, Y. (2003). Two synaptic vesicle pools, vesicle
differentially contribute to the release of IL-1 beta and IL-1 alpha from recruitment and replenishment of pools at the Drosophila neuromuscular
murine macrophages. J. Immunol. 170, 3029-3036. junction. J. Neurocytol. 32, 551-565.
Burke, N. V., Han, W., Li, D., Takimoto, K., Watkins, S. C. and Levitan, Lacy, P. E., Finke, E. H. and Codilla, R. C. (1975). Cinemicrographic studies
E. S. (1997). Neuronal peptide release is limited by secretory granule on beta granule movement in monolayer culture of islet cells. Lab. Invest.
mobility. Neuron 19, 1095-1102. 33, 570-576.
D’Ambra, R., Surana, M., Efrat, S., Starr, R. G. and Fleischer, N. (1990). Lang, T., Wacker, I., Wunderlich, I., Rohrbach, A., Giese, G., Soldati, T.
Regulation of insulin secretion from beta-cell lines derived from transgenic and Almers, W. (2000). Role of actin cortex in the subplasmalemmal
mice insulinomas resembles that of normal beta-cells. Endocrinology 126, transport of secretory granules in PC-12 cells. Biophys. J. 78, 2863-2877.
2815-2822. Larsson-Nyren, G. and Sehlin, J. (1996). Comparison of the effects of
Dean, P. M. (1973). Ultrastructural morphometry of the pancreatic -cell. perchlorate and Bay K 8644 on the dynamics of cytoplasmic Ca2+
Diabetologia 9, 115-119. concentration and insulin secretion in mouse beta-cells. Biochem. J. 314,
Eliasson, L., Renstrom, E., Ding, W. G., Proks, P. and Rorsman, P. 167-173.
(1997). Rapid ATP-dependent priming of secretory granules precedes Lemmens, R., Larsson, O., Berggren, P. O. and Islam, M. S. (2001). Ca2+-
Ca(2+)-induced exocytosis in mouse pancreatic B-cells. J. Physiol. 503, induced Ca2+ release from the endoplasmic reticulum amplifies the Ca2+
399-412. signal mediated by activation of voltage-gated L-type Ca2+ channels in
Emmanouilidou, E., Teschemacher, A. G., Pouli, A. E., Nicholls, L. I., pancreatic beta-cells. J. Biol. Chem. 276, 9971-9977.
Seward, E. P. and Rutter, G. A. (1999). Imaging Ca2+ concentration Li, G., Rungger-Brandle, E., Just, I., Jonas, J. C., Aktories, K. and
changes at the secretory vesicle surface with a recombinant targeted Wollheim, C. B. (1994). Effect of disruption of actin filaments by
cameleon. Curr. Biol. 9, 915-918. Clostridium botulinum C2 toxin on insulin secretion in HIT-T15 cells and
Garcia-Barrado, M. J., Gilon, P., Sato, Y., Nenquin, M. and Henquin, J. pancreatic islets. Mol. Biol. Cell 5, 1199-1213.
C. (1996). No evidence for a role of reverse Na(+)-Ca2+ exchange in insulin Li, X., Hao, M., Piston, D. W. and Dawant, B. M. (2004). Automatic tracking
release from mouse pancreatic islets. Am. J. Physiol. 271, E426-E433. of proteins in sequences of fluorescence images. Proc. SPIE 5370, 1364-
Gee, K. R., Zhou, Z. L., Qian, W. J. and Kennedy, R. (2002). Detection and 1371.
imaging of zinc secretion from pancreatic beta-cells using a new fluorescent Llopis, J., McCaffery, J. M., Miyawaki, A., Farquhar, M. G. and Tsien, R.
zinc indicator. J. Am. Chem. Soc. 124, 776-778. Y. (1998). Measurement of cytosolic, mitochondrial, and Golgi pH in single
Gilman, C. P. and Mattson, M. P. (2002). Do apoptotic mechanisms living cells with green fluorescent proteins. Proc. Natl. Acad. Sci. USA 95,
regulate synaptic plasticity and growth-cone motility? Neuromol. Med. 2, 6803-6808.
197-214. Ma, L., Bindokas, V. P., Kuznetsov, A., Rhodes, C., Hays, L., Edwardson,5884 Journal of Cell Science 118 (24)
J. M., Ueda, K., Steiner, D. F. and Philipson, L. H. (2004). Direct imaging Smith, P. A., Rorsman, P. and Ashcroft, F. M. (1989). Modulation of
shows that insulin granule exocytosis occurs by complete vesicle fusion. dihydropyridine-sensitive Ca2+ channels by glucose metabolism in mouse
Proc. Natl. Acad. Sci. USA 101, 9266-9271. pancreatic beta-cells. Nature 342, 550-553.
Mallet, W. G. and Maxfield, F. R. (1999). Chimeric forms of furin and Somers, G., Blondel, B., Orci, L. and Malaisse, W. J. (1979). Motile events
TGN38 are transported with the plasma membrane in the trans-Golgi in pancreatic endocrine cells. Endocrinology 104, 255-264.
network via distinct endosomal pathways. J. Cell Biol. 146, 345-359. Staiger, C. J. and Franklin-Tong, V. E. (2003). The actin cytoskeleton is a
Martin, F., Ribas, J. and Soria, B. (1997). Cytosolic Ca2+ gradients in target of the self-incompatibility response in Papaver rhoeas. J. Exp. Bot.
pancreatic islet-cells stimulated by glucose and carbachol. Biochem. 54, 103-113.
Biophys. Res. Commun. 235, 465-468. Steyer, J. A. and Almers, W. (1999). Tracking single secretory granules in
Mukherjee, S., Soe, T. T. and Maxfield, F. R. (1999). Endocytic sorting of live chromaffin cells by evanescent-field fluorescence microscopy. Biophys.
lipid analogues differing solely in the chemistry of their hydrophobic tails. J. 76, 2262-2271.
J. Cell Biol. 144, 1271-1284. Theler, J. M., Mollard, P., Guerineau, N., Vacher, P., Pralong, W. F.,
Niki, I. (1999). Ca2+ signaling and the insulin secretory cascade in the Schlegel, W. and Wollheim, C. B. (1992). Video imaging of cytosolic Ca2+
pancreatic beta-cell. Jpn. J. Pharmacol. 80, 191-197. in pancreatic beta-cells stimulated by glucose, carbachol, and ATP. J. Biol.
Niki, I., Niwa, T., Yu, W., Budzko, D., Miki, T. and Senda, T. (2003). Ca2+ Chem. 267, 18110-18117.
influx does not trigger glucose-induced traffic of the insulin granules and Thurmond, D. C., Gonelle-Gispert, C., Furukawa, M., Halban, P. A. and
alteration of their distribution. Exp. Biol. Med. 228, 1218-1226. Pessin, J. E. (2003). Glucose-stimulated insulin secretion is coupled to the
Pouli, A. E., Emmanouilidou, E., Zhao, C., Wasmeier, C., Hutton, J. C. interaction of actin with the t-SNARE (target membrane soluble N-
and Rutter, G. A. (1998). Secretory-granule dynamics visualized in vivo ethylmaleimide-sensitive factor attachment protein receptor protein)
with a phogrin-green fluorescent protein chimaera. Biochem. J. 333, 193- complex. Mol. Endocrinol. 17, 732-742.
199. Tsuboi, T. and Rutter, G. A. (2003). Insulin secretion by ‘kiss-and-run’
Qian, H., Sheetz, M. P. and Elson, E. L. (1991). Single particle tracking. exocytosis in clonal pancreatic islet beta-cells. Biochem. Soc. Trans. 31, 833-
Analysis of diffusion and flow in two-dimensional systems. Biophys. J. 60, 836.
910-921. Tsuboi, T., Zhao, C., Terakawa, S. and Rutter, G. A. (2000). Simultaneous
Qian, W. J., Aspinwall, C. A., Battiste, M. A. and Kennedy, R. T. (2000). evanescent wave imaging of insulin vesicle membrane and cargo during a
Detection of secretion from single pancreatic beta-cells using extracellular single exocytotic event. Curr. Biol. 10, 1307-1310.
fluorogenic reactions and confocal fluorescence microscopy. Anal. Chem. Tsuboi, T., Kikuta, T., Warashina, A. and Terakawa, S. (2001). Protein
72, 711-717. kinase C-dependent supply of secretory granules to the plasma membrane.
Rizzo, M. A., Magnuson, M. A., Drain, P. F. and Piston, D. W. (2002). A Biochem. Biophys. Res. Commun. 282, 621-628.
functional link between glucokinase binding to insulin granules and Varadi, A., Ainscow, E. K., Allan, V. J. and Rutter, G. A. (2002a).
Journal of Cell Science
conformational alterations in response to glucose and insulin. J. Biol. Chem. Involvement of conventional kinesin in glucose-stimulated secretory granule
277, 34168-34175. movements and exocytosis in clonal pancreatic beta-cells. J. Cell Sci. 115,
Roderick, H. L., Campbell, A. K. and Llewellyn, D. H. (1997). Nuclear 4177-4189.
localisation of calreticulin in vivo is enhanced by its interaction with Varadi, A., Ainscow, E. K., Allan, V. J. and Rutter, G. A. (2002b). Molecular
glucocorticoid receptors. FEBS Lett. 405, 181-185. mechanisms involved in secretory vesicle recruitment to the plasma
Roe, M. W., Worley, J. F., 3rd, Tokuyama, Y., Philipson, L. H., Sturis, J., membrane in beta-cells. Biochem. Soc. Trans. 30, 328-332.
Tang, J., Dukes, I. D., Bell, G. I. and Polonsky, K. S. (1996). NIDDM is Varadi, A., Tsuboi, T., Johnson-Cadwell, L. I., Allan, V. J. and Rutter, G.
associated with loss of pancreatic beta-cell L-type Ca2+ channel activity. A. (2003). Kinesin I and cytoplasmic dynein orchestrate glucose-stimulated
Am. J. Physiol. 270, E133-E140. insulin-containing vesicle movements in clonal MIN6 beta-cells. Biochem.
Rojas, E., Carroll, P. B., Ricordi, C., Boschero, A. C., Stojilkovic, S. S. and Biophys. Res. Commun. 311, 272-282.
Atwater, I. (1994). Control of cytosolic free calcium in cultured human Wasmeier, C. and Hutton, J. C. (1996). Molecular cloning of phogrin, a
pancreatic beta-cells occurs by external calcium-dependent and independent protein-tyrosine phosphatase homologue localized to insulin secretory
mechanisms. Endocrinology 134, 1771-1781. granule membranes. J. Biol. Chem. 271, 18161-18170.
Rorsman, P., Eliasson, L., Renstrom, E., Gromada, J., Barg, S. and Gopel, Watkins, S., Geng, X., Li, L., Papworth, G., Robbins, P. D. and Drain, P.
S. (2000). The cell physiology of biphasic insulin secretion. News Physiol. (2002). Imaging secretory vesicles by fluorescent protein insertion in
Sci. 15, 72-77. propeptide rather than mature secreted peptide. Traffic 3, 461-471.
Schramm, M., Thomas, G., Towart, R. and Franckowiak, G. (1983). Novel Wilson, J. R., Ludowyke, R. I. and Biden, T. J. (2001). A redistribution of
dihydropyridines with positive inotropic action through activation of Ca2+ actin and myosin IIA accompanies Ca(2+)-dependent insulin secretion.
channels. Nature 303, 535-537. FEBS Lett. 492, 101-106.You can also read


