Immune landscape and biomarkers for immuno-oncology in colorectal cancers
←
→
Page content transcription
If your browser does not render page correctly, please read the page content below
Journal of Pathology and Translational Medicine 2020; 54: 351-360
https://doi.org/10.4132/jptm.2020.05.15 REVIEW
Immune landscape and biomarkers for immuno-oncology
in colorectal cancers
Jeong Mo Bae, Seung-Yeon Yoo, Jung Ho Kim, Gyeong Hoon Kang
Department of Pathology, Seoul National University College of Medicine, Seoul, Korea
Recent advances in immuno-oncology have increased understanding of the tumor immune microenvironment (TIME), and clinical trials
for immune checkpoint inhibitor treatment have shown remission and/or durable response in certain proportions of patients stratified by
predictive biomarkers. The TIME in colorectal cancer (CRC) was initially evaluated several decades ago. The prognostic value of the im-
mune response to tumors, including tumor-infiltrating lymphocytes, peritumoral lymphoid reaction, and Crohn’s-like lymphoid reaction,
has been well demonstrated. In this review, we describe the chronology of TIME research and review the up-to-date high-dimensional
TIME landscape of CRC. We also summarize the clinical relevance of several biomarkers associated with immunotherapy in CRC, such
as microsatellite instability, tumor mutational burden, POLE/POLD mutation, consensus molecular subtype, and programmed death-li-
gand 1 expression.
Key Words: Colorectal neoplasms; Tumor immune microenvironment; Immunotherapy; Microsatellite instability
Received: March 20, 2020 Revised: May 13, 2020 Accepted: May 14, 2020
Corresponding Author: Gyeong Hoon Kang, MD, PhD, Department of Pathology, Seoul National University College of Medicine, 103 Daehak-ro, Jongno-gu, Seoul 03080, Korea
Tel: +82-2-740-8263, Fax: +82-2-765-5600, E-mail: ghkang@snu.ac.kr
Colorectal cancer (CRC) is the second most commonly diag- ment, such as anti–cytotoxic T-lymphocyte antigen 4 (CTLA-4)
nosed cancer and the third leading cause of cancer-related death antibodies and anti–programmed death-1 (PD-1) antibodies,
in Korea [1]. Because of rapid spread of colonoscopy screening, has shown marked clinical benefits in many types of cancer [5,6].
there was a general decrease in CRC until 2010. However, recent CRC also holds promise for cancer immunotherapy use, and the
studies have reported that the decline in CRC incidence has re- U.S. Food and Drug Administration (U.S. FDA) approved im-
versed during the last few years, especially in middle-aged per- munotherapeutic agents for microsatellite instability-high
sons, and the occurrence of early-onset CRC has rapidly in- (MSI-H) CRC in 2017 (Fig. 1) [7,8].
creased [2]. Most patients with CRC are diagnosed at an opera- In this review, we describe the landscape of the immune mi-
ble stage; however, approximately 20% of patients with stage croenvironment in CRC and summarize the clinical usefulness
III or high-risk stage II CRC relapse within 5 years after cura- of several suggested biomarkers in CRC immunotherapy.
tive resection [3]. Moreover, the 5-year relative survival rate for
metastatic CRC is 14% [2]. To improve clinical outcomes for IMMUNE LANDSCAPE
patients with CRC, a more effective treatment modality is re- OF COLORECTAL CANCERS
quired to fulfill those unmet needs.
Cancer is fundamentally a genetic disease since the accumu- Historical use of microscopic evaluation of immune
lation of mutations, fusions, and copy number alterations drives environment in CRCs
tumorigenesis. However, recent research on the tumor immune To our knowledge, Spratt and Spjut [9] published the first study
microenvironment (TIME) has revealed the importance of in- on integrative histologic evaluation of CRCs in 1967. In that
teractions between tumor cells and surrounding immune cells study, the authors evaluated histologic grade, mucinous ele-
in tumorigenesis [4]. Immune checkpoint inhibitor (ICI) treat- ments, depth of invasion, characteristics of tumor border, lym-
pISSN 2383-7837 © 2020 The Korean Society of Pathologists/The Korean Society for Cytopathology
This is an Open Access article distributed under the terms of the Creative Commons Attribution Non-Commercial License (https://creativecommons.org/licenses/
eISSN 2383-7845 by-nc/4.0) which permits unrestricted non-commercial use, distribution, and reproduction in any medium, provided the original work is properly cited. 351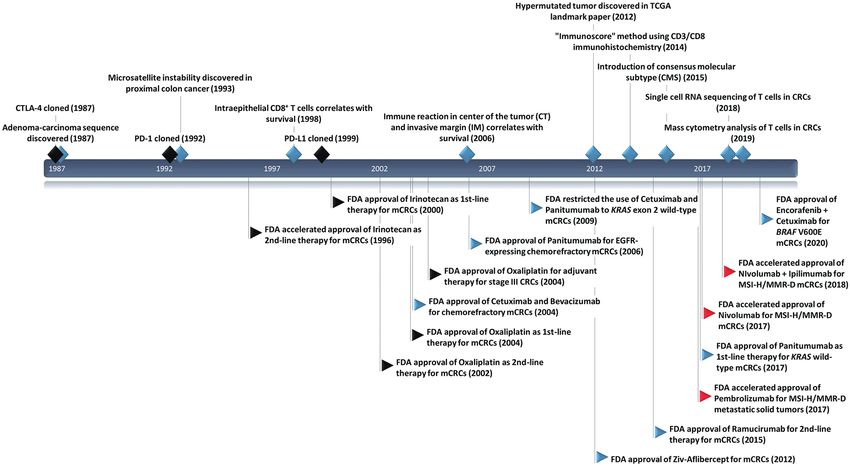
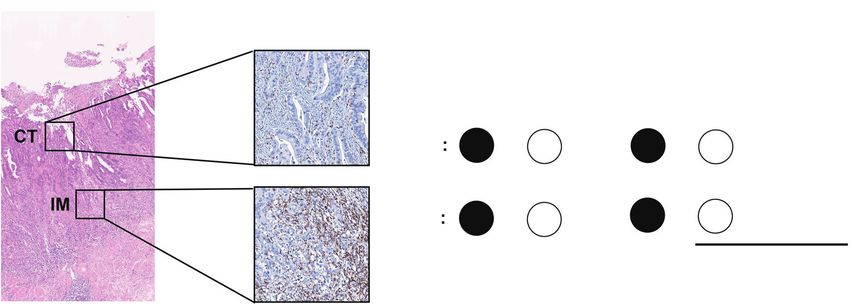
352 • Bae JM et al.

Fig. 1. Timeline with key milestones in immuno-oncology research and U.S. Food and Drug Administration (FDA)–approved anti-cancer
therapy in colorectal cancers (CRCs). CTLA-4, cytotoxic T-lymphocyte antigen 4; PD-1, programmed death-1; PD-L1, programmed death-
ligand 1; TCGA, The Cancer Genome Atlas; mCRC, metastatic colorectal cancer; MSI, microsatellite instability; MMR-D, mismatch repair
deficiency; MSI-H, MSI-high. Black diamond, milestone events in general immuno-oncology research; blue diamond, milestone events in im-
muno-oncology research in CRCs; black flags, cytotoxic chemotherapy; blue flags, targeted therapy; and red flags, immunotherapy.

phatic/vascular/perineural invasion, and especially degree of in-      Quantitative evaluation of TIME using digital pathology
flammatory reaction around the tumor in 1,137 consecutive                 Previous studies evaluating the immune microenvironment
CRC cases. CRC with no inflammatory reaction showed shorter            in CRCs depended on manual inspection of glass slides using a
5-year and 10-year survivals than CRC with moderate inflam-            light microscope. Visual assessment of immune cells and stroma
matory reaction and abscess formation. Watt and House [10]             is labor-intensive and has limited objectivity. Most studies enu-
evaluated peritumoral lymphoid cells in a semiquantitative             merated immune cells in hotspot areas, while some studies used
manner, and Duke B tumors with recurrence or death during              semiquantitative methods [15]. Recent advancements in virtual
follow-up showed a tendency toward minimal lymphocytic infil-          slide scanners and machine learning algorithms have enabled
tration. Pihl et al. [11] reported the association of perivascular     objective quantification of the tumor microenvironment at the
lymphoid cuffing in the muscularis propria or subserosa with           whole slide level.
favorable disease-free survival (DFS) in 134 Duke B CRCs.                 The immunoscore developed by Jérôme Galon is the most
Perivascular lymphoid cuffing has been named “Crohn’s-like             well-known digital pathology-based approach for evaluation
lymphoid reaction,” and is now referred to as an ectopic or tertiary   of TILs. In 2006, Galon et al. [16] showed that an increased
lymphoid structure [12]. Naito et al. [13] evaluated intraepi-         number of total T cells (CD3+) and resident memory T cells
thelial tumor-infiltrating CD8+ T cells using immunohisto-             (CD45RO+) in the center of the tumor (CT) and at the invasive
chemistry and found that increased intraepithelial CD8+ cell in-       margin (IM) was an independent marker of better DFS in CRCs.
filtration was associated with lower Duke stage and better survival.   In 2014, they proposed the “Immunoscore” method based on
Ogino et al. [14] reported that the overall lymphocytic reaction,      enumeration of CD3+ and CD8+ T cells in the CT and IM regions
which combines the degree of Crohn’s-like lymphoid reaction,           of tumors (Fig. 2) [17]. Immunoscore assay shows superior
peritumoral reaction, intratumoral periglandular reaction, and         prognostic value compared with microsatellite instability and has
tumor-infiltrating lymphocytes (TILs), is a prognostic marker          prognostic value in both primary tissues and metastatic tissues
independent of clinicopathologic and molecular characteristics.        [18,19]. To ensure robust enumeration of TILs, the researchers

http://jpatholtm.org/                                                                              https://doi.org/10.4132/jptm.2020.05.15

Immuno-oncology in colorectal cancers • 353

                                               CD3/CD8
                   Lumen                                                              Immune infiltration                  Score
                                          immunohistochemistry

                                                                                 CD3                        CD8          (H = 1; L = 0)

                                                                     CT      H   or     L      +      H     or    L      = 0, 1, or 2

                                                                     IM     H    or     L      +      H     or    L      = 0, 1, or 2

                                                                                                      Immunoscore (I) = 0, 1, 2, 3, or 4

 Fig. 2. Calculation method of Immunoscore (adapted from Anitei et al. [17]). CT, center of tumor; IM, invasive margin; H, high; and L, low.

developed an in vitro diagnostic immunoscore assay for clinical           rived from 127 parameters extracted from image analysis and
use. The international immunoscore consortium consisted of 14             the “DGMuneS” score by combining CD3+ CT, stromal area in
institutions in 13 countries and performed a validation study             the IM, and “DGMate” score. The “DGMuneS” score slightly
for the immunoscore assay using 2,681 stage I–III colon cancers           outperformed the “Immunoscore” in predicting clinical outcome.
[20]. Using standardized immunohistochemistry protocols and                  Nearchou et al. [15] evaluated tumor bud (TB), CD3+ TILs,
image analysis software, the immunoscore assay showed high                and CD8+ TILs on the same section of stage II CRC tissues us-
reproducibility between institutions. The consortium catego-              ing multiplex immunofluorescence staining. They found that a
rized CRC cases as low immunoscore group (0–25 percentile),               higher density of CD3+ T cells at the IM and CD8+ T cells at
intermediate immunoscore group (25–70 percentile), and high               the IM and in whole tumor sections (WTSs) were significantly
immunoscore group (70–100 percentile). Patients with high                 correlated with lower TB number. In survival analysis using
immunoscore showed longer time to recurrence compared to                  least absolute shrinkage and selection operator penalized Cox
patients with low or intermediate immunoscore independent of              proportional hazard regression, four morphologic features, in-
age, sex, stage, microsatellite instability (MSI), and other known        cluding CD3+ T cell density in WTSs, mean CD3+CD8+ T cell
prognostic factors. Moreover, patients with high immunoscore              number within 50 μm of TBs, TB number, and CD8+ T cell
showed significantly lower risk of recurrence compared to patients        density in the CT, had significant predictive value for disease-
with low immunoscore in stage II colon cancers.                           specific survival. After eliminating the least significant features,
   Reichling et al. [21] performed whole-slide imaging analysis           the authors proposed the “Tumor Bud-Immuno Spatial Index
of 1,018 stage III colon cancers in the PETACC08 study. They              (TBISI)” using CD3+ T cell density in WTSs, mean CD3+CD8+
developed software to detect colon cancer, normal mucosa, stro-           T cell number within 50 μm of TBs, and TB numbers, which
ma, and immune cells on CD3- and CD8-stained slides. In                   could predict disease-specific survival.
their study, the stromal area in IM and CT (originally, tumor                We recently analyzed CD3+ TILs, CD8+ TILs, and the tumor-
core in their article) showed strong positive correlation. A high-        stroma ratio (TSR) in 886 stage III or high-risk stage II CRCs
er proportion of stromal area in the tumor was associated with            using whole-slide imaging [22]. Clustering analysis using 197
poor relapse-free survival (RFS), and an increased proportion of          parameters extracted from image analysis classified CRCs into
stromal area in the IM showed the highest hazard ratio for RFS            five clusters. Strikingly, the five clusters showed similar clinico-
compared with the stromal area in the CT or total stromal area.           pathologic and molecular characteristics with the consensus
The researchers tested the prognostic role of the four immune             molecular subtype (CMS) classification [23]. In detail, cluster 1
variables (mean values of each tumor tile for each slide), CD3+           was characterized by highest TIL density, enrichment of MSI-H
IM, CD3+ CT, CD8+ IM, and CD8+ CT. High CD3+ IM, CD3+                     tumors, and CpG island methylator phenotype-high (CIMP-H)
CT, and CD8+ CT were significantly associated with superior               tumors (features of CMS1). Cluster 2 was characterized by lower
clinical outcomes. The classical “Immunoscore” showed similar             TSR, distal colorectum locations, and retained intestinal differ-
performance to the CD3+ CT variable in predicting clinical                entiation (features of CMS2). Cluster 3 was characterized by the
outcome. The researchers developed the “DGMate” score de-                 highest CD8/CD3 ratio and prominent mucin production (fea-

https://doi.org/10.4132/jptm.2020.05.15                                                                                        http://jpatholtm.org/
354 • Bae JM et al.
tures of CMS3). Cluster 4 was characterized by the lowest TIL MCP-counter. There was a strong positive association between
density and highest TSR (features of CMS4). Cluster 5 showed immune checkpoint expression with infiltration of certain lym-
intermediate TIME characteristics, and this cluster was similar phoid (NK cells, T cells, and cytotoxic cells) and myeloid cells,
to tumors with mixed/indeterminate features in the original whereas B cells, fibroblasts, vessels, and granulocytes showed
CMS study. This similarity highlights the clear association of little or no association with immune checkpoint expression.
the tumor transcriptome with the immune microenvironment Zhang et al. [35] performed scRNA-seq and T cell receptor
[24]. Similar to the original CMS classification, cluster 4 in our (TCR) tracking to analyze distinct functions and clonalities
study showed poor 5-year RFS in two independent datasets. among 11,138 T cells from 12 patients with CRC. Using the t-
stochastic neighbor embedding method, the authors found a
High-dimensional analysis of immune landscape of CRCs total of eight CD8+ and 12 CD4+ T cell clusters. Within CD8+ T
Recent advancements in RNA sequencing, proteomics, and cells, naïve T cells, central memory T cells, and recently activated
single-cell technologies have dramatically increased our under- effector memory T (TEMRA) cells were enriched in blood, whereas
standing of the TIME. Deconvolution algorithms such as CIBER- exhausted T (TEX) cells were specifically enriched in tumors.
SORT [25], xCELL [26], and microenvironment cell popula- Resident memory T cells were predominantly found in normal
tions-counter (MCP-counter) [27] for bulk RNA sequencing mucosa. Among CD4+ subtypes, naïve and effector-like cells
are useful tools for transcriptome data [28]. Because there are were enriched in blood. Follicular helper T cells were enriched
many publicly available transcriptome data for CRCs combined in normal mucosa, whereas two IFNG+ Th1-cell-like subsets
with genetic and clinicopathologic data from different datasets, and Th17 cells were enriched in tumors. In clonality analysis,
TIME characteristics of each molecular or pathologic subtype CD8+ TEX cells and TEMRA cells showed the highest degree of
can be identified. Using gene expression signatures, these algo- clonal expansion. Among CD4+ T cells, most tumor-infiltrating
rithms can identify the cellular fractions of 6 to 64 immune and regulatory T (Treg) cells clones showed clonal exclusivity,
nonimmune cells. Mass cytometry provides high-dimensional whereas certain Treg cell clones were developmentally linked to
protein-based cellular data for up to 40 antibodies at an individ- several helper T cell clones. The researchers also found that
ual cell level [29]. Combining cytometry and the time-of-flight CXCL13+BHLHE40+ Th1-like cells were abundant in MSI tu-
method using lanthanide metal ion-tagged antibodies, mass cy- mors, whereas microsatellite-stable (MSS) tumors were moder-
tometry provides high-dimensional data with low background ately enriched with TH17 cells. BHLHE40 is expressed in T
noise. Single-cell RNA sequencing (scRNA-seq) provides un- cells via TCR stimulation, which positively regulates granulo-
biased profiling of immune cells without prior gene selection cyte-macrophage colony-stimulating factor and IFN-γ produc-
[30]. scRNA-seq enables classification of different subsets and tion [36,37]. The authors speculated that enrichment of
identification of novel markers or regulators for each subset. CXCL13+BHLHE40+IFNG+ Th1-like cells might be one cause
Both mass cytometry and scRNA-seq used in an in-situ manner of a favorable response to immunotherapy in patients with MSI
provide a more comprehensive TIME landscape by preserving CRC. Recently, anti-CD40 agonist treatment was reported to
spatial information [31,32]. increase BHLHE40+ Th1-like cells in a MC38 syngeneic mouse
Xiong et al. [33] analyzed the proportion of 22 cell types in tumor model. This finding suggests crosstalk of tumor-associat-
bulk transcriptome data from 2,306 patients with CRC (644 ed BHLHE40+ Th1-like cells and conventional type 1 dendritic
from The Cancer Genome Atlas [TCGA] RNA-sequencing cells [38].
data and 1,662 from Gene Expression Omnibus expression mi- De Vries et al. [39] performed single-cell mass cytometry us-
croarray data) using CIBERSORT. Tumor tissues showed more ing 36 immune cell markers in 35 CRC tissues, 26 tumor-asso-
M0 and M1 macrophages, resting natural killer (NK) cells, ciated lymph nodes, 17 healthy mucosae, and 19 peripheral
plasma cells, and memory and activated CD4+ T cells along blood samples from 31 patients with CRC. Clustering analysis
with fewer resting mast cells and M2 macrophages than normal of CD8+/γδ T cells revealed that activated (HLA-DR+CD38+
tissues. In survival analysis, M1 macrophages and activated PD-l+) and tissue-resident (CD103+CD69+) phenotypes were
dendritic cells were significantly associated with improved out- enriched in tumor tissue compared with other tissues. Clustering
come, whereas eosinophils, neutrophils, and M2 macrophages analysis of CD4+ T cells showed that inducible T-cell co-stimu-
were associated with poorer outcomes. Marisa et al. [34] quan- lator (ICOS)+CD27– cells were enriched in tumor tissues, and
tified immune cell infiltration in transcriptome data using an these cells showed a regulatory-like phenotype overexpressing
http://jpatholtm.org/ https://doi.org/10.4132/jptm.2020.05.15Immuno-oncology in colorectal cancers • 355
FOXP3. In innate lymphocyte populations, Lin–CD7+CD127– CRCs [7,8,46]. Currently, the anti-PD-1 inhibitor pembroli-
CD56+CD45RO+ cells were enriched in tumor tissues, account- zumab can be used as third-line therapy for MSI-H/MMR-D
ing for up to 80% of the innate lymphoid compartment. This CRCs by off-label use after agreement by a multi-disciplinary
subset showed a tissue-resident (CD103+CD69+) phenotype team in designated institutions in Korea.
and displayed cytotoxic activity. Moreover, this cell population
was abundant in mismatch repair (MMR)-deficient tumors. Tumor mutational burden
Norton et al. [40] showed that B lymphocyte-induced matura- Tumor mutational burden (TMB) is a measure of the total
tion protein-1 (BLIMP1)+ Treg cells were significantly enriched amount of somatic coding mutations in a tumor, and it is con-
in tumor tissues compared with normal mucosa. The enrich- sidered an emerging biomarker for ICI treatment [47]. Initially,
ment of ICOS, CD45RO, PD-1, programmed death-ligand 1 the concept of TMB was derived from whole exome sequencing
(PD-L1), lymphocyte-activation gene 3 (LAG-3), CTLA-4, and (WES); however, many studies revealed that TMB calculated
T-cell immunoglobulin mucin-3 (TIM-3) on BLIMP-1+ regu- from targeted next generation sequencing panels showed clini-
latory T cells suggested that BLIMP-1+ Treg cells have a more cally compatible results with WES [48]. TMB values should be
activated phenotype than conventional Treg cells and may play a interpreted cautiously because the calculation formula for TMB
role in the antitumor immune response. Di et al. [41] also found varies among different panels, and the cut-off for TMB-high
that exhausted T cells (PD-1+CD38+HLA-DR+CCR7+CD127–) (TMB-H) status differs among clinical trials and tumor types
and regulatory T cells (CD4+CD25+CD127–) were increased in [49].
tumor tissues. Moreover, they found that CD8+CD28– immu- TCGA consortium reported that 15.9% of 549 CRCs showed
nosenescent T cells with impaired proliferation capacity were hypermutation (≥ 10/Mb) using WES [50]. However, Parikh et
the most abundant T cell population in colorectal tumors. al. [51] reported that TMB-H was observed in 4.9% of 12,569
CRCs using a cut-off of ≥20/Mb analyzed by the Foundation-
BIOMARKERS ASSOCIATED WITH IMMUNE One panel. Although MSI is a proven predictive marker for ICI
MICROENVIRONMENT AND IMMUNOTHERAPY treatment, patients can be stratified further by TMB status.
Schrock et al. [46] recently reported that patients showing ob-
Microsatellite instability/mismatch repair-deficiency jective response had higher TMB (median, 54/Mb; range, 31 to
Germline mutation of genes encoding MMR enzymes (MLH1, 91/Mb) than non-responders (median, 29/Mb; range, 13 to 37/
MSH2, MSH6, and PMS2) or promoter hypermethylation of the Mb) in 22 patients with metastatic MSI-H CRC treated with
hMLH1 gene causes MMR deficiency (MMR-D) [42]. MMR-D anti–PD-1 or anti–PD-L1 treatment [46]. Lee et al. [52] reported
causes numerous frameshift mutations that result in increased that TMB was a prognostic marker of better RFS in stage III or
neoantigen production [43]. Increased neoantigen production high-risk stage II CRCs treated with oxaliplatin-based adjuvant
causes vigorous immune reactions in MSI-H CRCs, such as in- chemotherapy, independent of MSI status.
creased TIL infiltration, peritumoral lymphocytic infiltration, Three-quarters of TMB-H CRCs are MSI-H, and the remain-
and Crohn’s-like lymphoid reactions. How MSI-H CRCs per- ing one-quarter are MSS with somatic mutations in proofread-
sist in a hostile immune microenvironment is of great interest. ing genes, mainly polymerase ε (POLE) and polymerase δ (POLD)
Llosa et al. [44] showed that although MSI-H CRCs showed [53]. In mutation analysis, MSI-H tumors show an insertion-
high infiltration by CD8+ cytotoxic T lymphocytes and Th1 deletion (indel)-predominant pattern, while POLE mutants
cells, these tumors showed upregulated expression of immune show a single nucleotide variation–predominant pattern [54,55].
checkpoint molecules, including PD-1, PD-L1, CTLA-4, LAG- Domingo et al. [56] analyzed the frequency of somatic POLE
3, and indoleamine 2,3-dioxygenase. This finding suggested mutations in 6,517 CRCs, and POLE mutations were detected
that MSI-H CRC may be a good candidate for ICI treatment. in 1% of CRCs. CRCs with POLE mutations are associated
MSI-H/MMR-D CRCs are more responsive to PD-1 blockade with younger age at diagnosis, male sex, and proximal location
than MSS/MMR-proficient CRCs [7]. Because MSI/MMR status [55,56]. Both POLE mutation and MSI-H/MMR-D status were
showed predictive value in other extracolonic cancers, MSI/MMR associated with reduced risk of recurrence in a retrospective
status became a tissue-agnostic predictive biomarker for ICI treat- study [56].
ment [45]. The reported response rate is 28%–52%, and the There are limited data about the predictive value of POLE
disease control rate is 51%–82% for ICI in MSI-H/MMR-D mutations in ICI treatment. In Wang et al.’s study [57], three
https://doi.org/10.4132/jptm.2020.05.15 http://jpatholtm.org/356 • Bae JM et al.
patients harboring pathogenic POLE mutations received ICI T cells).
treatment, and only one patient showed complete remission. Soldevilla et al. [63] evaluated the distribution of six im-
Silberman et al. [58] reported a case of complete and sustained mune subtypes proposed by Thorsson et al. [64] among each
response to anti–PD-1 treatment in a patient with metastatic CMS subtype in TCGA samples. In a total of 625 samples, the
CRCs harboring a pathogenic p.Val411Leu POLE mutation. C1 wound healing subtype (77%) was the most predominant,
followed by the C2 INF-γ dominant subtype (17%). The C1
Consensus molecular subtype wound healing subtype was predominant in the CMS2 subtype
Several investigators have suggested gene expression-based (92%) but less common in the CMS1 subtype (46%). In con-
CRC classifications [59-61]. Due to the similarity among dif- trast, the C2 IFN-γ dominant subtype was the most common
ferent classifications, the international CRC Subtyping Consor- immune subtype in CMS1 (53%) and was underrepresented in
tium proposed a unified transcriptomic classification, which CMS2 (8%). CMS3 showed a higher frequency of the C3 in-
was named the “consensus molecular subtype” (CMS) classifica- flammatory subtype (7%) and the C4 lymphocyte-depleted subtype
tion [23]. CMS1 (14%, MSI immune subtype) is characterized (4%) than the other CMSs. The C6 TGF-β dominant subtype
by MSI-H and CIMP-H statuses in addition to hypermutation was exclusively observed in CMS4.
and BRAF mutation. CMS1 also shows high immune infiltra- Marisa et al. [34] evaluated whether the prognostic value of
tion and activation. CMS2 (37%, canonical subtype) is charac- immune gene expression varies according to CMS. The expres-
terized by somatic copy number alterations and WNT and sion of genes associated with Th1 cells, cytotoxic T cells, and
MYC activation. CMS3 (13%, metabolic subtype) shows meta- cytotoxicity was predictive of better prognosis in MSS tumors
bolic deregulation and is associated with KRAS mutations. from CMS2 and CMS3. In contrast, they had no prognostic rel-
CMS4 (23%, mesenchymal subtype) is characterized by stromal evance in CMS1 and CMS4. A brief summary of genomic and
infiltration, transforming growth factor β (TGF-β) activation, immunologic characteristics of each CMS subtype is shown in
and angiogenesis. In the original CMS paper, CMS1 was associ- Table 1.
ated with worse survival after relapse, while CMS4 was associ-
ated with worse RFS and overall survival. PD-L1 expression
By applying deconvolution algorithms to bulk transcriptome Several studies evaluated the clinicopathologic characteristics
data, Becht et al. [24] and Karpinski et al. [62] evaluated the of PD-L1 expression in CRCs. The frequency of PD-L1 overex-
cellular composition of each CMS subtype in CRCs. In Becht et pression in tumor cells is approximately 5% to 12% in all CRCs
al.’s study [24] using an MCP-counter, CMS1 and CMS4 (1 to 4% in MSS CRCs and 18% to 45% in MSI-H CRCs)
showed high expression of lymphoid and myeloid cell-specific [65-69]. PD-L1 overexpression is associated with female sex,
genes. However, CMS1 exhibited high infiltration by CD8+ right-sided colon occurrence, poor differentiation, solid or med-
cytotoxic T cells and NK cells, whereas CMS4 showed high ex- ullary histology, increased number of TILs, and BRAF V600E
pression of fibroblastic and endothelial cells [24]. Karpinski et mutation. Although a recent meta-analysis showed that PD-L1
al. [62] measured the proportion of 22 immune cell subtypes in overexpression in tumor cells was significantly associated with
1,597 CRCs using CIBERSORT. CMS1 showed enrichment of poor overall survival and decreased DFS, the prognostic value of
leukocytes related to adaptive immunity (follicular helper T PD-L1 overexpression differed according to MSI status [70].
cells, memory activated helper T cells, and cytotoxic T cells) Lee et al. [66] showed that the association of decreased recur-
and innate immunity (activated NK cells, γδ T cells, M1 mac- rence-free survival with PD-L1 overexpression was only ob-
rophages, activated dendritic cells, activated mast cells, and neu- served in MSI-H CRCs. In Marisa et al.’s transcriptome analysis
trophils). In addition, CMS1 showed depletion of Treg cells. CMS2 [34], there was a strong association of immune checkpoint ex-
showed enrichment of helper T cells and memory B cells. CMS3 pression with infiltration of specific lymphoid (NK cells, T cells,
showed low levels of immune activation that manifested as and cytotoxic cells) and myeloid cells, whereas B cells, fibro-
high levels of resting memory helper T cells, naïve B cells, and blasts, vessels, and granulocytes showed little or no association
low levels of macrophages, neutrophils, and activated helper T with immune checkpoint expression. Patients with MSI-H CRC
cells. Last, CMS4 was characterized by the highest proportions with high immune checkpoint expression, including high ex-
of leukocytes related to protumor activity (eosinophils, mono- pression of PD-L1, showed significantly poorer overall survival
cytes, M2 macrophages, resting dendritic cells, and regulatory compared to patients with MSI-H CRC and low immune
http://jpatholtm.org/ https://doi.org/10.4132/jptm.2020.05.15Immuno-oncology in colorectal cancers • 357
Table 1. Genomic and immunologic characteristics of consensus molecular subtype
CMS1 CMS2 CMS3 CMS4
MSI immune (14%) canonical (37%) metabolic (13%) mesenchymal (23%)
Genomic feature MSI MSS MSS MSS
CIMP-positive CIMP-negative CIMP-low CIMP-negative
Hypermutation SCNA-high SCNA-intermediate SCNA-high
SCNA-low
Expression signature Immune infiltration and WNT and MYC activation Metabolic deregulation Stromal infiltration,
activation TGF-β activation, angiogenesis
Immune-subtype Immune activated Immune desert Immune excluded Immune inflamed
Immune cell infiltration CD8+ TIL ↑ MDSC↑
Macrophages ↑ Treg ↑
NK cells ↑ Th17 ↑
Immune gene expression T cell chemotaxis and MHC1 (HLA, B2M) ↓ Angiogenesis (VEGF) ↑
activation (CXCL9, Immunosuppression (TGF-β) ↑
CXCL10, CXCL16, IFN-γ) ↑ Complement ↑
T cell-specific inhibition
(PD-1, PD-L1, CTLA-4,
LAG-3) ↑
MHC1 (HLA, B2M) ↑
Immune subtype by C2 INF-γ dominant ↑↑ C1 wound healing ↑↑ C3 inflammatory ↑ C6 TGF-β dominant ↑
Thorsson et al. [63,64] C4 lymphocyte depleted ↑
TIME cluster by Yoo et al. [22] Cluster 1, TIL ↑↑ Cluster 2, TSR ↓↓ Cluster 3, CD8/CD3 ↑↑ Cluster 4, TSR ↑↑
CMS, consensus molecular subtype; MSI, microsatellite instability; MSS, microsatellite stable; CIMP, CpG island methylator phenotype; SCNA, somatic copy
number alteration; TIL, tumor-infiltrating lymphocytes; NK, natural killer; MDSC, myeloid-derived suppressor cell; Treg, regulatory T cell; IFN, interferon; PD-1,
programmed death-1; PD-L1, programmed death-ligand 1; CTLA-4, cytotoxic T-lymphocyte antigen 4; LAG-3, lymphocyte-activation gene 3; TGF-β, trans-
forming growth factor-β;TSR, tumor-stroma ratio.
TMB-H (5–16%)
MSI-H (8–12%)
Sex: female predominant
Age of onset: younger (Lynch-associated), older (sporadic)
Location: proximal colon
Response to ICI: good
POLE/POLD mutation (1%)
Sex: male predominant
Age of onset: younger PD-L1 expression (5–12%)
Location: proximal colon
Sex: female predominant
Response to ICI: not known
Age of onset: older
Location: proximal colon
Response to ICI: no association
Fig. 3. Correlation of tumor mutational burden, microsatellite instability, POLE/POLD mutation, and programmed death-ligand 1 (PD-L1) ex-
pression in colorectal cancers. TMB-H, tumor mutational burden-high; MSI-H, microsatellite instability-high; ICI, immune checkpoint inhibitor.
checkpoint expression. However, immune checkpoint expression results, which showed increased PD-L1 expression in sporadic
status did not influence the clinical outcome of patients with MSI-H CRCs (25.0%) compared to Lynch syndrome-associated
MSS CRC. CRCs (3.6%). The underlying mechanism of PD-L1 overex-
In addition, the frequency of PD-L1 expression in MSI-H pression in sporadic MSI CRCs should be further investigated.
CRCs differs by the etiology of MSI. In our previous study, MSI Although PD-L1 expression is considered a predictive mark-
CRCs with MLH1 methylation showed a higher frequency of er for ICI treatment in several types of cancer, such as melanoma
PD-L1 expression (28.3%) than MSI CRCs without MLH1 and non-small-cell lung cancer, currently available data have
methylation (6.1%) [67]. Yamada et al. [71] reported similar demonstrated that PD-L1 expression has no predictive value in
https://doi.org/10.4132/jptm.2020.05.15 http://jpatholtm.org/358 • Bae JM et al.
CRC with ICI treatment [7,8]. The discrepancy between PD- cidence, mortality, survival, and prevalence in 2016. Cancer Res
Treat 2019; 51: 417-30.
L1 expression and response to ICI treatment might be related
2. Siegel RL, Miller KD, Fedewa SA, et al. Colorectal cancer statistics,
to spatiotemporal variations in PD-L1 expression, the cut-off 2017. CA Cancer J Clin 2017; 67: 177-93.
for PD-L1 positivity, or interobserver variations in interpreta- 3. Bae JM, Kim JH, Kwak Y, et al. Distinct clinical outcomes of two
tions. The correlations of each biomarker described above are CIMP-positive colorectal cancer subtypes based on a revised CIMP
classification system. Br J Cancer 2017; 116: 1012-20.
summarized in Fig. 3. 4. Fridman WH, Zitvogel L, Sautès-Fridman C, Kroemer G. The im-
mune contexture in cancer prognosis and treatment. Nat Rev Clin
CONCLUSION Oncol 2017; 14: 717-34.
5. Hodi FS, O'Day SJ, McDermott DF, et al. Improved survival with
ipilimumab in patients with metastatic melanoma. N Engl J Med
Evaluation of the TIME in CRCs has advanced from semi- 2010; 363: 711-23.
quantitative visual inspection to quantitative and high-dimen- 6. Garon EB, Rizvi NA, Hui R, et al. Pembrolizumab for the treatment
sional approaches. Numerous clinical trials are ongoing to de- of non-small-cell lung cancer. N Engl J Med 2015; 372: 2018-28.
7. Le DT, Uram JN, Wang H, et al. PD-1 blockade in tumors with
velop next-generation immune checkpoint drugs that target
mismatch-repair deficiency. N Engl J Med 2015; 372: 2509-20.
checkpoint modulators beyond PD-1/PD-L1, such as TIM-3, 8. Overman MJ, McDermott R, Leach JL, et al. Nivolumab in patients
LAG-3, and T cell immunoreceptor with Ig and ITIM domains with metastatic DNA mismatch repair-deficient or microsatellite
[72]. Combination immunotherapies, which combine cytotoxic instability-high colorectal cancer (CheckMate 142): an open-label,
multicentre, phase 2 study. Lancet Oncol 2017; 18: 1182-91.
chemotherapeutic agents or vascular endothelial growth factor 9. Spratt JS Jr, Spjut HJ. Prevalence and prognosis of individual clini-
inhibitors with ICIs, are also being investigated. The importance cal and pathologic variables associated with colorectal carcinoma.
of comprehensive understanding of the TIME is constantly in- Cancer 1967; 20: 1976-85.
creasing in the era of immunotherapy. Moreover, numerous ef- 10. Watt AG, House AK. Colonic carcinoma: a quantitative assessment
of lymphocyte infiltration at the periphery of colonic tumors relat-
forts are required to develop more precise biomarkers to classify ed to prognosis. Cancer 1978; 41: 279-82.
responders to immunotherapy in CRC. 11. Pihl E, Malahy MA, Khankhanian N, Hersh EM, Mavligit GM. Im-
munomorphological features of prognostic significance in Dukes'
Ethics Statement Class B colorectal carcinoma. Cancer Res 1977; 37: 4145-9.
Not applicable. 12. Maoz A, Dennis M, Greenson JK. The Crohn's-like lymphoid reac-
tion to colorectal cancer-tertiary lymphoid structures with immu-
ORCID nologic and potentially therapeutic relevance in colorectal cancer.
Front Immunol 2019; 10: 1884.
Jeong Mo Bae https://orcid.org/0000-0003-0462-3072
Seung-Yeon Yoo https://orcid.org/0000-0002-7881-9038 13. Naito Y, Saito K, Shiiba K, et al. CD8+ T cells infiltrated within can-
Jung Ho Kim https://orcid.org/0000-0002-6031-3629 cer cell nests as a prognostic factor in human colorectal cancer. Can-
Gyeong Hoon Kang https://orcid.org/0000-0003-2380-6675 cer Res 1998; 58: 3491-4.
14. Ogino S, Nosho K, Irahara N, et al. Lymphocytic reaction to
Author Contributions colorectal cancer is associated with longer survival, independent of
Conceptualization: JMB, GHK. Funding acquisition: JMB. Investigation: lymph node count, microsatellite instability, and CpG island meth-
JMB, SYY, JHK. Methodology: JMB, SYY, JHK. Supervision: GHK. Writ- ylator phenotype. Clin Cancer Res 2009; 15: 6412-20.
ing—original draft: JMB. Writing—review & editing: JMB, GHK. Approval 15. Nearchou IP, Lillard K, Gavriel CG, Ueno H, Harrison DJ, Caie PD.
of final manuscript: all authors. Automated analysis of lymphocytic infiltration, tumor budding, and
their spatial relationship improves prognostic accuracy in colorectal
Conflicts of Interest cancer. Cancer Immunol Res 2019; 7: 609-20.
J.H.K. and G.H.K., contributing editors of the Journal of Pathology and 16. Galon J, Costes A, Sanchez-Cabo F, et al. Type, density, and loca-
Translational Medicine, were not involved in the editorial evaluation or de- tion of immune cells within human colorectal tumors predict clini-
cision to publish this article. All remaining authors have declared no con- cal outcome. Science 2006; 313: 1960-4.
flicts of interest. 17. Anitei MG, Zeitoun G, Mlecnik B, et al. Prognostic and predictive
values of the immunoscore in patients with rectal cancer. Clin Can-
Funding Statement cer Res 2014; 20: 1891-9.
This study was supported by grants from the National Research Founda- 18. Mlecnik B, Bindea G, Angell HK, et al. Integrative analyses of
tion (NRF) (Grant number: NRF-2017R1D1A1B03030073) and the Seoul colorectal cancer show immunoscore is a stronger predictor of pa-
National University Hospital (SNUH) Research Fund (Grant number: 04- tient survival than microsatellite instability. Immunity 2016; 44:
2019-0560). 698-711.
19. Mlecnik B, Van den Eynde M, Bindea G, et al. Comprehensive in-
References trametastatic immune quantification and major impact of immu-
1. Jung KW, Won YJ, Kong HJ, Lee ES. Cancer statistics in Korea: in- noscore on survival. J Natl Cancer Inst 2018; 110: 97-108.
http://jpatholtm.org/ https://doi.org/10.4132/jptm.2020.05.15Immuno-oncology in colorectal cancers • 359
20. Pages F, Mlecnik B, Marliot F, et al. International validation of the sional mass cytometric analysis reveals an increase in effector regu-
consensus immunoscore for the classification of colon cancer: a latory T cells as a distinguishing feature of colorectal tumors. J Im-
prognostic and accuracy study. Lancet 2018; 391: 2128-39. munol 2019; 202: 1871-84.
21. Reichling C, Taieb J, Derangere V, et al. Artificial intelligence-guid- 41. Di J, Liu M, Fan Y, et al. Phenotype molding of T cells in colorectal
ed tissue analysis combined with immune infiltrate assessment cancer by single-cell analysis. Int J Cancer 2020; 146: 2281-95.
predicts stage III colon cancer outcomes in PETACC08 study. Gut 42. Boland CR, Goel A. Microsatellite instability in colorectal cancer.
2020; 69: 681-90. Gastroenterology 2010; 138: 2073-87.
22. Yoo SY, Park HE, Kim JH, et al. Whole-slide image analysis reveals 43. Dudley JC, Lin MT, Le DT, Eshleman JR. Microsatellite instability as
quantitative landscape of tumor-immune microenvironment in a biomarker for PD-1 blockade. Clin Cancer Res 2016; 22: 813-20.
colorectal cancers. Clin Cancer Res 2020; 26: 870-81. 44. Llosa NJ, Cruise M, Tam A, et al. The vigorous immune microenvi-
23. Guinney J, Dienstmann R, Wang X, et al. The consensus molecular ronment of microsatellite instable colon cancer is balanced by mul-
subtypes of colorectal cancer. Nat Med 2015; 21: 1350-6. tiple counter-inhibitory checkpoints. Cancer Discov 2015; 5: 43-51.
24. Becht E, de Reynies A, Giraldo NA, et al. Immune and stromal 45. Le DT, Durham JN, Smith KN, et al. Mismatch repair deficiency
classification of colorectal cancer is associated with molecular sub- predicts response of solid tumors to PD-1 blockade. Science 2017;
types and relevant for precision immunotherapy. Clin Cancer Res 357: 409-13.
2016; 22: 4057-66. 46. Schrock AB, Ouyang C, Sandhu J, et al. Tumor mutational burden
25. Newman AM, Liu CL, Green MR, et al. Robust enumeration of cell is predictive of response to immune checkpoint inhibitors in MSI-
subsets from tissue expression profiles. Nat Methods 2015; 12: 453-7. high metastatic colorectal cancer. Ann Oncol 2019; 30: 1096-103.
26. Aran D, Hu Z, Butte AJ. xCell: digitally portraying the tissue cellu- 47. Klempner SJ, Fabrizio D, Bane S, et al. Tumor mutational burden as
lar heterogeneity landscape. Genome Biol 2017; 18: 220. a predictive biomarker for response to immune checkpoint inhibi-
27. Becht E, Giraldo NA, Lacroix L, et al. Estimating the population tors: a review of current evidence. Oncologist 2020; 25: e147-59.
abundance of tissue-infiltrating immune and stromal cell popula- 48. Chalmers ZR, Connelly CF, Fabrizio D, et al. Analysis of 100,000
tions using gene expression. Genome Biol 2016; 17: 218. human cancer genomes reveals the landscape of tumor mutational
28. Jimenez-Sanchez A, Cast O, Miller ML. Comprehensive bench- burden. Genome Med 2017; 9: 34.
marking and integration of tumor microenvironment cell estima- 49. Merino DM, McShane LM, Fabrizio D, et al. Establishing guide-
tion methods. Cancer Res 2019; 79: 6238-46. lines to harmonize tumor mutational burden (TMB): in silico as-
29. Labib M, Kelley SO. Single-cell analysis targeting the proteome. Nat sessment of variation in TMB quantification across diagnostic
Rev Chem 2020; 4: 143-58. platforms: phase I of the Friends of Cancer Research TMB Harmo-
30. Zhang L, Zhang Z. Recharacterizing tumor-infiltrating lympho- nization Project. J Immunother Cancer 2020; 8: e000147.
cytes by single-cell RNA sequencing. Cancer Immunol Res 2019; 7: 50. Cancer Genome Atlas Network. Comprehensive molecular charac-
1040-6. terization of human colon and rectal cancer. Nature 2012; 487: 330-7.
31. Moncada R, Barkley D, Wagner F, et al. Integrating microarray- 51. Parikh AR, He Y, Hong TS, et al. Analysis of DNA damage response
based spatial transcriptomics and single-cell RNA-seq reveals tissue gene alterations and tumor mutational burden across 17,486 tubular
architecture in pancreatic ductal adenocarcinomas. Nat Biotechnol gastrointestinal carcinomas: implications for therapy. Oncologist
2020; 38: 333-42. 2019; 24: 1340-7.
32. Jackson HW, Fischer JR, Zanotelli VR, et al. The single-cell pathol- 52. Lee DW, Han SW, Bae JM, et al. Tumor mutation burden and prog-
ogy landscape of breast cancer. Nature 2020; 578: 615-20. nosis in patients with colorectal cancer treated with adjuvant fluo-
33. Xiong Y, Wang K, Zhou H, Peng L, You W, Fu Z. Profiles of im- ropyrimidine and oxaliplatin. Clin Cancer Res 2019; 25: 6141-7.
mune infiltration in colorectal cancer and their clinical significant: 53. Vanderwalde A, Spetzler D, Xiao N, Gatalica Z, Marshall J. Micro-
a gene expression-based study. Cancer Med 2018; 7: 4496-508. satellite instability status determined by next-generation sequenc-
34. Marisa L, Svrcek M, Collura A, et al. The balance between cytotoxic ing and compared with PD-L1 and tumor mutational burden in
T-cell lymphocytes and immune checkpoint expression in the 11,348 patients. Cancer Med 2018; 7: 746-56.
prognosis of colon tumors. J Natl Cancer Inst 2018; 110: 68-77. 54. Liu Y, Sethi NS, Hinoue T, et al. Comparative molecular analysis of
35. Zhang L, Yu X, Zheng L, et al. Lineage tracking reveals dynamic re- gastrointestinal adenocarcinomas. Cancer Cell 2018; 33: 721-35.
lationships of T cells in colorectal cancer. Nature 2018; 564: 268-72. 55. Hino H, Shiomi A, Kusuhara M, et al. Clinicopathological and mu-
36. Miyazaki K, Miyazaki M, Guo Y, et al. The role of the basic helix- tational analyses of colorectal cancer with mutations in the POLE
loop-helix transcription factor Dec1 in the regulatory T cells. J Im- gene. Cancer Med 2019; 8: 4587-97.
munol 2010; 185: 7330-9. 56. Domingo E, Freeman-Mills L, Rayner E, et al. Somatic POLE
37. Lin CC, Bradstreet TR, Schwarzkopf EA, et al. Bhlhe40 controls proofreading domain mutation, immune response, and prognosis
cytokine production by T cells and is essential for pathogenicity in in colorectal cancer: a retrospective, pooled biomarker study. Lan-
autoimmune neuroinflammation. Nat Commun 2014; 5: 3551. cet Gastroenterol Hepatol 2016; 1: 207-16.
38. Zhang L, Li Z, Skrzypczynska KM, et al. Single-cell analyses inform 57. Wang C, Gong J, Tu TY, Lee PP, Fakih M. Immune profiling of mi-
mechanisms of myeloid-targeted therapies in colon cancer. Cell crosatellite instability-high and polymerase epsilon (POLE)-mutat-
2020; 181: 442-59. ed metastatic colorectal tumors identifies predictors of response to
39. de Vries NL, van Unen V, Ijsselsteijn ME, et al. High-dimensional anti-PD-1 therapy. J Gastrointest Oncol 2018; 9: 404-15.
cytometric analysis of colorectal cancer reveals novel mediators of 58. Silberman R, Steiner DF, Lo AA, et al. Complete and prolonged re-
antitumour immunity. Gut 2020; 69: 691-703. sponse to immune checkpoint blockade in POLE-mutated colorec-
40. Norton SE, Ward-Hartstonge KA, McCall JL, et al. High-dimen- tal cancer. JCO Precis Oncol 2019 Jun 21 [Epub]. https://doi.org/
https://doi.org/10.4132/jptm.2020.05.15 http://jpatholtm.org/360 • Bae JM et al.
10.1200/PO.18.00214. Pathol 2016; 29: 1104-12.
59. De Sousa EM, Wang X, Jansen M, et al. Poor-prognosis colon can- 66. Lee LH, Cavalcanti MS, Segal NH, et al. Patterns and prognostic
cer is defined by a molecularly distinct subtype and develops from relevance of PD-1 and PD-L1 expression in colorectal carcinoma.
serrated precursor lesions. Nat Med 2013; 19: 614-8. Mod Pathol 2016; 29: 1433-42.
60. Sadanandam A, Lyssiotis CA, Homicsko K, et al. A colorectal can- 67. Kim JH, Park HE, Cho NY, Lee HS, Kang GH. Characterisation of
cer classification system that associates cellular phenotype and re- PD-L1-positive subsets of microsatellite-unstable colorectal can-
sponses to therapy. Nat Med 2013; 19: 619-25. cers. Br J Cancer 2016; 115: 490-6.
61. Marisa L, de Reynies A, Duval A, et al. Gene expression classifica- 68. Inaguma S, Lasota J, Wang Z, Felisiak-Golabek A, Ikeda H, Miettin-
tion of colon cancer into molecular subtypes: characterization, vali- en M. Clinicopathologic profile, immunophenotype, and genotype
dation, and prognostic value. PLoS Med 2013; 10: e1001453. of CD274 (PD-L1)-positive colorectal carcinomas. Mod Pathol
62. Karpinski P, Rossowska J, Sasiadek MM. Immunological landscape 2017; 30: 278-85.
of consensus clusters in colorectal cancer. Oncotarget 2017; 8: 69. Eriksen AC, Sorensen FB, Lindebjerg J, et al. Programmed death li-
105299-311. gand-1 expression in stage II colon cancer - experiences from a na-
63. Soldevilla B, Carretero-Puche C, Gomez-Lopez G, et al. The corre- tionwide populationbased cohort. BMC Cancer 2019; 19: 142.
lation between immune subtypes and consensus molecular sub- 70. Li Y, He M, Zhou Y, et al. The prognostic and clinicopathological
types in colorectal cancer identifies novel tumour microenviron- roles of PD-L1 expression in colorectal cancer: a systematic review
ment profiles, with prognostic and therapeutic implications. Eur J and meta-analysis. Front Pharmacol 2019; 10: 139.
Cancer 2019; 123: 118-29. 71. Yamada R, Yamaguchi T, Iijima T, et al. Differences in histological
64. Thorsson V, Gibbs DL, Brown SD, et al. The immune landscape of features and PD-L1 expression between sporadic microsatellite in-
cancer. Immunity 2018; 48: 812-30. stability and Lynch-syndrome-associated disease in Japanese pa-
65. Rosenbaum MW, Bledsoe JR, Morales-Oyarvide V, Huynh TG, tients with colorectal cancer. Int J Clin Oncol 2018; 23: 504-13.
Mino-Kenudson M. PD-L1 expression in colorectal cancer is asso- 72. Ganesh K, Stadler ZK, Cercek A, et al. Immunotherapy in colorec-
ciated with microsatellite instability, BRAF mutation, medullary tal cancer: rationale, challenges and potential. Nat Rev Gastroen-
morphology and cytotoxic tumor-infiltrating lymphocytes. Mod terol Hepatol 2019; 16: 361-75.
http://jpatholtm.org/ https://doi.org/10.4132/jptm.2020.05.15You can also read