The Effect of the Endothelial Cell Cortex on Atomic Force Microscopy Measurements
←
→
Page content transcription
If your browser does not render page correctly, please read the page content below
300                                                                               Biophysical Journal   Volume 105     July 2013     300–309

The Effect of the Endothelial Cell Cortex on Atomic Force Microscopy
Measurements

R. Vargas-Pinto,† H. Gong,‡ A. Vahabikashi,† and M. Johnson§*
†
 Biomedical Engineering Department, Northwestern University, Evanston, Illinois; ‡Department of Ophthalmology, Boston University School of
Medicine, Boston, Massachusetts; and §Departments of Biomedical Engineering, Mechanical Engineering and Ophthalmology, Northwestern
University, Evanston, Illinois

ABSTRACT We examined whether the presence of the cell cortex might explain, in part, why previous studies using atomic
force microscopy (AFM) to measure cell modulus (E) gave higher values with sharp tips than for larger spherical tips. We
confirmed these AFM findings in human umbilical vein endothelial cells (HUVEC) and Schlemm’s canal (SC) endothelial cells
with AFM indentation % 400 nm, two cell types with prominent cortices (312 5 65 nm in HUVEC and 371 5 91 nm in SC cells).
With spherical tips, E (kPa) was 0.71 5 0.16 in HUVEC and 0.94 5 0.06 in SC cells. Much higher values of E were measured
using sharp tips: 3.23 5 0.54 in HUVEC and 6.67 5 1.07 in SC cells. Previous explanations for this difference such as strain
hardening or a substrate effect were shown to be inconsistent with our measurements. Finite element modeling studies showed
that a stiff cell cortex could explain the results. In both cell types, Latrunculin-A greatly reduced E for sharp and rounded tips, and
also reduced the ratio of the values measured with a sharp tip as compared to a rounded tip. Our results suggest that the cell
cortex increases the apparent endothelial cell modulus considerably when measured using a sharp AFM tip.

INTRODUCTION
AFM is widely used to characterize the elasticity of living             to be enhanced by deeper indentations. Harris and Charras
cells (1–7). As the tip mounted at the end of a cantilever              (11) suggested that indentations should be held to
Effect of Cell Cortex on AFM Measurements                                                                                                                         301

tip. We found that the cortex of these cells is likely respon-
sible for this.

METHODS
Cell culture, fluorescent staining, and
experiments with latrunculin
Endothelial cell growth medium and two human umbilical vein endothelial
cell (HUVEC) strains were purchased from Cell Applications (San Diego,
CA). Schlemm’s Canal (SC) cells from six strains (each from a different
donor), courtesy of Dr. W. Daniel Stamer (then at the Department of
Ophthalmology, University of Arizona, Tucson, AZ), were isolated from
enucleated eyes or corneal rims following previously described procedures
(22). Eyes used for cell isolation had no history of eye disease, laser or ante-
rior segment surgery. Culture medium used for SC cells was DMEM/Low
glucose (Hyclone Laboratories, Logan, UT) with 10% fetal bovine serum
(PAA Laboratories, New Bedford, MA) and 1% penicillin and streptomycin             FIGURE 1 Scanning electron microscopy image of the sharp tip (A) and
(Lonza, Walkersville, MD).                                                         the spherical 4.5 mm tip (B). (C and D) Shape of the corresponding tip used
   HUVEC and SC cells were maintained under normal culture conditions              in the finite element M modeling. All panels are at the same scale.
(37 C and 5% CO2) and culture medium was changed three times per week.
Cells used for experiments described here were passage 5 or less. In prep-
                                                                                   radius of 8 nm. Its tip height was 15–20 mm as compared to 2.9 mm for the
aration for experiments, cells were detached from culture flasks using
                                                                                   Olympus tip used. Unless otherwise mentioned in the text, all results pre-
0.25% trypsin with EDTA and plated in 60-mm petri dishes. The time dur-
                                                                                   sented for a sharp tip are for the Olympus tip.
ing which cells remained in petri dishes before experimentation varied be-
                                                                                      During AFM experiments, cells were maintained in culture medium at
tween 1 and 8 days for HUVEC and 2–13 days for SC cells. Cell culture
                                                                                   37 C. Force measurements were made by indenting isolated cells up to
supplies were purchased from VWR International (West Chester, PA) un-
                                                                                   400 nm in depth; in one study with a sharp Bruker tip, the effects of deeper
less otherwise specified.
                                                                                   indentations (up to 900 nm) were examined. The tip velocity used during
   On the day of experimentation, subconfluent cells were stained with fluo-
                                                                                   indentation (800 nm/s) was chosen to avoid viscous effects (4) based on pre-
rescent dyes (Hoechst 33342, 3 mg/mL, and Calcein AM, 2 mg/mL, both
                                                                                   liminary studies. A total of 5–10 force measurements per cell were done at
purchased from Invitrogen, Carlsbad, CA) to assess cell viability, ensure
                                                                                   different locations including locations above the nucleus of the cell and in
that the cells were not punctured during the AFM measurement, and aid
                                                                                   nonnuclear regions, avoiding the periphery of the cell.
in localization of cell nucleus. After staining, cells were incubated for at
                                                                                      The force (F) applied to indent the cell was determined as a function
least 1 h before beginning AFM experiments. The effects of cell staining
                                                                                   of indentation depth (d). The former was found as F ¼ k(ddo), where k
were investigated in one HUVEC strain.
                                                                                   and d are the spring constant and deflection of the cantilever, respectively,
   Additional experiments were done to examine the effect of Latrunculin,
                                                                                   and do is the deflection when contact is first established between the tip and
an actin depolymerizing agent, on cell modulus. A stock solution of 1 mM
                                                                                   the cell. The indentation was determined as d ¼ (z – zo) – (d – do) where z
Latrunculin-A in dimethyl sulfoxide (both purchased from Sigma-Aldrich,
                                                                                   is the height of the tip from an arbitrary datum and zo is the height of the tip
St. Louis, MO) was further diluted in serum free culture medium to a final
                                                                                   at the point of initial contact (7). The initial point of contact with the cell (zo,
concentration of 1 mM. Cells already stained with fluorescent dyes were
                                                                                   do) was determined using an algorithm proposed by Crick and Yin (21) in
treated with Latrunculin-A for 30 min, washed, and then returned to media.
                                                                                   which noise is accounted for by picking a best fit of pre- and post-contact
                                                                                   data. Assuming that pre-contact data are linear and post-contact data are
                                                                                   quadratic, the algorithm chooses the putative contact point as the one that
AFM measurements                                                                   produces the best fit for both pre-and post-contact data. Fig. 2, A and B,
AFM measurements were made using a BioScope-II with NanoscopeV                     show typical results for F versus d for the sharp and spherical tip,
controller and software (Veeco, Santa Barbara, CA) mounted over an in-             respectively.
verted microscope (Carl Zeiss, Thornwood, NY). AFM probes used in                     To determine the aggregate cell modulus, a theoretical model relating F
our study include a silicon nitride sharp pyramidal tip and two different          to d was applied. For a pyramidal tip, the following relationship has been
sizes of polystyrene spherical probes to determine the effect that tip geom-       proposed (24) although it was not ultimately used in our studies (see
etry and size have on the measurements.                                            below):
   The pyramidal tip used, model Olympus TR400PSA (Asylum Research,
                                                                                                                    1:4906E$tan q 2
Santa Barbara, CA), has a 20 nm nominal spherical cap radius, semiin-                                       F ¼                  $d :                             (1)
cluded angle (q) of 36 (measured used scanning electron microscopy;                                                  2ð1  v2 Þ
see Fig. 1 A), mounted on a 200 mm triangular cantilever with nominal
spring constant of 0.02 N/m. Spherical tips (Novascan Technologies,                For a spherical tip, we used the following relationship (25):
Ames, IA) used had nominal diameters of 4.5 (Fig. 1 B) and 10 mm mounted
                                                                                                                                 1
on a silicon nitride cantilever with nominal spring constant of 0.01 N/m.                                               4E$R2      3
The spring constant was calibrated before each experiment using the Ther-                                      F ¼               $d2 :                            (2)
mal Fluctuations function of the Nanoscope software that measures the
                                                                                                                       3ð1  v Þ
                                                                                                                              2

cantilever’s motion in response to thermal noise (23).
   In a few experiments, a longer pyramidal tip was used to ensure that the        In each case, the Poisson’s ratio (n) was set equal to 0.5, assuming cells are
underside of the cantilever was not affecting the measurements (11). We            incompressible (11,26,27). For Eq. 1, q ¼ 36 (except for the longer Bruker
used a MPP-32100-10 (Bruker AFM Probes, Camarillo, CA) with a nomi-                tip where an angle of either 15 or 25 was used) whereas for Eq. 2, the
nal front angle of 15 , side angle of 17.5 and back angle of 25 , and a tip     radius of the spherical tip used (4.5 or 10 mm) was used for R. Typical

                                                                                                                          Biophysical Journal 105(2) 300–309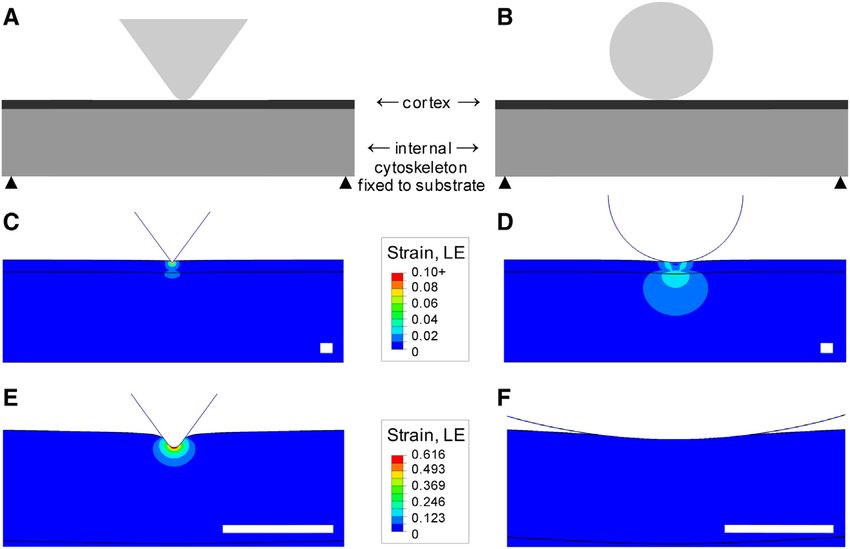
302                                                                                                                                       Vargas-Pinto et al.

                                                                                                           FIGURE 2 Sample of force-versus-indentation
                                                                                                           data measured on SC cells with AFM using (A)
                                                                                                           sharp and (B) 4.5 mm spherical tips. Corresponding
                                                                                                           values of Young’s modulus were calculated for a
                                                                                                           sharp tip using Eq. 1 (C, for sharp tip), Eq. 2 (D,
                                                                                                           for 4.5 mm spherical tip), and Eq. 3 (E, for sharp
                                                                                                           tip). (F) Typical results for Young’s modulus calcu-
                                                                                                           lated using Eq. 3 for the longer Bruker sharp tip.

results are seen in Fig. 2, C and D. We note that n in some cell types has         Finite element modeling methods
been measured with values as low as 0.3 (28,29). Equations 1–3, used to
experimentally calculate the cell modulus, each have an identical factor           We modeled the process by which the AFM tip indented into the cell cortex
of 1–n2 in the expression relating force to indentation. Using a value of          and underlying internal cytoskeleton (see Fig. 6, A and B). The tip was
n of 0.3 instead of 0.5 in these equations would increase the measured             modeled as a rigid body (16) with its geometry chosen to match the tips
values of E by ~20%, but it would have the same effect on all measurements         used during AFM experiments (Fig. 1, C and D). The geometry of the sharp
and thus, none of the relative comparisons would be affected.                      tip was simplified from a pyramid to a cone to take advantage of the reduced
   Although the results from the spherical tip (e.g., Fig. 2 D) showed that E      computational cost that arises from using an axisymmetric model instead of
was relatively independent of d (except for very small values of d), this was      a three-dimensional geometry.
not the case for the sharp tip (e.g., Fig. 2 C). These showed that E, as calcu-       The cytoskeleton of the cell was modeled as a cylindrical disk with a
lated using Eq. 1, decreased with increasing d. Such behavior has been pre-        radius of 10 or 20 mm and thickness of 3 mm, with a cortex surrounding
viously described by Rico et al. (13) and Briscoe et al. (30) for pyramidal        the cell having a thickness of 200–400 nm. The radius was chosen such
and conical indenters, respectively. They noted that sharp tapered tips are        that the strain at the edges of the domain was
Effect of Cell Cortex on AFM Measurements 303
size, while allowing a more refined mesh near the tip where larger deforma- The log transformation resulted in the data being normally distributed.
tions were expected. For the sharp tip model, the ALE adaptive meshing Log-transformed data were used to compute means, and significance was
feature was used on the cortex and internal cytoskeleton to improve the determined at the 0.05 level using an independent-sample Student’s t-test
aspect ratio of the mesh. Due to the high strains generated by this tip, an not assuming equal variances. Data are reported as geometric means 5
adaptive meshing feature was used that improved the quality of the mesh standard error about the geometric mean. It should be noted that the conclu-
during large deformations by allowing the mesh to move independently sions drawn from these data do not depend on use of the log transformation,
of the material and prevented high distortion of the elements. The new po- other than the normality of the log data set. All statistically significant re-
sition of a node was determined based on the average of the positions of sults were confirmed using a Mann-Whitney U-test.
each of the adjacent nodes by using the Laplacian smoothing method. An
explicit method was used to solve for the stress, strain, and displacement
fields as a function of indentation. RESULTS
For each tip, we calculated the indentation force as a function of inden-
tation depth. This force-deformation relation was then fitted by Eq. 2 (for Cell imaging
spherical tip) or Eq. 3 (for sharp tip) to obtain an apparent Young’s modulus,
Eapparent, the equivalent modulus of a cell composed of a single uniform ma-
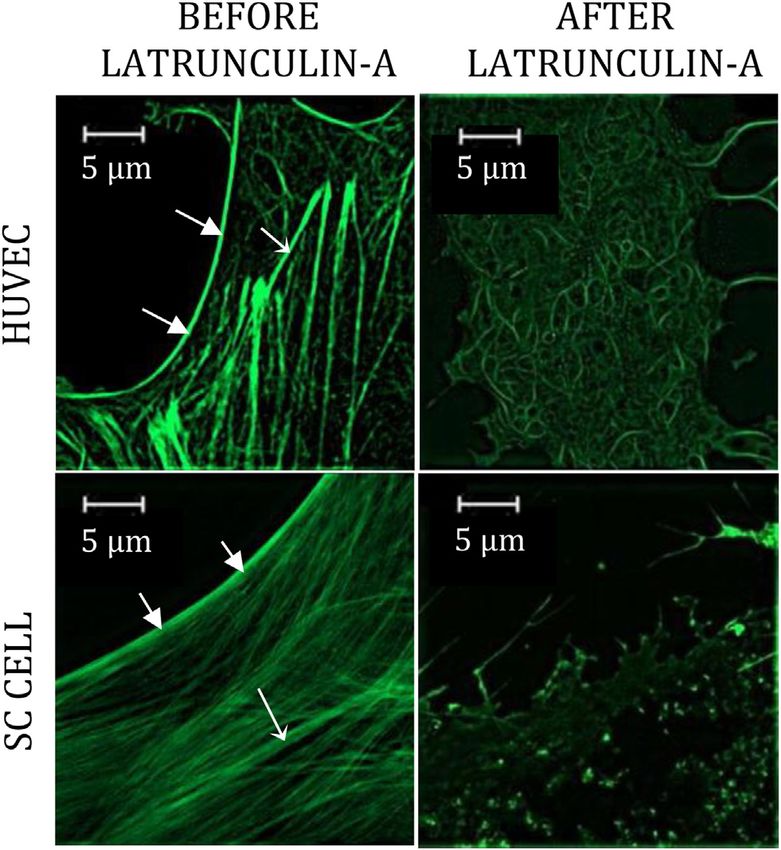
Imaging studies were done to establish that these cell types
terial. The vertical downward displacement of the indenter was limited to have a prominent cell cortex and to estimate the thickness of
80 nm. Higher indentations with a sharp tip caused excessive distortion this cortex. Confocal reconstruction allowed us to visualize
of the elements and the model did not converge to a solution. Ng et al. cross-section of these cells as shown in Fig. 3. F-actin stain-
(18) reported a similar limitation in their work modeling AFM indentations. ing showed a dense cortex on both the basal and apical
To validate FEM techniques, we compared the numerical results for
Eapparent to a prescribed value of E for both a sharp tip and a spherical tip
aspect of these cells, consistent with a high cortical stiffness.
indenting a semiinfinite, homogenous, elastic medium of given modulus The cortex thickness was measured as 312 5 65 nm
(E). Calculated values of Eapparent were within 0.5% of the given modulus (mean 5 SE, n ¼ 50) for the HUVEC and 371 5 91 nm
in both cases. (n ¼ 50) for the SC cells. The average value of the SC cells
cortex thickness was significantly higher than that of the
HUVECs (p < 0.03).
Imaging studies Imaging studies (Fig. 4) using SIM showed that use of
HUVEC and SC cells were grown on glass slides following the same pro- Latrunculin-A entirely eliminated the cortex of both
cedures described above. They were then fixed in a solution of 10 mL para- HUVEC and SC cells. These studies also showed that La-
formaldehyde 10% (Electron Microscopy Sciences, Harfield, PA) with trunculin-A largely removed stress fibers and actin filaments
15 mL of Dulbecco’s phosphate-buffered saline (Mediatech, Manassas,
VA). After 1 h, fixative solution was replaced by buffer and the cells re-
from the internal cytoskeleton of SC cells. The effect on
mained in buffer until use. Cells were stained with Alexa Fluor 488 phalloi- HUVEC was more variable, with filaments still apparent
din (Molecular Probes, Eugene, OR) for 20 min to stain for F-actin, and that may be remnants of stress fibers, albeit less prominent
then washed and mounted using mount media with DAPI. The mounted and much less organized than before Latrunculin-A treat-
slides were imaged with a LSM-700 confocal microscope (Carl Zeiss, ment. A video (Movie S1) that dramatically shows the
Thornwood, NY). Z-stacks (each image at 0.17mm optical slice) were taken
for randomly picked cells (N ¼ 5 for each group) with a 63 oil objective at
removal of the cell cortex by Latrunculin-A in an SC cell
optimal resolution (2048 2048), zoom 0.7. The final stack was examined is found in the Supporting Material.
and processed for cross section by using a cut function in the ZeN2010 soft-
ware (Carl Zeiss).
For measurements of cortex thickness in live cells, HUVEC and SC cells AFM measurements
were transduced with an adenovirus delivering an actin filament marker,
rAV-LifeAct-TagGFP2 (IBIDI, Verona, WI) (35). After 48 h of transduc-
Cell staining was shown to have no effect on the AFM mea-
tion, cells were washed with Dulbecco’s phosphate-buffered saline and surements of cell mechanical properties. Using the sharp tip,
imaged with a structured illumination microscope (SIM) along the Z-stacks the modulus in stained cells was 2.54 5 1.02 (n ¼ 21)
(thickness of 0.15 mm/slice) with excitation at 488 nm (Nikon, Melville,
NY). A CFI Apo TIRF 100-oil-immersion lens (NA ¼ 1.49) was used
(Nikon). The imaging was done for 10 HUVECs and 10 SC cells. For
each cell, five cortex thickness measurements were made on the lateral
aspect of the cell, well away from the top and bottom of the cell and well
away from the front and back of the cell. Thickness measurements were
made by taking an intensity profile perpendicular to the cortex at each loca-
tion and then defining the thickness based on full width at half-maximum;
we note that measurements based on counting illuminated pixels across the
thickness of the cortex gave good agreement with this less subjective
method of measurement.
FIGURE 3 Confocal profile (0.17 mm per slice) of HUVEC and SC cell
stained for F-actin (green, Alexa Fluor 488 Phalloidin) showing prominent
Statistical methods cell cortex; images also show the cell nucleus (blue, DAPI). High-resolution
images acquired using SIM (0.15 mm per slice) are shown of the cortex of
The statistical analysis was done using the software SPSS (Ver. 12.0, IBM, HUVEC and SC cells labeled with an actin marker (LifeAct) that were used
Somers, NY). Because the data sets were not normally distributed as deter- to measure the lateral cortex thickness. Fig. S2 (in the Supporting Material)
mined using a Q-Q plot (36), a logarithmic transformation of the data was shows a schematic of the locations on the cell where measurements of cor-
performed before determining data means and applying Student’s t-tests. tex thickness were typically made.
Biophysical Journal 105(2) 300–309304 Vargas-Pinto et al.
Significant differences in modulus were found among
those measured with the sharp tip, the 4.5mm spherical tip,
and the 10mm spherical tip in both HUVEC and SC cells
(Fig. 5 A). The sharp tips gave the highest measurements
with a modulus of 3.23 5 0.54 kPa (n ¼ 49) in the HUVEC
and 6.67 5 1.07 (n ¼ 104) in the SC cells. These values
were much higher (p < 107) than measurements using
the 4.5mm tip in HUVEC (1.00 5 0.24, n ¼ 50) and in
SC cells (1.12 5 0.12, n ¼ 104). The values measured
with the 4.5mm tip were in turn greater (p < 103) than those
measured with the 10mm tip in HUVEC (0.39 5 0.07, n ¼
28) and in SC cells (0.84 5 0.06, n ¼ 153). The average
values for all spherical tips were 0.71 5 0.16 (n ¼ 78) in
HUVEC and 0.94 5 0.06 (n ¼ 257) in SC cells. SC cells
were stiffer than HUVEC as measured with the sharp tip
(p < 105) and 10mm tips (p < 106), but not significantly
different for the 4.5mm tips (p > 0.4).
To ensure that the underside of the cantilever of the AFM
tip was not affecting the measurements (11), we used a
much longer sharp AFM tip (Bruker) to measure cell
modulus in one SC cell strain (SC67) and compared those
measurements to those made using the shorter Olympus
FIGURE 4 SIM images (0.15 mm per slice) of HUVEC and SC cell tip in the same cell strain. The modulus calculated depends
before and after treatment with Latrunculin-A (1 mM) for 30 min. Cell cor- on which angle of the multiangled tip is used in Eq. 3 and
tex (Short thick arrows) seen on cells before Latrunculin-A treatment but thus, the minimum and maximum values were used to set
not after. Stress fibers (Long thin arrows) in cells. All images at same a range. E for the Bruker tip was comparable but somewhat
brightness and contrast settings.
higher than modulus measured with the shorter Olympus tip.
For the Bruker tip, E was found to be 11.0 5 7.8 kPa (n ¼
whereas in unstained cells was 2.42 5 0.43 (n ¼ 18); the 11) as determined using a tip angle of 15 and 6.62 5
difference was not statistically significant (p ¼ 0.83) Using 4.62 kPa for an angle of 25 as compared to a mean value
the 4.5mm tip, the modulus in stained cells was 1.40 5 0.33 of 5.15 5 2.06 kPa (n ¼ 18) measured with the Olympus
(n ¼ 33) whereas in unstained cells it was 1.60 5 0.40 (n ¼ tip. The difference between the Bruker (using an angle of
27) (p ¼ 0.55). 15 ) and the Olympus was not statistically significant
In some cell stains, HUVEC and SC cells were probed in (p ¼ 0.11) but suggestive that the modulus measured by
their nuclear and nonnuclear regions using the three the Bruker tip was perhaps a little higher due to the smaller
different tips. The results are shown in Table 1. Measure- radius of curvature of its tip.
ments of modulus in the nuclear and nonnuclear regions Because the moduli measured with sharp tips were much
were not statistically significantly different from one higher than those measured with the spherical tips, we
another (p > 0.2), except for the 10mm tip results in the examined to see if there was evidence that the cell stiffness
SC cells (p < 0.01). However, even for the 10mm results, increased with increased indentation depth. Results showed
the magnitude of the difference between nuclear and nonnu- either a relatively constant modulus (e.g., Fig. 2 E) or
clear regions was relatively small (Effect of Cell Cortex on AFM Measurements 305
A sharp tip from 4.46 5 0.65 kPa (n ¼ 57) in control cell to
1.02 5 0.15 kPa (n ¼ 25) (p < 1014); for the spherical
tip, Latrunculin-A decreased E from 1.40 5 0.33 kPa
(n ¼ 33) to 0.78 5 0.26 kPa (n ¼ 19) (p < 0.03). For SC
cells (SC67), Latrunculin-A decreased E as measured with
a sharp tip from 5.78 5 2.40 kPa (n ¼ 13) in control cells
to 0.99 5 0.12 kPa (n ¼ 13) (p < 5 105); for the spher-
ical tip, Latrunculin-A decreased E from 1.18 5 0.31 kPa
(n ¼ 11) to 0.24 5 0.03 kPa (n ¼ 17) (p < 6 106).
Perhaps most importantly, Latrunculin-A decreased the ra-
tio between the modulus measured with a sharp tip and
that measured with a spherical tip. In HUVEC, this ratio
B was decreased from 3.18 before Latrunculin-A to 1.31 after
Latrunculin-A; in SC cells, this ratio also decreased but less
so, dropping from 4.90 to 4.22.
The average thickness of HUVEC and SC cells, as
measured with AFM, was ~5 mm at the nucleus and 3 mm
in the nonnuclear regions.
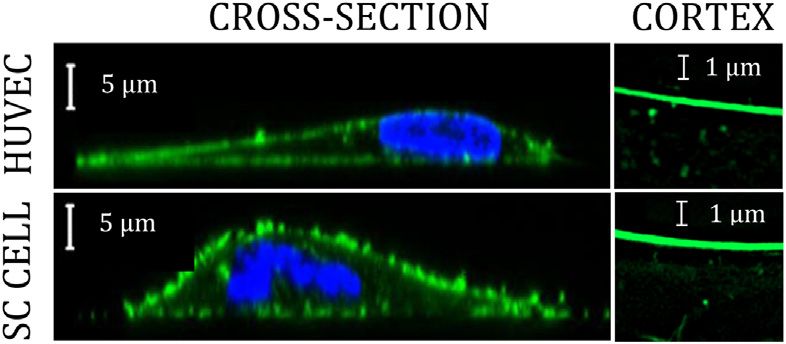
Finite element modeling results
Very different strains distributions were seen around the
FIGURE 5 (A) Young’s modulus (E) of HUVEC and SC cells (SC) as sharp tip as compared to the spherical tips, with much higher
measured with AFM using sharp and spherical tips. (B) Effects of Latrun- strains generated by the former. With a 400 nm cortex, the
culin-A (1 mM) on cell modulus. strain distribution for the sharp tip was localized within
the cortex, in the vicinity of the tip, whereas for the spherical
whether our conclusions for very shallow indentations tip, the strain was spread throughout the cortex and internal
would hold for deeper indentation. A comparison of Fig. 2 cytoskeleton (Fig. 6) and the strain levels were much lower.
E to Fig. 2 F shows very similar behavior for indentations This was also true for the 200 nm cortex, but somewhat high
up to 400 nm with an Olympus sharp tip and that of a Bruker strain levels were seen in internal cytoskeleton (data not
tip with indentations up to 900 nm. shown) for the sharp tip. Lowering Poisson’s ratio from
Addition of Latrunculin-A to HUVECs and SC cells 0.5 to 0.3 had a significant effect on the strain distribution,
decreased cell modulus as measured with the sharp tip and decreasing the maximum strain by as much as 40% (data
that measured using a 4.5mm spherical tip (Fig. 5 B). In not shown). Strain increased roughly linearly with
HUVEC, Latrunculin-A decreased E as measured with a increasing indentation for both the spherical tip and the
FIGURE 6 Schematic of the finite element
model for sharp tip (A) or spherical tip (B). Strain
distribution for the case when Ecortex/Ecytoskeleton ¼
20, cortex thickness ¼ 400 nm, and n ¼ 0.49. FEM
results shown are the maximum logarithmic strain
(LE) distribution in the cell after an 80 nm inden-
tation using (C) sharp and (D) 4.5mm spherical
tips. (E and F) Strain distribution in cortex for
the sharp and 4.5mm spherical tips, respectively.
(Open scale bars) 400 nm. Note that the strain
scale is different in panels C and D as compared
to panels E and F.
Biophysical Journal 105(2) 300–309306 Vargas-Pinto et al.
sharp tip (not shown); in the latter case, this was due to the tips. Variations in cortex thickness had a much stronger
rounded end of the sharp tip, as a truly sharp tip will give a effect, particularly for high values of Ecortex/Ecytoskeleton.
different relationship for strain versus indentation (37). An increase of cortex thickness from 200 nm to 400 nm
To examine the effect of cortex stiffness on the AFM led to as much as a 60% increase in Eapparent for the sharp
measurements, the stiffness of the cortex (Ecortex) was varied tip and more than a doubling for the spherical 4.5mm tip.
from 1 to 100 times the stiffness of the underlying internal
cytoskeleton (Ecytoskeleton), while keeping all other parame-
DISCUSSION
ters constant. When Ecortex ¼ Ecytoskeleton, the apparent
Young’s modulus (Eapparent) was equal to that of the cortex Our measurements of aggregate modulus in HUVEC were in
and internal cytoskeleton (as expected), regardless of the the same range as measured in previous studies. With spher-
tip geometry. As the cortex stiffness became stiffer than ical tips, we measured a mean aggregate modulus of 0.71 kPa
the internal cytoskeleton, Eapparent was increased over the that was a little higher than the mean values of 0.35 kPa
stiffness of the internal cytoskeleton. This increase was measured by Chouinard et al. (38) and similar to the value
moderate for spherical tips (open and solid circles in of 0.65–0.85 kPa measured by Stroka and co-workers (39–
Fig. 7, A and B) but dramatic for sharp tips (triangles in 41). With a sharp tip, our values of aggregate modulus of
Fig. 7, A and B); these conclusions held for all cortex thick- 3.2 kPa are in reasonable agreement with mean values of
nesses investigated (200–400 nm). This confirmed that the 2.5–7 kPa measured by other groups (3,4,42,43). For SC
sharp tips were much more affected by a relatively stiff cells, there are few studies for us to compare our results
cell cortex than were the spherical tips. against. Our mean aggregate modulus of 0.94 kPa as
Because Poisson’s ratio is not known for these cells, we measured using spherical tips is in the same range as that re-
examined its effects on Eapparent by allowing it to vary be- ported by Zeng et al. (19) (1–3 kPa) measured using mag-
tween 0.3 and 0.49 (Fig. 7, C and D). The effect of Poisson’s netic pulling cytometry in central nonnuclear regions, but
ratio was found to be modest for both sharp and spherical lower than their values in the nuclear region (4–8 kPa: we
discuss this discrepancy later in this section). Our values
were in the same range as reported by Zhou et al. (20)
A B (0.5–1 kPa) measured using optical magnetic twisting cy-
tometry. There are no comparable values to compare to for
aggregate modulus of SC cells as measured with sharp tips.
It has been reported in previous studies (11–13) that AFM
measurements using sharp pyramidal tips yield higher
values of Young’s modulus (E) than those using spherical
probes. Our studies using both HUVEC and SC cells yielded
similar results. We examined what might be the biophysical
causes of the elevated modulus values that result from mea-
surements using a sharp AFM tip.
C D Harris and Charras (11) showed that, for indentations that
are greater than a critical value defined by the geometry of
the sharp tip, it is possible for the cantilever to also be in
contact with the cell. This would lead to an underestimation
of the contact area of sharp tips and could explain why
higher values of E are measured with pyramidal tips as
compared to spherical tips. However, the range of indenta-
tions used in this study is well below that threshold. Further-
more, when we used a longer sharp tip (Bruker) to make
these measurements (ruling out any possibility that the un-
derside of the cantilever was affecting the measurements),
equally high values were obtained.
Because the radius of sharp tips is much smaller than that
FIGURE 7 FEM results (n ¼ 0.49) for Eapparent/Ecytoskeleton as a function of spherical tips, it has been suggested that sharp tips may
of cortex stiffness (Ecortex/Ecytoskeleton) calculated using a sharp tip cause strain hardening of the cell because of the high
(triangles), a 4.5mm spherical tip (solid circles), and a 10mm spherical tip stresses and resulting strains generated (12). The strain hard-
(open circles) for a cortex thickness of 200 nm (A) and 400 nm (B). Effect
ening effect would cause E to increase with indentation (45)
of Poisson’s ratio (n) shown for sharp tips (C) and 4.5mm spherical tip (D)
with n ¼ 0.49 (solid lines) and n ¼ 0.3 (dashed lines); (thin/blue curves) and perhaps explain the higher values measured with sharp
cortex thickness of 200 nm; and (thick/red curves) cortex thickness of tips. However, the modulus we measured using sharp tips
400 nm. did not increase with indentation depth over the range of
Biophysical Journal 105(2) 300–309Effect of Cell Cortex on AFM Measurements 307
indentations studied (e.g., Fig. 2 E). This also rules out the stronger effect of Latrunculin-A seen on the internal cyto-
possibility of a substrate effect on measurements made with skeleton in the SC cells as compared to the HUVEC
the sharp tip, because it would also cause the modulus to in- (Fig. 4). It should be noted that the Latrunculin-A concen-
crease with increasing deformation (4,46). tration used in these studies (1 mM) was likely less than
The cell cortex is an actin-dense region of the cell lying the concentration necessary to completely depolymerize
immediately beneath its plasma membrane. It is a porous the actin in these cells. When we used higher concentra-
network of cross-linked filaments, motors, and accessory tions, we found that the cells lose their attachment to the
proteins with a thickness between perhaps 100 and substrate, making AFM measurements difficult.
400 nm in quiescent mammalian cells on a substrate (47). One puzzling result was our finding that the modulus of
Because the stiffness of actin networks are strong functions the cell, measured either with a sharp tip or a rounded tip,
of their actin concentration (48,49), this dense actin layer was not statistically significantly different in the region
near the surface of the cell would be expected to be stiffer over the cell nucleus from the rest of the cell. However,
than the underlying cytoskeleton, and thus potentially might the nuclei of endothelial cells are thought to be significantly
differentially affect AFM measurements, especially those stiffer than the remainder of the cell (50). Data from other
using small indentations. groups using AFM to measure endothelial cell stiffness
Confocal imaging showed that both HUVEC and SC cells comparing nuclear regions to other regions of the cell are
have prominent cell cortices (Fig. 3) with thicknesses of conflicting. Three publications (3,51,52) indicate that the
~300 and 375 nm, respectively. As this region would be ex- nuclear region of endothelial cells is less stiff than the
pected to be stiffer than the underlying internal cytoskeleton more peripheral regions of the cell, four other publications
due to its high actin density, it may have a significant effect suggest the opposite (4,42,53,54), and one study found no
on the modulus of these cells as measured by AFM. Finite difference between nuclear and nonnuclear regions (38). It
element modeling indicated that sharp tips generate very may be that shallow AFM indentations might be variably
high strains, and these strains are largely limited to the re- affected by the underlying nucleus depending on the depth
gion of the cell cortex. In contrast, the strains generated of the nucleus in the cell.
by spherical probes are not only much lower, but also spread
throughout the cell cortex and internal cytoskeleton. Based
Limitations
on the strain distribution, we expect sharp tips to be more
sensitive than spherical tips to the stiffness of the cortex, The FEM described here treats the cortex and underlying
particularly for the small indentations used in this study. cytoskeleton as elastic solids. This is a considerable simpli-
To determine if the higher values of Young’s modulus fication because the internal cytoskeleton and cortex are
measured with sharp tips might be, at least in part, due to comprised of intricate and dynamic viscoelastic networks
the effect of the cell cortex, we used FEM studies to deter- of filaments, motors, and associated proteins. Nonetheless,
mine how the apparent modulus (Eapparent) varies as a func- much valuable information has been gleaned from the use
tion of cortex stiffness for each tip geometry. As the stiffness of such models to begin to roughly characterize the mechan-
of the cortex was increased, the Eapparent obtained using the ical behavior of such networks (16,18,55–58). Poroelasticity
sharp tip increased significantly, showing that measure- (59,60) and viscoelasticity (47) were also not included in
ments made with sharp tips are strongly affected by the our model. Future studies would benefit from including
cell cortex. Eapparent obtained using the spherical tips also these effects.
increased but to a much smaller extent (Fig. 7, A and B). Our model of the cortex does not separately consider that
Our results suggest that careful consideration should be the restoring force includes both an elastic component and
given when interpreting AFM data to account for the effect an active tension component. These are combined in our
of the cell cortex. model into an effective elastic response (47) for ease of
Further support for our conclusion that the cell cortex is computation, but this limits our ability to separately sort
responsible for the higher cell stiffness that we measured out these influences. A model that included both of these
using a sharp tip is provided by our studies using Latruncu- components, along with studies that examine the effects of
lin-A, which would be expected to significantly affect the drugs interrupting one or both these, would allow a more
actin-rich cortex. In both HUVEC and SC cells, the cell detailed characterization of the stiffness characteristics of
stiffness as measured with a sharp tip was greatly reduced the cortex (61).We note that a model that included only
following Latrunculin-A treatment consistent with the role a tensile component to describe the cell cortex would not
we have ascribed to the cell cortex (Fig. 5 B). Latruncu- be consistent with our experimental measurements, because
lin-A treatment also reduced the ratio of the value of cell such a model would predict that the AFM force-versus-
stiffness as measured with a sharp tip, as compared to a deformation curve (e.g., Fig. 2, A and B) would be linear
rounded tip. This ratio was greatly reduced by Latruncu- (62,63).
lin-A in HUVEC, whereas a much smaller reduction was FEM results presented here were limited to an indentation
seen in SC cells. This latter effect may be related to the depth of 80 nm, whereas the experimental results were
Biophysical Journal 105(2) 300–309308 Vargas-Pinto et al.
extended for several hundred nm. This numerical limitation 2. Kasas, S., X. Wang, ., S. Catsicas. 2005. Superficial and deep changes
of cellular mechanical properties following cytoskeleton disassembly.
was due to the very high strains generated by the sharp tips. Cell Motil. Cytoskeleton. 62:124–132.
Although it would have been preferable to use the model
3. Kataoka, N., K. Iwaki, ., F. Kajiya. 2002. Measurements of endothe-
to examine higher indentations, the relatively constant lial cell-to-cell and cell-to-substrate gaps and micromechanical proper-
modulus with increased indentation seen experimentally ties of endothelial cells during monocyte adhesion. Proc. Natl. Acad.
adds confidence to these results. Sci. USA. 99:15638–15643.
4. Mathur, A. B., A. M. Collinsworth, ., G. A. Truskey. 2001. Endothe-
lial, cardiac muscle and skeletal muscle exhibit different viscous and
elastic properties as determined by atomic force microscopy.
Conclusions J. Biomech. 34:1545–1553.
Based on the AFM results using Latrunculin-A, our imaging 5. Sato, H., N. Kataoka, ., T. Masuda. 2004. Kinetic study on the elastic
studies, and our FEM results, we conclude that the higher change of vascular endothelial cells on collagen matrices by atomic
force microscopy. Colloids Surf. B Biointerfaces. 34:141–146.
modulus obtained in AFM experiments using shallow in-
6. Radmacher, M. 1997. Measuring the elastic properties of biological
dentations when sharp tips are used as compared to when samples with the AFM. IEEE Eng. Med. Biol. Mag. 16:47–57.
larger spherical probes are used can be explained by the
7. Weisenhorn, A. L., M. Khorsandi, ., H.-J. Butt. 1993. Deformation
presence of a cell cortex much stiffer than the underlying in- and height anomaly of soft surfaces studied with an AFM.
ternal cytoskeleton. Sharp tips probe primarily the cortex Nanotechnology. 4:106–113.
whereas larger round tips are influenced by the stiffness of 8. Lin, D. C., E. K. Dimitriadis, and F. Horkay. 2007. Robust strategies for
both the cortex and the underlying cytoskeleton. Alternate automated AFM force curve analysis. I. Non-adhesive indentation of
soft, inhomogeneous materials. J. Biomech. Eng. 129:430–440.
explanation of this result that include strain hardening or
9. Stolz, M., R. Raiteri, ., U. Aebi. 2004. Dynamic elastic modulus of
the effects of a hard substrate underlying the cell seem un- porcine articular cartilage determined at two different levels of tissue
likely as these effects would result in values of E that in- organization by indentation-type atomic force microscopy.
crease with indentation. That behavior is not consistent Biophys. J. 86:3269–3283.
with our results for AFM showing that modulus was rela- 10. Engler, A. J., L. Richert, ., D. E. Discher. 2004. Surface probe mea-
tively independent of indentation depth. Our use of the surements of the elasticity of sectioned tissue, thin gels and polyelec-
trolyte multilayer films: correlations between substrate stiffness and
longer Bruker tip allowed us to ensure that the underside cell adhesion. Surf. Sci. 570:142–154.
of the cantilever was not affecting our measurements with 11. Harris, A. R., and G. T. Charras. 2011. Experimental validation of
the sharp tip. Our results suggest that when making AFM atomic force microscopy-based cell elasticity measurements. Nano-
measurements of cell modulus, the effects of the cortex on technology. 22:345102.
this measurement should be considered. 12. Carl, P., and H. Schillers. 2008. Elasticity measurement of living cells
with an atomic force microscope: data acquisition and processing.
Pflugers Arch. 457:551–559.
SUPPORTING MATERIAL 13. Rico, F., P. Roca-Cusachs, ., D. Navajas. 2005. Probing mechanical
properties of living cells by atomic force microscopy with blunted py-
Supplemental movie, figure, and legends are available at http://www. ramidal cantilever tips. Phys. Rev. E. 72:021914.
biophysj.org/biophysj/supplemental/S0006-3495(13)00617-6. 14. Darling, E. M., M. Topel, ., F. Guilak. 2008. Viscoelastic properties of
human mesenchymally-derived stem cells and primary osteoblasts,
We thank Dr. W. Daniel Stamer (Duke University) for providing the SC chondrocytes, and adipocytes. J. Biomech. 41:454–464.
cells and Ruiyi Ren (Boston University) for technical assistance in confocal 15. Dimitriadis, E. K., F. Horkay, ., R. S. Chadwick. 2002. Determination
microscopy. AFM experiments were performed in the NIFTI facility of the of elastic moduli of thin layers of soft material using the atomic force
NUANCE Center at Northwestern University. microscope. Biophys. J. 82:2798–2810.
R.V.-P. and M.J. acknowledge support from the National Glaucoma 16. Costa, K. D., and F. C. Yin. 1999. Analysis of indentation: implications
Research program of the Bright Focus Foundation and from the National for measuring mechanical properties with atomic force microscopy.
Institutes of Health grant No. R01 EY 01969. H.G. acknowledges support J. Biomech. Eng. 121:462–471.
from National Institutes of Health grant No. R01 EY 01969 and The Mas- 17. Akhremitchev, B. B., and G. C. Walker. 1999. Finite sample thickness
sachusetts Lions Eye Research Fund, Inc., to Boston University. R.V.-P. ac- effects on elasticity determination using atomic force microscopy.
knowledges support from National Institutes of Health grant No. T32 Langmuir. 15:5630–5634.
EY007128. The NUANCE Center is supported by the National Science 18. Ng, L., H.-H. Hung, ., A. Grodzinsky. 2007. Nanomechanical proper-
Foundation-Nanoscale Science and Engineering Center, the National Sci- ties of individual chondrocytes and their developing growth factor-
ence Foundation-Materials Research Science and Engineering Centers, stimulated pericellular matrix. J. Biomech. 40:1011–1023.
the Keck Foundation, the State of Illinois, and Northwestern University. Im-
19. Zeng, D., T. Juzkiw, ., M. Johnson. 2010. Young’s modulus of elas-
aging studies were done at the Nikon Imaging Center, Feinberg School of ticity of Schlemm’s canal endothelial cells. Biomech. Model. Mechano-
Medicine, Northwestern University. biol. 9:19–33.
20. Zhou, E. H., R. Krishnan, ., M. Johnson. 2012. Mechanical respon-
siveness of the endothelial cell of Schlemm’s canal: scope, variability
REFERENCES and its potential role in controlling aqueous humor outflow. J. R. Soc.
Interface. 9:1144–1155.
1. Costa, K. 2006. Imaging and probing cell mechanical properties with 21. Crick, S. L., and F. C. P. Yin. 2007. Assessing micromechanical prop-
the atomic force microscope. In Cell Imaging Techniques. D. Taatjes erties of cells with atomic force microscopy: importance of the contact
and B. Mossman, editors. Humana Press, Totowa, NJ. 331–361. point. Biomech. Model. Mechanobiol. 6:199–210.
Biophysical Journal 105(2) 300–309Effect of Cell Cortex on AFM Measurements 309
22. Stamer, W. D., B. C. Roberts, ., D. L. Epstein. 1998. Isolation, cul- 43. Oberleithner, H., C. Riethmüller, ., H. Schillers. 2006. Differential
ture, and characterization of endothelial cells from Schlemm’s canal. action of steroid hormones on human endothelium. J. Cell Sci.
Invest. Ophthalmol. Vis. Sci. 39:1804–1812. 119:1926–1932.
23. Hutter, J. L., and J. Bechhoefer. 1993. Calibration of atomic-force 44. Reference deleted in proof.
microscope tips. Rev. Sci. Instrum. 64:1868–1873. 45. Leporatti, S., A. Gerth, ., E. Donath. 2006. Elasticity and adhesion of
24. Bilodeau, G. G. 1992. Regular pyramid punch problem. J. Appl. Mech. resting and lipopolysaccharide-stimulated macrophages. FEBS Lett.
59:519–523. 580:450–454.
25. Harding, J. W., and I. N. Sneddon. 1945. The elastic stresses produced 46. Domke, J., and M. Radmacher. 1998. Measuring the elastic properties
by the indentation of the plane surface of a semi-infinite elastic solid by of thin polymer films with the atomic force microscope. Langmuir.
a rigid punch. Math. Proc. Camb. Philos. Soc. 41:16–26. 14:3320–3325.
26. Sirghi, L., J. Ponti, ., F. Rossi. 2008. Probing elasticity and adhesion 47. Salbreux, G., G. Charras, and E. Paluch. 2012. Actin cortex mechanics
of live cells by atomic force microscopy indentation. Eur. Biophys. J. and cellular morphogenesis. Trends Cell Biol. 22:536–545.
37:935–945. 48. Janmey, P. A., S. Hvidt, ., T. P. Stossel. 1994. The mechanical prop-
erties of actin gels. Elastic modulus and filament motions. J. Biol.
27. Costa, K. D. 2003–2004. Single-cell elastography: probing for disease
Chem. 269:32503–32513.
with the atomic force microscope. Dis. Markers. 19:139–154.
49. Gardel, M. L., J. H. Shin, ., D. A. Weitz. 2004. Elastic behavior of
28. Freeman, P. M., R. N. Natarajan, ., T. P. Andriacchi. 1994. Chondro- cross-linked and bundled actin networks. Science. 304:1301–1305.
cyte cells respond mechanically to compressive loads. J. Orthop. Res.
12:311–320. 50. Caille, N., O. Thoumine, ., J. J. Meister. 2002. Contribution of the nu-
cleus to the mechanical properties of endothelial cells. J. Biomech.
29. Trickey, W. R., F. P. T. Baaijens, ., F. Guilak. 2006. Determination of 35:177–187.
the Poisson’s ratio of the cell: recovery properties of chondrocytes after
release from complete micropipette aspiration. J. Biomech. 39:78–87. 51. Sato, M., K. Nagayama, ., K. Hane. 2000. Local mechanical proper-
ties measured by atomic force microscopy for cultured bovine endothe-
30. Briscoe, B. J., K. S. Sebastian, and M. J. Adams. 1994. The effect of lial cells exposed to shear stress. J. Biomech. 33:127–135.
indenter geometry on the elastic response to indentation. J. Phys. D
52. Ohashi, T., Y. Ishii, ., M. Sato. 2002. Experimental and numerical an-
Appl. Phys. 27:1156–1162.
alyses of local mechanical properties measured by atomic force micro-
31. Reference deleted in proof. scopy for sheared endothelial cells. Biomed. Mater. Eng. 12:319–327.
32. Yamada, H., N. Mouri, and S. Nobuhara. 2010. Three-dimensional 53. Miyazaki, H., and K. Hayashi. 1999. Atomic force microscopic mea-
morphometry of single endothelial cells with substrate stretching and surement of the mechanical properties of intact endothelial cells in
image-based finite element modeling. EURASIP J. Adv. Signal Process. fresh arteries. Med. Biol. Eng. Comput. 37:530–536.
2010:1–10. 54. Mathur, A. B., W. M. Reichert, and G. A. Truskey. 2007. Flow and high
33. Dassault Systèmes. 2007. ABAQUS Theory and Analysis User’s affinity binding affect the elastic modulus of the nucleus, cell body and
Manual, Ver. 6.7. Simulia Corp., Providence, RI. the stress fibers of endothelial cells. Ann. Biomed. Eng. 35:1120–1130.
34. Dailey, H. L., L. M. Ricles, ., S. N. Ghadiali. 2009. Image-based finite 55. Charras, G. T., and M. A. Horton. 2002. Determination of cellular
element modeling of alveolar epithelial cell injury during airway re- strains by combined atomic force microscopy and finite element
opening. J. Appl. Physiol. 106:221–232. modeling. Biophys. J. 83:858–879.
35. Riedl, J., A. H. Crevenna, ., R. Wedlich-Soldner. 2008. LifeAct: a 56. Charras, G. T., P. P. Lehenkari, and M. A. Horton. 2001. Atomic force
versatile marker to visualize F-actin. Nat. Methods. 5:605–607. microscopy can be used to mechanically stimulate osteoblasts and eval-
uate cellular strain distributions. Ultramicroscopy. 86:85–95.
36. Moore, D., G. McCabe, and B. Craig. 2009. Introduction to the Practice
of Statistics. HW Freeman, New York. 57. Mijailovich, S. M., M. Kojic, ., J. J. Fredberg. 2002. A finite element
model of cell deformation during magnetic bead twisting. J. Appl.
37. Johnson, K. L. 1970. The correlation of indentation experiments. Physiol. 93:1429–1436.
J. Mech. Phys. Solids. 18:115–126.
58. Kang, I., D. Panneerselvam, ., C. M. Doerschuk. 2008. Changes in the
38. Chouinard, J. A., G. Grenier, ., P. Vermette. 2008. Oxidized-LDL hyperelastic properties of endothelial cells induced by tumor necrosis
induce morphological changes and increase stiffness of endothelial factor-a. Biophys. J. 94:3273–3285.
cells. Exp. Cell Res. 314:3007–3016. 59. Charras, G. T., J. C. Yarrow, ., T. J. Mitchison. 2005. Non-equilibra-
39. Stroka, K. M., and H. Aranda-Espinoza. 2011. Effects of morphology tion of hydrostatic pressure in blebbing cells. Nature. 435:365–369.
vs. cell-cell interactions on endothelial cell stiffness. Cell Mol. Bioeng. 60. Mitchison, T. J., G. T. Charras, and L. Mahadevan. 2008. Implications
4:9–27. of a poroelastic cytoplasm for the dynamics of animal cell shape.
40. Stroka, K. M., and H. Aranda-Espinoza. 2011. Endothelial cell sub- Semin. Cell Dev. Biol. 19:215–223.
strate stiffness influences neutrophil transmigration via myosin light 61. Tinevez, J.-Y., U. Schulze, ., E. Paluch. 2009. Role of cortical tension
chain kinase-dependent cell contraction. Blood. 118:1632–1640. in bleb growth. Proc. Natl. Acad. Sci. USA. 106:18581–18586.
41. Stroka, K. M., J. A. Vaitkus, and H. Aranda-Espinoza. 2012. Endothe- 62. Rosenbluth, M. J., W. A. Lam, and D. A. Fletcher. 2006. Force micro-
lial cells undergo morphological, biomechanical, and dynamic changes scopy of nonadherent cells: a comparison of leukemia cell deformabil-
in response to tumor necrosis factor-a. Eur. Biophys. J. 41:939–947. ity. Biophys. J. 90:2994–3003.
42. Mathur, A. B., G. A. Truskey, and W. M. Reichert. 2000. Atomic force 63. Krieg, M., Y. Arboleda-Estudillo, ., C. P. Heisenberg. 2008. Tensile
and total internal reflection fluorescence microscopy for the study of forces govern germ-layer organization in zebrafish. Nat. Cell Biol.
force transmission in endothelial cells. Biophys. J. 78:1725–1735. 10:429–436.
Biophysical Journal 105(2) 300–309You can also read