Proposal and validation of a method to classify genetic subtypes of diffuse large B cell lymphoma - Nature
←
→
Page content transcription
If your browser does not render page correctly, please read the page content below
www.nature.com/scientificreports
OPEN Proposal and validation
of a method to classify genetic
subtypes of diffuse large B cell
lymphoma
Lucía Pedrosa1,2,20, Ismael Fernández‑Miranda1,2,20, David Pérez‑Callejo3,4,20, Cristina Quero5,
Marta Rodríguez6,7, Paloma Martín‑Acosta7,8, Sagrario Gómez1, Julia González‑Rincón1,7,
Adrián Santos8, Carlos Tarin9,10, Juan F. García7,11, Francisco R. García‑Arroyo12,
Antonio Rueda13, Francisca I. Camacho14, Mónica García‑Cosío15, Ana Heredero1,
Marta Llanos16, Manuela Mollejo7,17, Miguel Piris‑Villaespesa18, José Gómez‑Codina19,
Natalia Yanguas‑Casás1, Antonio Sánchez3, Miguel A. Piris6,7, Mariano Provencio3 &
Margarita Sánchez‑Beato1,7*
Diffuse large B-cell lymphoma (DLBCL) is a heterogeneous disease whose prognosis is associated
with clinical features, cell-of-origin and genetic aberrations. Recent integrative, multi-omic analyses
had led to identifying overlapping genetic DLBCL subtypes. We used targeted massive sequencing
to analyze 84 diagnostic samples from a multicenter cohort of patients with DLBCL treated with
rituximab-containing therapies and a median follow-up of 6 years. The most frequently mutated genes
were IGLL5 (43%), KMT2D (33.3%), CREBBP (28.6%), PIM1 (26.2%), and CARD11 (22.6%). Mutations
in CD79B were associated with a higher risk of relapse after treatment, whereas patients with
mutations in CD79B, ETS1, and CD58 had a significantly shorter survival. Based on the new genetic
DLBCL classifications, we tested and validated a simplified method to classify samples in five genetic
subtypes analyzing the mutational status of 26 genes and BCL2 and BCL6 translocations. We propose
a two-step genetic DLBCL classifier (2-S), integrating the most significant features from previous
algorithms, to classify the samples as N12-S, EZB2-S, MCD2-S, BN22-S, and ST22-S groups. We determined
its sensitivity and specificity, compared with the other established algorithms, and evaluated its
clinical impact. The results showed that ST22-S is the group with the best clinical outcome and N12-S,
the more aggressive one. EZB2-S identified a subgroup with a worse prognosis among GCB-DLBLC
cases.
1
Lymphoma Research Group, Medical Oncology Department, Instituto de Investigación Sanitaria Puerta de
Hierro-Segovia de Arana, Majadahonda, Madrid, Spain. 2PhD Program in Molecular Biosciences, Doctoral School,
Universidad Autónoma de Madrid, Madrid, Spain. 3Medical Oncology Department, Hospital Universitario Puerta
de Hierro-Majadahonda, Madrid, Spain. 4PhD Program in Medicine and Surgery, Doctoral School, Universidad
Autónoma de Madrid, Madrid, Spain. 5Medical Oncology Department, Hospital Universitario Virgen de La
Victoria, Malaga, Spain. 6Pathology Department, Hospital Fundación Jiménez Díaz, Madrid, Spain. 7Centro de
Investigación Biomédica en Red de Cáncer (CIBERONC), Madrid, Spain. 8Molecular Pathology Laboratory,
Instituto de Investigación Sanitaria Puerta de Hierro-Segovia de Arana, Madrid, Spain. 9Bioinformatics Unit,
Instituto de Investigación Sanitaria Puerta de Hierro-Segovia de Arana, Madrid, Spain. 10Basic Medical Sciences,
Faculty of Medicine, Universidad CEU San Pablo, Madrid, Spain. 11Pathology Department, MD Anderson Cancer
Center, Madrid, Spain. 12Medical Oncology Department, Complejo Hospitalario de Pontevedra, Pontevedra,
Spain. 13Medical Oncology Department, Hospitales Universitarios Regional y Virgen de La Victoria, IBIMA,
Malaga, Spain. 14Pathology Department, Hospital Universitario de Getafe, Madrid, Spain. 15Pathology
Department, Hospital Universitario Ramón y Cajal, Madrid, Spain. 16Medical Oncology Department, Hospital
Universitario de Canarias, Tenerife, Spain. 17Pathology Department, Complejo Hospitalario de Toledo, Toledo,
Spain. 18Haematology Department, Hospital Universitario Ramón y Cajal, Madrid, Spain. 19Medical Oncology
Department, Hospital Universitari i Politècnic La Fe, Valencia, Spain. 20These authors contributed equally: Lucía
Pedrosa, Ismael Fernández-Miranda and David Pérez-Callejo *email: msbeato@idiphim.org
Scientific Reports | (2021) 11:1886 | https://doi.org/10.1038/s41598-020-80376-0 1
Vol.:(0123456789)
www.nature.com/scientificreports/
Diffuse large B-cell lymphoma (DLBCL) is the most common subtype of non-Hodgkin lymphoma, with 3.13
and 5.6 new cases diagnosed in E urope1 and the USA2 per 100,000 habitants per year, respectively. DLBCL is an
aggressive and heterogeneous disease with a variable clinical outcome; it can arise de novo or after histological
transformation from other low-grade lymphomas, typically from follicular lymphoma. Most DLBCL patients
can be cured by standard immunochemotherapy with R-CHOP (rituximab, cyclophosphamide, doxorubicin,
vincristine, and prednisone)3. However, a substantial percentage of them (30–40%) are refractory to treatment or
relapse (R/R) after an initial response, and it is not possible to accurately predict which patients will benefit from
rituximab-based therapy4. Currently, the International Prognostic Index (IPI), based on clinical and analytical
characteristics, is the most significant predictive factor, in which higher scores are associated with unfavorable
outcomes5–7.
The most recent revision of the WHO classification of lymphoid neoplasms recognizes the high-grade B-cell
double-/triple-hit lymphoma (DH/TH), with MYC and BCL2 and/or BCL6 rearrangements, as a new provisional
entity associated with an inferior outcome. DLBCLs co-expressing MYC and BCL2 (double-expressor lympho-
mas) also have a worse prognosis than other DLBCL-NOS (not otherwise specified), but their behavior is not as
aggressive as that of DH/TH lymphomas8.
Gene-expression profiling (GEP) allows distinguishes three subtypes based on cell of origin (COO): germinal
center B-cell (GCB)-like, activated B-cell (ABC)-like and unclassified s ubtypes9,10. This classification has been
shown to be of prognostic value, with ABC-DLBCL being associated with poorer outcome9–11, but it does not
fully explain the high DLBCL heterogeneity, or accurately predict the response to standard therapy. The truth
is that all patients are treated identically, independently of their COO subtype. Therefore, we need to identify
the genetic alterations of DLBCL associated with refractoriness and develop alternative treatments or novel
pharmacological strategies to overcome this resistance.
In the last few years, deep-sequencing studies have allowed a better understanding of the DLBCL genomic
landscape and provided further evidence of their molecular heterogeneity. Several recent studies have proposed
new genetic subtypes based on the DLBCL genomic profile. Although they are somewhat different, the newly
defined genetic subtypes share several characteristics. Schmitz and colleagues identified four genetic subgroups,
which they referred to as MCD (characterized by the co-occurrence of MYD88L265P and CD79B mutations),
BN2 (with BCL6 fusions and NOTCH2 mutations), N1 (with NOTCH1 mutations) and EZB (characterized by
EZH2 mutations and BCL2 translocations). MCD and N1 are associated with poorer outcomes than the other
subtypes12. Most recently, the same group developed the LymphGen algorithm, which allows a more precise
genetic classification, adding the A53 (characterized by TP53 mutations and deletions) and ST2 (SGK1 and
TET2 mutated) subtypes, to the previous ones13. Chapuy et al.14 distinguished five subsets of DLBCL, including
two ABC-DLBCL groups, one with low risk and a possible marginal zone origin (C1), and the other a high-risk
group (C5) enriched in cases with mutations in MYD88, CD79B, and PIM1; they also described two subsets of
GCB-DLBCLs with favorable (C4) and poor (C3) outcomes, and an ABC/GCB-independent group (C2) with
biallelic inactivation of TP53, CDKN2A loss, and associated genomic instability. Finally, in an attempt to bring
these genetic classifications together, Lacy et al.15 characterized five molecular subtypes, NOTCH2, MYD88,
BCL2, TET2/SGK1, and SOCS1/SGK1, according to the mutated genes that are most highly enriched in each.
The genetic classifications partially overlap, suggesting the existence of accurate molecular subtypes that might
have predictive and prognostic capability and help to select the most appropriate therapy for each DLBCL patient.
However, for these genetic classifications to be genuinely useful, a feasible, consensus classification based on
selected genetic alterations must be validated to contribute to a sensitive and specific classification that is of
clinical value.
We propose a simplified classification based on the previous ones, validated using data obtained by targeted
deep-sequencing analysis in a set of diagnostic samples from DLBCL patients treated with R-CHOP or similar
regimens, 40% of whom (34/84) did not respond, or relapsed after treatment.
Results
Mutational profile and association with clinical outcome. Patient and tumor characteristics of the
"Puerta de Hierro" (PdH) cohort (n = 84) are shown in Table 1 and Supplementary Table S1. FISH analysis and
COO classification were performed on samples with available material. Two of the 44 samples studied by FISH
(4.5%) were classified as DH. Regarding COO, Lymph2Cx-based assay determined that 53.7% (29/54) of the
cases were GCB, 25.9% ABC (14/54) and 20.4% (11/54) unclassified, while the Hans algorithm classified 50.8%
(33/65) as GCB and 49.2% (32/65) as non-GCB.
We performed targeted massive parallel sequencing in the 84 DLBCL samples, and were able to identify at
least one somatic mutation in all the samples (Suppl. Table S2). All the genes included in the panel (125; see
“Methods” section) were mutated at least once, except KRAS and CD22. A total of 1030 somatic mutations (SNVs
and indels) were detected, considering missense, non-sense, and splicing mutations. The samples harbored a
median of 12.3 mutations (range: 2–45), 13.4 mutations in R/R cases (range: 2–45), and 11.5 mutations in sen-
sitive (S) cases (range: 3–30). The most recurrently mutated genes were IGLL5 (42.9%, 36/84 cases), KMT2D
(33.3%, 28/84), CREBBP (28.6%, 24/84), PIM1 (26.2%, 22/84), CARD11 (22.6%, 19/84), PCLO (20.2%, 17/84),
and KMT2C (19.4%, 13/84) (Fig. 1A; Suppl. Table S3).
We also explored the DLBCL mutational landscape in predefined signaling pathways or lymphomagen-
esis-related gene sets. Genes included in every gene set, based on the previously published B-cell NHL gene
signatures16, are summarized in Supplementary Table S4. Overall, the samples had a higher incidence of muta-
tions in genes involved in chromatin regulation (73.8%, 62/84), NFκB (58.3%, 47/84), apoptosis (54.8%, 46/84),
and BCR pathways (51.2%, 43/84) (Fig. 1A).
Scientific Reports | (2021) 11:1886 | https://doi.org/10.1038/s41598-020-80376-0 2
Vol:.(1234567890)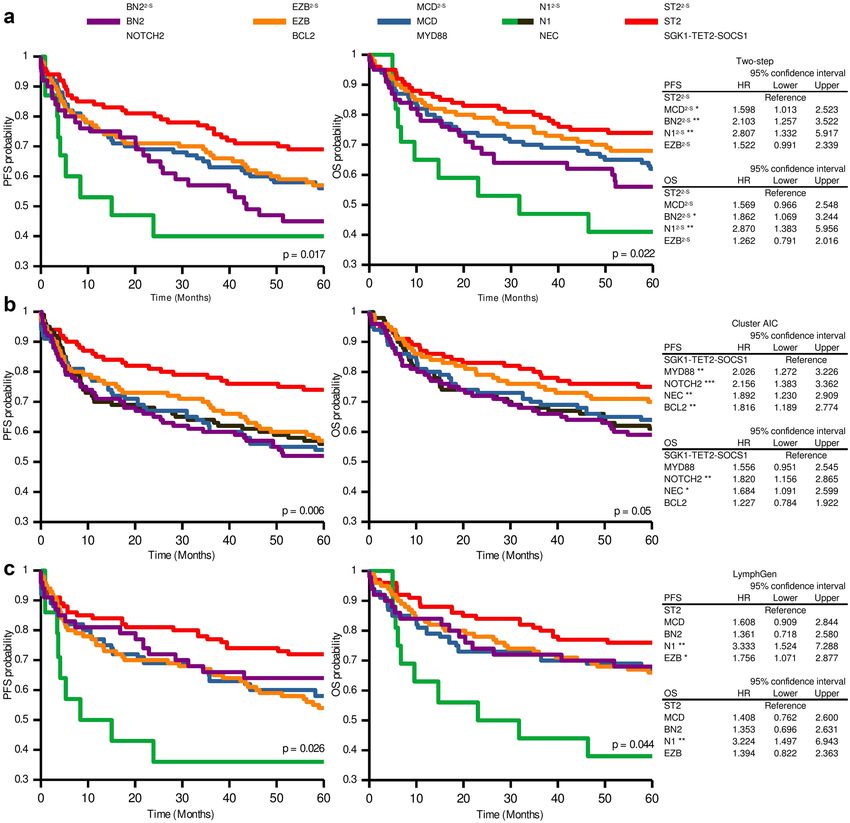
www.nature.com/scientificreports/

                                   Clinical variable        N     Categories           N       Percentage
                                                                  Male                 46      54.8
                                   Sex                      84
                                                                  Female               38      45.2
                                                                  ≥ 60                 47      56.7
                                   Age                      83
                                                                  < 60                 36      43.4
                                                                  0                    28      36.8
                                                                  1                    29      38.2
                                                                  2                    18      23.7
                                   ECOG                     78
                                                                  3                    3       3.9
                                                                  4                    0       0
                                                                  5                    0       0
                                                                  I                    6       7.8
                                                                  II                   23      29.9
                                   Stage                    81
                                                                  III                  31      40.3
                                                                  IV                   31      40.3
                                                                  Low                  28      33.7
                                                                  Low-Intermediate     23      27.7
                                   IPI                      83
                                                                  High-Intermediate    18      21.7
                                                                  High                 14      16.9
                                                                  R-CHOP               76      90.5
                                   Treatment                84
                                                                  R-like               8       9.5
                                                                  Complete response    66      79.5
                                   Response to treatment    83    Partial response     6       7.2
                                                                  No response          11      13.3
                                                                  Refractory/Relapse   34      40.5
                                   Refractory/Relapse       84
                                                                  No relapse           50      59.5
                                                                  Exitus               33      39.3
                                   Status                   84
                                                                  Alive                51      60.7
                                                                  GCB                  29      53.7
                                   COO (Lymph2Cx)           54    ABC                  14      25.9
                                                                  Unclassified         11      20.4
                                                                  GCB                  33      50.8
                                   COO (Hans)               65
                                                                  Non-GCB              32      49.2
                                                                  BLC2                 11/50   22.0
                                                                  BCL6                 18/45   40.0
                                   FISH
                                                                  MYC                  5/49    10.2
                                                                  Double-HIT           2/44    4.5

                                  Table 1.  Summary of clinical data of the Puerta de Hierro (PdH) cohort. International Prognostic Index (IPI),
                                  rituximab, cyclophosphamide, doxorubicin, vincristine, and prednisone (R-CHOP), rituximab-like (R-like),
                                  cell of origin (COO), activated B-cell (ABC), germinal center B-cell (GCB), fluorescence in situ hybridization
                                  (FISH).

                                      We assessed the prognostic value of IPI and the COO classification in our series. The IPI predicted shorter
                                  overall survival (OS) (Intermediate risk: p = 0.009, HR = 5.04; High risk: p = 0.003; HR = 7.9) and progression-free
                                  survival (PFS) (Intermediate risk: p = 0.002, HR = 6.72; High risk: p = 0.004; HR = 7.13) by Cox proportional-
                                  hazards model analysis for the intermediate- and high-risk groups. When we evaluated the prognostic value of
                                  the COO by the Kaplan–Meier survival method, GCB cases showed better clinical outcomes, but the magnitude
                                  of the differences was not great enough to be significant, given the small number of classified samples available
                                  (Fig. S1).
                                      We then explored the clinical relevance of the gene/pathway mutations present in at least four samples.
                                  The analysis showed that CD79B mutations were associated with a higher risk of R/R (Figs. 1B, 2A). Similarly,
                                  patients with mutations in B-cell development and BCR-PI3K pathways were more prone to relapse after therapy.
                                  Although not significantly associated, several other genes and pathways were more frequently mutated in sam-
                                  ples from R/R patients, such as PRDM1 (15% vs. 4%), ETS1 (12% vs. 0%), IKZF3 (15% vs. 2%), BCL10 (18% vs.
                                  4%), NOTCH2 (18% vs. 6%), CD58 (16% vs. 6%), and MAPK-ERK (32% vs. 16%), and Toll pathways (18% vs.
                                  8%) (Fig. 1B, Suppl. Tables S3 and S5). Furthermore, the multivariate analysis, combined with the IPI, showed
                                  that patients with mutations in CD79B had an independent association with shorter PFS (HR = 2.73, p = 0.01).
                                  The analysis also demonstrated that mutations in CD79B, ETS1, and CD58, were associated with shorter OS
                                  (Fig. 2B), as well as mutations in the BCR-PI3K, MAPK-ERK, and NFκB pathways (Fig. 2B). Mutations in CD79B

Scientific Reports |   (2021) 11:1886 |                    https://doi.org/10.1038/s41598-020-80376-0                                               3

                                                                                                                                               Vol.:(0123456789)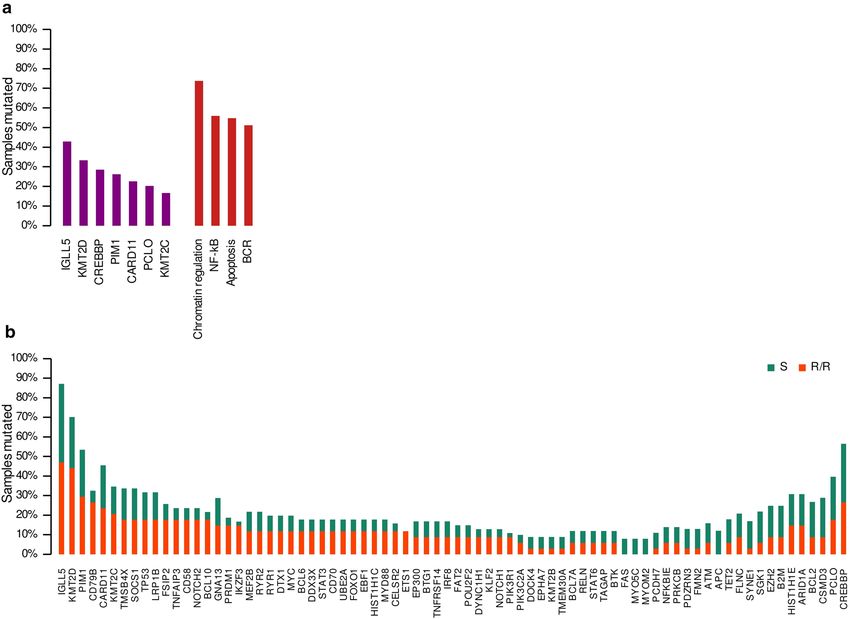
www.nature.com/scientificreports/
Figure 1. Mutational prevalence in genes and pathways. (A) Most frequently mutated genes and pathways in
the whole cohort. (B) Mutational prevalence for refractory/relapsed (R/R) and sensitive (S) cases for genes with
more than four samples mutated.
(HR = 2.72, p = 0.02), and ETS1 (HR = 3.67, p = 0.03) were also associated with a worse OS, as indicated by the
multivariate analysis with the IPI.
Proposal of a combined two‑step method for DLBLC genetic classification. Several attempts
have been made to improve COO classification by considering tumor genetics in order to facilitate the use
of precision-medicine approaches in DLBLC patients. This has led to new DLBCL genetic classifications, as
described earlier. One of our aims was to look for a method to unify them and simplify the classification algo-
rithms in such a way as to facilitate its routine use in pathology laboratories eventually to enable prospective
sample classification. For this purpose, we developed a classification method based mainly on the W right13 and
Lacy15 subtypes characteristics, integrating the most significant features from both studies. To refine and evalu-
ate our method, we used the United Kingdom population-based Haematological Malignancy Research Network
(HMRN) cohort15, restricting our analysis to DLBLC-NOS patients treated with R-CHOP (n = 580).
Several tests were carried out to select the best combination of genes, taking into account the sensitivity
and specificity compared with the PdH and HMRN cohorts using the LymphGen a lgorithm13 (see “Methods”
section). We selected the combination of genes to be used in the two-step (2-S) classifier, and then applied the
approach to our cohort. Five cases were classified as N12-S, 18 as BN22-S, 25 as EZB2-S, 14 as MCD2-S, and ten as
ST22-S. Twelve cases (14.3%) remained unclassified (Fig. 3).
When we classified the PdH cohort using LymphGen, 11 cases were assigned as BN2, 16 as EZB, six as MCD,
and six as ST2. Although we have five cases with NOTCH1 mutations, only two were assigned as EZB/N1 com-
plex genotype by LymphGen. Forty-three cases (53%) remained unclassified. Compared with LymphGen, the
two-step classifier showed a 100% sensitivity for the M CD2-S and EZB2-S, 81.8% for the B N22-S, and 50% for the
ST22-S subtypes, taking the LymphGen classification as reference (Table 2; Fig. 3). The specificity values achieved
were 89.7% for M CD2-S, 88% for BN22-S, 86.8% for E
ZB2-S, and 91.4% for ST22-S (Table 2; Fig. 3).
Due to the small size of our cohort, to validate the method, we applied the two-step as well as the LymphGen
classifiers to the HMRN cohort, and compared them to the Akaike Information Criterion (AIC) clustering
method employed in the original study15. The sensitivity values for the two-step classifier compared with the AIC
cluster were 97.5% for MCD2-S, 41.2% for BN22-S, 88.5% for EZB2-S, and 56.1% for ST22-S. Regarding specificity, all
Scientific Reports | (2021) 11:1886 | https://doi.org/10.1038/s41598-020-80376-0 4
Vol:.(1234567890)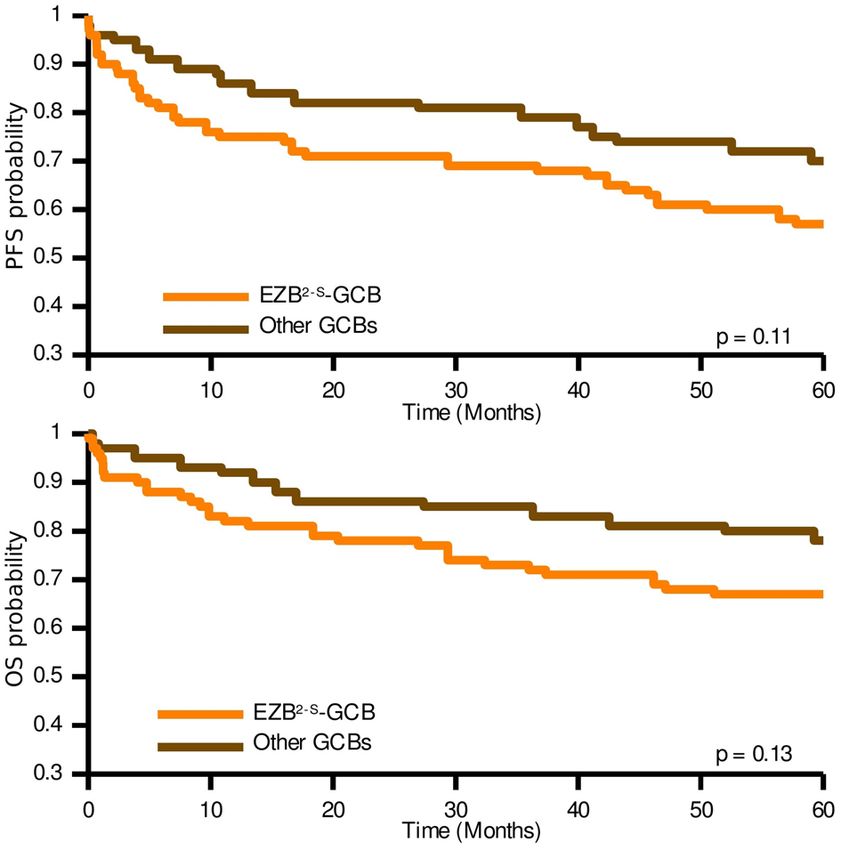
www.nature.com/scientificreports/
Figure 2. Statistical analysis of genes and pathways in the PdH cohort. Mutated genes and pathways with
significant p-values in the univariate Cox proportional-hazards model analysis for (A) progression-free (PFS)
and (B) overall survival (OS). Error bars represent the 95% confidence intervals for the hazard ratios. FDR
p-values for Benjamini–Hochberg correction are shown.
the subtypes achieved values greater than 90% (Table 2; Fig. 4). No sensitivity and specificity values were obtained
for N12-S because the AIC cluster did not include this group. The values comparing the two-step classification
to LymphGen were similar, except for the B N22-S/BN2 and S T22-S/ST2, with 64.0 and 81.3% sensitivity, respec-
tively (Table 2; Fig. 4). Seventeen samples were classified as N 12-S by our classifier, 16 of them also ranked as N1
by LymphGen. BN2/NOTCH2 and ST2/SGK1-TET2-SOCS1 also showed differences between with sensitivity
values of 39.2 and 50.4%, respectively (Table 2; Fig. 4).
N22-S subtype prompted us to analyze the samples included in this cluster more
The low sensitivity of the B
thoroughly. Twenty-eight percent of NOTCH2 cases in the HMRN cohort remained unclassified by our two-step
classifier. Eighteen percent had more mutations in genes for the E ZB2-S subtype and were, therefore, classified
as such. Similar low sensitivity was obtained when compared with the LymphGen classification, in which 28%
of the BN2 cases in the HMRN cohort were not assigned to any subtype by the two-step method. When we
compared the AIC cluster with the LymphGen, 43% of the NOTCH2 cases were unclassified by LymphGen,
and 13% were assigned to EZB.
When we examined the new two-step classifier’s potential clinical value, the survival analyses produced no
significant results in the PhD cohort, although they did reveal a trend towards shorter OS and higher risk of
relapse for M CD2-S and BN22-S cases compared with EZB2-S and ST22-S (Fig. S2A). MCD was the subtype with
the worst OS and PFS prognosis for the LymphGen classification, although, again, the differences were not
substantial enough to be statistically significant, given the small number of classified samples by both methods
(67 and 39, respectively) (Fig. S2B).
Therefore, we evaluated the two-step classifier’s clinical relevance using data from the DLBLC-NOS patients
treated with R-CHOP included in the HMRN cohort. The analysis assigned a higher risk of relapse to the N 12-S,
BN22-S, and M CD2-S cases than to the S T22-S cases (Fig. 5A). N12-S and B N22-S also had shorter OS. We compared
these results with those obtained by the original AIC cluster and LymphGen classifiers, and we found that the
Scientific Reports | (2021) 11:1886 | https://doi.org/10.1038/s41598-020-80376-0 5
Vol.:(0123456789)www.nature.com/scientificreports/
Figure 3. Genetic subtypes and association with overall survival (OS) and progression-free survival (PFS).
Genetic classification in the five defined genetic subtypes of DLBCL. Clustering was performed using alterations
in genes (rows) from 84 DLBCL samples (columns). The OS and event-free survival status, and the ABC/GCB
classification based on Lymph2cx and Hans are represented at the top. The phi coefficient and Fisher’s exact test
significance are represented on the right of the figure (*p < 0.05; **p < 0.01; ***p < 0.001).
groups defined by the three methods had grosso modo similar associations with PFS and OS, as indicated by
Kaplan–Meier and Cox proportional-hazards analysis (Fig. 5A–C). ST22-S/ST2/SGK1-TET2-SOCS1 is the group
12-S and N1 showed the shortest OS (Fig. 5A,C).
with the best clinical outcome. N
CD2-S/MCD/MYD88, EZB2-S/EZB/BCL2, and S T22-S/
The three classifiers showed similar PFS and OS for M
ST2/SGK1-TET2-SOCS1 subtypes, as demonstrated by the superimposed curves from the Kaplan–Meier analysis
(Fig. S3). BN22-S/BN2/NOTCH2 is the group that differed the most depending on the classifier used, showing
shorter OS and PFS with the two-step classification and the AIC cluster compared with LymphGen (Fig. S3A).
Scientific Reports | (2021) 11:1886 | https://doi.org/10.1038/s41598-020-80376-0 6
Vol:.(1234567890)www.nature.com/scientificreports/
Sensitivity/specificity (%)
MCD2-S BN22-S EZB2-S ST22-S N12-S
PdH cohort
Two-step versus LymphGen 100 89.7 81.8 88.0 100 86.8 50 91.4 – 94.1
Two-step versus AIC cluster 97.5 92.0 41.2 97.2 88.5 90.6 56.1 95.8 – –
HMRN cohort
Two-step versus LymphGen 98.5 90.1 64.0 95.8 89.9 92.8 81.3 92.7 100 99.8
LymphGen versus AIC cluster 81.3 99.6 39.2 97.8 84.9 93.5 50.4 99.0 – –
Table 2. Sensitivity and specificity analysis comparing the three classifiers in the Puerta de Hierro (PdH) and
HMRN cohorts.
Among the GCB-DLBLC cases, E ZB2-S cases showed worse clinical outcomes, although not statistically sig-
nificant (Fig. 6). The 36% of the non-EZB2-S GCB-DLBCL cases were classified as S T22-S, 12% as M CD2-S, 11% as
BN22-S; 40% of samples were unclassified. No differences were found between subtypes in the ABC-DLBLC cases.
Finally, the predictive value of the subtypes in combination with the IPI was analyzed. We performed a mul-
tivariate Cox proportional-hazards analysis with the IPI and the two-step classifier-defined genetic subtypes in
the HMRN cohort (Table S6), and subsequently validated the results in the PdH cohort. This model assigned
progression and survival risk scores for each sample in the PdH cohort (Table S1), from which we generated
three risk groups with different clinical outcomes, as indicated by the Kaplan–Meier analysis (p = 0.038 for OS;
p = 0.005 for PFS) (Fig. S4).
Discussion
Our study confirmed the current landscape of genetic alterations in DLBCL and explored their involvement in
clinical outcome and response to treatment. We also propose a modified genetic classification based on those of
the Wright et al.13 and Lacy et al.15, validated its accuracy, and analyzed its ability to predict response to therapy
and clinical outcome in R-CHOP-treated DLBCL patients.
Mutational data confirmed the well-known high degree of heterogeneity in DLBCLs. We found that the genes
most frequently mutated in this cohort were IGLL5, KMT2D, CREBBP, PIM1, CARD11, PCLO, and KMT2C,
similar to what has been noted in other DLBCL s eries12,14,17–21. When we integrated the genes in predefined
signaling pathways or gene functions, chromatin remodeling, BCR, NFκB, and apoptosis pathways were the
most frequently mutated gene sets (Fig. 1A).
The main problems for DLBCL patients are the high percentage of them (30–40%) that are refractory to treat-
ment or relapse, and the lack of accurate predictive markers. We found that mutations in CD79B were associated
with relapse, independent of the IPI. We also tested whether any alteration was related to primary refractoriness,
but none was found to be enriched in samples from R/R patients (data not shown). Patients with mutations in
CD79B, ETS1, and CD58 had significantly lower survival rates. CD79B and CD58 mutations had previously
shown adverse prognostic value, and CD79B was already known to be one of the most frequently mutated genes
at relapse22–25. Mutations in ETS1 were found more frequently in Burkitt lymphoma, but only sporadically in
DLBLC. ETS1 regulates B-cell-relevant pathways, such as B-cell differentiation. ETS1 overexpression has been
associated with gain of the 11q24.3 region. This region, characteristic of a Burkitt-like lymphoma subtype (BLL-
11q), has also been found to be gained in up to a quarter of DLBCL cases26,27.
Several recent studies have undertaken integrative, multiplatform analysis of gene mutations, structural aber-
rations, and gene-expression profiling12,13,15,28,29 that have led to the proposal of new genetic subtypes determined
by distinct genetic backgrounds and clinical behaviors. Although these classifications share several character-
istics and genetic features, their different uses lead to some inconsistencies in determining definite clusters. For
example, Schmitz12 and W right13 and their colleagues used BCL2 and BCL6 fusions, essential drivers of DLBCL
pathogenesis, as classifier alterations, whereas Lacy et al.15 did not use them to classify their samples; on the
other hand, Chapuy et al.14 used CNVs to define their clusters, which are especially relevant for the C2 subtype.
The algorithms’ complexity and the large number of genes and structural alterations used to define the genetic
subtypes made it challenging to use them as part of the clinical routine. Moreover, some classifications, like
LymphGen13, produce a high percentage of unclassified tumors. Others, such as that of C hapuy14 and L acy15 and
their coworkers, could not be used for individual samples. Here, we propose an easier classifier, using a panel with
a small number of genes (26) and BCL2 and BCL6 translocations detected by routine FISH technique, to define
the genetic subtypes. This two-step classifier is based mainly on the approaches of W right13 and L acy15, and uses
the most frequently mutated genes shared by the two studies, maintaining the names given by S chmitz12 and
Wright13. We define five groups and classify the samples as N 12-S, MCD2-S, BN22-S, EZB2-S, or ST22-S.
Given the limitations of this analysis arising from the low number of patients, we applied it in the external
HMRN series, restricting the analyses to DLBCL-NOS patients treated with R-CHOP.
Despite the limitations of the study, the comparison of the two-step classifier specificity and sensitivity with
that of LymphGen and the AIC cluster, and assessing its prognostic and predictive value in a large real-world
series (HMRN), showed our method to be robust and demonstrated that the clinical outcomes of the subgroups
did indeed differ.
Scientific Reports | (2021) 11:1886 | https://doi.org/10.1038/s41598-020-80376-0 7
Vol.:(0123456789)www.nature.com/scientificreports/
Figure 4. Comparison of the classifiers. Subtypes assigned to the HMRN cohort by LymphGen, AIC cluster
and the two-step classifier.
N12-S was defined by the presence of NOTCH1 mutations regardless of all other alterations detected in the
tumors. Although N1 was not included in the Lacy classification, we considered it an essential subtype because
it is the most aggressive (Fig. 5), as previously found by Schmitz12 and Wright13, and demonstrated in the Lacy
series15.
The BN22-S group had the worst clinical outcome of our series, with results similar to those of L
acy15, but
unlike those of Chapuy14 and of Schmitz–Wright12,13 (Fig. S2). The associations of the BN2 and C1 subtypes
with a more favorable outcome were explained as being a possible transformation from occult MZL. The BN2-
NOTCH2-C1 subtype was more weakly defined than the others, probably due to the disagreement regarding
the use of BCL6 translocations and the selection of genes defining it. They are based on several unequally shared
Scientific Reports | (2021) 11:1886 | https://doi.org/10.1038/s41598-020-80376-0 8
Vol:.(1234567890)www.nature.com/scientificreports/
Figure 5. Progression-free survival (PFS) and overall survival (OS) according to the genetic subtypes of
the two-step, AIC cluster and LymphGen classifiers in the HMRN cohort. Kaplan–Meier analysis of genetic
subtypes from (A) two-step, (B) AIC cluster and (C) LymphGen methods. Tables on the right of the figure show
the hazard ratio (HR) values from the Cox proportional-hazards model of genetic subtypes for PFS and OS
status. Error bars represent the 95% confidence intervals. Significance: *p < 0.05; **p < 0.01.
characteristics, such as NOTCH2 (shared by Schmitz–Wright12,13 and Lacy15), BCL10 (Schmitz–Wright12,13 and
Chapuy14) or BCL6 translocations ( Lacy15 and C hapuy14). These differences may explain the smaller overlap and
the different clinical behavior in the three series. We decided to include BCL2 and BCL6 translocations due to
their importance in DLBCL pathogenesis, the availability of the data for most DLBCL samples, the strong rela-
tionship between BCL2 mutations and BCL2 translocation, and the fact that, in the Lacy s eries15, the NOTCH2
subtype was enriched in samples with BCL6 fusions.
ST22-S/ST2/SGK1-TET2-SOCS1 was the subtype with the best clinical outcome, as previously r eported13,15,
and confirmed here with the three classifiers. M CD2-S/MCD/ MYD88 and EZB2-S/EZB/BCL2 are the most con-
sistent subtypes, as shown by the high sensitivity and specificity values when comparing the three classifiers and
the overlap of the Kaplan–Meier curves (Fig. 5 and Fig. S3). Comparing EZB2-S with other GCB cases (Fig. 6)
revealed the former to have a slightly worse clinical outcome.
Finally, given the limitations of analyzing CNVs in standard pathology laboratories, we decided not to include
A53 (Wright13)/C2 (Chapuy14) in our classifier as they were identified by TP53 mutations and deletions together
with widespread CNVs.
Scientific Reports | (2021) 11:1886 | https://doi.org/10.1038/s41598-020-80376-0 9
Vol.:(0123456789)www.nature.com/scientificreports/
Figure 6. Kaplan–Meier analysis of progression-free survival (PFS) and overall survival (OS) for E
ZB2-S-GCB
and other GCB cases in the HMRN cohort when applying the two-step classifier.
The original classifiers are of limited use in clinical practice because they are based on so many genetic altera-
tions and such complex algorithms. Here we propose a genetic DLBCL classifier that integrates the findings
of Schmitz–Wright12,13 and L acy15 and that is based on an optimized panel with a minimal set of markers (26
genes and the BCL2 and BCL6 translocations) that can classify samples individually for the purpose of routine
patient management. The validations carried out in this study demonstrated the close correlation between the
two-step classifier and the other classifiers, as the specificity and sensitivity analysis showed it to be adequate for
achieving a successful classification.
Despite the well-known heterogeneous clinical behavior of DLBCL patients, the diagnostic work-up and
treatment are identical for every patient. Although COO classification provided significant prognostic informa-
tion, and some targeted therapies have shown different efficacy depending on the COO, this has not led to any
changes in the use of R-CHOP as the standard treatment for DLBLC patients. We hope that this classifier would
make it possible to assign patients to a genetic subtype on a tumor-by-tumor basis, thereby guiding the clinical
management of individual patients.
The genetic alterations defining each subtype, the association of functionally altered pathways, and previ-
ously performed functional studies suggested the appropriate therapeutic approach for each of them. N1 is the
most interesting due to its poor response to standard immunochemotherapy. NOTCH1 aberrations frequently
occur in hematological malignancies, mainly chronic lymphocytic leukemia and T-cell leukemia, making this
gene a candidate target in the design of tailored therapy for this subtype. In this context, γ-secretase inhibitors
(GSIs) are the most widely studied anti-NOTCH1 molecules in cancer. The clinically relevant GSI PF-03084014,
combined with fludarabine, has antitumor effects in primary NOTCH1-mutated CLL cells30 and, when tested in
phase I clinical trials, showed good tolerance and antitumor activity in solid and hematological m alignancies31,32.
Therefore, the combination of GSIs with chemotherapy is a promising strategy for treating N1 DLBCL patients.
Several approaches have already been suggested for the other subtypes, such as BTK inhibitors for MCD cases,
EZH inhibitors, and BCL2 inhibitors, such as venetoclax or navitoclax, for the EZB subtype13.
In conclusion, we propose a feasible classifier built with mutation information from 26 genes and BCL2/
BCL6 translocations, based on the recently identified genetic s ubgroups12–15. This genetic classifier, combined
with clinical data and other molecular characteristics, should eventually help researchers develop improved risk
models for DLBCL patients and, more importantly, for guiding precision therapy.
Methods
Patients and samples. The study population (PdH cohort) consisted of 84 DLBCL patients, diagnosed in
Spanish medical institutions between 2002 and 2016. Five of the patients (PDLB63-PDLB67) had a diagnosis of
DLBCL after a histological transformation of follicular lymphoma without treatment prior to t ransformation33.
Formalin-fixed, paraffin-embedded tissue (FFPET) sections from diagnostic biopsies were collected. The
research project was approved by the Ethics Committee of Hospital Universitario Puerta de Hierro-Majadahonda
(reference PI67-14) and conducted in compliance with the Declaration of Helsinki. All participants signed an
informed consent form. Samples were collected and clinical data managed following protocols guaranteeing the
confidentiality of donor data. Material and data from other centers were anonymously transferred to our labora-
tory after obtaining approval from the corresponding ethics committees, under the relevant Spanish legislation
Scientific Reports | (2021) 11:1886 | https://doi.org/10.1038/s41598-020-80376-0 10
Vol:.(1234567890)www.nature.com/scientificreports/
(Ley 14/2007 de Investigación Biomédica and Real Decreto 1716/2011). All samples were reviewed upon arrival
by qualified hematopathologists to confirm their diagnosis.
Patients were treated with R-CHOP (77 patients) or R-CHOP-like (7 patients) regimens. The retrospective
collection included FFPET sections from samples at diagnosis from 50 patients (59.5%) who responded to treat-
ment, referred to hereafter as sensitive (S), and 34 samples (40.5%) from refractory (11 patients) and relapsed
(23) (R/R) patients. The median follow-up was 6 years. For the IPI analysis, we reclassified the patients into three
risk categories: low (0–1), intermediate (2–3) and high (4–5). Patient characteristics are summarized in Table 1
and Suppl. Table S1.
Targeted sequencing. Genomic DNA was extracted from FFPET using a truXTRAC FFPE DNA Kit
(Covaris, Woburn, MA, USA) following the manufacturer’s instructions.
Two SureSelect target enrichment custom panels were designed using the SureDesign (Agilent Technologies,
Santa Clara, CA, USA) web-based tool (earray.chem.agilent.com/suredesign/). The genes included are involved
in lymphomagenesis-relevant pathways and were selected based on previous s tudies17,18,34–37 and our earlier
findings33. The designs covered the coding exons of the selected genes. The targeted regions (according to Human
Assembly GRCh37/hg19) were captured using a SureSelectXT Target Enrichment System and SureSelectXT Low
Input (Agilent), as described in the manufacturer’s instructions. One hundred twenty-five genes were common
to the two designs and are referred to as the common gene set (CGS) (Suppl. Table S7). Captured libraries were
diluted to 8 pM for Illumina clustering, and paired-end sequencing was performed on MiSeq and NextSeq
sequencers (Illumina Inc., San Diego, CA, USA).
Three independent analyses were carried out for each sample. We first used the tools available in the Variant
Reporter instrument (Illumina). A second variant calling was done with VarScan 2.3.9 to detect the mutations of
the files extracted from two sources: (1) BWA Enrichment of Illumina Base Space, and (2) the Burrows-Wheeler
Aligner (BWA), Picard and Indel Realignment-Base Recalibration from the Genome Analysis Toolkit 3.8.1.0
(GATK).
Annotation was carried out with Annovar. All variants identified by the three complementary methods were
visualized using an Integrative Genomics Viewer (Broad Institute and UC San Diego, San Diego, CA, USA). Data
have been deposited in the Sequence Read Archive (SRA) (accession number PRJNA648645).
After annotation, the variants were subjected to additional, more stringent, and quality- and relevance-based
filtering applying the following criteria: quality read depth of bases ≥ 50; depth of variant-supporting bases ≥ 5;
localization (exonic, UTRs and splice site); variant effect (non-synonymous); variant allele frequency ≥ 5% and
not listed as a single nucleotide polymorphism, or listed but with a MAF < 0.01% (The Exome Aggregation
Consortium, 1000 Genomes Project of the International Genome Sample Resource (IGSR), Single Nucleotide
Polymorphism Database (dbSNP) v138 of the National Center for Biotechnology Information (NCBI)). The
median coverage was 764x (89–1908) (Suppl. Table S8).
Tissue microarray construction, immunohistochemistry and in situ hybridization analy‑
ses. Thirty-one DLBCL samples for which sufficient biopsy material was available were included in a tis-
sue microarray (TMA). Known positive and negative controls (one tonsil, one lymphadenopathy, and a known
triple-hit DLBLC case) were also included. A tissue arrayer (Beecher Instruments, Silver Spring, MD, USA) was
used for TMA construction. Hematoxylin and eosin-stained sections from each biopsy were used to define the
appropriate areas, and two representative cores (1 mm diameter) were used for the TMA.
TMA sections were stained with antibodies against CD10 (clone 56C6), BCL-6 (PG-B6p), MUM1 (MUM1p),
BCL-2 (124), and p53 (D07), all of which were mouse monoclonal antibodies, obtained from Agilent-Dako (Santa
Clara, CA, USA), and MYC (Y69, rabbit polyclonal; Agilent-Dako). The COO based on IHC was established by
the Hans algorithm38. EBER in situ hybridization (EBER1 DNA probe, Roche-Ventana; Basel, Switzerland) was
carried out to detect EBV.
Fluorescence in situ hybridization (FISH) was performed following the routine protocol at the Pathology
Department of our Institution. ZytoLight Dual Color Break Apart probes (ZytoVision GmbH, Bremerhaven,
Germany) were used to analyze BCL2 (18q21 region), BCL6 (3q27), and C-MYC (8q24).
IHC and FISH data from the samples not included in the TMA were collected from the original pathological
reports.
Nanostring LST nCOUNTER gene‑expression assay. We used the NanoString LST assay performed
with the nCounter Dx Analysis System (NanoString Technologies, Seattle, WA, USA) to determine COO. Total
RNA from 54 FFPET sections from diagnostic samples was isolated using a truXTRAC FFPE total NA kit (Cova-
ris) following the manufacturer’s instructions. RNA quality and quantity were assessed with an RNA 6000 Nano
kit (Agilent) using the Agilent 2100 Bioanalyzer System (Agilent).
The previously reported protocol for the NanoString LST gene expression assay was used39,40. Briefly, the
probes corresponding to the 20 LST g enes41,42 and based on the Lymph2Cx gene expression assay were hybrid-
ized in a multiplexed reaction to 400 ng of the total RNA for 16 h at 65 °C. Automated removal of excess probe
and immobilization of probe–transcript complexes on a streptavidin-coated cartridge were carried out in the
nCounter Prep Station, and raw gene expression counts were collected on the Digital Analyzer. Data were ana-
lyzed using nSolver 4.0 software (NanoString Technologies) for COO classification.
Genetic classification. We performed a simplified genetic classification based on those proposed by
Schmitz-Wright12,13 and Lacy15 and their research teams. We used the alterations of specific genes to develop a
two-step classification method and classified the samples as N12-S, BN22-S, EZB2-S, MCD2-S, or S T22-S. The A53
Scientific Reports | (2021) 11:1886 | https://doi.org/10.1038/s41598-020-80376-0 11
Vol.:(0123456789)www.nature.com/scientificreports/
LymphGen subtype was not included due to the lack of copy number variation data in our series and most pub-
lished series. The genes from the Schmitz-Wright12,13 and Lacy15 studies were selected by calculating their power
to classify determined by the Fisher’s exact test, as featured in these studies (Suppl. Table S9). Several tests were
then carried out to select the best combination of genes, taking into account the sensitivity and specificity in the
PdH and HMRN cohorts according to the LymphGen and Lacy classification (AIC cluster). In the first step, at
least one of the top genes should be mutated: NOTCH1, for N12-S (NOTCH1 mutated samples were classified as
N12-S, regardless the presence of other alterations); MYD88, CD79B, and PIM1 for M CD2-S; BCL6 translocation,
NOTCH2, BCL10, and TNFAIP3 mutations for BN22-S; BCL2, EZH2, and CREBBP for EZB2-S; and SGK1, TET2,
and SOCS1 for S T22-S. Samples with the same score for two or more subtypes, or samples with no mutations,
were classified in the second step, in which we added the following genes for each subtype: PRMD1, BTG1, PIM2,
and CD58 for M CD2-S; UBE2A, CD70, CCND3, and DTX1 for BN22-S; TNFRSF14, KMT2D, IRF8, and EP300
for EZB2-S, and STAT3 for ST22-S. In this second step, at least two genes from any of the genes that define each
subtype should be mutated to assign the sample to the corresponding subtype (Fig. S5 and Suppl. Table S9).
We selected the HMRN c ohort15 as an external validation cohort for the two-step method, restricting the
analysis to patients treated with R-CHOP (n = 580).
Sensitivity and specificity. The sensitivity and specificity of each subtype defined by the two-step method
were determined using the LymphGen and AIC classifiers as references in the PdH and HMRN cohorts. Sensi-
tivity was calculated as the percentage of true positives relative to the reference classifier:
True positives
Sensitivity = .
True positives + False negatives
Specificity was calculated as the percentage of true negatives relative to the reference classifier:
True negatives
Specificity = .
True negatives + False positives
Statistical analysis. Statistical analyses were performed using R 3.6.1 (https://www.R-project.org, R Foun-
dation for Statistical Computing, Vienna, Austria). Associations between factors were assessed with Fisher’s
exact test and the predictive value of the selected variants by Cox proportional-hazards models, adjusted using
the Benjamini–Hochberg correction method.
OS was calculated as a binomial factor for survival or non-survival of each sample. Progression-free survival
(PFS) was calculated as a binomial factor, assigning the event to the treated patients who did not respond to
treatment or who relapsed. We performed univariate and multivariate logistic regression analyses of genes and
pathways mutated in at least four samples to establish each variable’s predictive value. Hazard ratios (HRs) with
95% confidence intervals were estimated for each variable. The survival function of genetic groups, as measured
by OS and time to relapse (PFS), was also calculated by the Kaplan–Meier method.
Code availablity
Accession codes: SRA (PRJNA648645). The R code for the two-step classifier can be downloaded from https://
github.com/Lymphoma-IDIPHISA/Two-step-classifier.
Received: 27 July 2020; Accepted: 21 December 2020
References
1. Sant, M. et al. Incidence of hematologic malignancies in Europe by morphologic subtype: results of the HAEMACARE project.
Blood 116, 3724–3734 (2010).
2. Howlader N, Noone AM, Krapcho M, Miller D, Brest A, Yu M, Ruhl J, Tatalovich Z, Mariotto A, Lewis DR, Chen HS, Feuer EJ,
C. K. Diffuse Large B-Cell Lymphoma—Cancer Stat Facts. (2019).
3. Coiffier, B. et al. Long-term outcome of patients in the LNH-98.5 trial, the first randomized study comparing rituximab-CHOP to
standard CHOP chemotherapy in DLBCL patients: a study by the Groupe d’Etudes des Lymphomes de l’Adulte. Blood 116, 2040
(2010).
4. Pérez-Callejo, D., González-Rincón, J., Sánchez, A., Provencio, M. & Sánchez-Beato, M. Action and resistance of monoclonal
CD20 antibodies therapy in B-cell Non-Hodgkin Lymphomas. Cancer Treat. Rev. 41, 680–689 (2015).
5. International Non-Hodgkin’s Lymphoma Prognostic Factors Project. A predictive model for aggressive non-Hodgkin’s lymphoma.
N. Engl. J. Med. 329, 987–994 (1993).
6. Sehn, L. H. et al. The revised International Prognostic Index (R-IPI) is a better predictor of outcome than the standard IPI for
patients with diffuse large B-cell lymphoma treated with R-CHOP. Blood 109, 1857–1861 (2007).
7. Zhou, Z. et al. An enhanced International Prognostic Index (NCCN-IPI) for patients with diffuse large B-cell lymphoma treated
in the rituximab era. Blood 123, 837–842 (2014).
8. Swerdlow, S. H. et al. The 2016 revision of the World Health Organization classification of lymphoid neoplasms. Blood 127,
2375–2390 (2016).
9. Alizadeh, A. A. et al. Distinct types of diffuse large B-cell lymphoma identified by gene expression profiling. Nature 403, 503–511
(2000).
10. Rosenwald, A. et al. The use of molecular profiling to predict survival after chemotherapy for diffuse large-B-cell lymphoma. N.
Engl. J. Med. 346, 1937–1947 (2002).
11. Wright, G. et al. A gene expression-based method to diagnose clinically distinct subgroups of diffuse large B cell lymphoma. Proc.
Natl. Acad. Sci. USA 100, 9991–9996 (2003).
12. Schmitz, R. et al. Genetics and pathogenesis of diffuse large B-cell lymphoma. N. Engl. J. Med. 378, 1396–1407 (2018).
Scientific Reports | (2021) 11:1886 | https://doi.org/10.1038/s41598-020-80376-0 12
Vol:.(1234567890)www.nature.com/scientificreports/
13. Wright, G. W. et al. A probabilistic classification tool for genetic subtypes of diffuse large B cell lymphoma with therapeutic impli-
cations. Cancer Cell 37, 551-568.e14 (2020).
14. Chapuy, B. et al. Molecular subtypes of diffuse large B cell lymphoma are associated with distinct pathogenic mechanisms and
outcomes. Nat. Med. 24, 679–690 (2018).
15. Lacy, S. E. et al. Targeted sequencing in DLBCL, molecular subtypes, and outcomes: a Haematological Malignancy Research
Network report. Blood 135, 1759–1771 (2020).
16. Aggarwal, M. et al. Functional signatures identified in B-cell non-Hodgkin lymphoma profiles. Leukemia Lymphoma 50, 1699–1708
(2009).
17. Pasqualucci, L. et al. Analysis of the coding genome of diffuse large B-cell lymphoma. Nat. Genet. 43, 830 (2011).
18. Morin, R. D. et al. Frequent mutation of histone-modifying genes in non-Hodgkin lymphoma. Nature 476, 298–303 (2011).
19. de Miranda, N. F. C. C. et al. Exome sequencing reveals novel mutation targets in diffuse large B-cell lymphomas derived from
Chinese patients. Blood 124, 2544–2553 (2014).
20. Lohr, J. G. et al. Discovery and prioritization of somatic mutations in diffuse large B-cell lymphoma (DLBCL) by whole-exome
sequencing. Proc. Natl. Acad. Sci. USA 109, 3879 (2012).
21. Pasqualucci, L. et al. Inactivating mutations of acetyltransferase genes in B-cell lymphoma. Nature 471, 189–195 (2011).
22. Morin, R. D. et al. Genetic landscapes of relapsed and refractory diffuse large B-cell lymphomas. Clin. Cancer Res. 22, 2290–2300
(2016).
23. Braggio, E. et al. Genome-wide analysis uncovers novel recurrent alterations in primary central nervous system lymphomas. Clin.
Cancer Res. 21, 3986–3994 (2015).
24. Cao, Y. et al. Mutations or copy number losses of CD58 and TP53 genes in diffuse large B cell lymphoma are independent unfa-
vorable prognostic factors. Oncotarget 7, 83294–83307 (2016).
25. Mottok, A. et al. Integrative genomic analysis identifies key pathogenic mechanisms in primary mediastinal large B-cell lymphoma.
Blood 134, 802–813 (2019).
26. Gonzalez-Farre, B. et al. Burkitt-like lymphoma with 11q aberration: a germinal center-derived lymphoma genetically unrelated
to Burkitt lymphoma. Haematologica 104, 1822–1829 (2019).
27. Bonetti, P. et al. Deregulation of ETS1 and FLI1 contributes to the pathogenesis of diffuse large B-cell lymphoma. Blood 122,
2233–2241 (2013).
28. Reddy, A. et al. Genetic and functional drivers of diffuse large B cell lymphoma. Cell 171, 481-494.e15 (2017).
29. Bolen, C. R. et al. Prognostic impact of somatic mutations in diffuse large B-cell lymphoma and relationship to cell-of-origin: data
from the phase III GOYA study. Haematologica https://doi.org/10.3324/haematol.2019.227892 (2019).
30. López-Guerra, M. et al. The γ-secretase inhibitor PF-03084014 combined with fludarabine antagonizes migration, invasion and
angiogenesis in NOTCH1-mutated CLL cells. Leukemia 29, 96–106 (2015).
31. Messersmith, W. A. et al. A Phase I, dose-finding study in patients with advanced solid malignancies of the oral γ-secretase inhibi-
tor PF-03084014. Clin. Cancer Res. 21, 60–67 (2015).
32. Papayannidis, C. et al. A Phase 1 study of the novel gamma-secretase inhibitor PF-03084014 in patients with T-cell acute lympho-
blastic leukemia and T-cell lymphoblastic lymphoma. Blood Cancer J. 5, e350 (2015).
33. González-Rincón, J. et al. Unraveling transformation of follicular lymphoma to diffuse large B-cell lymphoma. PLoS ONE 14,
e0212813 (2019).
34. Zhang, J. et al. Genetic heterogeneity of diffuse large B-cell lymphoma. Proc. Natl. Acad. Sci. 110, 1398–1403 (2013).
35. Karube, K. et al. Recurrent mutations of NOTCH genes in follicular lymphoma identify a distinctive subset of tumours. J. Pathol.
234, 423–430 (2014).
36. Okosun, J. et al. Integrated genomic analysis identifies recurrent mutations and evolution patterns driving the initiation and
progression of follicular lymphoma. Nat. Genet. 46, 176–181 (2014).
37. Pasqualucci, L. et al. Genetics of follicular lymphoma transformation. Cell Rep 6, 130–140 (2014).
38. Hans, C. P. et al. Confirmation of the molecular classification of diffuse large B-cell lymphoma by immunohistochemistry using
a tissue microarray. Blood 103, 275–282 (2004).
39. Kulkarni, M. M. Digital multiplexed gene expression analysis using the NanoString nCounter system. Current protocols in molecular
biology Chapter 25, Unit25B.10 (2011).
40. Watatani, Y. et al. Molecular heterogeneity in peripheral T-cell lymphoma, not otherwise specified revealed by comprehensive
genetic profiling. Leukemia 33, 2867–2883 (2019).
41. Scott, D. W. et al. Prognostic significance of diffuse large B-cell lymphoma cell of origin determined by digital gene expression in
formalin-fixed paraffin-embedded tissue biopsies. J. Clin. Oncol. 33, 2848–2856 (2015).
42. Scott, D. W. et al. Determining cell-of-origin subtypes of diffuse large B-cell lymphoma using gene expression in formalin-fixed
paraffin-embedded tissue. Blood 123, 1214–1217 (2014).
Acknowledgements
We are indebted to the patients who contributed to this study and to the members of GOTEL (Grupo Oncológico
para el Tratamiento y el Estudio de los Linfomas). We are especially thankful to E. Ramil of the Sequencing
Unit of the Instituto de Investigación Sanitaria Puerta de Hierro-Segovia de Arana (IDIPHISA) and Á. Zaballos
from the Genomics Unit of Instituto de Salud Carlos III (ISCIII). We acknowledge the Biobank of the Hospital
Puerta de Hierro, the Biobank of the Sistema Sanitario Público de Andalucía and the Spanish Hospital Biobank
Network, supported by the ISCIII, Complejo Hospitalario de Toledo and MD Anderson Cancer Center-Madrid,
as well as the Pathology Departments of the centers collaborating in the study. We also thank L. Cereceda from
the Instituto de Investigación Sanitaria Fundación Jimenez Díaz for her invaluable help, A. Royuela from IDI-
PHISA’s Clinical Biostatistics Unit and C. Parejo from IDIPHISA’s TIC Unit—Medical Oncology Department.
This work was supported by the Spanish Ministry of Economy and Competence (MINECO) SAF2013-47416-R;
ISCIII-MINECO AES-FEDER (Plan Estatal de I+D+I 2008-2011 and 2013-2016) (PI14/00221, DTS17/00039,
PI17/00272, PI16/01294, CIBERONC CB16/12/00291); by GILEAD (GL18/00019) and Dirección General de
Universidades e Investigación Consejería de Educación e Investigación de la Comunidad de Madrid (B2017/
BMD-3778). LP and JGR are recipients of iPFIS predoctoral fellowships (IFI18/0004 and IFI14/0003, by ISCIII-
MINECO AES-FEDER (Plan Estatal I+D+I 2017-2020), and Plan Estatal I+D+I 2013-2016, respectively), IFM
is supported by B2017/BMD-3778, CT is recipient of a bioinformatician fellowship (CA18/00022), and NYC
is supported by the Asociación Española Contra el Cáncer. MSB has been a beneficiary of a Miguel Servet II
contract (CPII16/00024), by ISCIII-MINECO AES-FEDER (Plan Estatal I+D+I 2013-2016) and the Fundación
de Investigación Biomédica Puerta de Hierro. The funders had no role in the study design, data collection and
analysis, the decision to publish, or the preparation of the manuscript.
Scientific Reports | (2021) 11:1886 | https://doi.org/10.1038/s41598-020-80376-0 13
Vol.:(0123456789)www.nature.com/scientificreports/
Author contributions
M.S.B., M.P., and D.P.C. designed the study. M.S.B. supervised the study. L.P., D.P.C., S.G., A.S., and M.R. per-
formed the experimental work. C.Q., P.M.A., J.F.G., F.R.G.A., A.R., F.I.C., M.G.C., M.L., M.M., M.P.V., J.G.C.,
A.S., M.A.P., and M.P. collected clinical data and patient samples. L.P., I.F.M., D.P.C., J.G.R., and N.Y.C. analyzed
and interpreted the data. I.F.M., C.T., and A.H. performed the statistical and computational analysis. L.P., I.F.M.,
D.P.C., and M.S.B. wrote the manuscript. All the authors critically reviewed and approved the manuscript. L.P.,
I.F.M., and D.P.C. contributed equally to this work.
Competing interests
The authors declare no competing interests.
Additional information
Supplementary Information The online version contains supplementary material available at https://doi.
org/10.1038/s41598-020-80376-0.
Correspondence and requests for materials should be addressed to M.S.-B.
Reprints and permissions information is available at www.nature.com/reprints.
Publisher’s note Springer Nature remains neutral with regard to jurisdictional claims in published maps and
institutional affiliations.
Open Access This article is licensed under a Creative Commons Attribution 4.0 International
License, which permits use, sharing, adaptation, distribution and reproduction in any medium or
format, as long as you give appropriate credit to the original author(s) and the source, provide a link to the
Creative Commons licence, and indicate if changes were made. The images or other third party material in this
article are included in the article’s Creative Commons licence, unless indicated otherwise in a credit line to the
material. If material is not included in the article’s Creative Commons licence and your intended use is not
permitted by statutory regulation or exceeds the permitted use, you will need to obtain permission directly from
the copyright holder. To view a copy of this licence, visit http://creativecommons.org/licenses/by/4.0/.
© The Author(s) 2021
Scientific Reports | (2021) 11:1886 | https://doi.org/10.1038/s41598-020-80376-0 14
Vol:.(1234567890)You can also read