Cross species gene enrichment revealed a single population of Hilsa shad (Tenualosa ilisha) with low genetic variation in Bangladesh waters - Nature
←
→
Page content transcription
If your browser does not render page correctly, please read the page content below
www.nature.com/scientificreports
OPEN Cross‑species gene enrichment
revealed a single population
of Hilsa shad (Tenualosa ilisha)
with low genetic variation
in Bangladesh waters
Anirban Sarker1,2, Junlong Jiang1, Habibon Naher1,2, Junman Huang1, Kishor Kumar Sarker1,
Guoxing Yin1, Mohammad Abdul Baki2 & Chenhong Li 1*
Tenualosa ilisha is a popular anadromous and significant trans-boundary fish. For sustainable
management and conservation of this fish, drawing an appropriate picture reflecting population
status of this species is very essential based on their all-strategic habitats in Bangladesh. In this study,
139 samples from 18 sites were collected and cross-species gene enrichment method was applied.
Like most of the Clupeiforms, nucleotide diversity of this shad was very low (0.001245–0.006612).
Population differences between most of the locations were low and not significant (P > 0.05). However,
P values of a few locations were significant (P < 0.05) but their pairwise FST values were very poor
(0.0042–0.0993), which is inadequate to recognize any local populations. Our study revealed that
the presence of a single population in the Bangladesh waters with some admixtured individuals,
which may contain partial genes from other populations. Most of the individuals were admixed
without showing any precise grouping in the ML IQtree and Network, which might due to their
highly migratory nature. Fishes from haors and small coastal rivers were not unique and no genetic
differences between migratory cohorts. The hilsa shad fishery should be managed considering it as a
single panmictic population in Bangladesh with low genetic diversity.
The national fish of Bangladesh, the Hilsa shad (Tenualosa ilisha Hamilton, 1822) (Family: Clupeidae) (Fig. 1)
is a well-liked anadromous fish species1, locally known as Ilish. This is a significant trans-boundary fish, which
survives in the Bay of Bengal and migrates between marine and freshwater for breeding, nursing and feeding
purposes. Bangladesh enjoys major share of this migrating fish from the Bay of Bengal to upstream rivers (86%),
followed by India (8%), and Myanmar (4%)2. The species is also distributed in Iran, Iraq, Saudi Arabia, Kuwait,
Qatar, Oman, UAE, Pakistan, Sri Lanka, Thailand, Malaysia and Vietnam3. It is the largest single species fishery
contributing 44% of total catch in Bangladesh that accounts virtually about 12.09% of total fish production of the
country, representing around 1% of the total gross domestic product of the country with annual catch of 517,189
metric tons (inland catch: 232,698 MT and Marine catch: 284,500 MT)4. Hilsa shad also remains a subsistence
food for many poor coastal communities and a valuable resource for millions of people in the Bay of Bengal and
its major associated river systems.
The Hilsa shad lives in shallow coastal waters of the Bay of Bengal and its estuaries but in the breeding
season they migrates to the upstream rivers from the Bay of Bengal using lower part of the Meghna River. The
lower part of the Meghna River is directly connected to the Meghna (upstream), the Padma (lower stream of
the Ganges) and the Jamuna (New Bhrahmaputra River) rivers, established the main migratory route for this
fish. At the same time, they use some other small coastal rivers like the Payra, the Bishkhali, the Balaswar, the
Pashur etc., which are far away from the main migration route as their freshwater entry. The Pashur River passes
through the world largest mangrove forest, Sunderban and connected with the Padma River at Hardinge Bridge
through the Madhumoti and the Gorai River; establish another important route of Hilsa shad migration. The
Kocha River mainly connected to the Bishkhali and the Balaswar River, which passes by the side of the mangrove
1
Shanghai Universities Key Laboratory of Marine Animal Taxonomy and Evolution, Shanghai Ocean University,
Shanghai 201306, China. 2Department of Zoology, Jagannath University, Dhaka 1100, Bangladesh. *email: chli@
shou.edu.cn
Scientific Reports | (2021) 11:11560 | https://doi.org/10.1038/s41598-021-90864-6 1
Vol.:(0123456789)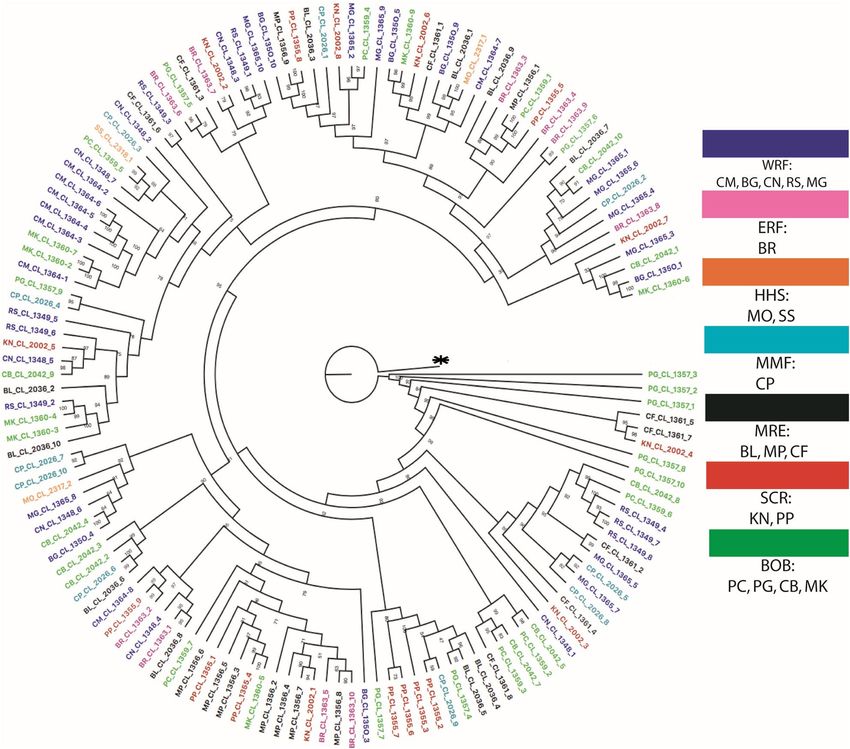
www.nature.com/scientificreports/
Figure 1. A Hilsa shad (Tenualosa Ilisha) specimen collected from Chandpur (CP), Bangladesh.
f orest5,6. Simultaneously, this fish uses some marshy wetland ecosystems known as haor and hill stream rivers
(e.g., Someshwari River) situated in the northeastern part of Bangladesh for their migration. The water qualities
and ecological factors of these habitats are different from the Hilsa’s other migration routes. Moreover, the south
eastern coast of the Bay of Bengal also represent some oceanographic and water qualitative unique characteris-
ay7. These types of
tics as a fish (e.g., Hilsa shad) habitat which is distinctly different from other portion of the b
special small coastal rivers, river passes through the mangrove forest and wetlands were overlooked in previous
population studies of the Hilsa shad. Thus, comprehensive scenario of Hilsa population is incomplete because
of ignoring all small unique unfocused water bodies. Therefore, the present study was designed to consider all
types of habitat including all primary and secondary routes of migration from the Bay of Bengal.
The Hilsa shad shows a range of movement patterns. Two periods of migration of this fish occur in a year,
the first -one is correlated with the monsoon rain (June–October), which causes flood and the second-one hap-
pens in the general rise of temperature of the water in the estuaries after the close of winter (January-March)8,9.
Hilsa shad shows some seasonal morphometric variations between winter and monsoon runs at Hoogly River
estuary, India10. The temporal stability of Hilsa shad in Bangladesh water was figured out based on spawning,
fecundity and sex r atio8, but how closely are those are reflected in genetic makeup, of each stock is needed to be
tested using molecular data.
Migration is an important factor for drawing the fish population with high migratory potential. Some cases
this nature prevent to make local population or cluster and often make admixtured individuals that obscure
population differentiation11. Differentiation of anadromous fish population by local adaptation is challenging
because of their elevated rate of gene flow, highly connected divergent population and large population size12. As
a highly migratory species, Hilsa shad have less chance to create high population differentiation in its migratory
routes. Bangladesh is a small riverine country and its most the water bodies are connected to each other by a
diverse river network. This type of habitat claims precise checking of the presence of population differentiation
for a highly migratory fish species (e.g., Hilsa shad).
Discovery of population genetic structure and genetic diversity are very important for sustainable ocean
fisheries, which can provide basic information for the fisheries resource assessment and m anagement13. Due
to environmental changes, pollution and over exploitation, many fishes are losing genetic diversity c urrently14.
Previous studies on genetic population structure of T. ilisha were mostly based on allozymes, allele frequencies,
microsatellite DNA markers and mitochondrial DNA regions: Cytochrome b (CytB), ATPase 6&8 (ATPase),
12 s and 16 s rRNA10,15–18. Mitochondrial gene analysis indicated temporal stability of sampled populations; with
low genetic differentiation between temporal samples from same locality of three Indian rivers10. However, these
methods bases on single or few loci, which have lesser power to estimate fine genetic structure. Very recently, A
study discover the population genomics and structure of Hilsa shad in Bangladesh waters based on six and eight
locations respectively using NextRAD sequencing19,20. But their studied locations did not represent overall water
bodies of Bangladesh, like lentic water (haor), hill stream river (e.g., Someshwari river) and small coastal rivers
(i.e., Pashur river, Kocha river, Lata Chapli river and Tetulia river) including the middle portion of Bangladesh
(e.g., Manikganj, Bhairab etc.) and south eastern portion of the Bay of Bengal. According to these studies, Hilsa
population was divided into two genetically structured clusters, marine and estuarine and fresh water, based on
their local adaptation. Finally, the riverine population was divided into north-western riverine (turbid freshwater)
and the north-eastern riverine (clear fresh water) clusters. They drawn several specific populations or clusters in
the upper streams of Bangladesh, however, this shad is not found in the freshwater all over the year round. All of
the spawning grounds of this shad were discovered in the lower stretches of the Meghna River and some other
small coastal rivers situated almost in the same a rea6,21. Moreover, as a highly migratory species, Hilsa shad popu-
lation should not able to make different clusters in their migratory routes. In the present study, sufficient number
of samples were collected from almost all tactical water ecosystems including all major rivers of Bangladesh (i.e.,
the Padma, the Meghna, the Jamuna and the Brahmaputra river), coastal waters of the Bay of Bengal (western and
eastern) and its estuary (in total 18 locations). Locations also included previously unfocused lentic water (haor),
hill stream river and small coastal rivers including the middle portion of Bangladesh. Moreover, samples were
collected from seasonal migratory (i.e., summer vs. winter) cohorts. Our assumption is that, in order to draw
the total picture of population of the Hilsa shad, sampling should be focused on diverse habitat types including
all strategic ecosystems and migratory cohorts instead of different river sections of the same major drainages.
Scientific Reports | (2021) 11:11560 | https://doi.org/10.1038/s41598-021-90864-6 2
Vol:.(1234567890)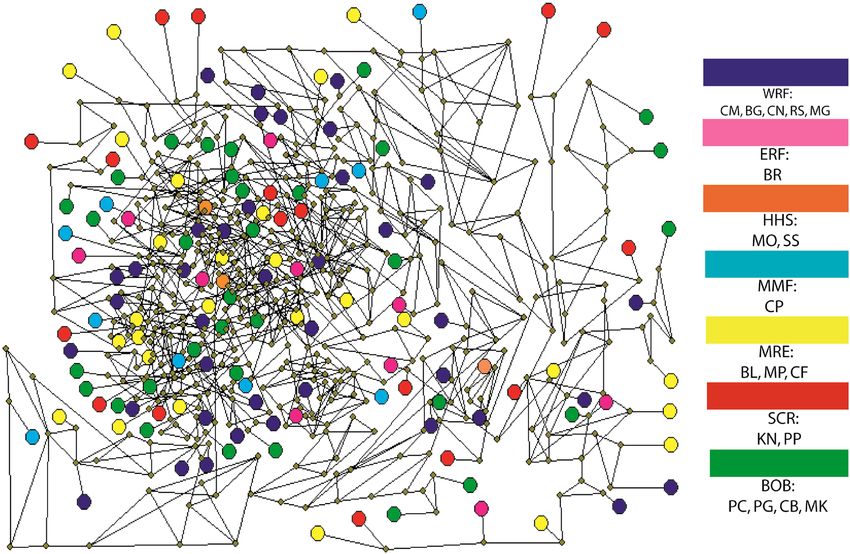
www.nature.com/scientificreports/
Therefore, to avoid these previously discussed confusions and better understanding, we collected sequence
data of 4434 nuclear genes from 139 Hilsa samples taken from the Bay of Bengal, its estuaries and all possible
lotic and lentic waters and two migratory cohorts, applying a cross-species gene enrichment m ethod22, to exam-
ine the genetic diversity and population structure of this shad. Our goal is to provide a solid estimation of the
population status of Hilsa shad using genome-wide data and to infer its genetic diversity. Our study will provide
a comprehensible look into the genetic diversity of this commercially important species and an evaluation of its
population genetic structure. The findings should be important for the management and conservation of this
important fisheries resource.
Material and methodology
Sample collection and DNA extraction. Samples (dead fish) have been taken from the commercial
fishing boats or directly from fishermen at fish landing sites. In total 139 individuals of Hilsa shad were col-
lected from the diverse ecosystems of Bangladesh including 18 locations involved all fresh water, brackish and
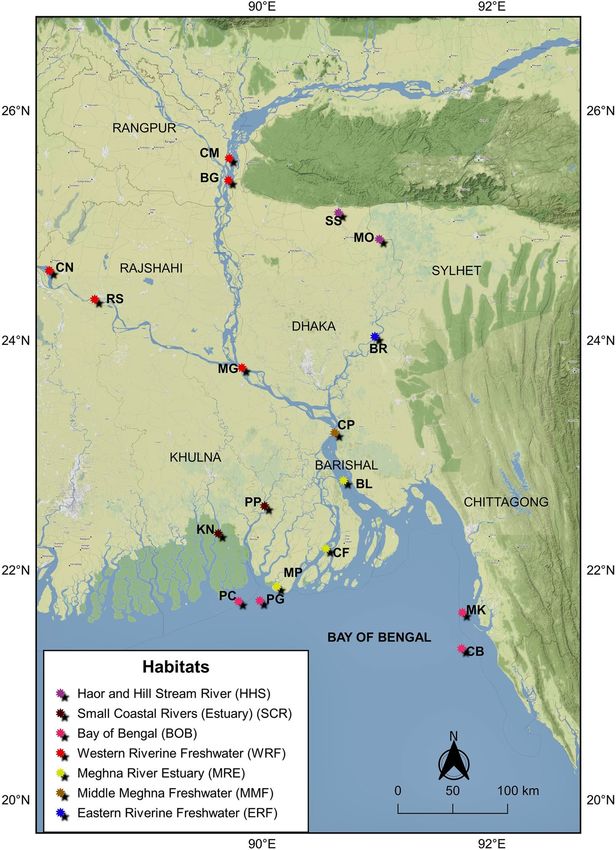
marine habitats for this fish (Fig. 2). Furthermore, three primary routes of migration of Hilsa shad from Bay
of Bengal were also considered. These sampling locations were categorized into seven different habitat groups
based on their habitat nature i.e., 1. Western Riverine (Freshwater) 2. Eastern Riverine (Freshwater) 3. Haor and
hill stream river 4. Middle Meghna 5. Meghna Estuary 6. Small Coastal Rivers (Estuary) 7. Bay of Bengal (Fig. 2,
Table 1). The samples were identified based on morphological f eatures23,24. Five closely related Kelee shad (Hilsa
kelee) were collected from the Arabian Sea coast for using as out-group. For sampling, muscles were collected
from the base of dorsal fin and fin clips were collected from the tip of caudal fin. For fixation and preservation
of tissue samples, 100% and 95% ethanol were used respectively. Finally, samples were stored in 4 0C refrigerator
until DNA extraction started. DNA was extracted from 25 mg of tissue using an Ezup DNA extraction kit fol-
lowing the protocol of the manufacturer (Sangon Biotech, Shanghai, China).
DNA library preparation, gene capture and sequencing. Extracted genomic DNA was sheared to
about 500 bp using Covaris M220 Focused-ultrasonicator (Woburn, Massachusetts, USA) according to the man-
ufacturer’ instructions. Size of sheared DNA and product of every further step was measured by using agarose
gel electrophoresis. DNA libraries were constructed and “with-beads” method was adopted in this protocol to
obtain higher y ield22. Inline indices were added to the adapter to label the samples in the ligation step of library
preparation to ease the possible risk of cross contamination among the samples during subsequent gene capture
step. After that library preparation, products were pooled together equimolarly.
A cross species gene capture was done and genes were captured for two consecutive trials that increase the
recovery rate of enriched gene22. A bait set was designed based on the sequence of two Clupeiform species
Denticeps clupeoides (Acession number: GCA_900700345.2) and Ilisha elongata (unpublished) for capturing
highest number of genes. The enriched libraries (average concentration: 17,073 ng/ml) were amplified by IS4 and
indexing primers25. Finally, captured genes were pooled in equimolar ratios for sequencing on Illumina HiSeq
X10 lane at Annoroad Inc (Beijing, China).
Data preparation read assembly and post assembly processing. According to the description in
Assexon pipeline26, data processing, read assembly and post assembly processing were done. Raw reads from
each sample were parsed according to their 8 bp barcodes (139 unique barcodes were used) on P7 adapter
using bcl2fastq v1.8.3 (Illumina). Trim galore v0.4.1 (http://www.bioinformatics.babraham.ac.uk/projects/trim_
galore/) was used to trim low quality bases and sequence adaptors. Coding frame of each marker sequence was
predicted and corrected using a Perl script (predict_frames.pl). Coding sequences were extracted and translated
into amino acid sequences by using Bio:: Seq module in Bioperl27.
PCR duplicates were excluded by using “-fastx_uniques” command in USEARCH v10.0.24028. Sequence of
Danio rerio (https://doi.org/10.5061/dyrad.2j5b4) was used as a reference sequence to parse reads to each gene
file. Reads were sorted to references with BLAST hit using UBLAST with a relaxed e-value of 1 × 10⁻⁴. Reads
of each locus were assembled (De novo assembly) into contigs by a conservative assembler SGA29. Contigs
were locally aligned to protein sequences of references using the “protein2dna” model in the package under
Exonerate30. Reciprocal blast method was used to pick up the orthologous genes.
The output amino acid (AA) sequences were aligned in batch using MAFFTv7.369b31. The AA sequences were
translated back to DNA after alignment. Poor and badly aligned sequences in coding regions were removed by
filter.pl to avoid interfere in phylogenetic inference. Summary statistics (e.g., number of enriched samples, GC
content and percentage of missing data) for coding and flanking region of each locus and sample was extracted
by using statistics.pl26.
SNP calling. A custom Perl script was used to make consensus sequences for each target locus from assem-
bled contigs26 and then reads with adapter sequences were trimmed (Quality Phred score cutoff: 20) and low
quality reads were excluded and finally mapped to the consensus by using BWA v0.7.5. The sequence map format
(SAM) files were converted into binary format (BAM) by using S amtools32. SNP sites were genotyped based on
the BAM files using GATK-3.2.233. GATK Best Practices recommendations were followed34. Single SNP per
locus with least amount of missing data and highest quality score was kept for most analyses to meet the require-
ment of linkage equilibrium. Custom Perl script was used again to convert the SNP VCF file into NEXUS file
and STRUCTURE input file26.
Phylogenetic analysis and Network based on gene‑capture data. A concatenated maximum like-
lihood (ML) tree was reconstructed under IQtree v1.6.9 with 1,000 bootstrap replicates using the aligned DNA
Scientific Reports | (2021) 11:11560 | https://doi.org/10.1038/s41598-021-90864-6 3
Vol.:(0123456789)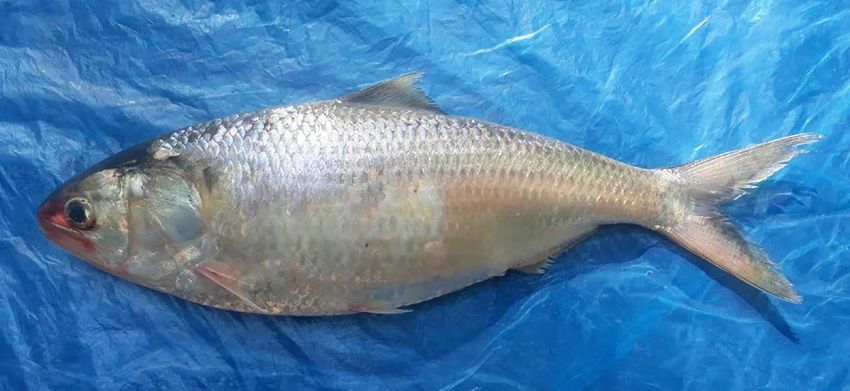
www.nature.com/scientificreports/
Figure 2. Map of sample collection sites of the highly migratory Hilsa shad across its diverse migratory
habitats including all strategic aquatic ecosystems in Bangladesh. Each color indicates specific habitat group and
abbreviated letter indicates sampling location. CM, Chilmari; BG, Balashi Ghat; CN, Chapai-Nababganj; RS,
Rajshahi; MO, Mohanganj; SS, Someshwari river, Durgapur; MG, Manikganj; BR, Bhairab; CP, Chandpur ; KN,
Khulna; PP, Pirojpur; BL, Bhola; MP, Mohipur; CF, Char Fasson; PC, Pokhkhir Char; PG, Patharghata; CB, Cox’s
Bazar; MK, Maheshkhali. The map was produced by using QGIS version-3.4.1 with GRASS 7.4.2 (https://qgis.
org/en/docs/index.html).
sequences35. FigTree.v1.4.4 was used to visualize the consequential phylogenetic tree (http://tree.bio.ed.ac.uk/
software/figtree/). Model selection and data partition were also automatically done by IQtree v1.6.9. A dendro-
gram based on the FST values was also made as implemented in the R package.
Network 5.0.1.136was used to visualize genetic clustering of the individuals of different populations by making
a median-joining network. To build the network, only 842 polymorphic sites were used. VCF2RDF converter
was used to convert SNP VCF to .rdf file for using as an input file in Network analysis.
Genetic variation analysis. SNP vcf file was converted into arlequin (.arp) file using PGDspider 2.1.1.2
with the input of population s ummary37. SNP arlequin (.arp) file was used as an input file in the analysis of
molecular variance (AMOVA), which was performed using ARLEQUIN 3.5.2 with 10,000 p ermutations38.
Scientific Reports | (2021) 11:11560 | https://doi.org/10.1038/s41598-021-90864-6 4
Vol:.(1234567890)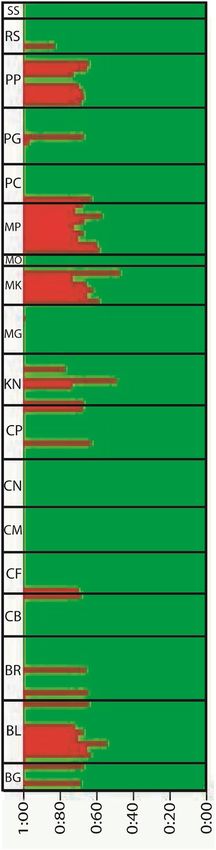
www.nature.com/scientificreports/
No Habitat Sample ID Voucher number Sampling Location Water system No. of samples Latitude Longitude Sampling time
CL1364 SOU1801035-1 to 8 Chilmari (CM) Brahmaputra River 8 25° 35′ 03.5ʺ N 89° 42′ 47.1ʺ E Sep, 2017
CL1350 SOU1801036-1to 6 Balashi Ghat (BG) Jamuna River 6 25° 23′ 32.4ʺ N 89° 42′ 24.2ʺ E Sep, 2016
Chapai-Nababganj
Western Riverine CL1348 SOU1801034-1 to 7 Upper Padma River 7 24° 36′ 23.7ʺ N 88° 08′ 52.5ʺ E Sep, 2016
1 (CN)
(Freshwater)
CL1349 SOU1801037-1 to 8 Rajshahi (RS) Upper Padma River 8 24° 21′ 25.4ʺ N 88° 32′ 33.3ʺ E Sep, 2016
SOU1801038-1
CL 1365 Manikganj (MG) Lower Padma River 10 23° 45′ 40.1ʺ N 89° 49′ 25.3ʺ E Sep, 2017
to 10
Eastern Riverine SOU1801042-1 Upper Meghna
2 CL 1363 Bhairab (BR) 10 24° 01′ 57.2ʺ N 90° 58′ 51.8ʺ E Aug,2017
(Freshwater) to 10 River
CL2317 SOU1801040-1 to 2 Mohanganj (MO) Dingapota Haor 2 24° 52′ 50.3ʺ N 91° 01′ 10.2ʺ E Aug, 2019
Haor and hill
3 Someshwari, Dur-
stream river CL2318 SOU1801041-1 Someshwari River 1 25° 06′ 31.4ʺ N 90° 39′ 47.7ʺ E Aug, 2019
gapur (SS)
SOU1801039-1 Lower Meghna
4 Middle Meghna CL2026 Chandpur (CP) 10 23° 11′ 42.7ʺ N 90° 37′ 55.5ʺ E Sep, 2018
to 10 River
SOU1801046-1 Meghna River
CL2036 Bhola (BL) 10 22° 46′ 43.7ʺ N 90° 42′ 27.0ʺE Sep, 2018
to 10 Estuary
5 Meghna Estuary
CL 1356 SOU1801044-1 to 9 Mohipur (MP) Lata Chapli River 9 21° 51′ 24.4ʺ N 90° 07′ 38.3ʺ E Sep, 2016
CL 1361 SOU1801048-1 to 8 Char Fasson (CF) Tetulia River 8 22° 11′ 12.1ʺ N 90° 33′ 15.5ʺ E Feb, 2017
Small Coastal Riv- CL 2002 SOU1801043-1 to 8 Khulna (KN) Pashur River 8 22° 19′ 05.0ʺ N 89° 37′ 04.4ʺ E Sep, 2017
6
ers (Estuary) CL 1355 SOU1801047-1 to 9 Pirojpur (PP) Kocha River 9 22° 33′ 26.7ʺ N 90° 01′ 16.3ʺ E Sep 2016
Pokhkhir Char
CL 1359 SOU1801045-1 to 7 Bay of Bengal 7 21° 43′ 40.0ʺ N 89° 47′ 38.6ʺ E Sep, 2016
(PC)
SOU1801049-1
7 Bay of Bengal CL 1357 Patharghata (PG) Bay of Bengal 10 21° 43′ 58.4ʺ N 89° 58′ 46.1ʺ E Oct, 2016
to 10
CL2042 SOU1801051-1 to 9 Cox’s Bazar (CB) Bay of Bengal 9 21° 18′ 55.6ʺ N 91° 44′ 09.4ʺ E Sep, 2018
CL 1360 SOU1801050-1 to 7 Maheshkhali (MK) Bay of Bengal 7 21° 37′ 46.8ʺ N 91° 44′ 35.2ʺ E Oct, 2016
Table 1. Sampling localities, number of samples from each site and sampling dates.
Nucleotide diversity for each population was computed by using DnaSP v6.12.0339. The SNP data of variant
call format (.vcf) was used as an input file in DnaSP. Pairwise F ST matrix40 supported by ARLEQUIN 3.5.2 was
used to calculate the genetic variation among groups, among populations within groups and within populations.
Text editor Notepad + was used to edit the project file at the time of AMOVA and F ST analysis. Deviation from
Hardy–Weinberg equilibrium for every location was calculated by ARLEQUIN. 3.5.2. Exact test used a Markov
chain (for all Loci) where forecasted chain length: 1,000,000 and Dememorization steps: 100,000.
Population clustering. Genetic partitioning of the 139 individuals was assessed using STRUCTURE
v2.3.441 based on the data containing only one SNP per locus. Initial burn was set in 50,000 replicates, followed
by 500,000 replicates for each K (number of genetic clusters) for the STRUCTURE runs. The analysis were run
for K = 1 − 18 (1 − total number of locations), each replicated three times. Best K was identified by STRUCTURE
HARVESTER 0.69342. Finally, result of STRUCTURE with best K was transferred to plot form. The Ordination
of the SNP genotypes was investigated using discriminant analysis of principal components (DAPC) was com-
puted as implemented in the ADEGENT package43 and SNP VCF files were used as an input file.
Animal research and ethics approval. Species used in this study (Hilsa shad: Tenualosa ilisha) is a food
fish in Bangladesh. No live fish was used in this study. Samples (dead fish) were taking from commercial fishing
boats or directly from fisherman at fish landing. Fish tissue sampling and protocols were approved by the ‘Ethics
Committee for the Use of Animal Subjects’ of Shanghai Ocean University.
Result
Sequencing results (NGS). Each sample produced 4,015,989 raw reads on average and then 4,000,188
filtered reads (on average) were obtained from raw reads after trimming off adapter sequences and reads with
low quality score (Q < 20). After removing the 230,829 reads (on average) of PCR duplicates, 93.87% of filtered
reads were scrutinized as unique reads (3,769,359 on average). From each sample 1,395 target loci were obtained
on average with the best one had 2,223 loci and the lowest one had 504 captured loci (Table S1). The average
number of captured loci of the out-group sample was 1,104. All loci (3,399 loci) of studied species and out-group
were checked manually. Loci with weird segments, samples from only one location or with lower than four sam-
ples were also excluded. After exclusions, 2,461 loci were kept. The deviated locus number was (average): 1,344
(28.05%) and highest deviation from Hardy–Weinberg equilibrium was 0.00053.
Phylogenetic relationships based on genome‑scale nuclear data. The maximum likelihood tree
was built using IQtree on all of the individuals of Bangladesh waters, collected from different ecosystems mixed
together. No location had any unique cluster, but some portion of phylogenetic tree had partial groupings (Fig. 3,
Scientific Reports | (2021) 11:11560 | https://doi.org/10.1038/s41598-021-90864-6 5
Vol.:(0123456789)www.nature.com/scientificreports/
Figure 3. A ML tree based on sequences data concatenating 2,461 loci reconstructed by using IQtree
v1.6.9 (http://www.iqtree.org/) with 1,000 bootstrap replicates. Each color indicates specific habitat group
and abbreviated letter indicates sampling location (Table 1). CM, Chilmari; BG, Balashi Ghat; CN, Chapai-
Nababganj; RS, Rajshahi; MO, Mohanganj; SS, Someshwari, Durgapur; MG, Manikganj; BR, Bhairab; CP,
Chandpur ; KN, Khulna; PP, Pirojpur; BL, Bhola; MP, Mohipur; CF, Char Fasson; PC, Pokhkhir Char; PG,
Patharghata; CB, Cox’s Bazar; MK, Maheshkhali.
S3). The phylogenetic tree revealed that the Hilsa shad represent a single genetic population in the Bangladesh
water and there is no significant cluster. In network of 842 SNP loci, all samples were randomly interconnected
together without any type of pattern (Fig. 4). There is no isolation based on distance, water quality, nature of the
habitat and migratory seasons. Negligible samples of same location showed inter-connections among them. That
means network result also supported the presence of single population in Bangladesh water like the assumption
depicted from maximum likelihood IQtree.
Genetic diversity and differentiation. Average nucleotide diversity (Pi) of Hilsa shad of Bangladesh
waters was 0.004632, with highest value in Chilmari (0.008811) and lowest in Balashi Ghat (0.001809) (Table 2).
Analysis of molecular variance (AMOVA) represented that percentage of variation among suspected significant
habitat groups ( i.e., Western riverine freshwater, Eastern riverine freshwater, haor and hill stream river, Mid-
dle Meghna freshwater, Meghna river estuary, small coastal rivers, the Bay of Bengal) was very low (0.99%).
Percentage of variations of among population within groups and within populations were 1.07% and 97.93%
respectively (Table 3). Pairwise F ST values of maximum locations were very poor (61% F ST value was in between
0.0009 and 0.0993, 2% F ST value was more than that value and rest showed negative value) and most of the case,
P value was not significant. Populations of fresh water rivers (Western turbid and eastern clean rivers) also had
poor FST value and non significant P value except between Manik Ganj (MG) and Chilmari (CM), which was
more than significant level (P < 0.05) (Table 4). Populations of main migratory route and alternative migratory
Scientific Reports | (2021) 11:11560 | https://doi.org/10.1038/s41598-021-90864-6 6
Vol:.(1234567890)www.nature.com/scientificreports/
Figure 4. A median joining network of studied individuals based on 842 SNP loci by Network 5.0.1.1 (https://
www.fluxus-engineering.com/sharenet_rn.htm). Each color indicates specific habitat group and abbreviated
letter indicates sampling location. CM, Chilmari; BG, Balashi Ghat; CN, Chapai-Nababganj; RS, Rajshahi;
MO, Mohanganj; SS, Someshwari, Durgapur; MG, Manikganj; BR, Bhairab; CP, Chandpur ; KN, Khulna; PP,
Pirojpur; BL, Bhola; MP, Mohipur; CF, Char Fasson; PC, Pokhkhir Char; PG, Patharghata; CB, Cox’s Bazar; MK,
Maheshkhali.
Source of variation d.f Sum of squares Variance components Percentage of variation
Among groups 6 336 0.3669 Va 0.99
Among populations within groups 11 464 0.3965 Vb 1.07
Within populations 260 9411 36.1970 Vc 97.93
Total 277 10,211 36.9604
Table 2. Results of analysis of molecular variance (AMOVA).
route had some differences. Samples of the Kocha river (PP) of alternative migratory route were different from
all of the locations of main migratory route in the downstream (i.e., CF, MP, BL and CP) based on significant P
value (P < 0.05) and samples of another alternative route location (KN) was also different from MP in the same
way. However, FST values among them were not high. The dendrogram based on the FST values also represented
same pattern (Fig. S4).
Population structure. Population of Hilsa shad belonged two groups (K = 2) was supported by Structure
analysis, dominant group (green colored group) belonged to the maximum individuals of the population and
only few individuals carrying some genes of other group (red colored group) along with dominant group genes
(Fig. 5, Fig. S2, Table S2). Samples of CM, CN, MG, MO and SS belonged to the dominant group without any
admixtured individuals whereas BG, BR, CB, CF, CP, PC, PG and RS mostly belonged to the dominant group
with few admixtured individuals. Moreover, BL, KN, MK, MP and PP had more admixtured individuals than
dominant group individuals (Fig. 5). There was no single location that had only admixtured individuals or no
one individual that only carried the genes of other small group (red colored group). DAPC result was also similar
to structure result (Fig. S1). All samples of Bangladesh water including all types of strategic ecosystems made
a single cluster that represent only one population. There was no isolation between sea, estuary and freshwater
ecosystems and no separate clusters between western and eastern freshwater rivers.
Scientific Reports | (2021) 11:11560 | https://doi.org/10.1038/s41598-021-90864-6 7
Vol.:(0123456789)www.nature.com/scientificreports/
Code Population Theta (per site) from Pi
CM Chilmari 0.008811
BG Balashi Ghat 0.001809
CN Chapai-Nababganj 0.005465
RS Rajshahi 0.002277
SS Someshwari, Durgapur 0.003821
MG Manikganj 0.003508
BR Bhairab 0.005068
CP Chandpur 0.006612
KN Khulna 0.001245
PP Pirojpur 0.004889
BL Bhola 0.005580
MP Mohipur 0.003514
CF Char Fasson 0.004328
PC Pokhkhir Char 0.004756
PG Patharghata 0.004543
CB Cox’s Bazar 0.006501
MK Maheshkhali 0.006025
Average 0.004632
Table 3. Nucleotide diversity (Pi) of each population.
BG CM CN RS BR BL CF MP CB MK PC PG KN PP MG MO SS CP
BG 0.0000
CM 0.0000 0.0000
CN 0.0179 0.0000 0.0000
RS 0.0009 0.0035 0.0000 0.0000
BR 0.0000 0.0036 0.0000 0.0000 0.0000
BL 0.0178 0.0346* 0.0446* 0.0278* 0.0104 0.0000
CF 0.0000 0.0000 0.0000 0.0000 0.0000 0.0225* 0.0000
MP 0.0620* 0.0969* 0.0993* 0.0867* 0.0581* 0.0002 0.0736* 0.0000
CB 0.0026 0.0047* 0.0000 0.0000 0.0000 0.0299* 0.0000 0.0799* 0.0000
MK 0.0549 0.0434* 0.0567* 0.0756* 0.0253* 0.0128 0.0419* 0.0179* 0.0278* 0.0000
PC 0.0000 0.0046 0.0000 0.0000 0.0000 0.0176* 0.0000 0.0742* 0.0000 0.0309 0.0000
PG 0.0000 0.0135* 0.0000 0.0000 0.0000 0.0320* 0.0000 0.0745* 0.0000 0.0262* 0.0000 0.0000
KN 0.0059 0.0235 0.0193 0.0211 0.0000 0.0027 0.0061 0.0359* 0.0162 0.0127 0.0127 0.0023 0.0000
PP 0.0257* 0.0782* 0.0588* 0.0545* 0.0350* 0.0042* 0.0457* 0.0085* 0.0409* 0.0000 0.0351* 0.0514* 0.0131 0.0000
MG 0.0111 0.0073* 0.0000 0.0000 0.0000 0.0466* 0.0000 0.1129* 0.0000 0.0704* 0.0000 0.0050 0.0359* 0.0709* 0.0000
MO 0.1123 0.0081 0.0000 0.0673 0.0025 0.0360* 0.0423 0.1164* 0.0013 0.1043* 0.0180 0.0085 0.0730 0.0624* 0.0242* 0.0000
SS 0.0572 0.0000 0.0000 0.0530 0.0000 0.0000 0.0000 0.0538 0.0000 0.0865 0.0000 0.0000 0.0281 0.0162 0.0000 0.0000 0.0000
CP 0.0000 0.0000 0.0000 0.0000 0.0000 0.0106* 0.0000 0.0643* 0.0000 0.0344* 0.0000 0.0000 0.0004 0.0427* 0.0000 0.0254 0.0000 0.0000
Table 4. Pairwise differences (FST) among populations. For abbreviations of population names, see Table 1,
*Indicates significant P values (P < 0.05).
Discussion
Present results showed that Hilsa shad had low nucleotide diversity (0.001809–0.008811) like most of the Clu-
peiforms, e.g., Elongate ilisha (0.001–0.010), Tapertail anchovy (0.0011–0.0029) in Yangtze river and Japanese
anchovy (0.0014–0.0090)44–46. Sea fish population had higher genetic diversity than anadromous population
within same species or among same g roup47. Although, Hilsa and Kelee shad belonged to the same subfamily
Dorosomantinae but Hilsa shad is anadromous in nature and Kelee shad is exclusively m arine48. Because of this
habit, nucleotide diversity of Hilsa shad was lower than Kelee shad (Hilsa kelee) (0.010337–0.014690)49. Cor-
respondingly, marine Pacific herring (0.020)50 also had higher nucleotide diversity than Hilsa shad. There were
several researchers also reported low nucleotide diversity of Hilsa shad population in the Hoogli, the Ganges
and the Brahmaputra river of I ndia10,17,18. Low genetic diversity suggested that only small portion of the total
population had the scope of successful spawning. That might be associated with their long anadromous breed-
ing migration journey. At that time huge numbers of individuals were caught in their long migratory routes by
Scientific Reports | (2021) 11:11560 | https://doi.org/10.1038/s41598-021-90864-6 8
Vol:.(1234567890)www.nature.com/scientificreports/
Figure 5. Structure analysis based on 842 SNP loci. CM, Chilmari; BG, Balashi Ghat; CN, Chapai-Nababganj;
RS, Rajshahi; MO, Mohanganj; SS, Someshwari, Durgapur; MG, Manikganj; BR, Bhairab; CP, Chandpur ; KN,
Khulna; PP, Pirojpur; BL, Bhola; MP, Mohipur; CF, Char Fasson; PC, Pokhkhir Char; PG, Patharghata; CB, Cox’s
Bazar; MK, Maheshkhali.
Scientific Reports | (2021) 11:11560 | https://doi.org/10.1038/s41598-021-90864-6 9
Vol.:(0123456789)www.nature.com/scientificreports/
the fishermen. Frequent changing of spawning pattern is another reason of unsuccessful spawning51. Therefore,
Government of Bangladesh should place some safety and protection actions including, public conscious, restric-
tion on fishing gear, Hilsa fisheries management activities and proper timing of the fishing ban period.
Previous studies on genetic population structure of T. ilisha were mostly based on allozymes, allele frequen-
cies, microsatellite DNA markers and mitochondrial DNA regions: Cytochrome b (CytB), ATPase 6&8 (ATPase),
12 s and 16 s r RNA10,15–18. However, genomic data is more powerful marker than previous markers to present
the history, evolution, population status and phylogeny of a fish. Recently, A study discover the population
genomics and structure of Hilsa shad in Bangladesh waters based on genomic data at NGS platform by NextRAD
sequencing, however they mistakenly assigned samples collected from the confluent of the Meghna River as the
north-eastern riverine g roup19,20. Our study was also based on genomic data at the NGS platform. Conversely, we
collected sequence data of 4434 nuclear genes applying a cross-species gene enrichment m ethod22, to examine
the genetic diversity and population status of hilsa shad from the Bay of Bengal, its estuaries and all possible lotic
and lentic waters and two migratory cohorts.. This study provided a solid estimation of the population status of
Hilsa shad using genome-wide data and to infer its genetic diversity.
Result of the maximum likelihood IQtree and the population structure suggested that the fresh, estuarine
and marine water of Bangladesh have a single population of Hilsa shad. In-addition DAPC, dendrogram and
network on SNP loci analysis also represented the same trend. In the phylogenetic tree, samples of all locations
were mixed together without making any specific cluster. In the population structure analysis, a single popula-
tion was present with some admixtured individuals bearing small portion of genes from other group. Pairwise
FST value between most locations were poor with non-significant P value (P > 0.05), that support the deprived
local population differences and homogeneity of this fish population throughout our studied locations. The hilsa
shad population in Bangladesh might retrieve from a collapsed population. Once upon a time (upto first half of
1990s), this fish was most available and cheap fish in Bangladesh. Because of overexploitation and lack of proper
management, the fish population was collapsed more than one decade. After that period, because of fishing ban
period and public consciousness (first imposed in 2011), the population started to increase. Hilsa fish production
in Bangladesh has doubled in a decade from 2006–2007 (279,189 MT) to 2017–2018 (517,189 MT)4,64. This fact
probably caused low genetic diversity and divergence among populations of hilsa shad in the Bangladesh waters.
Bangladesh has diversified fresh water habitats for Hilsa shad migration including main river system, coastal
and freshwater small rivers, hill stream rivers, haors etc. but anadromous migration of this shad starts from same
marine water body, the Bay of Bengal, which is their living ground. Furthermore, this fish has highly migra-
tory nature among marine, estuarine and fresh water bodies. Therefore, it is difficult to draw a conclusion that
there is more than one population in this water system. Low variation among groups and among population
within groups also did not support more than one population. F ST value between most of the locations was poor
with non-significant P value, which suggested that the population differences were not significant. Although in
some cases, P value was significant but due to their poor F ST value that did not provide strong support of local
population differences. Here present findings of this study were supported by the findings of some previous
researchers who represented the single gene pool or stock of this species in the Bay of Bengal with a substantial
gene flow18,52,53.
All of the spawning grounds of Hilsa shad were identified in the coastal areas of Bangladesh especially at the
lower stretches of the Meghna, the Tetulia, the Ander Manik and the Shahabazpur River e.g., Hatia (Moulavir
char) Sandwip (Kalir char) and Bhola (Dhal char and Monpura)6,21. However, migratory plan is mainly initi-
ated during the spawning season, which is activated with follow of fresh water runoff from the inland rivers,
and naturally it occurs with the commencement of the south-west monsoon and consequent flooding of all the
major rivers draining down to the upper Bay of Bengal and there are no considerable differences in any context.
Isolation of spawning ground is an important factor for population d ifferentiation11. Due to presence of un-
alienated spawning grounds, it is less feasible to draw population differences of Hilsa shad in the upper streams
of different rivers and in their living ground, Bay of Bengal. Therefore, the unique spawning grounds and sole
major migratory down-stream route strengthen the presence of single population in all over the Bangladesh
water without any significant population clusters. Without specify exact spawning grounds for every cluster, it
is unrealistic to draw several clusters in this population.
Hilsa population studies in Indian part across the Hoogli, the Bhagirathi, the Ganges and the Brahmaputra
Rivers also suggested single and genetically homogeneous population in Indian part10,17,18. Hilsa shad popula-
tion of the Hoogli-Bhagirathi river system and Hilsa stock of Bangladesh water used same natal habitat, Bay of
Bengal. Moreover, the River Ganges is the upstream of the Padma River (Bangladesh) and the Bhagirathi River
(India) as well as the Brahmaputra is the upstream of the Jamuna River (Bangladesh). Most of the Hilsa shad of
River Ganges comes from the Padma River and as the same way the Brahmaputra river has no other significant
source of this fish except the Jamuna River. So genetic homogeneity and unique population across these rivers
of Indian part also supported the Hilsa shad’s single population in the Bangladesh water.
Nevertheless, Rahman and Naevdal (2000) based on allozymes and muscle proteins as well as Mazumder and
Alam (2009) based on mitochondrial D-loop region figured out more than one Hilsa population in Bangladesh
waters15,54. Rahman and Naevdal (2000) mentioned two populations: 1. Marine and 2. Estuary and fresh water
but they processed without explaining how this highly migratory species was separated into two distinct cohorts.
Mazumder and Alam (2009) divided the population into two clusters like previous study but poor pairwise F ST
value between two groups showed that there were no differences between fresh water and marine-estuarine
locations. Recently Asaduzzaman et al. (2020) reported three clusters in the Hilsa population in Bangladesh
waters, first one was in marine and estuarine waters and another two belonged to north–western riverine (turbid
freshwater) and north-eastern riverine (clear freshwater) ecotypes20. Existing of a single population, the most
likely assumption from the present research varied with their findings. Our result suggested that as a highly
migratory species, Hilsa shad is incapable to belong to more than one population when sampled at different
Scientific Reports | (2021) 11:11560 | https://doi.org/10.1038/s41598-021-90864-6 10
Vol:.(1234567890)www.nature.com/scientificreports/
sections of their migration route. Our postulation is the presence of single cluster in the Bangladesh water because
all water bodies are almost connected to each other, raising high rate of gene flow and created large population
size. Western and eastern river systems of Bangladesh have immaterial dissimilar water quality (e.g., turbidity)
but this is not enough to make population differences of Hilsa shad since they migrate and start their life from
same spawning grounds and used almost same route across the lower stream and coastal estuaries during their
breeding migration. Asaduzzaman et al. (2020) reported that samples of the Meghna river (MR) was included in
the north-eastern riverine (clear freshwater) ecotypes by DAPC and neighbor-joining tree a nalysis20. However,
their sample collection site (MR) was located in the common migratory route for north–western riverine (turbid
freshwater) and north-eastern riverine (clear freshwater) ecotypes. Therefore, this site should be representing
the samples of both ecotypes rather than specific one.
If we draw several specific populations or clusters in the upper streams of Bangladesh that means we had the
scope to find this shad in the freshwater all over the year round. However, in the freshwater of Bangladesh, this
fish was available in the summer (June–October) and winter season (January-March) only; these were related
to their summer and winter migration respectably55. If one or two groups of this fish, continue their complete
lifecycle in the freshwater (Western/Eastern part of Bangladesh) that states the assurance of continuous supply
of this fish almost year round. However, the original scenario does not support this hypothesis. Finally we can
conclude that, only one population of this fish inhabit in the Bangladesh waters without any instance of different
populations and clusters (2–4) but in some specific locations, they had some particular characteristics. The Bay
of Bengal is their main living ground, at the time of their breeding they come to the freshwater upper streams,
spawn in the estuaries and finally return to the sea. Therefore, using all the same ecosystems (sea, estuary and
freshwater rivers) in a cyclic fashion is essential to support their life cycle, which certainly pushes all the indi-
viduals to belong a unique population.
In the population structure analysis, only one population of Hilsa shad was identified with some admixtured
individuals (32%) containing partial genes from other population in the water bodies of Bangladesh. The men-
tioned other population might not represent the Hilsa population of the Hoogly and Bhagirathi river system,
India because, the Hilsa shads of both migratory routes of Bangladesh and India showed genetic h omogeneity10,17.
The Ganges and Brahmaputra rivers of Indian part are the upstream of the Padma and the Jamuna river of
Bangladesh and might be belonged to the same population. However, Hilsa population of the Arabian Sea was
genetically heterogeneous from the Bay of Bengal18 and those different population genes of admixtured individu-
als might come from the Arabian Sea by oceanographic dispersion. Once (almost 18,000 years ago) the Arabian
Sea had a close connection with the Bay of Bengal through the Laccadive Sea, the Gulf of Mannar and the Palk
Bay. Therefore, this likely was an easy way for oceanographic dispersion of Hilsa shad between these two water
bodies. After that period, a bridge of limestone shoals, coral reefs and tombolo called as ‘Ram Bridge’ or ‘Adam’s
Bridge’ (about 48 km) originated between Pamban Island off the south-eastern coast of Tamil Nadu, India,
and Mannar Island, off the north-western coast of Sri Lanka 56,57. Sarker et al. (2020) also mentioned that type
of oceanographic dispersion between these two water bodies for another Clupeid fish species, Hilsa kelee49. The
Irrawaddy, the Naaf and the Sittang River of Myanmar were also regarded as another important route for Hilsa
migration6,58. There is also a possibility of inflowing of these different genes of other population from such popu-
lation. Still there is no population structure study was conducted in the Myanmar part. Therefore, there is no
scope to compare those admixtured individuals with the Hilsa population of Myanmar. However, for completing
the full scenario, the Hilsa population of Myanmar also claims research attention in population genomics field.
In the present study, Samples of both migration cohorts (summer and winter) were studied. The maximum
likelihood IQ tree, population structure and DAPC suggested that samples of both migration cohorts were
homogenous. Similarly, Jhingran and Natarajan (1969) and Ramakrishnaiah (1972) also did not find any sig-
nificant temporal population differences in their previous s tudies59,60. Dwivedi (2019) found morphometric
variations between seasonal migrants of Hilsa shad from Hooghly estuary, India using geometric morphometrics
(GM) data61. They explained that these morphotypes might be related to the food availability and temperature
fluctuation of summer and winter season but they did not incorporate that to the genetic level of the population.
Quddus et al. (1984) reported two seasonal migratory populations of Hilsa shad in Bangladesh water based on
spawning, fecundity and sex ratio8. Based on our findings and previous studies we can conclude these mentioned
seasonal cohorts might be associated with their food availability and breeding rather than genome level.
Hill stream river and haor were two important and unique ecosystems for fish diversity in Bangladesh, they
belong to the unique characteristics in the ecological factors as well as fish diversity62,63. Infrequently Hilsa shad
use these two water bodies as their migratory routes. Samples were collected from the Shomeswari River and the
Dingapota Haor, Mohanganj as the representatives of hill stream river and haor population respectively. However,
Hilsa shad of these two exclusive water bodies were similar to the samples of the some other fresh water bodies
(i.e., CM, CN and MG) as they were belonging to the Hilsa population without any admixtured individuals.
Samples of SS do not have any significant P value with other locations whereas MO samples had significant P
value with five other locations but having poor FST value with three locations (i.e., BL, PP, MG). MO samples had
only mentionable F ST value with MP (estuarine) and MK (marine), which might be the result of differences in
water quality of these two water bodies. In DAPC, phylogenetic tree and in network, the samples of hill stream
river and haor failed to make any unique cluster or monophyletic clade that represent they are also the part of
single unique Hilsa population of Bangladesh waters.
Main migration was occurred through the Meghna river estuary, which is connected to the Padma, Meghna
and Jamuna river system. However, there are some other alternative routes through some small coastal rivers
e.g., the Pashur, the Bishkhali, the Balaswar, the Kocha river, which are connected to the Padma river through the
Modhumati and the Gorai river. These coastal rivers passed through or beside the world largest mangrove forest
Sundarban. Thus, these two routes are ecologically different from each other. Samples of these two routes have
some genetic differences, because most of the locations (MK, CF and BL with PP and KN) of these two estuarine
Scientific Reports | (2021) 11:11560 | https://doi.org/10.1038/s41598-021-90864-6 11
Vol.:(0123456789)www.nature.com/scientificreports/
routes had significant P value, but their FST value was not satisfactorily high to make population differences.
Ecological differences of these two routes might be played an important role to create this type of slight differ-
ences among them. Therefore, these scenarios were not significant enough to describe noteworthy differences
in the population level, but may make a sign of upcoming population differences.
Conclusion
In conclusion, the Hilsa shad collected from diverse habitats of Bangladesh belonged to the same population
without mentionable more clusters. Although, recently Hilsa shad supply in Bangladesh is almost satisfactory
but genetic diversity of this fish was very poor. Because of breeding failure of large group in the breeding migra-
tion and changing spawning pattern, the fish might experience a genetic bottleneck currently. This scenario is
not a good sign for the survival of this population. Bangladesh, India and Myanmar already took some fisheries
management strategy that may increase their number but failed to increase the genetic variation. Therefore, all
three coastal countries of the Bay of Bengal should take a joint plan for the fisheries management and conserva-
tion of this fish species.
Data availability
Gene-capture data with adapters and low-quality reads were deposited in NCBI (PRJNA643346).
Received: 8 December 2020; Accepted: 18 May 2021
References
1. Ahsan, D. A., Naser, M. N., Bhaumik, U., Hazra, S. & Bhattachacharya, S. B. Migration, spawning patterns and conservation of Hilsa
shad in Bangladesh and India 95 (Academic Foundation, New Delhi, 2014).
2. Rahman, M. J., Wahab, M. A., Amin, S. M. N., Nahiduzzaman, M. & Romano, N. Catch trend and stock assessment of Hilsa Tenu-
alosa ilisha using digital image measured length-frequency data. Mar. Coast Fish. 10, 386–401 (2018).
3. Roberd, A. A., Taha, H., Metali, F., Ahmad, N. & Arai, T. Validation of occurrence of tropical shads, Tenualosa ilisha (Hamilton
1822 and T.toli (Valenciennes, 1847) (Teleostei, Clupeidae), in Malaysian waters. Check List. 15(1), 65–69 (2019).
4. Department of Fisheries Yearbook of fisheries statistics of Bangladesh 2017–2018. Ministry of Fisheries and Livestock and Depart-
ment of Fisheries, Dhaka, Bangladesh (2018).
5. Hossain, M. M. & Chowdhury, R. M. Hydro-morphological study for rehabilitation of old Madhumati River using mathematical
model. I J. Eng. Sci. 3(1), 1–12 (2012).
6. Hossain, M. A. R. et al. A biology and fisheries of Hilsa shad in Bay of Bengal. Sci. Total Environ. https://doi.org/10.1016/j.scito
tenv.2018.10.034 (2019).
7. Benshila, R. et al. The upper Bay of Bengal salinity structure in high resolution model. Ocean Mod. 74, 36–52. https://doi.org/10.
1016/j.ocemod.2013.12.001 (2014).
8. Quddus, M. M. A., Shimizu, M. & Nose, Y. Spawning and fecundity of two types of Hilsa ilisha in Bangladesh waters. Bull. Japan
Soc. Sci. Fish. 50(2), 177–181 (1984).
9. Bhaumik, U. Migration of Hilsa shad in the IndoPacific region: a review. J. Curr. Res. Acad. Rev. 3, 139–155 (2015).
10. Mohindra, V. et al. Genetic population structure of a highly migratory Hilsa Shad, Tenualosa ilisha, in three river systems, inferred
from four mitochondrial genes analysis. Environ. Biol. Fish. 102, 939–954. https://doi.org/10.1007/s10641-019-00881-8 (2019).
11. Alvarado, J. R. et al. Hierarchical analyses of genetic variation of samples from breeding and feeding grounds confirm the genetic
partitioning of northwest Atlantic and South Atlantic populations of swordfish (Xiphias gladius L.).. Environ. Biol. Fish. 327(2),
167–182 (2005).
12. Asaduzzaman, M. et al. Population genomics of an anadromous Hilsa shad Tenualosa ilisha species across its diverse migratory
habitats: discrimination by fine-scale local adaptation. Genes 11, 46. https://doi.org/10.3390/genes11010046 (2020).
13. Yang, T. Y., Gao, T. X., Meng, W. & Jiang, Y. L. Genome-wide population structure and genetic diversity of Japanese Whiting Sillago
japonica inferred from genotyping-by-sequencing (GBS): implications for fisheries management. Fish. Res. 225, 105501. https://
doi.org/10.1016/j.fishres.2020.105501 (2020).
14. Madduppa, H. H., Timm, J. & Kochzius, M. Reduced genetic diversity in Clown Anemonefish Amphiprion ocellaris in exploited
reefs of Spermonde Archeopelago, Indonesia. Front. Mar. Sci. 5, 80. https://doi.org/10.3389/fmars.2018.00080 (2018).
15. Rahman, M. & Naevdal, G. Population genetic studies of hilsa shad, Tenualosa ilisha (Hamilton), in Bangladesh waters: evidence
for the existence of separate gene pools. Fish. Manag. Ecol. 7, 401–411. https://doi.org/10.1046/j.1365-2400.2000.00211.x (2000).
16. Ahmed, A. S. I., Islam, M. S., Azam, M. S., Khan, M. M. R. & Alam, M. S. RFLP analysis of the mtDNA D-loop region in Hilsha
shad (Tenualosa ilisha) population from Bangladesh. Ind. J. Fish. 51, 25–31. https://doi.org/10.1111/j.1439-0426.2004.00588.x
(2004).
17. Brahmane, M. P., Kundu, S. N., Das, M. K. & Sharma, A. P. Low genetic diversity and absence of population differentiation of
hilsha (Tenualosa ilisha) revealed by mitochondrial DNA cytochrome b region in Ganga and Hooghly rivers. Afr. J. Biotech. 12(22),
3383–3389. https://doi.org/10.5897/AJB2013.12364 (2013).
18. Behera, B. K. et al. Population genetic structure of Indian shad, Tenualosa ilisha inferred from variation in mitochondrial DNA
sequences. J. Environ. Bio. 36(5), 1193–1197 (2015).
19. Asaduzzaman, M. et al. Fine-scale population structure and ecotypes of anadromous Hilsa shad (Tenualosa ilisha) across complex
aquatic ecosystems revealed by NextRAD genotyping. Sci. Rep. 9(16050), 1–14. https://d oi.o
rg/1 0.1 038/s 41598-0 19-5 2465-2 (2019).
20. Asaduzzaman, M. et al. Population genomics of an anadromous Hilsa shad Tenualosa ilisha species across its diverse migratory
habitats: discrimination by fine-scale local adaptation. Genes 11, 46. https://doi.org/10.3390/genes11010046 (2020).
21. Miah, M. S., Rahman, M. A. & Halder, G. C. Analytical approach to the spawning ground of Hilsa Tenualosa ilisha (Ham.) in
Bangladesh water. Ind. J. Anim. Sci. 69(2), 141–144 (1999).
22. Li, C., Hofireiter, M., Straube, N., Corrigan, S. & Naylor, G. J. Capturing protein-coding genes across highly divergent species.
Biotechnical 54(6), 321–326. https://doi.org/10.2144/000114039 (2013).
23. Rahman, A. S. M. S., Begum, M. H., Reza, H. A., Ahsan, M. N. & Ahmed, M. S. Molecular characterization of hilsa shads in
Bangladesh using Cytochrome C oxidase subunit 1 (CO1) gene. I J. Fauna Bio. Stud. 5(3), 1–5 (2018).
24. Dwivedi, A. K. Differentiating three Indian shades by applying shape analysis from digital images. J. Fish. Biol. 3, 1–11 (2019).
25. Meyer, M. & Kircher, M. Illumina sequencing library preparation for highly multiplexed target capture and sequencing. Cold
Spring Harbor Prot. https://doi.org/10.1101/pdb.prot5448 (2010).
26. Yuan, H., Atta, C., Tornabene, L. & Li, C. Assexon: assembling exon using gene capture data. Evol. Bioinform. 15, 1–13. https://
doi.org/10.1177/1176934319874792 (2019).
Scientific Reports | (2021) 11:11560 | https://doi.org/10.1038/s41598-021-90864-6 12
Vol:.(1234567890)www.nature.com/scientificreports/
27. Stajich, J. E. et al. The bioperl toolkit: perl modules for the life sciences. Gen Res. 12, 1611–1618. https://doi.org/10.1101/gr.361602
(2002).
28. Edgar, R. C. Search and clustering orders of magnitude faster than BLAST. Bioinform 26, 2460–2461. https://d oi.o
rg/1 0.1 093/b
ioin
formatics/btq461 (2010).
29. Simpson, J. T. & Durbin, R. Efficient de novo assembly of large genomes using compressed data structures. Gen. Res. 22(2), 549–556.
https://doi.org/10.1101/gr.126953.111 (2012).
30. Slater, G. S. & Birney, E. Automated generation of heuristics for biological sequence comparison. BMC Bioinform. 6, 31. https://
doi.org/10.1186/1471-2105-6-31 (2005).
31. Katoh, K. & Standley, D. M. MAFFT multiple sequence alignment software version 7: improvements in performance and usability.
Mol. Biol. Evol. 30, 772–780. https://doi.org/10.1093/molbev/mst010 (2013).
32. Li, H. & Durbin, R. Fast and accurate long-read alignment with Burrows-Wheeler transform. Bioinform. 25, 1754–1760. https://
doi.org/10.1093/bioinformatics/btp698 (2009).
33. Mckenna, A. et al. The genome analysis toolkit: a MapReduce framework for analyzing next-generation DNA sequencing data.
Gen. Res. 20, 1297–1303. https://doi.org/10.1101/gr.107524.110 (2010).
34. De Pristo, M. A. et al. A framework for variation discovery and genotyping using next generation DNA sequencing data. Nat. Gen.
43, 491–498 (2011).
35. Nguyen, L. T., Schmidt, H. A., Haeseler, V. A. & Mingh, B. Q. IQ-Tree: a fast and effective stochastic algorithm for estimating
maximum likelihood phylogenies. Mol. Biol. 32, 268–274. https://doi.org/10.1093/molbev/msu300 (2015).
36. Bandelt, H. J., Forster, P. & Rohl, A. Median-joining networks for inferring intraspecific phylogenies. Mol. Biol. Evol. 16, 37–48
(1999).
37. Lischer, H. E. & Excoffier, L. PGDSpider: an automated data conversion tool for connecting population genetics and genomics
programs. Bioinform. 28, 298–299. https://doi.org/10.1093/bioinformatics/btr642 (2012).
38. Excoffier, L., Laval, G. & Schneider, S. Arlequin (version 3.0): an integrated software package for population genetics data analysis.
Evol. Bioinform. Only 1, 47–50. https://doi.org/10.1177/117693430500100003 (2005).
39. Rozas, J. et al. DnaSP 6: DNA sequence polymorphism analysis of large data sets. Mol. Biol. Evol. 34(12), 3299–3302. https://doi.
org/10.1093/molbev/msx248 (2017).
40. Weir, B. S. & Cockerham, C. C. Estimating F-statistics for the analysis of population structure. Evoluation 38, 1358–1370. https://
doi.org/10.1111/j.1558-5646.1984.tb05657.x (1984).
41. Pritchard, J. K., Stephens, M. & Donnelly, P. Inference of population structure using multi-locus genotype data. Genetics 155,
945–959. https://doi.org/10.1111/j.1471-8286.2007.01758.x (2000).
42. Earl, D. A. & Von Holdt, B. M. Structure harvester: a website and program for visualizing structureoutput and implementing the
Evanno method. Conserv. Gen. Resour. 4, 359–361. https://doi.org/10.1007/s12686-011-9548-7 (2012).
43. Jombart, T. et al. Exploratory analysis of genetic and genomic data. Retrieved from http://adegent.r-project.org/ (2015)
44. Wang, Q., Zhang, J., Matsumoto, H., Kim, J. & Li, C. Population structure of elongate ilisha Ilisha elongata along the Northwestern
Pacific Coast revealed by mitochondrial control region sequences. Fish. Sci. 82, 771–785. https://d oi.o
rg/1 0.1 007/s 12562-0 16-1 018-
4 (2016).
45. Cheng, F., Wang, Q., Delser, P. M. & Li, C. Multiple freshwater invasions of the tapertail anchovy (Clupeiformes: Engraulidae) of
the Yangtze River. Ecol. Evol. https://doi.org/10.5061/dyrad.2j5b4 (2019).
46. Zheng, W., Zou, L. & Han, Z. Genetic analysis of the populations of Japanese anchovy Engraulis japonicus from the Yellow Sea and
East China Sea based on mitochondrial cytochrome b sequence. Biol. Chem. Syst. Ecol. 58, 169–177. https://doi.org/10.1016/j.bse.
2014.12.007 (2015).
47. Tonteri, A., Veselov, A. J., Titov, S., Lumme, J. & Primmer, C. R. The effect of migratory behavior on genetic diversity and popula-
tion divergence: a comparison of freshwater and anadromous Atlantic salmon (Salmo salar). Fish. Biol. 70, 381–398. https://doi.
org/10.1111/j.1095-8649.2007.01519.x (2007).
48. Egan, J. P. et al. Phylogenetic analysis of trophic niche evolution reveals a latitudinal herbivory gradient in Clupeoidei (herrings,
anchovies, and allies). Mol. Phys. Evol. 124, 151–161. https://doi.org/10.1016/j.ympev.2018.03.011 (2018).
49. Sarker, A. et al. Genetic diversity of Hilsa kelee collected from the Bay of Bengal and the Arabian Sea. Mar. Biodivers. 50, 94. https://
doi.org/10.1007/s12526-020-01114-3 (2020).
50. Liu, J. X. et al. Effects of Pleistocene climatic fluctuations on the phylogeographic and demographic histories of Pacific herring
(Clupeapallashi). Mol. Ecol. 20, 3879–3893. https://doi.org/10.1111/j.1365-294X.2011.05213.x (2011).
51. Miah, M. S. Climatic and anthropogenic factors changing spawning pattern and production zone of Hilsa fishery in the Bay of
Bengal. Weat Clin. Extrem. 7, 109–115. https://doi.org/10.1016/j.wace.2015.01.001 (2015).
52. Milton, D. A. & Chenery, S. R. Can otolith chemistry detect the population structre of the shad Hilsa, Tenualosa ilisha? Comparison
with the results of genetic and morphological studies. Mar. Ecol. Prog. Ser. 222, 239–251. https://doi.org/10.3354/meps222239
(2001).
53. Salini, J. P., Milton, D. A., Rahman, M. J. & Hussain, M. G. Allozyme and morphological variation throughout the geographic
range of the tropical shad, hilsa Tenualosa ilisha. Fish. Res. 66, 53–69. https://doi.org/10.1016/S0165-7836(03)00124-3 (2004).
54. Mazumder, S. K. & Alam, M. S. High levels of genetic variability and differenciation in hilsa shad, Tenualosa ilisha (Clupeidae,
Clupeiformes) populations revealed by PCR-RFLP analysis of the mitochondrial DNA D-loop region. Gene Mol. Biol. 32(1),
190–196. https://doi.org/10.1590/S1415-47572009005000023 (2009).
55. Haroon, A. K. & Hilsa, Y. Shad: fish for the teeming millions new management alternatives are needed for the hilsa young. Shad
J. 3, 7–10. https://doi.org/10.1111/faf.12278 (1998).
56. Geological Survey of India Rameswaram Project. Ministry of Earth Sciences, Government of India. (2003).
57. Weerakkody, U. Potential impact of accelerated sea level rise on beaches of Sri Lanka. J. Coast Res. 24, 225–242. https://doi.org/
10.1007/s11852-009-0084-5 (1997).
58. Bhaumik, U. Stock profile of Hilsa Shad population in Bay of Bengal Region: a review. Int. J. Curr. Res. Acad. Rev. 4(6), 22–38
(2016).
59. Jhingran, V. G. & Natarajan, A. V. A study of the fisheries and fish populations of the Chilka Lake during the period 1957–65. J.
Ind. Fish. Soc. 1, 49–126 (1969).
60. Ramakrishnaiah, M. Biology of Hilsa ilisha (Hamilton) from the Chilka lake with an account on its racial status. Ind. J. Fish. 19,
35–53 (1972).
61. Dwivedi, A. K. Morphometric variations between seasonal migrants of anadromous shad Tenualosa ilsha (Hamilton, 1822) from
Hooghly Estuary, India. Mar. Fresh Res. 70, 1427–1435 (2019).
62. Chakraborty, B. K. & Mirza, M. J. A. Status of aquatic resources in Someswari River in northern Bangladesh. Asia Fish. Sci. 23,
174–193 (2010).
63. Chowdhury, N. K. et al. Present status of fish biodiversity in wetlands of Tahirpur Upazila under Sunamganj district in Bangladesh.
Int. J. Fish. Aqua. 6(2), 641–645 (2018).
64. Department of Fisheries Yearbook of fisheries statistics of Bangladesh 2006–07. Ministry of Fisheries and Livestock and Department
of Fisheries, Dhaka, Bangladesh (2007).
Scientific Reports | (2021) 11:11560 | https://doi.org/10.1038/s41598-021-90864-6 13
Vol.:(0123456789)You can also read