Multi-modal presentation of medical histories - University of ...
←
→
Page content transcription
If your browser does not render page correctly, please read the page content below
Multi-modal presentation of medical histories
                                                       Catalina Hallett
                                                     The Open University
                                                Walton Hall, Milton Keynes, UK
                                                     c.hallett@open.ac.uk

ABSTRACT                                                               reports with visual navigation tools that allow time-efficient
This paper describes a visualisation architecture that inte-           access to particular events or sets of events in a patient’s
grates graphical devices and natural language in a coopera-            medical history.
tive system for navigating through complex images of med-
ical histories. We show how the addition of automatically              In presenting medical histories we are trying to circumvent
generated natural language can be used to improve the us-              the shortcomings of textual reports by combining them with
ability of a graphical user interface and conversely how the           visual navigation tools. In this way, we take advantage of the
graphical user interface can be used to specify the content of         better accesibility and interactivity offered by visual time-
user customizable medical reports.                                     lines as well as of the ability of natural language to convey
                                                                       complex temporal information and to aggregate numerical
Author Keywords                                                        data.
Natural Language Generation, electronic patient records, nav-
igation tool, visualisation                                            APPLICATION
                                                                       Input
INTRODUCTION
                                                                       A CLEF chronicle [3, 4] is a rich semantic network that log-
Records of cancer patients are very rich: in addition to a             ically and temporally organises events in a patient’s medical
thousand or more numeric data points arising from succes-              history. The chronicle models what happened to the patient,
sive laboratory tests and a chronology of five or six hundred          why and how. The chronicle is backed by a logical model
significant events — such as the dates tests were requested or         of a cancer history and a series of description logic based
performed, clinics attended or drugs dispensed — our typi-             ontologies which act as knowledge sources for the domain
cal patient files will also contain between fifty and a hundred        of cancer. As an example, a chronicle can encode the fol-
and fifty narrative clinic letters, together with a similar num-       lowing history (italicised text represents events, the type of
ber of reports interpreting a variety of investigations (e.g.,         event follows in brackets): a patient presents to the clinic
Xray, body scan, radioscintography etc.).                              with pain in the right breast (Problem). A clinical exam-
                                                                       ination (Investigation) is performed which suggests cancer
One of the aims of the Clinical e-Science Framework (CLEF)             (Problem). As a result, a biopsy (Investigation) is recom-
project [1], under which the research reported here is being           mended, which returns a histhology diagnosis of invasive
conducted, is to establish a technical infrastructure for man-         ductal adenocarcinoma (Problem). The patient is treated for
aging research repositories of aggregated patient data arising         cancer with radiotherapy (Treatment), which causes an ul-
from routine medical care across potential multiple sites and          ceration in the right breast (Problem) which is treated with
institutions, in support of biomedical research. Information           medication (Treatment) over several weeks. This simplified
is extracted from medical narratives 1 and aggregated with             scenario displays several events which occur at various mo-
structured data in order to build complex images of a pa-              ments in time and are linked through semantic relations such
tient’s medical history which model the story of how patient           as causality, reason, finding and consequence. In practice,
illnesses and treatments unfolded through time: what hap-              each individual event will consist of much more detail. For
pened, when, what was done, when it was done and why. The              example, a diagnosis of cancer will include the size of the tu-
resulting complex semantic network, termed chronicle, al-              mour, the staging, whether the tumour is hormone receptive
lows the construction of targeted summarized reports which             or not, genetic information. Similar clusters of events may
do more than present individual events in a medical history:           happen several times during a patient’s history and seman-
they present, in coherent text, events that are semantically           tic links may exist between events situated at some temporal
and temporally linked to each other.                                   distance. Whilst it is clear that such views of medical histo-
                                                                       ries present a much richer source of information than tradi-
This paper discusses the problem of presenting the informa-
                                                                       tional log-like patient records (that record events but no de-
tion held in chronicles back to the users (medical practiton-
                                                                       pendencies) it is also clear that retrieving information from
ers) in a format that could benefit clinical care and medical
                                                                       chronicles will require different visualisation techniques. It
research. Of particular interest to us here is the problem of
                                                                       is beyond the scope of this paper to describe the method-
integrating generated targetted and comprehensible textual
                                                                       ology involved in transforming an EPR into a chronicle -
1
    Using Natural Language Processing techniques, see [2].             the chronicalisation process is complex and involves Infor-

                                                                   1
mation Extraction from narratives, solving multi-document             Following the user requirements and the type of input we
coreference, temporal abstraction and inferencing over both           were dealing with, it became clear that we were faced with
structured and information extraction data [2].                       two relatively distinct tasks: providing navigational capabili-
                                                                      ties to an Electronic Patient Record and generating short tex-
User requirements                                                     tual summaries describing snapshots of the patient’s medical
The intended end-user of the generated reports is a general           history.
practitioner or clinician who uses electronic patient records
at the point of care to familiarise themselves with a patient’s       Textual reports have the advantage of offering a snaphsot
medical history and current situation. They are familiar with         view of a patient’s history at any point in time, they can
finding information in text documents but have little or no           be used for checking the consistency of a patient’s record,
exposure to graphical interfaces to Electronic Patient Records.       can be ammended and printed, used in communication be-
Since this is a novel application we did not have the possi-          tween clinicians or clinicians and patients. Text is a good
bility of observing modalities of interaction with the input          way of describing temporal information (events that hap-
data. An initial requirements elicitation process resulted in a       pened at a certain position in time with respect to another
set of general requirements which are summarised below:               event), of summarising numerical data (for example, spec-
                                                                      ifying that liver tests were normal instead of listing indi-
• Each individual event in a patient’s history should be avail-       vidual measurements for billirubin concentration, Alanine
  able for inspection                                                 aminotransferase, Alkaline phosphatase, Aspartate amino-
                                                                      transferase, albumin and total protein). However, pure text
• Events that deviate from the norm are more important                is not always the best medium of presenting large amount of
  than normal events (e.g., an examination of the lymphn-             information, part of which is numerical and most of which is
  odes that reveals lymphadenopathy is more important than            highly interconnected. Since the generated reports are likely
  an examination that doesn’t). However, normal events                to be very long (thus violating the 30 seconds report require-
  should also be available on demand.                                 ment), accessing particular pieces of information is much
• Some events are more important than others and they should          more difficult in textual reports. Linear text loses the abil-
  not only be included in the summary but also highlighted            ity of navigating through information, of expanding some
  (through linguistic means, colour coding, graphical time-           events and of highlighting important dependencies between
  lines or similar display features).                                 pieces of information. A textual report alone cannot effec-
                                                                      tively combine the time sequence element with the semantic
• Having different views of the same data is a useful feature,        dependencies - both of which are essential in representing
  because it allows the clinician to spot correlation between         patient records. Depending on the type of report chosen, ei-
  events that they may have missed otherwise.                         ther one or the other of these elements will necessarily be
                                                                      emphasised at the expense of the other.
• The interface should allow focusing on time intervals as
  well as clusters of related events (i.e. events of the same         We envisage therefore that, depending on circumstances, users
  type as well as events of different types linked through            may want to have fully textual reports (for example, for pro-
  causality relations)                                                ducing printed summaries of a patient’s history) or combined
• Summaries that provide a 30-second overview of the pa-              graphical and textual reports (for interactive visualisation).
  tient’s history are often desireable; ideally, these should         The solution we propose in this project is an integrated visu-
  fit entirely on a computer screen. However, users should            alisation tool where users can interact with a graphical inter-
  be able to obtain more detailed information about specific          face coupled with a text generation engine in order to navi-
  events by expanding their description.                              gate through patient records. The visualisation technique is
                                                                      designed to fulfil three main desiderata: interaction (better
The iterface should allow users to search and retrieve infor-         achieved through visual navigation), clarity (improved read-
mation such as:                                                       ability of the visual display is achieved through text genera-
                                                                      tion which shifts the burden from graphical representations
• Why has a certain event happened? (Why was the patient’s            to textual descriptions), and completeness (if the information
  medication changed?)                                                is available, it should be available to the user without imped-
                                                                      ing the clarity of the interface, which is achieved through the
• When has a certain event or series of events happened?              combination of visual navigation and text generation).
  (When did the patient undergo surgery?)
                                                                      In the following, we will describe the two types of report
• How many events of a certain type occured in a certain
                                                                      generated in either of the two scenarios. Section will de-
  time interval? (How many courses of chemotherapy were
                                                                      scribe in more detail the natural language generation tech-
  cancelled in the course of a full chemotherapy cycle?)
                                                                      niques employed in generating both independent textual re-
• What was the outcome of a certain event? (What were the             ports and report snippets that support the graphical interface.
  findings of the fine needle aspirate biopsy?)
• How did a certain event progress in a certain time interval?        VISUALISATION MODALITIES
  (How did the platetelet count change between the start
  and the end of a chemoptherapy treatment?)                          Visual navigator

                                                                  2
he visual navigator presents on one screen a high level overview graphical object corresponding to an instance of a procedure
of a patient’s medical history. The visual display is built on a timeline is sufficient. However in the case of blood
around a timeline paradigm enhanced with visual techniques tests, which have numerical values associated with them it is
for highlighting relationships between events on the time- much more likely to assume that the user is interested in the
line. actual value of the measurement, rather than in the fact that
such a measurement occured, therefore the view changes to
The information in the chronicle is organised along three a line chart with graphical objects representing individual
parallel timelines, corresponding to Diagnoses, Treatments measurements being placed at the appropriate position in the
and Investigations. Events in a patient’s medical history are chart according to the measruement value, instead of linearly
represented as graphical objects visually differentiated by along a timeline. (see Figure2).
colour and icons. Both snap events (occuring at a certain
moment in time) and span events (occuring over a period of Apart from visualising events and time spans, one of the use-
time) are represented on the timelines. Furthermore, each ful features of the navigator is the ability to visualise rela-
event can be either simple or composite. Composite events tionships between events. Since events in a chronicle are
are events that are from a semantic viewpoint a single entity highly interconnected, it is not desirable that all dependen-
(they have a common cause and a common aim) and com- cies should be available at all times; instead, the user can
bine under the same label several sub-events. For example, a hide or show types of dependencies as needed. This can be
chemotherapy treatment is a composite event consisting of a done either at event level (e.g. showing only the cause and
number of chemotherapy courses (usually six) administered the outcome of a surgical procedure) or at global level (show
over a period of time. However there is no direct relationship all causality and consequence relations between multiple se-
between span events and composite events. Some compos- lected events). Right click on a graphical object brings up
ite events are snap events (for example, a liver test is a span a check-box menu where the user can select from the avail-
event consisting of several separate tests) whilst some span able relations associated to the selected event, the ones they
events are simple events (for example, medication can be want to visualise. The result of this selection is three-fold:
administered continuously over several weeks). Composite the visual navigator brings into focus (if not already there)
events can have several levels of compositionality. For ex- the events that are linked to the current event through the
ample, primary treatment packages are composed of various selected types of relationship, it displays the relationships
instances of radiotherapy, surgery, medication, chemother- as colour-coded arrows and it also hides from the timeline
apy and each of these events can be either simple or com- unconnected events for reasons of improving clarity. This
posite events. The user can drill into composite events to may also result in time spans that have no visible events be-
reveal details about component events and, conversly they ing collapsed or reduced in size for a better display of the
can collapse composite events to obtain a higher level view. required information on the screen.
By zooming in and out of a time span the user can get more
or less detailed views of the events in that time span. The visual navigator allows three main scenarios of data re-
trieval and navigation. In the first scenario, the user identifies
Timeline labels also act as interactive graphical objects that an event on the timeline and proceeds to find more informa-
correspond to classes of events of their corresponding cate- tion about that particular event and visualises relationships
gory (i.e. diagnosis, treatment and investigation. The same with other events. This is the type of interaction which oc-
applies to time labels on the X-axis, which correspond to curs for example when the doctor wants to know what was
sets of events that occur in the time span represented by the the cause and outcome of a surgical procedure. They can
time label. Selection of the labels has as effect all events achieve this by selecting a focus event, expanding it if pos-
subsumed by the category being brought into focus. sible and selecting the relationships they are interested in.
The second scenario is that of the medical practitioner trying
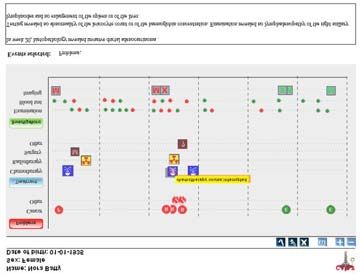
In a high level view, all events currently in focus are repre- to get an overview of what happened in a patient’s history in
sented in a uniform manner, as graphical objects on a time-
line (see Figure 1). In the initial, default view all events are
in focus, which results in the timelines being split into spans
of equal length corresponding to years in the medical his-
tory. The graphical objects corresponding to events are then
placed in the time span they correspond to.
Unselecting events or bringing other events into focus results
in a reorganisation of the currently focused graphical objects
on the timeline. Time spans that contain no focused events
are collapsed and the remaining timespans are redistributed
equally. Since the chronicle contains both factual and nu-
merical data, we have to provide different types of low level
view according to the type of the selected event. For exam-
ple, in the case of procedures the fact that they were per-
formed is their main defining property, therefore placing a
Figure 1. Visual history snapshot: high level view
3resented as relations in the chronicle semantic network bu
rather as fields in an object description, however for reasons
of consistency in the design of our system we will consider
them as semantic relations.
The system design of the Report Generator follows a clas-
sical NLG pipeline architecture [5], with a Content Selector,
Content Planner and Syntactic Realiser. The Content Plan-
ner is tightly coupled with the Content Selector, since part
of the document structure is already decided in the event se-
lection phase. Aggregation is mostly conceptual rather than
syntactic, therefore it is performed in the content planning
stage as well.
Figure 2. View of the trend of the billirubin concentration
Content selection
The process of content selection is driven by two parame-
a certain time span, e.g. in the last year or following treat- ters: the type of summary and the length of summary. We
ment. This is achieved by selecting time spans and zooming define the concept of summary spine to represent a list of
into the selected portion of the medical history, which re- concepts that are essential to the building of the summary.
veals mode detail about individual events. For example, in a summary of the diagnoses, all events of
In the third scenarios, the user may want to discover events type Problem will be part of the spine (Figure 3). Events
on the timeline. For example, a doctor may notice abnor- linked to the spine through some kind of relation may or may
mal values of liver functions which are not explainable by not be included in the summary, depending on the specified
current events in the patient’s history and may suspect a pre- type and length of the summary. The design of the system
vious history of liver problems. In this case they may want does not restrict the spine to containing only events of the
to find previous recordings of diagnoses related to problems same type: a spine may contain, for example, Problems of
of the liver. In this scenario, the user does not interact with type cancer, Investigations of type x-ray and Interventions
events on the timeline, but with classes of events instead. of type surgery.
Textual reports Locus
Problem
In the following, the term Report Generator will be used to Investigation
Intervention
designate the software that performs text generation, as a re- Locus Problem Investigation
sult of either a direct request from the user for a specific type
of report or a selection of events in the graphical timeline. Locus
Intervention
Problem
The output of the report generator may be either a full report Drug
or a report snippet, but practically, the type of selection em-
ployed in chosing the focus of the report does not influence Problem
the technique used in generating it.
Figure 3. Spine events for a summary of diagnoses
The chronicle described in whichs represent the input to
the Report Generator is a highly structured representation
of an Electronic Patient Record, in the form of a semantic
network. For the purpose of this paper, we consider the input
correct and complete. Each node in the network describes an The relations stored in the chronicle help in the construction
event in the patient’s medical history of clusters of related events. A typical cluster may repre-
sent, for example, that a patient diagnosed with cancer fol-
The chronicle relations can be categorised into three types lowing a clinical examination, a mastectomy was performed
according to their role in the generation process. Rhetorical to remove the tumour, a histopathological investigation on
relations are relations of causality and consequence between the removed tumour confirmed the cancer, radiotherapy was
two facts (such as, Problem CAUSED - BY Intervention or In- given to treat the cancer, which caused an ulcer that was
tervention INDICATED - BY Problem) and are used in the doc- then treated with some drug. Smaller clusters are generally
ument planning stage for automatically inferring the rhetor- not related to the main thread of events, therefore the first
ical structure of the text, as it will be described in . On- step in the summarisation process is to remove small clus-
tological relations such as Intervention IS - SUBPART- ters2 The next step is the selection of important events, as
OF Intervention bear no significance in text planning defined by the type of summary. Each cluster of events is
and realisation, but can be used in content selection. At- a strongly connected graph, with some nodes representing
tributive relations such as Problem HAS - LOCUS Locus or spine events. For each cluster, the spine events are selected,
Investigation HAS - INDICATION Problem are used in group- 2
In the current implementation these are defined as clusters con-
ing messages in a coherent way, prior to the construction of taining at most three events. This threshold was set following em-
the rhetorical structure tree. The former are in fact not rep- pirical evidence.
4together with all nodes that are at a distance of less than n stances such as that shown in example (3), where a Problem
from spine events, where n is a user-defined parameter used message is combined with a Locus message to give rise to
to adjust the size of the summary. For example, in the cluster the composite message Problem-Locus.
presented in figure 4, assuming a depth value of 1, the con-
tent selector will choose cancer, left breast and radiotherapy In the second stage, messages are grouped according to spe-
but not radiotherapy cycle, nor ulcer. cific rules, depending on the type of summary. For longitu-
dinal summaries, the grouping rules will, for example, stip-
cancer ulate that events occurring within the same week should be
d_By Has
_Lo grouped together, and further grouped into years. In event-
i cate cus
Ind specific summaries, patterns of similar events are first identi-
Has_Locus
radiotherapy left breast fied and then grouped according to the week(s) they occur in;
for example, if in week 1 the patient was examined for en-
Cau
Is_Subpart_Of
sed
_By largement of the liver and of the spleen with negative results
and in week 2 the patient was again examined with the same
radiotherapy
cycle
ulcer results and underwent a mastectomy, two groups of events
will be constructed, leading to output such as:
Figure 4. Example of cluster (1) In weeks 1 and 2, examination of the abdomen revealed
no enlargement of the liver or of the spleen.
The result of the content selection phase is a list of mes- In week 2, the patient underwent a mastectomy.
sages, each describing an event with some of its attributes
specified. The number of attributes specified depends on the
depth level of a message (i.e., how far from the spine the Within groups, messages are structured according to dis-
event is). For example, a Problem event has a large number course relations that are either retrieved from the input database
of attributes, consisting of name, status, existence, number or automatically deduced by applying domain specific rules.
of nodes counted, number of nodes involved, clinical At the moment, the input provides three types of rhetorical
course, tumour size, genotype, grade, tumour marker and relation: Cause, Result and Sequence. The domain specific
histology, along with the usual time stamp. If the Problem rules specify the ordering of messages, and always introduce
is a spine event, all these attribues will be specified, whilst a Sequence relation. An example of such a rule is that a
if the Problem is two levels away from the spine, only the histopathology event has to follow a biopsy event, if both
name and the existence will be specified. of them are present and they start and end at the same time.
These rules help building a partial rhetorical structure tree.
Document planning Messages that are not connected in the tree are by default as-
The document planner component is concerned with the con- sumed to be in a List relation to other messages in the group,
struction of complete document plans, according to the type and their position is set arbitrarily. Such events are grouped
of summary and cohesive relations identified in the previ- together according to their type; for example all unconnected
ous stage. The construction of document plans is, however, Intervention events, followed by all Investigations.
initiated in the content selection phase: content is selected
according to the relations between events, which in turn in- In producing multiple reports on the same patient from dif-
forms the structure of the target text. ferent perspectives, or of different types, we operate under
the strong assumption that event-focussed reports should be
The document planner uses a combination of schemas and organised in a way that emphasises the importance of the
bottom-up approach. A full report (generated for the purpose event in focus. From a document structure viewpoint, this
of printing, for example) is typically formed of three parts: equates to building rhetorical structures where the focus event
(i.e., the spine event) is expressed in a nuclear unit, and
• a schematic description of the patient’s demographic in- skeleton events are preferably in sattelite units.
formation (e.g., name, age, gender);
• a two-sentence summary of the patient’s record (present- At the sentence level, spine events are assigned salient syn-
ing the time span of the illness, the number of consults tactic roles that allows them to be kept in focus. For exam-
the patient attended and the number of investigations and ple, a relation such as Problem CAUSED - BY Intervention is
interventions performed); more likely to be expressed as:
• the actual summary of the record produced from the events The patient developed a Problem as a result of an Interven-
selected to be part of the content. tion.
The visualisation tool only makes use of the third compo- when the focus is on Problem events, but as:
nent, therefore in what follows, we will concentrate on this
latter part. An Intervention caused a Problem.
The first stage in structuring the summary is to combine mes- when the focus is on Interventions.
sages linked through attributive relations. This results in in-
5This kind of variation reflects the different emphasis that is With a first level of aggregation, this is reduced to:
placed on spine events, although the wording in the actual
report may be different. Rhetorical relations holding be- (5) • Examination of the abdomen revealed no enlargement
tween simple event descriptions are most often realised as of the spleen or of the liver.
a single sentence (as in the examples above). Complex indi- • Examination of the axillary nodes revealed no
vidual events are realised in individual clauses or sentences lymphadenopathy.
which are connected to other accompanying events through
the appropriate rhetorical relation. Additionally, the number
of attributes included in the description of a Problem is a de- Further aggregation of the two examination events transforms
cisive factor in realising an event as a phrase, a sentence or a the output into:
group of sentences. In the following two examples, there are
two Problem events ( cancer and lymphnode count) linked (6) Examination revealed no enlargement of the spleen or of
through an Investigation event ( excision biopsy), which is the
indicated by the first problem and has as a finding the second liver and no lymphadenopathy of the axillary nodes.
problem. In Example 4, the problems are first-mentioned
spine events, while in Example 5, the problems are skeleton
events (the cancer is a subsequent mention and the lymphn- However, even this last level of aggregation may be not enough,
ode count is a first mention), with the Investigation being since clinical examinations are performed repeatedly and con-
the spine event. sist of the same types of investigation.
The system makes use of two solutions to this problem, both
(2) A 10mm, EGFR +ve, HER-2/neu +ve, oestrogen receptor of which make use of domain specific rules. The first is to
positive cancer was found in the left breast (histology: report only those events that deviate from the norm - for ex-
invasive tubular adenocarcinoma). Consequently, an excision ample, abnormal test results. The second, which leads to
biopsy was performed which revealed no metastatic involvement larger summaries, is to produce synthesised descriptions of
in the five nodes sampled. events. In the case of clinical examinations for example, it
(3) An excision biopsy on the left breast was performed can describe a sequence of investigations such as the one in
because of cancer. It revealed no metastatic involvement Example 7 as “The results of a clinical examination were
in the five nodes sampled. normal” . If the examination result deviates from the norm
on a restricted numbers of parameters, this can be described
as “The results of clinical examination were normal, apart
As these examples show, the same basic rhetorical struc- from an enlargement of the spleen”.
ture consisting of three leaf-nodes and two relations (CAUSE
and CONSEQUENCE) is realised differently in a Problem-
focussed report compared to an Investigation-based report. INTEGRATING TEXT AND GRAPHICS
The conceptual reformulation is guided by the type of re- The addition of natural language support to the data visu-
port, which in turn has consequences at the syntactic level. aliser serves two main purposes which are achieved by two
different types of user interaction.
First, the user may directly require textual reports for the
Aggregation purpose of producing documents suitable for printing or for
The fluency of the generated text is enhanced by concep- exchanging information. In this case, the text generation
tual aggregation, performed on messages that share common process is triggered by the user through direct selection of
properties. Simple aggregation rules state, for example, that the report generation option in the interface. The user can
two investigations with the same name and two different tar- further specify the type of information they would like to be
get loci can be collapsed into one investigation with two tar- included in the report either by choosing a certain predefined
get loci. Consider, for example, a case where each clinical type of report (such as for example, a longitudinal report or
examination consists of examinations of the abdomen for en- a summary of interventions) or by specifying in more de-
largement of internal organs (liver and spleen) and examina- tail the type of information they want included in the report
tion of the lymphnodes. Thus, each clinical examination will (for example, surgical interventions, completed chemother-
typically consist of three independent Investigation events. apy courses, medication). This information can be specified
If fully expanded, a description of the clinical examination by selecting graphical objects on the timeline (including ob-
may look like: jects corresponding to individual events, classes of events,
years or time spans). Selection of events will produce event-
(4) • examination of the abdomen revealed no enlargement of focused summaries, whilst selection of time spans will pro-
the spleen duce longitudinal summaries for that particular span. An-
• examination of the abdomen revealed no enlargement of the other way of including information in a summary is by drag-
liver ging and dropping graphical objects from the timeline onto
• examination of the axillary lymphnodes revealed no the text. This results into adding the specific event or class
lymphadenopathy of the axillary nodes of events represented by the graphical object to the content
of the report and regenerating the report to reflect the new
6content. text with little variability than the kind of deep generation
used in producing full reports.
The second and more interesting role of natural language is
as a support tool for the visual navigator, which facilitates RELATED WORK
the understanding of complex visual devices and better de- Natural language generation has been used in the medical
scribes relationships between events. The paradigm that un- domain for various applications. For example: to gener-
derpins the integration of text and graphics is the fact that ate drug leaflets (i.e., pill inserts) in multiple languages and
the information made available to the user in text format di- styles (PILLS [6]), letters to patients to help them stop smok-
rectly reflects the user interaction with the graphical inter- ing (STOP [7]), individualised patient-education brochures
face in a uniform manner. All generated text is produced by (MIGRANE [8]); HealthDoc [9]); Piglit [10]). There is also
re-organising the information available to the text genera- a body of work on the generation of summaries of patient
tion module, therefore the visual front-end interacts directly records (e.g., [11], [12]). Most computer-based patient record
with the content selecion component of the report generator. management systems have simple generation facilities built-
This involves not only the addition and removal of nodes in, which produce text normally consisting of unconnected
in the content graph, but also the inclusion of relations in sentences and thus lacking fluency. Natural language gener-
the graph, which has implications in the construction and ation techniques have been applied in various reporting sys-
realisation of the discourse structure tree. In this scenario tems for generating telegraphic textual progress notes [13],
we can differentiate between three types of graphics-text in- reports on radiographs [14], and bone scans [15] or post-
teraction. The simplest type of text generation is the gen- operative briefings [16]. However, this work differs from
eration of short tooltips describing graphical objects. This ours in that they concentrate on the summarization of textual
occurs when the user hovers the mouse over a graphical ob- records, as opposed to data encoded records.
ject corresponding to an event on the timeline; this triggers
the generation of a tooltip with a short description of the Outside the medical domain, several NLG systems have been
event. A higher level of text generation is performed as a developed for generating reports from data, most notably
result of the user selecting a graphical object on the time- the SummTime project which deals with the generation of
line. This action is interpreted as a request for a complete numerical time-series data in several domains, including, of
textual description of the particular event represented by the most interest to us, neonatal intensive care[17]. Our project
selected graphical object. A graphical icon representing a however deals with a combination of numerical and non-
chemotherapy event, for example, “hides” information about numerical data, therefore describing numerical trends is only
the particular drug regimen used, dates of the chemotherapy one aspect of our research.
cycles and reasons for deferring a particular cycle. Since
this information is better expressed as text than graphically, Unlike previous projects, which used generated text to pro-
each selection of an event will trigger the production of a vide explanations for graphical devices ([18], [19]) or as an
report snippet that describes in more detail that particular alternative means of describing data ([20], [21]), our empha-
event. This procedure is equivalent with the production of sis is on text generated interactively as a response to the user
a focused summary with only one central event, therefore interaction with the visual display.
the report snippet is more than a simple description of the
event; it also contains the dependencies that particular event The timeline paradigm has been used extensively in visual-
has with other events in the medical history. For example, ising patient histories. The Lifelines project [22] provides
a description of a chemotherapy event will include not only a method for visualising and accessing personal histories
features of the treatment - duration, type of drug, status, but by means of a graphical interface, and has been used for
also the reason for administering (or deferring/cancelling) both patient records and legal case histories. TeleMed [23]
chemotherapy, side effects and outcome. If the graphical ob- gathers patient information from distributed databases and
ject selected corresponds to a composite event, the user can presents it in a Web interface as icons on a timeline; interac-
drill down into the component sub-events. This action is re- tion with the icons provides access to more detailed descrip-
flected in text by unpacking aggregate descriptions of events tions of the individual pieces of information. Various authors
into their components. For example, a composite event such describe the advantages of the timeline approach to visualis-
as chemotherapy package will be expanded into several sub- ing temporal data of the kind present in patient histories [24,
events corresponding to the chemotherapy cycles within the 25]. Our particular application however differs significantly
package and the textual description will include information from other timeline methods in the fact that capturing and vi-
such as the dates when chemotherapy cycles, possible side- sualising relationships between events is equally important
effects or complaints following individual chemotherapy cy- to anchoring events in time. The second major difference
cles and reasons for cancelling or delaying them. This ad- is of course the ability of supplementing visual navigation
ditional information is integrated seamlessly with the higher with textual explanations, which improves the clarity of the
level description of the chemotherapy package. interface.
A different type of text generation is performed for support-
ing charts and diagrams describing the trend of numerical CONCLUSIONS AND FUTURE WORK
values. Captions are generated using template-based tech- We presented in this paper a visualisation tool that integrates
niques, which are more appropriate for producing simple natural language and visual devices for presenting and nav-
igating through complex views of medical histories termed
7chronicles. The graphical interface is used to specify the 7. Reiter E, Robertson R, Osman L: Lessons from a
content of medical reports, whilst automatically generated Failure: Generating Tailored Smoking Cessation
textual descriptions are used to support the navigation tool Letters. Artificial Intelligence 2003, 144:41–58.
by improving clarity and moving the presentation of details
away from the graphical interface. Whilst formative evalua- 8. Buchanan B, Moore J, Forsythe D, Carenini G, Ohlsson
tion has been performed, which helped us refine and improve S: Involving patients in health care: explanation in
the system with the help of comments from potential users, the clinical setting. In Proceedings of the Sixteenth
a final end user evaluation is still outstanding. Annual Symposium on Computer Applications in
Medical Care (SCAMC’92) 1992:510–512.
The design and implementation of the current visualisation 9. Hirst G, DiMarco C, Hovy EH, Parsons K: Authoring
tool is based on the assumption that the input is correct and and Generating Health-Education Documents That
complete. In practice however the medical chronicle is the are Tailored to the Needs of the Individual Patient.
outcome of a complex process which involves information In Proceedings of the 6th International Conference on
extraction from natural language text and heursitics-based User Modeling, Italy 1997.
inferrencing, which can result in missing or incorrect data.
Some data may also be missing simply because it was not 10. Binsted K, Cawsey A, Jones R: Generating
available to the chronicalisation process. An interesting topic personalised patient information using the medical
for future research is taking into account modalities of pre- record. In Proceedings of Artificial Intelligence in
senting potentially incomplete data to the user without intro- Medicine Europe, Pavia, Italy 1995.
ducing misleading information. This involves using different 11. Afantenos SD, Karkaletsis V, Stamatopoulos P:
visualisation modalities for data that is marked as uncertain Summarization from Medical Documents: A
in the chronicle, and also reflecting this uncertainty in the Survey. Artificial Intelligence in Medicine 2005,
generated text. 33(2):157–177.
Acknowledgment 12. Elhadad N, McKeown K: Towards Generating
The work described in this paper is part of the Clinical E- Patient Specific Summaries of Medical Articles. In
Science Framework (CLEF) project, funded by the Medical Proceedings of the Workshop on Automatic
Research Council grant G0100852 under the E-Science Ini- Summarization, NAACL 2001, Pittsburg, USA 2001.
tiative. We gratefully acknowledge the contribution of our 13. Campbell K, Wieckert K, Fagan L, MMusen: A
clinical collaborators at the Royal Marsden and Royal Free Computer-based Tool for Generation of Progress
hospitals, colleagues at the National Cancer Research Insti- Notes. In Proceedings of the Symposium on Computer
tute (NCRI) and NTRAC and to the CLEF industrial collab- Applications in Medical Care (SCAMC) 1993:284–288.
orators.
14. A Abella JS J Kender: Description Generation of
REFERENCES Abnormal Densities Found in Radiographs. In
1. Rector A, Rogers J, Taweel A, Ingram D, Kalra D, Proceedings of the Symposium on Computer
Milan J, Gaizauskas R, Hepple M, Scott D, Power R: Applications in Medical Care (SCAMC) 1995:542–546.
CLEF - Joining up Healthcare with Clinical and 15. Bernauer J, Gumrich K, Kutz S, Linder P, Pretschner
Post-Genomic Research. In Second UK E-Science D: An Interactive Report Generator for Bone Scan
”All Hands Meeting”, Nottingham, UK 2003. Studies. In Proceedings of the Symposium on
2. Harkema H, Roberts I, Gaizauskas R, Hepple M: Computer Applications in Medical Care (SCAMC)
Information Extraction from Clinical Records. In 1991:858–860.
Proceedings of the 4th UK e-Science All Hands 16. M Dalal K S Feiner: MAGIC: An Experimental
Meeting, Nottingham, UK 2005. System for Generating Multimedia Briefings about
3. Rogers J, Puleston C, Rector A: The CLEF Chronicle: Post-Bypass Patient Status. Journal of the American
Transforming Patient Records into an E-Science Medical Informatics Association 1996, :684–688.
Resource. In Proceedings of the UK E-Science 17. Portet F, Reiter E, Hunter J, Sripada S: Automatic
All-Hands Meeting 2006. Generation of Textual Summaries from Neonatal
4. Rogers J, Puleston C, Rector A: The CLEF Chronicle: Intensive Care Data. In Proceedings of AIME 2007
Patient Histories Derived from Electronic Health 2007:227–236.
Records. In ICDE Workshops 2006 2006.
18. Mittal VO, Carenini G, Moore JD, Roth S: Describing
5. Reiter E, Dale R: Building natural language generation complex charts in natural language: a caption
systems. New York, NY, USA: Cambridge University generation system. Computational Linguistics 1998,
Press 2000. 24(3):431–467.
6. Bouayad-Agha N, Power R, Scott D, Belz A: PILLS: 19. Fasciano M, Lapalme G: PostGraphe: A system for
Multilingual generation of medical inf ormation the generation of statistical graphics and text. In
documents with overlapping content. In Proceedings Proceedings of the Eighth International Workshop on
of LREC 2002 2002:2111–2114. Natural Language Generation, Brighton, U.K 1996.
820. Green NL, Carenini G, Kerpedjiev S, Mattis J, Moore
JD, Roth SF: AutoBrief: an experimental system for
the automatic generation of briefings in integrated
text and information graphics. Int. J. Hum.-Comput.
Stud. 2004, 61:32–70.
21. Kerpedjiev S: Automatic generation of multimodal
weather reports from datasets. In Proceedings of the
3rd International Conference on Applied Natural
Language Processing, Trento, Italy 1992:48–54.
22. Plaisant C, Mushlin R, Snyder A, Li J, Heller D,
Shneiderman B: Lifelines: Using visualization to
enhance navigation and analysis of patient records.
In Proceedings of the 1998 American Medical
Informatic Association Annual Fall Symposium
1998:76–80.
23. Kilman DG, Forslund DW: An International
Collaboratory Based on Virtual Patient Records.
Communications of the ACM 1997, 40(8):110–117.
24. Tufte E, Kahn M: The Visual Display of Quantitative
Information. Cheshire, Connecticut: Graphics Press
1983.
25. Cousins, Kahn M: The visual display of temporal
information. In Artificial Intelligence in Medicine
1991:341–357.
9You can also read