WHATEVER HAPPENED TO THE BACKYARD? THE MINIMISATION OF OPEN SPACE IN AUSTRALIAN SUBURBIA
←
→
Page content transcription
If your browser does not render page correctly, please read the page content below
WHATEVER HAPPENED TO THE BACKYARD?
             THE MINIMISATION OF OPEN SPACE
                 IN AUSTRALIAN SUBURBIA
                                            Tony Hall
                                  Griffith University, Brisbane

Abstract
Although a substantial backyard might be considered an iconic Australian feature, by the late
1990s, almost all new suburban houses had minimal provision of soft-landscaped private open
space. Quantitative analyses of examples from older and newer suburban form indicate that this
phenomenon is happening irrespective of size of lot and appears connected with a trend to larger
dwellings relative to lot area. Study of the environmental literature shows that it represents a loss
that has serious ecological implications for the community as a whole, including a significant
reduction in biodiversity, sustainable drainage and a beneficent microclimate, in addition to lower
standards of domestic amenity. Planning codes, while not actually encouraging the trend, do
nothing to prevent it.

Introduction
In the early 1990s, a dramatic change in Australian suburban form began (Hall, 2007a, 2008,
2010). The older areas are characterised by tree cover while, in the newer ones, large roof areas
predominate and dwellings can be nearly roof-to-roof. This change has not been subtle or gradual
in either space or time. It is a phenomenon that is immediately apparent from even a cursory
examination of aerial photographs. This change is not something that relates to the backyards
alone. House and street design have also changed as part of the same process. There has been
a trend towards deep, square house plans possessing large internal spaces with little natural light
and ventilation. There is also a trend towards fewer and smaller windows. The narrow gap around
single-storey houses is dominated by high opaque fences. The frontage is dominated by integral
garages.
Data from an analysis of aerial photographs reveals that, before the 1990s, suburban form
incorporated backyards of substantial size, useful shape and a significant coverage of trees. Lot
coverages by houses were 20-30% with a maximum of 35-40%. For new construction after this
period, provision of large backyards ceased and 35-40% now represents the minimum, rather than
the maximum, lot coverage. Although there has been a trend to smaller lot sizes, the phenomenon
appears independent of lot area. Examination of local planning regulations provides little evidence
that the changes are being driven by planning policy but it is clear that planning policy has done
nothing to prevent it.
Most importantly, the evidence from the literature suggests that this change in suburban form has
serious environmental consequences. The domestic backyard, including its tree cover, has an
ecological function and importance that goes well beyond the interests of the individual household.
The smaller proportion of the total land area that is permeable and planted will have an adverse
affect on the local ecology and microclimate.

The research method
The first stage of the investigation (Hall, 2007a, 2008) was the visual inspection of aerial
photographs of Australian cities. Sample areas were then selected for detailed analysis from within
the older and more recent residential suburbs of Sydney, Melbourne, Brisbane, Adelaide and
Perth. Measurements were made of the parameters of lots and building footprints from aerial
photographs, including backyard area and lot coverage. At the same time, the approximate dates
of subdivision and construction, and details of the local planning regulations that applied at that
time, were sought. One reason for selecting examples from a number of cities was, hopefully, to
take in a range of regulatory regimes. All the examples were inspected and photographed at
ground level.

                                                        The 11th National Street Tree Symposium 2010

                                                                                                    47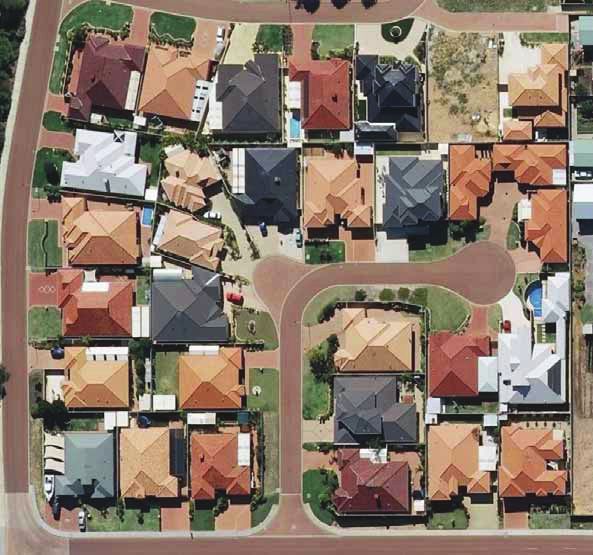
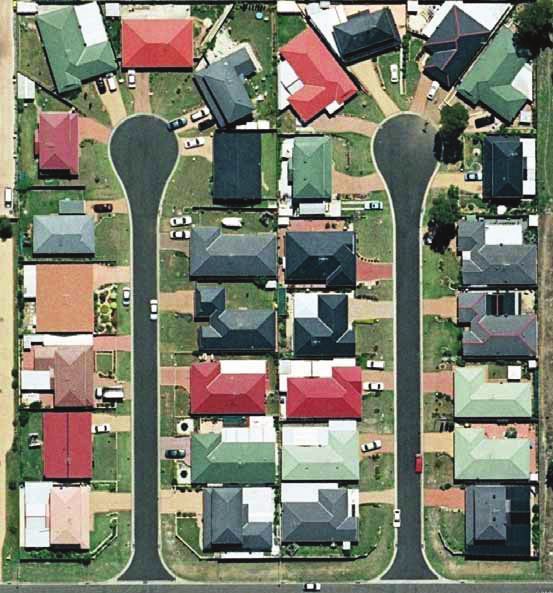
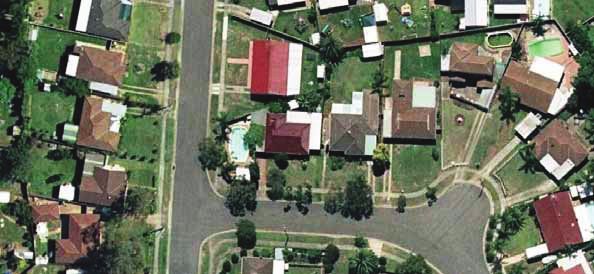
The details of the local planning regulations applying to the examples were reviewed in the light of
the relevant planning policy documents at local government and state level. Note was also made
of any Commonwealth government documents that might have influenced these over time.
As a separate but complementary exercise, the literature on the role of the private open space
around the dwelling was studied. As the investigation proceeded, it became clear that this was an
interdisciplinary task embracing on a wide range of ecological and behavioural studies.

The results of the analyses
The results of the analyses are set out in Tables 1-4. An issue in measurement was how to the
count the land area occupied by verandas, pergolas and other lightweight structures that are now
common as extensions to the Australian home. The terms net footprint and net coverage in the
Tables refer solely to the original dwelling while the terms gross footprint and gross coverage refer
to the dwelling plus the additional structures. The data for the area of the backyard refer only to
that space open to the sun.
The data all show a consistent pattern indicating a distinctive phenomenon. There was a clear-cut
difference between older suburbs, characterised by contiguous private open space to the rear of
properties with extensive tree cover and the newer residential developments with significantly less
space between the dwellings. The older form was universal up until the late 1980s. It is possible
to find developments constructed during the 1990s that take an intermediate position either by
mixing the types or by having backyards that are smaller but still of usable size and shape.
However, by the late 1990s, construction of the older form had ceased. No recently built examples
with the same characteristics of the older suburban form could be detected. The newer form
appeared in increasing strength as the 1990s progressed and was predominant by 2000. If
anything, its characteristics have become more extreme with time.

The traditional Australian backyard
The physical characteristics of the traditional Australian backyard were realised over the first 150
years from colonial settlement in the form of the detached cottage with a large yard on an allotment
between 600 and 1200 square metres (Cunningham & Auster, 1996). Despite the obvious cliché of
the ‘quarter acre block’ (1012 m2) which, although existing, is not, or has ever been, commonplace,
the critical point is that, until comparatively recently, most suburban houses in Australia have had
big backyards by world urban standards (Halkett, 1976; Seddon, 1997; Timms, 2006; Head and
Muir, 2007). Based on the size of the genuine quarter-acre lot, and assuming a large house with
site coverage of 200m2, a backyard would be likely to be in the order of 500-600 m2. A standard
sized block in the order of 600m2, again assuming a large house with site coverage of 200 m2,
would still be likely to accommodate a backyard in the order of 200 m2. This is confirmed by the
examples shown in Tables 1 and 2. The average backyard area is over 200 m2 except for in
Hebesham (NSW), from the 1980s. Even here, 57% of the backyards are over 150 m2.
For a better appreciation of the implications of these figures, we can take a closer look at three of
the examples from those listed in Tables 1 and 2. Figure 1 shows an aerial view of part of the
suburb of Camp Hill Queensland (QLD). It lies 5.7 km southeast of the centre of Brisbane and was
subdivided between 1945 and 1947. The houses are generally of the “Queenslander” type, the
vernacular architecture of the State. The locality is particularly notable for the number of trees both
in front and behind the houses. The backyards are of substantial size and usually include facilities
for drying clothes, as shown by Figure 2.
Figure 3 shows an aerial view of part of Hebersham NSW, subdivided in the 1980s. It is some 38
km west of the centre of Sydney. The majority of backyards have a significant area and a square
shape. A number have swimming pools. Figure 4 shows an aerial view of part of the Perth suburb
of Spearwood dating from the 1980s. It is just over 17 km south of the city centre. Most of the
backyards are of substantial size and some accommodate a rainwater tank and swimming pool.
All three examples feature good rectangular backyards with trees. Only a few have areas less than
150 m2 and many are in excess of 300 m2. The proportion of the total lot covered by the dwelling
footprint only occasionally exceeds 40% and, for a very large proportion, it is less than 30%. Net
densities are 9-13 dph, low but not excessively so. It does not follow, however, that low density is
solely due to the presence of large backyards. A significant determinant of the low residential
densities is the very large front-to-front distances, in excess of 30 m. Finally, a very important
characteristic of the older suburban form that is very clear from the aerial photographs is the way
that the backyards interconnect to the rear of the properties providing a nearly contiguous planted
area.

The 11th National Street Tree Symposium 2010

48
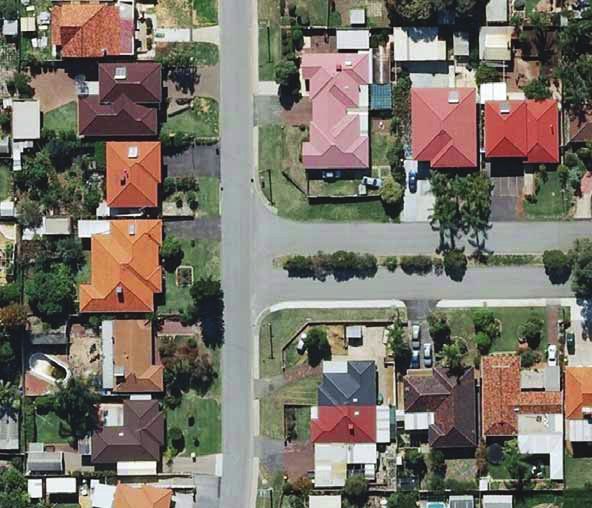
Figure 3 An aerial view of part of the Brisbane suburb of Camp Hill QLD subdivided 1945-1947. The
        houses are generally of the “Queenslander” type. Note the number of large trees.

Figure 4 A typical backyard in Camp Hill QLD.

                                                       The 11th National Street Tree Symposium 2010

                                                                                                    49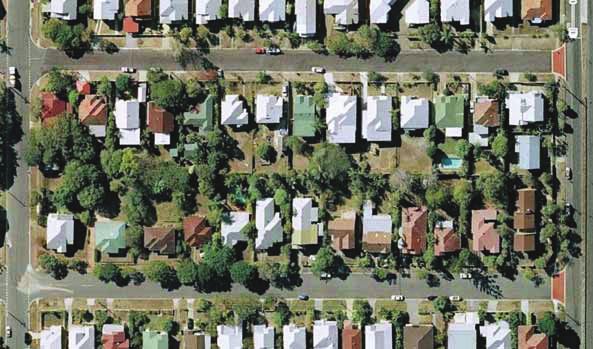
Examples of the newer suburban form
Comparing Tables 3 and 4, detailing the more recent suburban form, with Tables 1 and 2, what is
striking is the differences in value for lot coverage, backyard area and rear setback. Average net
lot coverage is now between 39% and 56% compared with 22%-30%, gross lot coverage is 46%-
52% compared with 29%-38% and setback distance 4-7 m compared with 12-29 m. Table 4 shows
that the majority of backyard areas in all the newer examples were under 100 m2.
At first glance, 40-50% lot coverage may not seem too problematic. Would not this mean that half
the lot could be garden? Half of a 600 m2 lot would be 300 m2 and 30% would still be 180 m2. The
actual situation is counter-intuitive. The calculation neglects two factors. The first is the aggregate
amount of the narrow space left around the sides of the dwelling. Figure 5 shows a diagram of a
house footprint with a 2 m gap all around it. For a 300 m2 lot area, say 10 m x 30 m, this gap takes
up 48% of the total area giving a lot-coverage of 52%. For a 600 m2 lot area, say 15 m x 40 m, the
coverage is 66%. This narrow gap alone can take up 34 - 48% of the lot. If a dwelling covers half
the area of a lot there will be little private amenity space of a useful size and shape. This issue is
compounded when the space at the front of the dwelling is taken into account. A front setback of
the dwelling from the front boundary of the lot is required in most of Australia. Once this is
removed from the uncovered area at 40-50% coverage very little remains at the back and sides.
For a closer look at the newer suburban form, three examples will now be described in more detail.
Figure 6 shows an aerial view of a part of Mount Druitt NSW, off Meacher Street, which was
constructed in the mid-to-late 1990s to the south of the older Hebersham area previously
described. The street scene is shown by Figure 7. Note the dominance of garage doors. In front
of fenced front gardens is a wide unfenced grass area and carriageway. Some houses are
comparatively modest in scale, or are on corner lots, permitting a fairly small backyard, but most
have negligible open space at the rear.
The second example is taken from the Perth suburb of Spearwood but on the opposite side of the
main road to the older subdivision described earlier and shown by Figure 4. An aerial view is
shown by Figure 8. What is especially remarkable for this example is the low density and large lot
sizes. At 13.6 dph the density is nearer to the older suburbs than to the two other recent examples
but this has not resulted in the same amount of green space. At over 600m2, the lots are the same
scale as those in the older Brisbane suburb of Camp Hill QLD. While the lot dimensions are large,
so are the house footprints. Consequently, the backyards are very small, especially in comparison
to the house and lot size. Some of the houses are almost entirely surrounded by others. The
street scene, illustrated by Figure 9, is dominated by large paved areas and by wide garage doors.
There are few windows and little surveillance of the pubic realm and sense of enclosure of space.
Springfield Lakes is an extensive master-planned development on land lying over 23 km southwest
of the centre of Brisbane. The land was cleared in 2000 and construction has continued for nearly
ten years. Figure 10 shows an aerial view of part that was completed in 2002. Lot and dwelling
size show some variation. Some properties have a distance of 6-8 m at the rear of the house,
resulting in a fairly useful back garden, but many have only 2-3 m. For 70% of the properties, the
net coverage of each lot by the dwelling footprint, not counting the lightweight extensions, is over
40%. Most have very little space at the back, 93% less than 100 m² and 68% less than 50 m². The
street scene is dominated by garages, unfenced front lawns with hard standings and a wide road
reservation. Note the view of the arrangements at the side and rear of a dwelling that is revealed
by Figure 11. The meagre space around the house and lack of windows can be clearly seen. The
exposure of the side boundary fence is poor for security and unsightly for the street scene. The
strip of land in front of it has no apparent use.

Overview of the examples
As we have seen, the older type of suburban form is characterised by substantial backyards of at
least 150 m2 and they may easily be several times this figure. In contrast, in the newer suburbs,
although some properties may have backyards of 100 m2 they are normally much smaller than this
and are commonly less than 50 m2 in area. Not only this, but the narrowness of the gap between
the dwelling and the side and rear boundaries of the lot frequently results in this area being in the
form of a long strip rather than a more useful square shape.
What also seems to be happening is that the changes in the size and shape of the backyard are
closely associated with changes to the design of the house. As is revealed by the aerial
photographs, many of the houses in the newer suburbs are deep-plan, in other words there is a

The 11th National Street Tree Symposium 2010

50
considerable distance from the front to the back. Many are also square in plan, with the side-to-
side dimensions also being large. The street views reveal that they are predominantly single-
storey and that integral garages are almost universal. An integral garage, as opposed to an open
carport or detached garage, has the effect of reducing the natural light and ventilation to the interior
of the dwelling. Windows are often small and few in number. There is little outlook from the
windows for the occupants to enjoy. As the houses are now much closer to each other, to maintain
privacy, fences must be high and opaque preventing any visual contact between neighbours. The
sum of all these characteristics is that the houses have a significant proportion of the interior space
some distance from windows which will be difficult to light and ventilate naturally. The large roof
areas will absorb heat in summer, which must be expelled by air-conditioners, and lose it in winter
but the dwelling will not be able to replace it with solar gain.

Figure 5 An aerial view of part of the suburb of Hebersham, subdivided in the 1980s in western Sydney
        NSW.

                                                         The 11th National Street Tree Symposium 2010

                                                                                                     51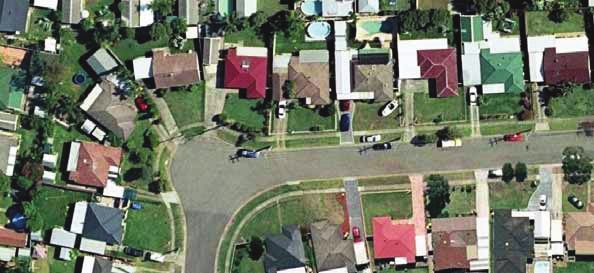
Figure 6 An aerial view of part of the Perth suburb of Spearwood WA. Subdivided in the 1980s.

                                                                                             2
Figure 7 The issue of lot coverage by the gap around the house. With a 2 m gap, for a 300 m lot area,
                                                                             2
        10 x 30 m, site coverage is 52%, for 15 x 20 m it is 59%, for a 600 m lot area, 15 x 40 m, site
        coverage is 66%. This narrow gap alone can take up 34-48% of the lot.

The 11th National Street Tree Symposium 2010

52
Figure 8 An aerial view of a cul-de-sac off Meacher Street, Mount Druitt NSW, subdivided in the late
1990s.
Figure 9 The street scene in a cul-de-sac off Meacher Street, Mount Druitt NSW. Note the dominance
of the garage doors.
The 11th National Street Tree Symposium 2010
53Figure 10 An aerial view of part of the Perth suburb of Spearwood WA, constructed in the 2000s. It is
on the opposite side of the main road from the example shown on Figure 4.
Figure 11 Street scene in part of the Perth suburb of Spearwood WA from the 2000s. Note the
dominance of large paved areas and wide garage doors.
The 11th National Street Tree Symposium 2010
54Figure 12 An aerial view of part of Springfield Lakes QLD completed in 2002.
Figure 13 The side and rear of a dwelling in Springfield Lakes QLD. Note the smallness of the
backyard and meagre provision of windows. Note also the unsightly townscape and unusable
grassed area.
The 11th National Street Tree Symposium 2010
55Damage to the local ecology and microclimate The domestic backyard has a function and importance that goes well beyond the interests of the individual household. In aggregate, it helps to create a residential area that is landscape dominated, bringing with it ecological climatic and aesthetic advantages. It is not just a matter of personal taste, such as style and decoration, much less a consumer good, such as home entertainment or a washing machine. The presence of private open space in aggregate brings significant advantages to the community as a whole. The statistic that most clearly differentiates the form of newer Australian suburb from the older one is the larger proportion of the land area that is occupied by the dwellings. When taken together with patios, verandas and pergolas, and with the carriageways and driveways, the greater part, in some cases nearly all, of the land area is treeless and covered by impervious surfaces. Aside from the front lawns, only a small residue is permeable and planted. The damaging affect this has on the local ecology and microclimate is a problem for the whole community, not just the individual residents. Lack of trees Trees need space to grow both for the canopy and, most importantly, the roots. Structural damage to buildings by roots needs to be avoided. The narrow dimensions of the space around the more recent dwellings will lead to a substantial reduction in tree cover in perpetuity, as there will be no room for trees to grow at the sides and backs of the houses. Within some of the recent developments studied, small areas of bush land have been retained and some have newly planted street trees. While the areas of bush land are welcome, they do not compensate for the lack of trees amongst the houses. For the beneficial effects to be achieved overall, a reasonably uniform distribution is required. The street trees were small at the time of writing, as the developments studied were still fairly new. If they grow to a significant height, they will provide useful shade and enclosure of space. Where they remain small, these benefits will not occur. However, even where the street trees grow to a significant size, this will still not create the degree of tree coverage found in the older suburbs. Lack of natural drainage The reduction in the size of planted areas to the sides and rear of the dwelling is not just a matter of fewer trees. It represents a loss of vegetation in general and its replacement by contiguous paved and built areas. There is, consequently, less permeable surface area to absorb rainfall. In aggregate, this increases storm water run-off, a matter that has serious implications. The most direct consequence is the increase in cost arising from expenditure on concrete storm drains, not just for the development itself but also for other communities “downstream” of it. It also represents a loss of water that could have been used to support local planting and so encourage biodiversity. A number of American studies (McPherson et al, 2005) have revealed the contribution of urban trees to the reduction of storm water run-off and the financial benefits that accrue from this. This is an issue that is particularly important for the Australian climate where long dry spells can be punctuated with episodes of heavy rainfall. Moreover, it is not helping moves to establish patterns of sustainable drainage whereby water is collected by local swales and ponds. Water sensitive urban design, as it has become known, not only brings financial and ecological advantages but can also be used to enhance the aesthetic appeal of residential schemes. Reduced carbon sequestration and pollutant removal One of the advantages of the planted areas created by contiguous backyards is sequestration of carbon dioxide, and various other pollutants, from the atmosphere. Although most, but not all, of the recent examples described in this paper have front lawns, the drastic reduction in the contiguous planted areas to the rear, and their replacement by buildings and hard landscaping, will reduce carbon sequestration just when and where it is most needed. This role of urban vegetation has been the subject of a number of scientific studies. For example, Nowak and Crane (2002) have demonstrated the effectiveness of American urban trees in the sequestration of carbon in American cities. Golubiewski (2006) has demonstrated the role of lawn grass in the same process and shown how its efficacy exceeds that of native and agricultural grasslands. The same findings have been obtained by Pouyat, Yesilonis and Nowak (2006). McPherson et al (2005), in their studies of urban trees in American cities, found not only significant carbon sequestration but also an important reduction in ozone, nitrogen dioxide, sulphur dioxide and small particulates, both through the direct absorption by leaves and by the avoidance of pollution through energy reduction The 11th National Street Tree Symposium 2010 56
in the home. Turning to Australia, Coutts, Beringer and Tapper (2007) have shown how urban
vegetation in Melbourne plays an important role in mitigating the carbon emissions in that city. The
studies by the City Council in Brisbane (Plant, 2006) found that, in 2000, Brisbane’s residential tree
cover was estimated to be absorbing the equivalent amount of carbon dioxide emitted by 30,000
cars per year.

Lack of natural climate control
The importance of trees, plants and water for a beneficent microclimate, especially in the hot and
dry circumstances of Australia, was explained earlier. For example, studies by the City Council in
Brisbane (Plant, 2006) found that Brisbane’s residential tree cover cooled surface temperatures in
the relatively mild month of October 1999 by up to 5 degrees Celsius. When applying the effects of
tree shade on the eastern and western sides of a single-storey, 3 star energy-rated home, energy
savings of up to 50% per annum could be achieved. For the more recent suburbs, the reduction in
tree cover and absorption of water coupled with the increased absorption of solar heat and its
expulsion into the narrow confines between the dwellings will have a notably adverse effect. What
is so worrying is that what is happening here is going in exactly the opposite direction as to what
would be expected in a hot dry climate. The lack of tree cover will greatly increase the heat
absorption by the buildings.
The dwellings in the newer suburbs are generally of deep-plan layout with small windows. Their
design relies on air conditioning for them to be habitable. However, even if they had been
designed for natural ventilation, the reduction in width between the dwellings would make this very
difficult, especially in those parts of Australia with subtropical climates. A study by Lee Su San
(1998) of suburban development in the Douglas area of Townsville revealed that the narrowness of
the gaps between the houses prevented airflow around them, creating a “heat island effect”. Her
studies of actual buildings confirmed previous experimental results from wind-tunnel tests with
models of buildings (Lee, Hussain and Soliman, 1980). For single-storey dwellings with a
comparatively narrow gap between them, the prevailing winds skim over the roofs without exerting
air pressure within the gaps to force natural ventilation. Natural ventilation of houses from the wind
is increased if the buildings are two, rather than one, storey high. The problem was exacerbated
by the exhaust from the air conditioners and the dark coloured roofs which absorbed, rather than
reflected, the heat. The use of impervious sheet metal fencing, rather than, open link fencing, was
also a factor in reducing airflow. These findings were confirmed by numerous complaints from the
residents (Clark, 2006).
Overall, in the conditions of the Australian summer, a vicious circle is created. The houses absorb
more heat because of their deep-plan form and large roof area. This heat is expelled by the air
conditioning systems. It is not dispersed by prevailing winds and further increases the temperature
around the house. This causes the heat to be re-absorbed by the structure, making even more
work for the air conditioners. The gaps between the houses are not only made insufferably hot but
are also affected by the noise of the air conditioners rendering the environment of the side and rear
spaces, however they are planted and decorated, unpleasant. The overall effect is an increase in
electricity consumption for the household at a time when more emphasis on the prudent
conservation of energy is required.

Lack of biodiversity
The minimisation, and even elimination, of planted areas also has serious consequences for
biodiversity in general. Once lost, species may take many decades to re-establish themselves or
may disappear from the area forever. The interconnecting area of soft landscaping created by
adjoining backyards hosts a high degree of biodiversity. The density and variety of the planting in a
domestic garden is something that is not found elsewhere. For example farming monocultures,
and even playing fields, have very limited biodiversity in comparison. Authors have remarked upon
the number of plant species to be found in back gardens in European cities (Gilbert, 1991; Pysek,
1989). From studies of English gardens, Gilbert (1991) draws attention to the variety of vegetation
to be found not only in planted beds but also in lawns, ponds and on walls. He also describes the
variety of the associated fauna which includes insects and other small creatures. Jennifer Owen
has argued strongly (Owen, J. & D. F., 1975) for the high degree of biodiversity in the English
garden on the basis of her studies of insect life. Cannon (1999), taking an international
perspective, has drawn attention to the importance of the private garden for bird life.
Turning to Australia, the same situation is to be found. Daniels and Kirkpatrick (2006) have drawn
attention to the important role played by back gardens in the conservation of bird species in Hobart.

                                                        The 11th National Street Tree Symposium 2010

                                                                                                    57
The studies by Taylor, Leach and Smith (2006) of individual home gardens in the city of Adelaide showed them to be astonishingly diverse, with more than 300 plant species found growing on some suburban housing blocks. Moroney and Jones (2006) have drawn attention to how decreasing lot sizes in Southeast Queensland have shown a reduction in biodiversity. Such losses also have a wider cultural and educational significance which is often not readily appreciated. Damage to the amenity of the dwelling In addition to the benefits to the community as a whole, the backyard provides important benefits to the individual household. The most important ones, those relating to outlook and ventilation, apply even if the occupants never venture out into their backyard. The issue for the use of space surrounding the dwelling is not just its area but also its shape and degree of surveillance. The problem in the newer suburbs is that the space is long and narrow thus limiting the range of facilities and activities that can be accommodated within it. In the worst examples, the windows are small and few in number, making it difficult for people inside to see what is happening in the yard and for those in the backyard to connect with activities in the house. Lack of outlook One of the most important roles of private open space around the home is to provide a pleasant outlook from inside the dwelling. For the examples from the more recent suburbs, the single-storey houses often have an outlook on to a high fence to the sides and rear, perhaps only 2 m away. There is often a lack of windows as there is little for them to look out on to. Two or more storeys can increase the outlook for the upper floors but the problem still remains for the ground floor. The degree of enjoyment of the house by its occupants is consequently reduced. Studies in medical settings (Ulrich, 1981, 1984; Moore, 1981) have shown that a pleasant view and natural sunlight can have beneficial effect on personal health and well-being. This is an important quality of life issue. Reduction in outdoor facilities The majority of the backyards studied in the research would not be able to accommodate a significant in-ground swimming pool. Barbecues would be possible but the space is limited and large social gatherings would be very restricted, as would other outdoor dining events. Home food production would not be possible and accommodating large external rainwater tanks and home composters would be very difficult. For many there is no room for a Hill’s Hoist and the ability to dry laundry in the open air would be very limited. Little scope for children’s play outdoors In many of the examples studied, children would be the principal sufferers as there is little space for them to run around and make noise without disturbing others while, at the same time, remaining in a secure environment with a responsible adult keeping watch from inside the house. This is especially important for very young children. A study by Flinders University (Spurrier, Magarey, Golley, Curnow and Sawyer, 2008) has pointed to less physical activity where children lack access to significant backyards. This was not compensated for by public open space and playgrounds. The authors saw this as leading to sedentary lifestyles and childhood obesity. The role of public and semi-public open space It is important to distinguish the role of the backyard from those of the front yard and the public park. They all share the ability to provide biodiversity, aesthetic pleasure and a beneficial microclimate. The front garden can certainly have an important role (Hall, 2006). The public park has an even more important one, particularly because of the larger-scale recreational opportunities it affords. In Australia, it can provide the location for gatherings of a significant number of friends and family for barbecues. However, the front garden is semi-private (or semi-public) and the park is completely public. They cannot offer the same privacy and degree of security as the backyard. This is particularly important as far as very young children are concerned. In addition, a public park cannot provide ventilation and outlook for all the houses. Although essential for urban amenity, it cannot replace the backyard in respect of the environmental functions discussed above. In summary, the green space around all dwellings has important social and environmental functions and is an essential component of sustainable living. Urban amenity is not just a matter of provision of public parks but how private planted areas are integrated within the urban fabric. The 11th National Street Tree Symposium 2010 58
Is urban consolidation the problem?
A common response to these figures is that they must be the result of smaller lot sizes, probably
resulting from planning strategies directed at urban consolidation. Writers such as Patrick Troy
(1996) have warned of the adverse consequences of such policies. Both urban consolidation
policies and market pressures contribute to increases in residential densities and smaller lot sizes
in parts of Australian cities. This is happening to a greater extent than in the US where densities in
the extreme outer suburbs remain low and lot sizes continue to increase. However, the Australian
situation has a long way to go before it even approaches the suburban densities common in
Europe. Is, then, real urban consolidation actually occurring in Australia to any significant extent?
At the time of writing, large expanses of low-density housing are still under construction on, and
beyond, the edges of most Australian cities. It might be countered that the effects of newer
planning policies at State level have yet to be seen on the ground. However, an increase in density
to, say, 15 dph, as is now the policy in some parts of the country, is still very low by European
standards and, even in the Australian context, hardly represents high-density urban form.
There is, indeed, a trend to smaller lot sizes in Australia but a closer examination of the data
reveals that this not the cause of the phenomenon. What the Tables show, for the examples
studied, is that where the lot area is large so is the house footprint. Note that the lot-size
distribution for the new section of Spearwood WA is, at around 600 m2, almost identical to that for
the older “Queenslanders” at Camp Hill QLD. Statistics at the national level (ABS, 2005) show a
substantial rise in the floor area of new houses since the 1980s. From a figure of 162.2 m2 in
1984-5, by 2003-4 the average floor area had risen to 227.6 m2, an increase of 40%. The increase
in the ten-year period from 1993-4 to 2003-4 was just over 20%. The average lot area also
declined over the same ten-year period, from 802 m2 in 1993-4 to 735 m2 in 2003-4 (ABS, 2004).
However, this is still a large figure and the evidence suggests that it is the increase in the dwelling
area, rather than the decrease in the lot area, that has driving the diminution of the backyard.
Even if urban consolidation did become a reality, would this necessitate a reduction in size, or even
elimination of, private space around the dwelling? What the European, particularly the British,
experience shows, is that there is no necessary connection between higher densities and very
small or non-existent backyards. Letchworth Garden City in Hertfordshire was the world’s first
planned “garden city” and its landscape-dominated form and neo-vernacular architecture became a
model that was influential and widely copied. The actual density is much higher than visitors
usually imagine when they first encounter its landscape-dominated townscape. Gross densities
can be as high as 20 dph and net residential densities can range from 22 dph to 35 dph. Even
allowing for the fact that the dwellings are all two-storey, dwelling footprints are very small in
comparison to Australia. In consequence, the house footprint occupies less than 30% of the lot
area, and often as little as 12% (Hall, 2010).
Recent British central government policy has required a minimum net density of 30 dph. However,
new suburban housing schemes without private open space cannot be found because they are not
allowed. What is notable about the British situation is that at densities in the range 30-55 dph,
many times those in the newer Australian suburbs, back-to-back distances and rear garden sizes
are greater than in many of the older Australian suburbs. With good urban design and strong
planning intervention, front-to-front distances can be reduced and houses can have more storeys
giving more floor area for the same footprint. Houses do not need to be bigger if lots are smaller.
Backyards of 100-150 m2 can be provided at densities up to 40 dph, even 60 dph (Hall, 2007b). A
house and garden form is maintained even when the street space is definitely urban in character.
The diminution of the Australian backyard is not, therefore, a necessary consequence of higher
densities. On the contrary, what is so remarkable about the phenomenon is at its worst in the
extreme outer suburbs where densities are at their lowest. Even where plots are very large, as in
the Spearwood example, the very large lots are completely covered by very large houses. The
problem occurs in both low and moderately high-density areas.

The role of local planning regulations
Given the clear-cut spatial and temporal characteristics of the phenomenon described, what has
been the role of local planning regulations in the process of change? Did they require it or merely
allow it? The parameters that have changed, for example lot coverage and distances between
dwellings and lot boundaries are the very quantities that such regulations normally deal with.

                                                        The 11th National Street Tree Symposium 2010

                                                                                                     59
What is remarkable is how the diminution of the size of the backyard has been occurring over the whole of Australia. This is despite a significant variation in both the scope and details of plans and regulatory instruments across the many planning authorities. As the problem appears to be national in its scope, the first place to look for answers is the guidance given by the federal government. Between 1977 and 1995 it showed concern with how residential development could exhibit affordability and amenity, resulting in several versions of the Australian Model Code for Residential Development (AMCORD). The last was AMCORD 1995 (Green Street Joint Venture, 1995). This opted for a private open space provision of a minimum of 20% of the site area. However, an area of space in aggregate may not equate to the actual area of a backyard as commonly understood. As explained by Figure 5, a narrow strip around a house can amount to 34- 48% of the lot. The provisions therefore included an additional minimum dimension for a useful backyard, the principal area of 25 m2. The minimum linear dimensions were 4 m x 4 m. What is remarkable is not only how small these sizes are compared with the dimensions of older suburban yards given in Table 1, but also that they are smaller than the yard sizes for the more recent suburban examples given in Table 3. No empirical justification was offered for these figures. AMCORD was only advisory and there has been no equivalent initiative at federal level since. Requirements for residential private open space are largely enforced through building and development codes by state governments and local councils. There are certain parameters that nearly all codes, where they exist, specify, no matter how simple they are. Most codes specify maximum requirements for lot coverage as a total percentage of lot area. A maximum figure of 50% is very common. As is demonstrated by Figure 5 and the data in the Tables, this is insufficient to prevent the erosion of the backyard. To maintain a useful size of backyard, the upper limit would need to be at most 40%, ideally 30%. In addition, there is normally a minimum distance required between the edge of a building and the edge of the lot. At the sides and rear boundaries, this minimum distance is usually just 1-2 m. To maintain a proper size and shape of backyard of the dimension set out in Table 1, a rear setback of at least 8-10 m would be necessary. In addition, the codes normally require that a dwelling must be set back a certain distance from the lot boundary adjoining the road reservation, typically 4-6m. The requirement for a large amount of space to the front of dwellings is a tradition that is maintained in the newer suburbs and is a major contributor to low residential densities. Consequently, the space at the front now often exceeds that at the back. New South Wales Mount Druitt lies within the Blacktown LGA. During the 1980s and 1990s, there were no minimum requirements for private open space provision and therefore nothing to prevent the situation in the example off Meacher Street described. In 2006, the Council introduced the Blacktown Development Control Plan (Blacktown 2006) which specified a minimum private open space provision of 80 m2 behind the building line containing a minimum space of 6m x 4m. Although this step could be seen as correcting the previous situation, its content is not very generous compared to the backyard sizes in the older suburbs. Queensland Except where varied by an approved local plan, all new housing in Queensland is subject to the Queensland Development Code (Queensland, 2007). The Code specifies minimum building clearances around the boundaries of a lot. These vary according to circumstance but in no case exceed 2 m. The maximum site coverage permitted for the dwelling footprint is 50%. For lots under 450 m2 in area, an outdoor space is required at the rear of the dwelling with a minimum area of 16 m2 and minimum dimensions of 4 m x 4 m, reflecting the AMCORD principal area. What is interesting here is, firstly, that the idea that it is proper to for a Code to specify such space is conceded and, secondly, how small it is. For lots greater in area than 450 m2 no minimum dimensions for a rear yard are specified at all. The Springfield Lakes example lies just over the Brisbane City boundary within the Ipswich City LGA. Its design was regulated by the Springfield Lakes Design Manual (Ipswich, 1997) which was drawn up jointly by the Council and the developers. Its expectation is “predominately private yards” but the lot coverage maximum is given as 50-60%, in excess of the Queensland code. Later in the manual there is a specific requirement for provision for “subtropical outdoor living”: an “indoor/ outdoor roofed room accessible from the main living area and exposed to natural ventilation and winter sun”. However, the minimum area is only 25 m2, or 12 m2 if a deck, with no requirement for planting. The 11th National Street Tree Symposium 2010 60
Western Australia
Provisions for the control of suburban form in Western Australia arguably represent some of the
highest standards in Australia to date. Moreover, nearly all the current urban expansion of the
greater Perth region is now in the form of master-planned estates. Western Australia’s design
policy, Liveable Neighbourhoods (WPAC, 2004) was, and possibly still is, the only one in the
country that has actually tried to ensure that all urban form is laid out in accordance with a
comprehensive design vision. It is now compulsory for all new development in Western Australia to
comply with the code. However, it does not regulate the design of dwellings and the disposition
within the lot. These matters are covered by the separate Residential Design Codes of Western
Australia (WPAC, 2002) known as the R-Codes.
The R-Codes recognise the importance of private open space around the dwelling. The open
space referred to includes that at the front and sides of the dwelling as well as that at the rear and
so, sensibly, the codes require the provision of an outdoor living area within it. They do not say
explicitly that the outdoor living area should be to the rear, or in another location where the users
would enjoy privacy. The objectives are consistent with large backyards but, as with other
examples discussed, the problem comes not with the general intentions but with the actual
quantities specified. Minimum areas of outdoor space around the house range from 16m2, for lots
up to 200m2, to 36m2, for lots up to 580m2. Above 580m2 no minimum value is specified.
Unfortunately, as we have seen at Spearwood WA, the lots over 600m2 now present some of the
most extreme cases and are direly in need of a minimum standard.
Minimum site coverages for the outdoor living space range from 45% to 50%. However, we have
already seen a narrow strip around the house can easily absorb both this proportion and also the
minimum area figures of 24-36 m2. A specification of minimum width and length is, therefore,
essential. In this case, it is only 4m x 4m, possibly taking its cue from the AMCORD provisions.
Although the sentiments in the R-Codes are very positive, their translation into quantities is
minimalist.

Conclusions
Up until the 1980s, the physical form of the Australian suburb was characterised by detached
houses taking up a third, or less, of the lot and facilitating a large backyards of 150m2 to 400m2.
Such spaces accommodate a wide range of activities but their role is not confined to the individual
lot. Planted areas adjacent to dwellings not only facilitate a pleasant outlook for the occupants but
also provide shade from the sun and assist the natural ventilation of the house. They also provide
a secure play area for young children and space for social facilities for all ages. The backyards
coalesce to form contiguous planted areas to the rear of properties which are important for
biodiversity, sustainable drainage, an equable microclimate and the sequestration of carbon
dioxide and other pollutants.
During the 1990s, the physical form of new suburban development in Australia changed
dramatically. Houses with large backyards ceased to be built. Suburban form since then has been
characterised by dwellings which cover at least 40% of the lot. Such houses have a deep or square
plan with minimum wall length, few windows, an integral garage, and often single-storey. These
trends have resulted in a diminution of the backyard in both shape and total area. This has
reduced the amenity of the property in terms of outlook from the dwelling and facilities for outdoor
recreation around the home, especially for young children. However, the disadvantages go well
beyond the lifestyles of the occupants. There is a loss of biodiversity and an increase in run-off of
storm water. The microclimate becomes hotter and this, in turn, requires more air-conditioning and
increased energy use. Moreover, it represents a permanent change in building form that cannot be
corrected later.
There is no evidence that this trend has been brought about directly by policies of urban
consolidation. It is to be found in lower-density outer suburbs located a considerable distance from
city centres. Although lot areas have become smaller overall, the phenomenon is to be found at all
lot sizes. Local policies and planning regulations have not explicitly required small backyards. The
provisions for private open space in development codes are minima not maxima. Had developers,
property owners or builders, or any other parties involved, wished to continue to provide backyards
on the scale seen before the 1990s, there was nothing in the codes to prevent them from doing so.
However, whatever may have been the intention behind the codes, there was nothing in them to
prevent the reduction in the size of private open space that has occurred. They have contained no
provisions that would have retained the large backyards.

                                                        The 11th National Street Tree Symposium 2010

                                                                                                     61
The environmental disadvantages of the reduction in private open space have been set out. However, this should not be seen as then end of the story. The issue begs many questions for both further research and political action. It is a topic on which, hopefully, future enquiry and debate can be focussed with advantage. References Australian Bureau of Statistics (2004) Building Approvals, catalogue no. 8731.0, Canberra: Australian Bureau of Statistics. Australian Bureau of Statistics (2005) Year Book Australia no. 87, catalogue no. 1301.0, Canberra: Australian Bureau of Statistics. Blacktown City Council (2006) Blacktown Development Control Plan, (Blacktown NSW). Cannon, A. (1999) The Significance of Private Gardens for Bird Conservation, Bird Conservation International, 9, pp. 287-297. Coutts, A. M., Beringer, J. & Tapper, N.J. (2007) Characteristics influencing the variability of urban CO2 fluxes in Melbourne, Australia, Atmospheric Environment, 41, pp. 51-62. Cunningham, C. & Auster, M. (1996) Environmental Design: An Introduction for Urban Planners, (University of New England, Australia). Daniels, G. D. & Kirkpatrick, J. B. (2006) Does Variation in Garden Characteristics Influence the Conservation of Birds in Suburbia? Biological Conservation, 133, pp. 326-335. Gilbert, O. L. (1991) The Ecology of Urban Habitats, (London, Chapman & Hall). Golubiewski N. E. (2006) Urbanization increases grassland carbon pools: Effects of landscaping in Colorado's front range, Ecological Applications, 16, pp. 555-571. Green Street Joint Venture (1995) AMCORD (1995 and Practice Notes, Edition 3 AGPS, Canberra. Head, L. and Muir, P. (2007) Backyard: nature and culture in suburban Australia, University of Wollongong Press, Wollongong. Halkett, I. (1976) The Quarter-Acre Block. Australian Institute of Urban Studies, Canberra. Hall, T. (2006) A Plea for Front Gardens. Urban Design (97) 14-16. Hall, T. (2007a Where Have All the Gardens Gone? An Investigation into the Disappearance of Back Yards in the Newer Australian Suburb, Urban Research Program Research Paper, (Brisbane, Griffith University). Hall, T. (2007b) Turning a Town Around: A Pro-active Approach to Urban Design, Blackwell, Oxford Hall, T. (2008) Where Have All the Gardens Gone? Australian Planner, 45(1), pp. 30-37. Hall, T. (2010) The Life and Death of the Australian Backyard, CSIRO Publishing, Melbourne. Ipswich City Council (1997) Springfield Lakes Design Manual, Ipswich Planning Scheme Implementation Guidelines No. 17, (Ipswich City Council with Delfin Lend Lease, Ipswich QLD). Lee, B. E., Hussain, M. & Soliman, B. (1980) Predicting natural ventilation forces upon low rise buildings, ASHRAE Journal, pp. 35-39 Lee, S. S. (1998) Natural Ventilation and Medium Density House Forms in the Tropics, PhD Thesis, Institute of Tropical Architecture, (Townsville, James Cook University). McGuirk, P. M. and Dowling, R. (2007) Understanding Master-Planned Estates in Australian Cities: A Framework for Research, Urban Policy and Research, 25(1), pp. 21-38. McPherson, G., Simpson, J. R., Peper, P. J., Maco, S. E. and Xiao, Q. (2005) Municipal forest benefits and costs in five US cities, Journal of Forestry, pp. 411-416. The 11th National Street Tree Symposium 2010 62
Moore, E. (1981) A prison environment’s demands on health care service demands, Journal of
Environmental Systems, 2(1), pp. 17-34.
Moroney, J. & Jones, D. (2006) Biodiversity space in urban environments: implications of changing
lot size, Australian Planner, 43(4), pp. 22-47.
Nowak D. J. & Crane D. E. (2002) Carbon storage and sequestration by urban trees in the USA,
Environmental Pollution, 116, pp. 381-389.
Owen, J. and Owen, D. F. (1975) Suburban Gardens: England’s most important nature reserve?
Environmental Conservation 2(1) 53-58.
Plant, L. (2006) Brisbane: 'beautiful one day, perfect the next' - is there room for improvement?
TREENET 7th National Street Tree Symposium, Adelaide.
Pouyat R. V., Yesilonis I. D. & Nowak D. J. (2006) Carbon storage by urban soils in the United
States, Journal of Environmental Quality, 35, pp. 1566-1575.
Pyšek, P. (1989) On the richness of central European urban flora, Preslia, 61, pp. 329-334.
Queensland Government (2007) Queensland Development Code, (Brisbane, Queensland
Government).
Seddon, G. (1997) Landprints: Reflections on Place and Landscape, (Melbourne, Cambridge
University Press).
Spurrier, N. J., Magarey, A., Golley, R., Curnow, F. and Sawyer M. G. (2008) Relationships
between the home environment and physical activity and dietary patterns of pre-school children: a
cross-sectional study, International Journal of Behavioral Nutrition and Physical Activity, 5(31),
published online.
Taylor, S., Leach, R. M. and Smith, K. (2006) Utilising urban land 1: the ¼ acre block and the
suburban backyard, in C. Daniels and C. Tait (Eds.) Adelaide: Nature of a City, (Adelaide, Biocity:
Adelaide Centre for Urban Habitats).
Timms, P. (2006) Australia’s Quarter Acre. Miengunyah Press, Melbourne.
Troy, P. (1996) The Perils of Urban Consolidation, Federation Press, Sydney.
Ulrich, R. S. (1981) Natural versus urban scenes: some psychological effects, Environment and
Behaviour, 13, pp. 523-556.
Ulrich, R. S. (1984) Views through a window may influence recovery from surgery, Science, 224,
pp. 420-421.
Western Australian Planning Commission (2004) Liveable Neighbourhoods Edition 3, (Perth,
Government of Western Australia).
Western Australian Planning Commission (2002) Residential Design Codes of Western Australia,
(Perth, Government of Western Australia).

                                                       The 11th National Street Tree Symposium 2010

                                                                                                    63
Table 1 - Dimensions of selected examples from older Australian suburbs
Caringbah Kew East Camp Hill QLD Jannali NSW Hebersham Spearwood
NSW 1900s VIC 1930s 1940s 1950s NSW 1980s WA 1980s
distance from city centre km 21 9 5.7 22 38 17
net density dph 8 11.6 11 13.4 13 9.3
typical front!to!front distance m 35 29 30 32 34 33
average lot area m² 1120 833 628 560 579 670
net average dwelling footprint m² 207 215 165 130 132 196
average net lot coverage % 22 26 27 23 23 30
gross average dwelling footprint m² 283 268 181 198 201 249
average gross lot coverage % 30 33 29 34 35 38
average backyard area m² 419 311 268 220 169 202
average rear setback m 17 19 29 23 12 14Table 2 - Distribution of backyard sizes in the examples of older Australian suburbs
Caringbah Kew East Camp Hill Jannali Hebersham Spearwood
NSW VIC QLD NSW NSW WA
1900s 1930s 1940s 1950s 1980s 1980s
m² % % % % % %
0!49 2 0 0 0 0 9
50!99 4 4 7 0 11 17
100!149 6 7 4 18 32 4
150!199 4 8 11 21 21 22
200!249 6 12 22 34 32 13
250!299 6 23 19 18 4 4
300!349 2 12 19 3 0 22
350!399 2 8 4 3 0 9
400!449 10 12 11 0 0 0
450!499 16 8 4 0 0 0
500!549 18 7 0 3 0 0
550!599 18 0 0 0 0 0
600!649 6 0 0 0 0 0Table 3 - Dimensions of recent examples from outer suburbs
Springfield Mount Mount Druitt Blakeview Smithfield Spearwood
Meadow
Lakes QLD Druitt NSW NSW SA Plains SA WA
Heights VIC
Rooty Hill Meacher St 2000s
distance from city centre km 23 18 38 38 30 30 17
net density dph 16 19 19 18 16 22 14
typical front!to!front distance m 23 24 25 23 25 23 24
average lot area m² 556 393 378 411 492 352 569
average net dwelling footprint m² 231 163 146 171 212 144 281
average net lot coverage % 44 41 39 42 44 42 50
average gross dwelling footprint m² 239 189 169 209 242 155 314
average gross lot coverage % 46 46 45 52 50 46 56
average backyard area m² 113 99 74 74 111 84 46
average rear setback m 6 7 5 4 7 6 4Table 4 - Distribution of backyard sizes in the recent examples from outer suburbs
Mount Druitt Mount Druitt
Springfield Meadow Blakeview Smithfield Spearwood
NSW NSW
Lakes QLD Heights VIC SA Plains SA WA
Rooty Hill Meacher St
m² % % % % % % %
0!49 18 14 30 29 25 25 50
50!99 39 32 48 58 17 45 47
100!149 21 43 16 6 26 15 3
150!199 13 7 6 3 24 8 0
200!249 4 4 0 0 7 3 0
250!299 2 0 0 3 0 5 0
300!349 2 0 0 0 0 0 0You can also read