Model-based comorbidity clusters in patients with heart failure: association with clinical outcomes and healthcare utilization
←
→
Page content transcription
If your browser does not render page correctly, please read the page content below
Gulea et al. BMC Medicine      (2021) 19:9
https://doi.org/10.1186/s12916-020-01881-7

 RESEARCH ARTICLE                                                                                                                                    Open Access

Model-based comorbidity clusters in
patients with heart failure: association with
clinical outcomes and healthcare utilization
Claudia Gulea1,2* , Rosita Zakeri3,4 and Jennifer K. Quint1,2,4

  Abstract
  Background: Comorbidities affect outcomes in heart failure (HF), but are not reflected in current HF classification.
  The aim of this study is to characterize HF groups that account for higher-order interactions between comorbidities
  and to investigate the association between comorbidity groups and outcomes.
  Methods: Latent class analysis (LCA) was performed on 12 comorbidities from patients with HF identified from
  administrative claims data in the USA (OptumLabs Data Warehouse®) between 2008 and 2018. Associations with
  admission to hospital and mortality were assessed with Cox regression. Negative binomial regression was used to
  examine rates of healthcare use.
  Results: In a population of 318,384 individuals, we identified five comorbidity clusters, named according to their
  dominant features: low-burden, metabolic-vascular, anemic, ischemic, and metabolic. Compared to the low-burden
  group (minimal comorbidities), patients in the metabolic-vascular group (exhibiting a pattern of diabetes, obesity,
  and vascular disease) had the worst prognosis for admission (HR 2.21, 95% CI 2.17–2.25) and death (HR 1.87, 95% CI
  1.74–2.01), followed by the ischemic, anemic, and metabolic groups. The anemic group experienced an
  intermediate risk of admission (HR 1.49, 95% CI 1.44–1.54) and death (HR 1.46, 95% CI 1.30–1.64). Healthcare use
  also varied: the anemic group had the highest rate of outpatient visits, compared to the low-burden group (IRR
  2.11, 95% CI 2.06–2.16); the metabolic-vascular and ischemic groups had the highest rate of admissions (IRR 2.11,
  95% CI 2.08–2.15, and 2.11, 95% CI 2.07–2.15) and healthcare costs.
  Conclusions: These data demonstrate the feasibility of using LCA to classify HF based on comorbidities alone and
  should encourage investigation of multidimensional approaches in comorbidity management to reduce admission
  and mortality risk among patients with HF.
  Keywords: Comorbidity, Hospitalization, Mortality, Resource use

* Correspondence: c.gulea18@imperial.ac.uk
1
 Department of Population Health, National Heart and Lung Institute,
Imperial College London, London, UK
2
 NIHR Imperial Biomedical Research Centre, London, UK
Full list of author information is available at the end of the article

                                         © The Author(s). 2021 Open Access This article is licensed under a Creative Commons Attribution 4.0 International License,
                                         which permits use, sharing, adaptation, distribution and reproduction in any medium or format, as long as you give
                                         appropriate credit to the original author(s) and the source, provide a link to the Creative Commons licence, and indicate if
                                         changes were made. The images or other third party material in this article are included in the article's Creative Commons
                                         licence, unless indicated otherwise in a credit line to the material. If material is not included in the article's Creative Commons
                                         licence and your intended use is not permitted by statutory regulation or exceeds the permitted use, you will need to obtain
                                         permission directly from the copyright holder. To view a copy of this licence, visit http://creativecommons.org/licenses/by/4.0/.
                                         The Creative Commons Public Domain Dedication waiver (http://creativecommons.org/publicdomain/zero/1.0/) applies to the
                                         data made available in this article, unless otherwise stated in a credit line to the data.
Gulea et al. BMC Medicine (2021) 19:9 Page 2 of 13
Background January 1, 2019) or at least two outpatient claims on dif-
Heart failure (HF) is currently classified using ejection ferent dates within the study period, with any Inter-
fraction (EF) [1, 2]. There is increasing recognition that national Classification of Diseases, Ninth or Tenth
this does not relay the full picture of HF as a complex Revision [ICD9, ICD10] HF code in any position on the
and heterogeneous syndrome, including both cardiovas- claim. In order to ensure that patients had incident HF,
cular and non-cardiovascular factors implicated in its we required them to have at least 12 months of continu-
pathophysiology and prognosis [3–8]. ous medical coverage with no claim for a HF diagnosis
Previous studies have investigated distinct subgroups before inclusion (baseline period) and 12 months follow-
of HF, but most had strict inclusion criteria (i.e., only up thereafter. The earliest claim was used as the index
hospitalized [9, 10] or registry cohorts [11], heart failure HF diagnosis date when patients were identified using
with preserved (HFpEF) [12, 13] or reduced (HFrEF) outpatient claims alone; alternatively, the index date was
ejection fraction [14], patients enrolled in randomized the date of admission to hospital for hospitalized pa-
controlled trials [RCTs]) [14–17], or included patients tients. Patients with rheumatic HF (ICD9 code 39891,
from specific geographical areas [11], and thus are not ICD10 code I09.81) were excluded as the cause for this
representative of the general Western HF population. type of HF is specifically rheumatic fever, which is infec-
While clinical characteristics related to cardiac structure tious and less likely related to comorbidity burden, in
and function were generally available in such studies, contrast to other causes of HF. Further details are avail-
allowing for detailed characterization, these data are fre- able in Additional file 1: Supplemental Methods and
quently not available in population studies. This limits Table S1.
the possibility of replication across larger cohorts from Comorbidities included other cardiovascular condi-
administrative databases, where such variables are not tions (atrial fibrillation [AF], coronary artery disease
recorded, as well as the generalizability of identified sub- [CAD], peripheral artery disease [PAD], cerebrovascular
groups in a routine clinical setting. accident [CVA], and hypertension), metabolic conditions
As comorbidities are frequent in HF and affect both (diabetes mellitus, obesity), mental health (depression,
outcomes and treatment of patients, there may be op- alcohol misuse disorder), neurological (dementia), can-
portunities to better characterize this population, using cer, peptic ulcer, liver disease, renal failure, anemia, and
routinely collected data. By including a large number of chronic obstructive pulmonary disease [COPD]. These
patients (inpatients and outpatients) identified over a were identified using ICD9 and ICD10 codes recorded
period of 10 years in the United States (US) using med- any time before the diagnosis of HF (obesity and anemia
ical claims data, we aimed to capture and describe co- were assessed in the previous 12 months only as they
morbidity clusters in patients with HF, using a model- are potentially transient conditions).
based approach. We also compared clinical outcomes We captured pharmacy prescription claims for the fol-
(admission to hospital and mortality) and prescriptions lowing: cardioselective and non-cardioselective beta-
for guideline-recommended pharmacological treatments blockers, angiotensin-converting-enzyme inhibitors
and healthcare resource used. We hypothesized that [ACEis] or angiotensin receptor blockers [ARBs], min-
there will be significant differences in both clinical and eralocorticoid receptor antagonists [MRA], thiazide, po-
utilization outcomes between clusters as well as differen- tassium sparing, and loop diuretics (Additional file 1:
tial prescription rates of HF medication. Table S2).
Our main outcome was all-cause hospitalization, de-
Methods fined as the first non-elective admission with at least one
We conducted a retrospective analysis using the Optum- overnight stay, occurring within 1 year of, but not in-
Labs Data Warehouse® (OLDW) [18], which contains cluding the date of HF diagnosis. Secondary outcomes
longitudinal health information on over 100 million included mortality, HF-specific hospitalization, in- and
commercial enrollees representing a diverse mixture of outpatient healthcare resource use, and costs.
ages, ethnicities, and geographies across the US, includ-
ing all 50 states. The administrative claims data in Statistical analysis
OLDW includes medical, pharmacy claims, and labora- Latent class analysis (LCA) [19] was conducted using 12
tory results for commercial and Medicare Advantage comorbidity variables: AF, anemia, CAD, cancer, COPD,
with part D prescription drug coverage patients. The CVA, diabetes mellitus, depression, liver disease, obesity,
study was exempt from institutional review as it in- PAD, and renal failure (Additional file 1: Supplemental
cluded de-identified data. We identified all individuals at Methods – Latent Class Analysis [10, 11, 15]).
least 18 years old with incident HF, defined as having at Maximum-likelihood estimation was used to identify
least one episode of acute HF that resulted in hospital clusters for a range of 2 to 9 groups, and a 5-class model
admission within the study period (January 1, 2008, to was chosen (Additional file 1: Figure S1-S2, Table S3).Gulea et al. BMC Medicine (2021) 19:9 Page 3 of 13
Patients were assigned to each cluster according to their comorbidity, followed by CAD (67.7%), PAD (44.5%),
highest probability of membership to the group. Uncer- and diabetes (43.7%). The majority of patients were
tainty in class membership (Additional file 1: Table S4) was high-school educated or above, 69.5% were White, 14.5%
explored (Additional file 1: Sensitivity analysis [20, 21]). were Black, and less than 20% were Hispanic or Asian.
The differences in baseline characteristics between comor- Prescriptions of guideline-directed HF medication at HF
bidity clusters were presented using chi-squared and diagnosis were relatively low: 46.7% of patients were pre-
Kruskall-Wallis tests as appropriate. We corrected for mul- scribed ACEis/ARBs, 38.4% cardioselective beta-
tiple testing in the tables using the Bonferroni correction blockers, and 15% non-selective beta-blockers. The low-
and carried out post hoc Dunn tests to assess differences. burden cluster was comprised almost entirely of patients
Admission to hospital and mortality were analyzed with less than five comorbidities (93.4% of all patients in
using Cox proportional-hazard regression models to cal- this group), while fewer patients in the anemic (48.9%)
culate hazard ratios (HRs) and 95% confidence intervals and metabolic groups (40.7%) had less than five comor-
(CIs). Univariate Kaplan-Meier curves for admission to bidities. Conversely, the overall burden of comorbidity
hospital are shown stratified per cluster, with differences was greater in the metabolic-vascular and ischemic clus-
between groups tested using the log-rank test and ad- ters with almost all patients in the metabolic-vascular
justed for multiple testing using the Bonferroni correc- group (98%) and a majority in the ischemic group (84.
tion. For admission analysis, patients were followed up 5%) having five or more comorbidities.
for 12 months after receiving a HF diagnosis or censored A five-group solution was the best fit to describe co-
at disenrollment or death. For mortality, patients were morbidity patterns. The five clusters were each charac-
followed up to a censoring date of 1 January 2019, or at terized by a different combination of comorbidities and
disenrollment, whichever came first. This resulted in a socio-demographic factors and named according to the
maximum follow-up time of 120 months (median and dominant features: low-burden, metabolic-vascular, is-
IQR, 30 months, 18–51 months). We assessed the pro- chemic, anemic, and metabolic (Fig. 1). Patients in the
portional hazards assumption using Schoenfeld residual low-burden group had proportionately fewer comorbidi-
plots [22]. Where this assumption was not met, outcomes ties as compared to the other groups. Among these,
were modeled using time-dependent coefficients [23]. All CAD was most common (52.6% of patients). These pa-
models were adjusted for baseline characteristics: age, sex, tients were least likely to have received their HF diagno-
race, education, medical insurance status, place of diagno- sis as an inpatient or to be on any HF medication.
sis (in- or outpatient), HF medications, and comorbidities Almost all patients in the metabolic-vascular cluster had
not used in the clustering step—hypertension, dementia, diabetes (99.7%) and 34.6% were obese. This group also
peptic ulcer, and alcohol misuse disorder. Incidence of had the highest prevalence of renal failure and patients
death was calculated as the number of patients who died on Medicare Advantage versus a commercial insurance
divided by the total person-months. Negative binomial re- plan. The metabolic-vascular group also had the highest
gression models were used to assess the association be- percentage of HF prescriptions overall.
tween comorbidity clusters and the rate of outpatient, The ischemic cluster was the oldest group (median 78
office and emergency room visits, long-term stays, in- years) and had no patients with diabetes, though a simi-
patient admissions, and length of stay during 1-year larly high prevalence of CAD (88.2%), and PAD (76.9%)
follow-up. Rate ratios and 95% CI were calculated, while as the metabolic-vascular group and comparable propor-
adjusting for confounders as mentioned above. For a sub- tion of patients with cardioselective beta-blocker pre-
set of patients with available data, we conducted additional scriptions. The highest proportion of women (63.7%),
analyses adjusting for EF and smoking status and tested cancer (33.1%), and depression (26.4%) was found in the
for interaction between cluster and EF. Additionally, we anemic cluster. This group had an intermediate prescrip-
explored the association between the main outcome and tion rate for prognostic HF medications, as compared to
the absolute number of comorbidities. All tests were per- the other clusters. Patients in the metabolic cluster were
formed 2-sided. Statistical analyses were performed using the youngest among clusters (median age 67 years), all
R v3.6.2 [24]. were diabetic, and more than half were obese (58.2%).
They also had the lowest prevalence of PAD (10.5%),
Results CVA (13.1%), and cancer (12%), with intermediate pre-
Baseline characteristics scription rates for HF medications (Table 1). Across all
We identified 318,384 patients with incident HF between clusters, there was an increase in the number of patients
January 1, 2008, and January 1, 2018. Baseline character- who were prescribed HF medications from baseline to
istics are presented in Table 1. The median age was 73 1 year follow-up, except potassium-sparing diuretics.
years (inter-quartile range 63–80) and 51.4% were fe- The highest increases were seen in MRA prescriptions,
male. Hypertension (95.2%) was the most common though levels were still low overall (between 8.2 and 12%Table 1 Baseline characteristics per comorbidity cluster
Low-burden Metabolic-vascular Ischemic Anemia Metabolic Overall
(n = 83,577) (n = 73,284) (n = 83,283) (n = 14,959) (n = 63,281) (n = 318,384)
Age
Median [IQR] 71 [60, 79] 73 [66, 80] 78 [70, 82] 73 [62, 81] 67 [57, 74] 73 [63, 80]
Sex
Female 42,440 (50.8%) 36,716 (50.1%) 40,818 (49.0%) 9529 (63.7%) 34,017 (53.8%) 163,520 (51.4%)
Gulea et al. BMC Medicine
Male 41,137 (49.2%) 36,568 (49.9%) 42,465 (51.0%) 5430 (36.3%) 29,264 (46.2%) 154,864 (48.6%)
Comorbidities
AF 26,090 (31.2%) 35,031 (47.8%) 44,233 (53.1%) 1968 (13.2%) 16,844 (26.6%) 124,166 (39.0%)
CAD 43,999 (52.6%) 63,890 (87.2%) 73,417 (88.2%) 1771 (11.8%) 32,617 (51.5%) 215,694 (67.7%)
(2021) 19:9
CVA 15,165 (18.1%) 44,157 (60.3%) 58,088 (69.7%) 3691 (24.7%) 8314 (13.1%) 129,415 (40.6%)
PAD 10,766 (12.9%) 56,137 (76.6%) 64,058 (76.9%) 4010 (26.8%) 6676 (10.5%) 141,647 (44.5%)
Hypertension 74,082 (88.6%) 72,855 (99.4%) 81,502 (97.9%) 13,890 (92.9%) 60,897 (96.2%) 303,226 (95.2%)
Anemia 7609 (9.1%) 30,174 (41.2%) 33,804 (40.6%) 14,415 (96.4%) 10,224 (16.2%) 96,226 (30.2%)
Diabetes 281 (0.3%) 73,081 (99.7%) 0 (0%) 2597 (17.4%) 63,263 (100.0%) 139,222 (43.7%)
Obesity 2854 (3.4%) 25,323 (34.6%) 1688 (2.0%) 259 (1.7%) 36,812 (58.2%) 66,936 (21.0%)
Renal failure 3585 (4.3%) 31,489 (43.0%) 16,081 (19.3%) 6059 (40.5%) 9854 (15.6%) 67,068 (21.1%)
COPD 19,045 (22.8%) 37,795 (51.6%) 46,656 (56.0%) 4779 (31.9%) 18,113 (28.6%) 126,388 (39.7%)
Cancer 11,227 (13.4%) 18,097 (24.7%) 25,782 (31.0%) 4947 (33.1%) 7599 (12.0%) 67,652 (21.2%)
Liver disease 4506 (5.4%) 13,861 (18.9%) 8447 (10.1%) 3212 (21.5%) 8353 (13.2%) 38,379 (12.1%)
Peptic ulcer 2274 (2.7%) 5168 (7.1%) 5418 (6.5%) 1074 (7.2%) 2089 (3.3%) 16,023 (5.0%)
Dementia 4708 (5.6%) 5905 (8.1%) 10,913 (13.1%) 1897 (12.7%) 1567 (2.5%) 24,990 (7.8%)
Depression 7950 (9.5%) 15,019 (20.5%) 14,723 (17.7%) 3947 (26.4%) 9647 (15.2%) 51,286 (16.1%)
Alcohol misuse disorder 2335 (2.8%) 1862 (2.5%) 2845 (3.4%) 866 (5.8%) 1480 (2.3%) 9388 (2.9%)
No. of comorbidities at baseline
2 or less 31,692 (37.9%) 0 (0%) 0 (0%) 374 (2.5%) 2773 (4.4%) 34,849 (10.9%)
3 to 4 46,386 (55.5%) 1413 (1.9%) 12,859 (15.4%) 6939 (46.4%) 27,130 (42.9%) 94,727 (29.8%)
5 to 6 5453 (6.5%) 23,548 (32.1%) 46,257 (55.5%) 6426 (43%) 27,668 (43.7%) 109,352 (34.3%)
7 to 8 46 (0.1%) 33,594 (45.8%) 20,804 (25%) 1151 (7.7%) 5540 (8.8%) 61,135 (19.2%)
Over 9 0 (0%) 14,729 (20.1%) 3363 (4%) 69 (0.5%) 160 (0.3%) 18,321 (5.8%)
Inpatient diagnosis 38,052 (45.5%) 40,079 (54.7%) 45,411 (54.5%) 8057 (53.9%) 31,845 (50.3%) 163,444 (51.3%)
(vs. outpatient diagnosis)
Business line
Medicare Advantage 50,158 (60.0%) 58,336 (79.6%) 63,766 (76.6%) 10,467 (70.0%) 37,752 (59.7%) 220,479 (69.2%)
Commercial 33,419 (40.0%) 14,948 (20.4%) 19,517 (23.4%) 4492 (30.0%) 25,529 (40.3%) 97,905 (30.8%)
Race
White 60,104 (71.9%) 48,509 (66.2%) 61,596 (74.0%) 9517 (63.6%) 41,694 (65.9%) 221,420 (69.5%)
Page 4 of 13Table 1 Baseline characteristics per comorbidity cluster (Continued)
Low-burden Metabolic-vascular Ischemic Anemia Metabolic Overall
(n = 83,577) (n = 73,284) (n = 83,283) (n = 14,959) (n = 63,281) (n = 318,384)
Black 10,277 (12.3%) 12,043 (16.4%) 9772 (11.7%) 2828 (18.9%) 11,322 (17.9%) 46,242 (14.5%)
Hispanic 5200 (6.2%) 6786 (9.3%) 4711 (5.7%) 1162 (7.8%) 4916 (7.8%) 22,775 (7.2%)
Asian 2064 (2.5%) 1332 (1.8%) 1619 (1.9%) 398 (2.7%) 947 (1.5%) 6360 (2.0%)
Missing 5932 (7.1%) 4614 (6.3%) 5585 (6.7%) 1054 (7.0%) 4402 (7.0%) 21,587 (6.8%)
Gulea et al. BMC Medicine
Education
Less than 12 grade 213 (0.3%) 333 (0.5%) 202 (0.2%) 50 (0.3%) 249 (0.4%) 1047 (0.3%)
High school diploma 26,027 (31.1%) 27,893 (38.1%) 27,614 (33.2%) 5239 (35.0%) 23,724 (37.5%) 110,497 (34.7%)
Less than bachelor degree 44,827 (53.6%) 37,696 (51.4%) 44,452 (53.4%) 7643 (51.1%) 33,086 (52.3%) 167,704 (52.7%)
(2021) 19:9
Bachelor degree plus 11,994 (14.4%) 6811 (9.3%) 10,511 (12.6%) 1918 (12.8%) 5801 (9.2%) 37,035 (11.6%)
Missing 516 (0.6%) 551 (0.7%) 503 (0.6%) 109 (0.7%) 421 (0.7%) 2101 (0.7%)
Income (in US dollars)
< $40,000 23,672 (28.3%) 25,282 (34.5%) 27,664 (33.2%) 4762 (31.8%) 20,137 (31.8%) 101,517 (31.9%)
$40,000–$74,000 21,529 (25.8%) 19,643 (26.8%) 21,849 (26.2%) 3600 (24.1%) 16,672 (26.3%) 83,293 (26.2%)
$75,000–$124,999 17,020 (20.4%) 12,704 (17.3%) 14,310 (17.2%) 2435 (16.3%) 12,621 (19.9%) 59,090 (18.6%)
$125,000–$199,999 6551 (7.8%) 3684 (5.0%) 4341 (5.2%) 891 (6.0%) 4102 (6.5%) 19,569 (6.1%)
$200,000+ 3602 (4.3%) 1360 (1.9%) 1957 (2.3%) 423 (2.8%) 1642 (2.6%) 8984 (2.8%)
Missing 11,203 (13.4%) 10,611 (14.5%) 13,162 (15.8%) 2848 (19.0%) 8107 (12.8%) 45,931 (14.4%)
Medication at baseline
Cardioselective beta-blockers 26,936 (32.2%) 32,949 (45.0%) 36,051 (43.3%) 4351 (29.1%) 22,095 (34.9%) 122,382 (38.4%)
Non-cardioselective beta- 11,602 (13.9%) 13,169 (18.0%) 11,643 (14.0%) 1882 (12.6%) 9463 (15.0%) 47,759 (15.0%)
blockers
ACEi/ARBs 33,005 (39.5%) 41,120 (56.1%) 37,711 (45.3%) 5925 (39.6%) 31,073 (49.1%) 148,834 (46.7%)
MRA 3091 (3.7%) 3893 (5.3%) 2864 (3.4%) 733 (4.9%) 3233 (5.1%) 13,814 (4.3%)
Thiazide 9444 (11.3%) 12,071 (16.5%) 10,997 (13.2%) 1964 (13.1%) 9809 (15.5%) 44,285 (13.9%)
Loop diuretics 19,171 (22.9%) 28,629 (39.1%) 24,597 (29.5%) 4772 (31.9%) 21,361 (33.8%) 98,530 (30.9%)
Potassium-sparing diuretics 44 (0.1%) 90 (0.1%) 71 (0.1%) 23 (0.2%) 72 (0.1%) 300 (0.1%)
Double therapy (ACEi/ARBs + 19,842 (23.7%) 27,291 (37.2%) 24,207 (29.1%) 2990 (20.0%) 18,142 (28.7%) 92,472 (29.9%)
any beta-blocker)
Triple therapy (ACEi/ARB + 1530 (1.8%) 1905 (2.6%) 1273 (1.5%) 179 (1.2%) 1475 (2.3%) 6362 (2.0%)
any beta blocker + MRA)
Abbreviations: IQR inter-quartile range, AF atrial fibrillation, CAD coronary artery disease, CVA cerebrovascular disease, PAD peripheral artery disease, COPD chronic obstructive pulmonary disease, No. number, US United
States, ACEis angiotensin-converting-enzyme inhibitors, ARBs angiotensin receptor blockers, MRA mineralocorticoid receptor antagonists
Page 5 of 13Gulea et al. BMC Medicine (2021) 19:9 Page 6 of 13
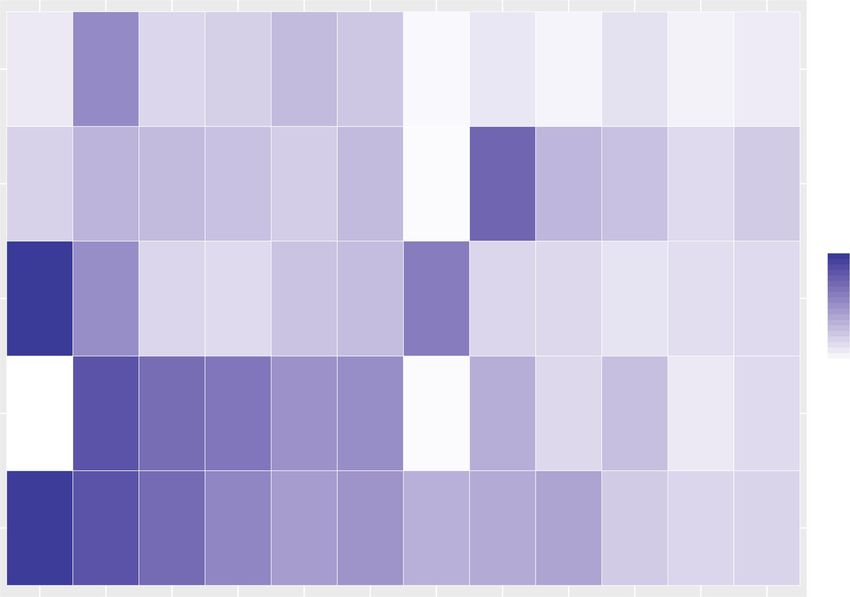
Fig. 1 Five comorbidity clusters identified in patients with heart failure. Tile plot illustrating cluster-specific comorbidity percentages from the
latent class analysis results. CAD, coronary artery disease; PAD, peripheral artery disease; CVA, cerebrovascular accident; AF, atrial fibrillation; COPD,
chronic obstructive pulmonary disease
of patients), followed by loop diuretics and beta-blockers analysis accounting for uncertainty in class membership
(Additional file 1: Figure S3). (Additional file 1: Table S9). The metabolic-vascular and
Ejection fraction (EF) group data were available in 13, ischemic clusters were associated with similarly high risk
560 patients (Additional file 1: Table S5) and smoking of HF-specific admission (increase of 85% and 81%, re-
status in 35,721. Among those with EF data available, we spectively) followed by the metabolic cluster (increase of
observed the highest prevalence of HFpEF in the 14%) (Additional file 1: Table S10). There was an in-
metabolic-vascular cluster. The prevalence of HFrEF was creased risk of admission to hospital with increasing
low in the anemic group but similar between other clus- number of comorbidities (Additional file 1: Table S11).
ters (Additional file 1: Table S6). Crude death rates were lowest in the metabolic and
low-burden groups (3.76 per 1000 person-months [3.68–
Clinical outcomes 3.84] and 5.05 [4.97–5.12] respectively) and highest in the
Overall, 38.7% of patients were admitted to hospital anemic (8.45 [8.21–8.70]) and ischemic groups (10.08
within the first year of follow-up after HF diagnosis; [9.96–10.18]). There was a statistically significant time-
8.8% were HF-specific admissions. A total of 25.1% of varying association between clusters and time-to-death for
the low-burden group and 51.1% of the metabolic- all except the anemic cluster (Additional file 1: Table S12,
vascular group experienced a hospitalization; the Figure S4). Interactions between cluster and EF are pre-
remaining groups had lower admission rates (Fig. 2, sented in Additional file 1: Table S13 and Table S14.
Additional file 1: Table S7). Differences in risk of admis- The metabolic-vascular group remained at the highest
sion persisted after adjusting for baseline covariates, with risk for death (adjusted HR 1.87, 95% CI 1.74–2.01) while
the lowest risk observed in the metabolic group and the anemic and ischemic groups had intermediate risk
highest risk in the metabolic-vascular group, when com- (Table 2, Model 1). The metabolic group displayed the
pared to the low-burden group (Fig. 3). Differences lowest risk of death among groups, and after adjustment
remained significant when adjusting for EF and smoking for smoking status and EF, the estimate was not statisti-
status (Additional file 1: Table S8) and in sensitivity cally significant (HR 0.96, 95% CI 0.84–1.10, p = 0.569).Gulea et al. BMC Medicine (2021) 19:9 Page 7 of 13
Fig. 2 Kaplan-Meier curve showing difference for all-cause admission to hospital comorbidity clusters (within 1-year follow-up)
Healthcare resource use comorbidity patterns reflect variable HF clinical trajec-
In adjusted analyses, all comorbidity clusters exhibited tories and prognosis.
significantly increased rate ratios of healthcare Previous studies have identified subgroups in HF:
utilization, when compared to the low-burden group. Tromp et al. [11] included registry patients from across
The metabolic-vascular and ischemic clusters had the Asia and identified five clusters, which had differential
highest rates of hospitalizations and associated cumula- quality of life and rates of a combined outcome of death
tive length of stay, long-term care stays, and office visits, or HF hospitalization over 1 year follow-up. They simi-
while the anemic group experienced the highest inci- larly identified ischemic and metabolic subgroups, but
dence rate of outpatient visits (Table 3). Cost differences with markedly different characteristics to the current co-
mirrored healthcare utilization, with the metabolic- hort. Notably, the Asian metabolic group had lower rates
vascular cluster exhibiting the highest healthcare costs, of both diabetes (63.5% vs. 100%) and obesity (45.1% vs.
followed by the ischemic, anemic, metabolic, and low- 58%) and was on average 10 years younger than the US
burden groups (Additional file 1: Table S15). group. The Asian ischemic cluster had comparable
prevalence of CAD; however, the US group had a higher
Discussion frequency of non-CV comorbidities such as cancer and
To our knowledge, this is the largest study of model- liver disease. The remaining three clusters identified by
based clustering in HF published to date, using widely Tromp et al. [11], elderly/AF, young, and lean diabetic,
available clinical variables and a population sample did not have direct equivalence in the US, suggesting
which is representative of people living in the US. In clustering of comorbidities may be specific to geograph-
doing so, we identified five distinct comorbidity clusters ical region.
of patients with HF, namely the low-burden, metabolic- Another study, from the US, found four subgroups in
vascular, anemic, ischemic, and metabolic groups. Im- a hospitalized HF population: a common disease group
portantly, these comorbidity clusters had differential characterized by high prevalence of hypertension, a life-
risks of hospital admission and death, indicating that style group with high diabetes and obesity, a renal group,Gulea et al. BMC Medicine (2021) 19:9 Page 8 of 13
Fig. 3 Cause-specific hazard ratios describing association between time to all-cause admission and comorbidity clusters, adjusted for baseline
covariates, patients with missing data excluded (N = 295,972)
and a neurovascular group with increased levels of cere- In our population-wide study, we found two new US-
brovascular disease [10]. The latter group was at most specific clusters: the anemic and metabolic-vascular
increased risk of inpatient mortality and had the highest groups. It is the first time a principally anemic group has
medical cost. However, this cohort may reflect a more been identified using model-based clustering techniques
severe population as only hospitalized patients were in- in HF. The second most frequently diagnosed comorbid-
cluded and was further limited by solely examining in- ity in this group was renal failure, with a prevalence sec-
patient outcomes. ond only to the metabolic-vascular group. Thus, it is not
Table 2 Association between any-cause mortality and comorbidity cluster
Low-burden Metabolic-vascular Ischemic Anemia Metabolic Overall
N = 83,577 N = 73,284 N = 83,283 N = 14,959 N = 63,281 N = 318,030
Deaths, n (%) 18,497 (22.2%) 17,943 (24.5%) 32,709 (39.3%) 4615 (30.9%) 8774 (13.9%) 82,538 (26%)
Person-months 3,666,146 2,270,448 3,246,368 545,985 2,334,907 12,063,855
Deaths per 1000 5.05 (4.97–5.12) 7.9 (7.8–8.02) 10.08 (9.96–10.18) 8.45 (8.21–8.70) 3.76 (3.68–3.84) 6.84 (6.80–6.89)
person-months (95% CI)
Model 1a N = 77,325 N = 68,414 N = 77,425 N = 13,850 N = 58,635 N = 295,649
Deaths, n (%) 17,291 (22.4%) 16,414 (24.7%) 30,510 (39.4%) 4325 (31.2%) 8251 (14.1%) 77,276 (26.1%)
Adjusted HRa (95% CI) 1.00 (Ref) 1.87 (1.74–2.01) 1.24 (1.16–1.33) 1.46 (1.30–1.64) 1.18 (1.09–1.29)
Model 2b 2707 3267 3265 247 2483 N = 12,091
Deaths, n (%) 510 (20.1%) 755 (24.6%) 1166 (38%) 98 (28.3%) 281 (12.1%) 3478 (28.8%)
b
Adjusted HR (95% CI) 1.00 (Ref) 1.60 (1.44, 1.79) 1.62 (1.47, 1.80) 1.60 (1.30, 1.96) 0.96 (0.84, 1.10)
Abbreviations: CI confidence interval, HR hazard ratio, ref. reference
a
Adjusted for age, sex, race, education, medical insurance status, whether diagnosis was gained inpatient or in outpatient and HF medications; time-varying
coefficient model; excludes patients with missing data on race (21,557) and education (2097)
b
Adjusted for age, sex, race, education, medical insurance status, whether diagnosis was gained inpatient or in outpatient, HF medications, ejection fraction,
smoking status; proportional hazards met; excludes patients with missing data on race (21,557), education (2097), ejection fraction (304,477), and smoking
status (282,333)Gulea et al. BMC Medicine (2021) 19:9 Page 9 of 13
Table 3 Association between healthcare utilization and comorbidity cluster within 1 year of HF diagnosis
Rate ratio (95% CI)
Unadjusted RR (95% CI) Model 1a Model 2b
N = 314,936 N = 292,768 N = 11,955
Outcome and comorbidity cluster
Outpatient visits
Low-burden Ref. Ref. Ref.
Metabolic-vascular 2.33 (2.30, 2.36) 2.01 (1.98, 2.04) 1.96 (1.84, 2.08)
Ischemic 1.91 (1.89, 1.93) 1.73 (1.71, 1.75) 1.70 (1.60, 1.81)
Anemia 2.32 (2.26, 2.37) 2.11 (2.06, 2.16) 1.89 (1.67, 2.14)
Metabolic 1.24 (1.22, 1.25) 1.17 (1.15, 1.20) 1.13 (1.06, 1.21)
Office visits
Low-burden Ref. Ref. Ref.
Metabolic-vascular 1.29 (1.28, 1.31) 1.32 (1.31, 1.33) 1.23 (1.17, 1.28)
Ischemic 1.30 (1.29, 1.31) 1.35 (1.34, 1.37) 1.28 (1.23, 1.34)
Anemia 1.15 (1.13, 1.17) 1.16 (1.15, 1.18) 1.26 (1.16, 1.38)
Metabolic 1.08 (1.07, 1.09) 1.05 (1.04, 1.06) 1.05 (1.00, 1.10)
Long-term care stays
Low-burden Ref. Ref. Ref.
Metabolic-vascular 2.87 (2.78, 2.96) 2.54 (2.46, 2.62) 2.75 (2.32, 3.26)
Ischemic 3.06 (2.95, 3.14) 2.26 (2.19, 2.33) 2.38 (2.01, 2.82)
Anemia 2.22 (2.10, 2.33) 1.77 (1.67, 1.86) 2.41 (1.81, 3.21)
Metabolic 1.02 (0.98, 1.06) 1.21 (1.17, 1.26) 1.12 (0.90, 1.38)
Hospitalizations
Low-burden Ref. Ref. Ref.
Metabolic-vascular 2.86 (2.78, 2.96) 2.11 (2.08, 2.15) 2.02 (1.86, 2.19)
Anemia 2.22 (2.78, 2.96) 1.64 (1.59, 1.68) 1.85 (1.59, 2.16)
Ischemia 3.04 (2.95, 3.14) 2.11 (2.07, 2.15) 1.99 (1.83, 2.17)
Metabolic 1.01 (0.97, 1.05) 1.07 (1.04, 1.09) 1.09 (0.99, 1.19)
Length of stay for hospitalizations
Low-burden Ref. Ref. Ref.
Metabolic-vascular 2.70 (2.97, 3.08) 2.58 (2.52, 2.65) 2.60 (2.28, 2.95)
Ischemic 2.43 (2.37, 2.49) 2.48 (2.41, 2.54) 2.44 (2.14, 2.77)
Anemia 2.39 (2.29, 2.50) 2.08 (2.01, 2.16) 2.29 (1.85, 2.80)
Metabolic 1.25 (1.21, 1.27) 1.09 (1.06, 1.13) 1.17 (1.00, 1.35)
Abbreviations: CI confidence interval, RR rate ratio, ref. reference
a
Adjusted for age, sex, race, education, medical insurance status, whether diagnosis was gained inpatient or in outpatient and HF medications; patients with
missing data were excluded
b
Adjusted for age, sex, race, education, medical insurance status, whether diagnosis was gained inpatient or in outpatient and HF medications, ejection fraction,
smoking status; patients with missing data were excluded
surprising that these two comorbidities clustered to- for patients in the ischemic group, suggesting this triad
gether, as the cardio-renal anemia syndrome is well- of comorbidities (HF, anemia, renal failure) incurs a
established in HF and has been linked to increased higher clinical burden than that of patients fitting an
hospitalization and worse clinical prognosis as compared older profile with more CV disease (such as the ischemic
to patients without these comorbidities [25–27]. Com- group).
pared to the low-burden cluster, the anemic group was Patients in the metabolic-vascular phenotype had the
at increased risk of both admission and mortality (49% worst prognosis, denoted by the highest risk of admis-
and 46% increased risk, respectively). Surprisingly, the sion and death compared to the low-burden group. The
risk of death in this group was numerically higher than association with admission was significant after adjustingGulea et al. BMC Medicine (2021) 19:9 Page 10 of 13 for HF medications, suggesting that therapies aimed at persisted after adjusting for EF, which also did not act as modifying mortality and morbidity risk and congestion an effect modifier (Additional file 1: Table S8, Table S13, relief do not necessarily decrease admission risk in this Table S14), corroborating previous research showing patient group. Although we did not assess compliance that most comorbidities have a similar impact on both with medical or management of comorbidities, the par- EF-defined HF groups [32]. Although EF has been the ticular combination of high-risk CV (PAD, CAD) and primary framework used to classify patients with HF, non-CV comorbidities (renal failure, diabetes) may in- and the basis for recruitment into therapeutic trials, crease the risk of admission independent of these there are still no proven disease-modifying treatments factors. for up to half of all patients with HF—i.e., those with The metabolic group had the lowest risk of admission preserved EF. Our findings suggest a potential for clin- or death, despite all patients being diagnosed with diabetes ical trials to enroll patients and test therapies based on and over half with obesity. This group was, on average, prognostic comorbidity patterns, not just limiting them the youngest among clusters, which may explain the com- to EF. paratively favorable prognosis. Other studies [28, 29] have Healthcare resource utilization has not previously been reported on the “obesity paradox” in HF where higher reported in clustering studies of HF. Our data demon- BMI appears to act as a protective factor against mortality strate a significant association of comorbidity patterns or admission, though this has been described as either with healthcare utilization in HF. We found that patients wrongly diagnosing HF in obese individuals, or lead time with higher prevalence of CV comorbidities (metabolic- bias (earlier symptom onset attributable to added meta- vascular, ischemic) were more often admitted to hos- bolic demands of obesity/diabetes), which may be plaus- pital, in contrast to the metabolic and anemic patients, ible in a younger HF subgroup. who had comparatively more outpatient visits during Nearly two thirds of our overall cohort had five or follow-up. The lowest utilization rate was observed in more comorbidities, similar to previous reports [30]. the metabolic group. This may partly be explained by The total number of comorbidities varied across clusters the younger age of patients in this group, and/or a low and was highest in those with the poorest prognosis (i.e., requirement for healthcare use for metabolic conditions metabolic-vascular, ischemic subgroups), confirming in the absence of vascular complications (i.e., no CAD, that increases in comorbidity burden worsen prognosis. PAD, and CVA). These data demonstrate a significant Furthermore, there was a stepwise increase in risk of ad- association of comorbidity patterns with healthcare mission to hospital with each incremental rise in num- utilization in HF and may reflect the different intensity ber of comorbidities, and those with over nine of care and surveillance needed for the management of comorbidities were at tripled risk of being admitted to specific comorbidities or variable severity of associated hospital, compared to those with two or less additional HF across the clusters. illnesses (Additional file 1: Table S11). However, individ- The anemic cluster experienced the highest adjusted ual comorbidity counts insufficiently describe the differ- rate of outpatient visits and high mortality. The main ences in clinical burden incurred by comorbid diseases distinguishing features of this cluster (namely anemia- (for example, anemia may be associated with a lower depression-cancer) have been independently linked to level of disability as compared to CAD, but the two dis- increased use of outpatient services, explained partly by eases contribute equally when using a counting ap- care-seeking behaviors, poor medication adherence in proach). Individual comorbidity counts may also fail to depression [33], or undertreatment of HF due to deteri- convey the severity of diseases or interactions between orating in health status in malignancy [34]. Indeed, the comorbidities that may give rise to distinct clinical tra- anemic cluster had among the lowest proportions of jectories. By contrast, identification of specific patterns medication prescriptions across clusters, suggesting less or clusters of comorbidities, as performed in our study, than optimal management of HF. may capture some of these interactions and provide Cost of care was primarily driven by inpatient and more granular information that could identify priorities emergency room visits and was highest in the metabolic- for clinical HF care. vascular profile, intermediate in the anemic and ischemic Furthermore, among patients with EF data available, groups, and lowest in the metabolic and low-burden although we observed some preferential distribution of groups, respectively. The identification of this “hier- HFpEF to the metabolic-vascular or ischemic groups, archy” of cost, associated with common comorbidity pat- and a greater predominance of HFrEF in the low-burden terns, calls for a targeted approach of resource group, none of the clusters mapped perfectly to either allocation: thus, patients fitting profiles characterized by EF group, highlighting the complexity and interrelated- high inpatient use should be the focus of community in- ness of comorbidity in HF (Additional file 1: Table S6) terventions targeting lifestyle changes such as providing [31]. Importantly, differences in admission and survival nutritional advice, encouraging exercise regimens, and
Gulea et al. BMC Medicine   (2021) 19:9                                                                                       Page 11 of 13

compliance with HF medication that may help to pre-           forms of the disease in more recent times, which would
vent admissions to hospital.                                  be difficult to assess.
   Overall, it is challenging to manage patients with HF        We did not have data on severity of HF or control of
with co-occurring disease. Our results emphasize that         comorbidities; however, in outcome analyses, we ad-
the specific knowledge of how comorbidities cluster to-       justed for use of diuretics, which may be considered a
gether and their association with clinical prognosis may      surrogate for the presence of congestion. Due to changes
assist clinicians who manage these complex patients to        in recording of mortality in the OLDW databases in re-
further refine and target their treatment. Arguably, pa-      cent years, we were limited in the possibility of under-
tients within each cluster are more similar, on a group       taking a competing risk analysis for the main outcome
level, compared to those in other clusters—whether            and thus investigate whether risk of admission to hos-
these subgroups may benefit from similar preventative         pital may be overestimated in our study. Despite the po-
and therapeutic plans needs to be evaluated in future         tentially incomplete mortality data, we have performed
prospective studies. Future characterizations of HF may       an analysis of the risk of admission to hospital, account-
benefit from integrating data on comorbidities ideally        ing for the competing risk of death within the first year
derived from large, real-world populations in relevant        of HF diagnosis, which shows a similar result to the
and local geographical settings, in order to derive a more    main analysis (Additional file 1: Table S16 [42, 43]).
nuanced taxonomy, enabling multidimensional and per-            Finally, the aim of our analysis was not to create a novel
sonalized HF care and resource allocation. Furthermore,       prediction model for outcomes in HF, which already exist
our clustering analysis may serve as a hypothesis-            and have been validated. The approach used to derive the
generating paradigm in identifying comorbidity patterns,      comorbidity clusters was unbiased, i.e., data-driven with
which may be improved upon in further studies. It             no a priori theory applied on how we expected the comor-
would be interesting to assess whether membership to          bidities to cluster. This was designed to identify novel, po-
comorbidity cluster changes over time in patients with        tentially “hidden” patterns that may guide clinical
HF and to map their trajectories, similar to Vetrano and      management and resource allocation in a real-world set-
colleagues, who evaluated elderly individuals’ transitions    ting, but concurrently identified prognostic differences.
among multimorbidity clusters over time [35]. A con-          HF patients typically present with a constellation of char-
trolled setting such as a registry where data collection is   acteristics which overlap—this is reflected in our analysis
standardized and collected at specific time points by         where several comorbidities were observed across the five
trained healthcare staff may be more suitable for such an     identified clusters, albeit in different proportions.
investigation.
                                                              Conclusion
Strengths and limitations                                     In this large cohort of patients with HF from the US, we
We included a large number of patients with incident          have demonstrated that electronic healthcare record data
HF from the US, reflective of those who are commer-           may be used to generate a more granular classification of
cially insured or on Medicare Advantage, unlike previous      HF, based on comorbidities and their combinations. We
studies with small sample sizes and restricted inclusion      identified five comorbidity clusters that exhibited differences
criteria. The prevalence of specific risk factors for HF,     in the risks of hospital admission, mortality, and healthcare
such as hypertension and CAD, was marginally higher           resource utilization. These findings suggest an opportunity
compared to other studies of HF [36, 37]. However, we         for future RCTs to incorporate comorbidity patterns in their
included patients from across the US: of all ages, ethnic     enrollment criteria and a need for tailored comorbidity man-
groups, and both sexes, with a similar distribution to        agement and prevention plans to accompany existing
other large national studies [38, 39].                        evidence-based medical therapy for patients with HF, in par-
  There are a number of limitations: diagnoses were           ticular targeting the clusters with the poorest prognosis.
based on ICD codes only, though these have been vali-
dated [40, 41]. The use of administrative data means
diagnoses can be subject to misclassification and meas-       Supplementary Information
                                                              The online version contains supplementary material available at https://doi.
urement error. However, by linking outpatient and hos-        org/10.1186/s12916-020-01881-7.
pital claims, we were able to identify the date of incident
HF and assess comorbidities which were diagnosed prior         Additional file 1: Supplemental Methods. Population. Latent Class
to this, limiting the inclusion of cases where precursors      Analysis. Descriptive Statistics. Negative Binomial Regressions. HF-specific
                                                               admission and mortality analyses. Sensitivity analysis – pseudo-class
of HF may have been incorrectly labeled as HF. Further-        draws. Figure S1. Fit indices for the 2 to 9 class solution models derived
more, changes in diagnostic procedures over time, spe-         using latent class analysis. Figure S2. Partial probabilities of class mem-
cific to HF, such as improvements in echocardiography,         bership for all variables used in deriving the clusters. Figure S3. Prescrip-
                                                               tion patterns for heart failure recommended medications as well as
might have increased likelihood of detecting milder
Gulea et al. BMC Medicine (2021) 19:9 Page 12 of 13
diuretics, from baseline to one-year follow-up, across comorbidity clusters. Author details
1
Figure S4. Hazard ratios (95%CI) for mortality per time group, according Department of Population Health, National Heart and Lung Institute,
to comorbidity cluster. Table S1. List of ICD9 and ICD10 codes used to Imperial College London, London, UK. 2NIHR Imperial Biomedical Research
identify heart failure patients. Table S2. Medication classes captured from Centre, London, UK. 3British Heart Foundation Centre for Research
pharmacy claims. Table S3. Fit statistics for 2-9 latent class models. Table Excellence, King’s College London, London, UK. 4Royal Brompton & Harefield
S4. Median (IQR) probability of group membership for the 5-class solu- NHS Foundation Trust, London, UK.
tion. Table S5. Baseline characteristics according to ejection fraction
group, in patients with data available. Table S6. Distribution of ejection Received: 4 September 2020 Accepted: 7 December 2020
fraction group and smoking status across comorbidity clusters in patients
with data available. Table S7. Frequency of admission to hospital across
comorbidity clusters. Table S8. Association between admission to hos-
pital and comorbidity clusters, adjusted for ejection fraction and smoking References
status. Table S9. Sensitivity analysis results - adjusted association be- 1. Ponikowski P, Voors AA, Anker SD, Bueno H, Cleland JG, Coats AJ, et al. 2016
tween admission to hospital and comorbidity cluster. Results from 20 ESC Guidelines for the diagnosis and treatment of acute and chronic heart
models using imputed class assignments. Table S10. Association be- failure: the Task Force for the diagnosis and treatment of acute and chronic
tween heart failure-specific admission to hospital and comorbidity clus- heart failure of the European Society of Cardiology (ESC) developed with
ters.Table S11. Association between admission to hospital and number the special contribution of the Heart Failure Association (HFA) of the ESC.
of comorbidities. Table S12. Association between mortality and comor- Eur Heart J. 2016;37(27):2129–200.
bidity cluster with interaction between cluster and time. Table S13. As- 2. Yancy CW, Jessup M, Bozkurt B, Butler J, Casey DE, Colvin MM, et al. 2017
sociation between mortality and comorbidity cluster with interaction ACC/AHA/HFSA focused update of the 2013 ACCF/AHA guideline for the
between ejection fraction and cluster. Table S14. Association between management of heart failure: a report of the American College of
mortality and comorbidity cluster with interaction between ejection frac- Cardiology/American Heart Association Task Force on Clinical Practice
tion and cluster. Table S15. Costs associated with healthcare resource Guidelines and the Heart Failure Society of America. J Am Coll Cardiol. 2017;
use, per comorbidity cluster. Table S16. Competing risk analysis. 70(6):776–803.
3. Bui AL, Horwich TB, Fonarow GC. Epidemiology and risk profile of heart
failure. Nat Rev Cardiol. 2011;8(1):30–41.
Abbreviations 4. Chamberlain AM, Boyd CM, Manemann SM, Dunlay SM, Gerber Y, Killian JM,
ACEi: Angiotensin-converting-enzyme inhibitor; AF: Atrial fibrillation; et al. Risk factors for heart failure in the community: differences by age and
ARB: Angiotensin receptor blocker; CAD: Coronary artery disease; ejection fraction. Am J Med. 2020;133(6):e237–e48.
COPD: Chronic obstructive pulmonary disease; CVA: Cerebrovascular disease; 5. He J, Ogden LG, Bazzano LA, Vupputuri S, Loria C, Whelton PK. Risk factors
EF: Ejection fraction; HF: Heart failure; HFrEF: Heart failure with reduced for congestive heart failure in US men and women: NHANES I
ejection fraction; HFmEF: Heart failure with mid-range ejection fraction; epidemiologic follow-up study. Arch Intern Med. 2001;161(7):996–1002.
HFpEF: Heart failure with preserved ejection fraction; LCA: Latent class 6. Komanduri S, Jadhao Y, Guduru SS, Cheriyath P, Wert Y. Prevalence and risk
analysis; MRA: Mineralocorticoid receptor antagonists; PAD: Peripheral artery factors of heart failure in the USA: NHANES 2013 - 2014 epidemiological
disease follow-up study. J Community Hosp Intern Med Perspect. 2017;7(1):15–20.
7. Lawson CA, Solis-Trapala I, Dahlstrom U, Mamas M, Jaarsma T, Kadam UT,
Authors’ contributions et al. Comorbidity health pathways in heart failure patients: a sequences-of-
CG had full access to data and takes responsibility for the integrity and the regressions analysis using cross-sectional data from 10,575 patients in the
accuracy of the data analysis. Concept and design: CG. Acquisition, analysis, Swedish Heart Failure Registry. PLoS Med. 2018;15(3):e1002540.
and interpretation of data: all authors. Drafting of the manuscript: CG. Critical 8. Lawson CA, Zaccardi F, Squire I, Okhai H, Davies M, Huang W, et al. Risk
revision: JKQ and RZ. Final approval to publish: JKQ, RZ, and CG. The authors factors for heart failure: 20-year population-based trends by sex,
read and approved the final manuscript. socioeconomic status, and ethnicity. Circ Heart Fail. 2020;13(2):e006472.
9. Horiuchi Y, Tanimoto S, Latif A, Urayama KY, Aoki J, Yahagi K, et al.
Identifying novel phenotypes of acute heart failure using cluster analysis of
Funding clinical variables. Int J Cardiol. 2018;262:57–63.
CG is funded by a NHLI PhD studentship. 10. Lee CS, Chien CV, Bidwell JT, Gelow JM, Denfeld QE, Creber RM, et al.
Comorbidity profiles and inpatient outcomes during hospitalization for
Availability of data and materials heart failure: an analysis of the US Nationwide inpatient sample. BMC
The data that support the findings of this study are available from Cardiovasc Disord. 2014;14(1):73.
OptumLabs, but restrictions apply to the availability of these data, which 11. Tromp J, Tay WT, Ouwerkerk W, Teng TK, Yap J, MacDonald MR, et al.
were used under license for the current study, and so are not publicly Multimorbidity in patients with heart failure from 11 Asian regions: a prospective
available. Data are however available from the authors upon reasonable cohort study using the ASIAN-HF registry. PLoS Med. 2018;15(3):e1002541.
request and with permission of OptumLabs. Access to these data is only 12. Hedman AK, Hage C, Sharma A, Brosnan MJ, Buckbinder L, Gan LM, et al.
available through entering into an exclusive institutional partnership Identification of novel pheno-groups in heart failure with preserved ejection
agreement with OptumLabs, under which this study was conducted. fraction using machine learning. Heart. 2020;106(5):342–9.
13. Shah SJ, Katz DH, Selvaraj S, Burke MA, Yancy CW, Gheorghiade M, et al.
Ethics approval and consent to participate Phenomapping for novel classification of heart failure with preserved
This study involved analysis of pre-existing, de-identified data. In accordance ejection fraction. Circulation. 2015;131(3):269–79.
with the Health Insurance Portability and Accountability Act, it was exempt 14. Ferreira JP, Duarte K, McMurray JJV, Pitt B, van Veldhuisen DJ, Vincent J,
from Institutional Review Board approval. et al. Data-driven approach to identify subgroups of heart failure with
reduced ejection fraction patients with different prognoses and aldosterone
antagonist response patterns. Circ Heart Fail. 2018;11(7):e004926.
Consent for publication 15. Kao DP, Lewsey JD, Anand IS, Massie BM, Zile MR, Carson PE, et al.
Not applicable. Characterization of subgroups of heart failure patients with preserved
ejection fraction with possible implications for prognosis and treatment
Competing interests response. Eur J Heart Fail. 2015;17(9):925–35.
CG and RZ have no conflict of interest. Prof. Quint’s research group has 16. Kao DP, Wagner BD, Robertson AD, Bristow MR, Lowes BD. A personalized
received funds from AZ, GSK, The Health Foundation, MRC, British Lung BEST: characterization of latent clinical classes of nonischemic heart failure that
Foundation, IQVIA, Chiesi, and Asthma UK outside the submitted work, and predict outcomes and response to bucindolol. PLoS One. 2012;7(11):e48184.
grants and personal fees from GlaxoSmithKline, Boehringer Ingelheim, 17. Segar MW, Patel KV, Ayers C, Basit M, Tang WHW, Willett D, et al.
AstraZeneca, Bayer, and Insmed outside the submitted work. Phenomapping of patients with heart failure with preserved ejectionGulea et al. BMC Medicine (2021) 19:9 Page 13 of 13
fraction using machine learning-based unsupervised cluster analysis. Eur J
Heart Fail. 2020;22(1):148–58.
18. OptumLabs. OptumLabs and OptumLabs Data Warehouse (OLDW)
Descriptions and Citation. Eden Prairie: np PDF Reproduced with permission
from OptumLabs; 2019.
19. Linzer DA, Lewis JB. poLCA: an R package for polytomous variable latent
class analysis. J Stat Softw. 2011;42(10):1–29.
20. Wang C-P, Hendricks Brown C, Bandeen-Roche K. Residual diagnostics for growth
mixture models: examining the impact of a preventive intervention on multiple
trajectories of aggressive behavior. J Am Stat Assoc. 2005;100(471):1054–76.
21. Rubin DB. Multiple imputation for nonresponse in surveys: John Wiley & Sons; 2004.
22. Schoenfeld D. Partial residuals for the proportional hazards regression
model. Biometrika. 1982;69(1):239–41.
23. Therneau T, Crowson C, Atkinson E. Using time dependent covariates and
time dependent coefficients in the cox model. Survival Vignettes. 2017.
24. Gulea C. Analysis code for the results presented in: Claudia Gulea, Rosita
Zakeri, Jennifer K. Quint: “Model-based comorbidity clusters in patients with
heart failure: association with clinical outcomes and healthcare utilization”.
ZENODO DOI. https://doi.org/10.5281/zenodo.4278086.
25. Anand IS, Gupta P. Anemia and iron deficiency in heart failure: current
concepts and emerging therapies. Circulation. 2018;138(1):80–98.
26. Grote Beverborg N, van Veldhuisen DJ, van der Meer P. Anemia in heart
failure: still relevant? JACC Heart Fail. 2018;6(3):201–8.
27. Silverberg DS, Wexler D, Blum M, Iaina A, Sheps D, Keren G, et al.
Erythropoietin in heart failure. Semin Nephrol. 2005;25(6):397–403.
28. Güder G, Frantz S, Bauersachs J, Allolio B, Wanner C, Koller MT, et al. Reverse
epidemiology in systolic and nonsystolic heart failure: cumulative
prognostic benefit of classical cardiovascular risk factors. Circ Heart Fail.
2009;2(6):563–71.
29. Lavie CJ, Mehra MR, Milani RV. Obesity and heart failure prognosis: paradox
or reverse epidemiology? Eur Heart J. 2004;26(1):5–7.
30. Wong CY, Chaudhry SI, Desai MM, Krumholz HM. Trends in comorbidity,
disability, and polypharmacy in heart failure. Am J Med. 2011;124(2):136–43.
31. Triposkiadis F, Giamouzis G, Parissis J, Starling RC, Boudoulas H, Skoularigis J,
et al. Reframing the association and significance of co-morbidities in heart
failure. Eur J Heart Fail. 2016;18(7):744–58.
32. Ather S, Chan W, Bozkurt B, Aguilar D, Ramasubbu K, Zachariah AA, et al.
Impact of noncardiac comorbidities on morbidity and mortality in a
predominantly male population with heart failure and preserved versus
reduced ejection fraction. J Am Coll Cardiol. 2012;59(11):998–1005.
33. Moraska AR, Chamberlain AM, Shah ND, Vickers KS, Rummans TA, Dunlay
SM, et al. Depression, healthcare utilization, and death in heart failure: a
community study. Circ Heart Fail. 2013;6(3):387–94.
34. Meijers WC, de Boer RA. Common risk factors for heart failure and cancer.
Cardiovasc Res. 2019;115(5):844–53.
35. Vetrano DL, Roso-Llorach A, Fernandez S, Guisado-Clavero M, Violan C,
Onder G, et al. Twelve-year clinical trajectories of multimorbidity in a
population of older adults. Nat Commun. 2020;11(1):3223.
36. Chamberlain AM, St Sauver JL, Gerber Y, Manemann SM, Boyd CM, Dunlay
SM, et al. Multimorbidity in heart failure: a community perspective. Am J
Med. 2015;128(1):38–45.
37. Roger VL. Epidemiology of heart failure. Circ Res. 2013;113(6):646–59.
38. Forman DE, Cannon CP, Hernandez AF, Liang L, Yancy C, Fonarow GC, et al.
Influence of age on the management of heart failure: findings from Get
With the Guidelines-Heart Failure (GWTG-HF). Am Heart J. 2009;157(6):1010–7.
39. Sangaralingham LR, Shah ND, Yao X, Roger VL, Dunlay SM. Incidence and early
outcomes of heart failure in commercially insured and Medicare Advantage
patients, 2006 to 2014. Circ Cardiovasc Qual Outcomes. 2016;9(3):332–7.
40. Li Q, Glynn RJ, Dreyer NA, Liu J, Mogun H, Setoguchi S. Validity of claims-
based definitions of left ventricular systolic dysfunction in Medicare patients.
Pharmacoepidemiol Drug Saf. 2011;20(7):700–8.
41. Quach S, Blais C, Quan H. Administrative data have high variation in validity
for recording heart failure. Can J Cardiol. 2010;26(8):e306–e12.
42. Fine JP, Gray RJ. A proportional hazards model for the subdistribution of a
competing risk. J Am Stat Assoc. 1999;94(446):496–509.
43. Gray B. cmprsk: subdistribution analysis of competing risks. R package
version 2.2-10. https://CRAN.R-project.org/package=cmprsk. 2020.
Publisher’s Note
Springer Nature remains neutral with regard to jurisdictional claims in
published maps and institutional affiliations.You can also read