Volcanic hazard assessment for the Canary Islands (Spain) using extreme value theory
←
→
Page content transcription
If your browser does not render page correctly, please read the page content below
Nat. Hazards Earth Syst. Sci., 11, 2741–2753, 2011
www.nat-hazards-earth-syst-sci.net/11/2741/2011/                                                  Natural Hazards
doi:10.5194/nhess-11-2741-2011                                                                          and Earth
© Author(s) 2011. CC Attribution 3.0 License.                                                    System Sciences

Volcanic hazard assessment for the Canary Islands (Spain) using
extreme value theory
R. Sobradelo1,2 , J. Martı́1 , A. T. Mendoza-Rosas3 , and G. Gómez4
1 Institute
          of Earth Sciences “Jaume Almera”, CSIC, Lluis Sole i Sabaris s/n, 08028 Barcelona, Spain
2 Aon Benfield UCL Hazard Research Centre, Department of Earth Sciences, University College London, Gower Street,
London, WC1E 6BT, UK
3 Universidad Nacional Autónoma de México, Posgrado en Ciencias de la Tierra, Instituto de Geofı́sica, Ciudad Universitaria,

México 04510 D.F., México
4 Departament d’Estadı́stica i Investigació Operativa de la Universitat Politécnica de Catalunya, Jordi Girona 1–3, Edifici C5,

Campus Nord, 08034 Barcelona, Spain
Received: 15 February 2011 – Revised: 15 August 2011 – Accepted: 5 September 2011 – Published: 12 October 2011

Abstract. The Canary Islands are an active volcanic re-            Poisson process to the historical eruptive data of the Canary
gion densely populated and visited by several millions of          Islands to estimate the probability of having at least one vol-
tourists every year. Nearly twenty eruptions have been re-         canic event of a magnitude greater than one in the upcoming
ported through written chronicles in the last 600 yr, suggest-     years. This is done in three steps: First, we analyze the his-
ing that the probability of a new eruption in the near future      torical eruptive series to assess independence and homogene-
is far from zero. This shows the importance of assessing           ity of the process. Second, we perform a Weibull analysis
and monitoring the volcanic hazard of the region in order          of the distribution of repose time between successive erup-
to reduce and manage its potential volcanic risk, and ulti-        tions. Third, we analyze the non-homogeneous Poisson pro-
mately contribute to the design of appropriate preparedness        cess with a generalized Pareto distribution as the intensity
plans. Hence, the probabilistic analysis of the volcanic erup-     function.
tion time series for the Canary Islands is an essential step
for the assessment of volcanic hazard and risk in the area.
Such a series describes complex processes involving differ-
ent types of eruptions over different time scales. Here we         1   Introduction
propose a statistical method for calculating the probabilities
of future eruptions which is most appropriate given the nature     The Canary Islands are one of the major oceanic island
of the documented historical eruptive data. We first charac-       groups of the world and have a long magmatic history, which
terize the eruptions by their magnitudes, and then carry out a     began at the bottom of the ocean more than 40 million years
preliminary analysis of the data to establish the requirements     ago (Araña and Ortiz, 1991). The Canary Islands are an ac-
for the statistical method. Past studies in eruptive time se-      tive volcanic region where all islands except for La Gomera
ries used conventional statistics and treated the series as an     show Holocene volcanic activity. Historical volcanism (last
homogeneous process. In this paper, we will use a method           600 yr) has been reported on the islands of La Palma (1430,
that accounts for the time-dependence of the series and in-        1585, 1646, 1677, 1712, 1949, 1971), Tenerife (1492, 1704,
cludes rare or extreme events, in the form of few data of large    1706, 1798, 1909) and Lanzarote (1730–1736, 1824). In all
eruptions, since these data require special methods of anal-       cases, they were eruptions of basaltic magmas characterized
ysis. Hence, we will use a statistical method from extreme         by emission of lava flows and construction of scoria cones.
value theory. In particular, we will apply a non-homogeneous          The Canary Islands are a populated ultra-peripheral Span-
                                                                   ish region and one of the most popular touristic destinations
                                                                   in Europe. The presence of recurrent historical volcanism
                    Correspondence to: R. Sobradelo                in this region is a good reason to undertake volcanic hazard
                    (rsobradelo@ija.csic.es)                       assessment in order to guarantee the safety of its inhabitants

Published by Copernicus Publications on behalf of the European Geosciences Union.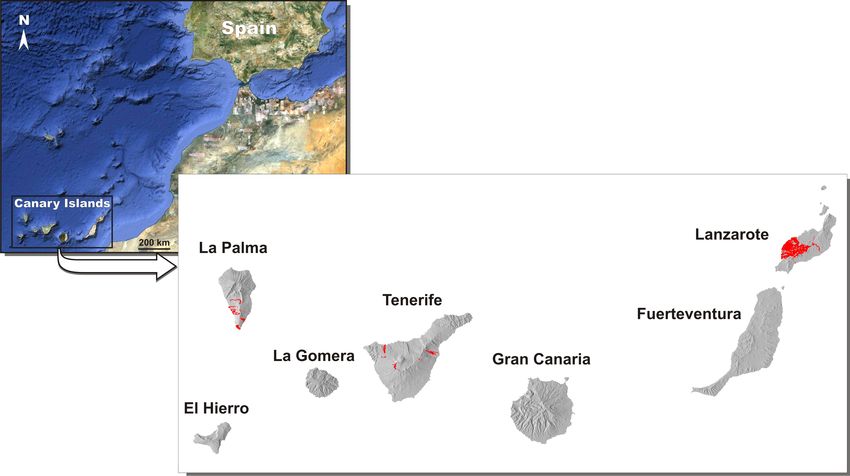
2742                                                                   R. Sobradelo et al.: Volcanic hazard for the Canary Islands

and of its numerous visitors. Volcanic hazard is the probabil-        In this paper we use the historical volcanism to perform
ity of any particular area to be affected by a destructive vol-    hazard assessment for the Canary Islands. Due to the limita-
canic event within a given period of time (UNESCO, 1972).          tions inherent in the available data, including its short sam-
As for any active volcanic region, volcanic hazard assess-         ple time and incomplete reporting of small and intermedi-
ment on the Canary Islands requires knowing how volcanism          ate magnitudes as well as uncertainties in the age, intensity
has behaved in the past and determining the recurrence of          and magnitude of the eruptions, we will use a method for
volcanic eruptions. The first can be approached by detailed        the best estimate of the volcanic hazard based on a Non-
physical volcanology studies of past eruptions, in particular      Homogeneous Poisson process with a Generalized Pareto
of those for which there exist historical chronicles (Table 1).    Distribution (GPD) as intensity function (NHGPPP) (Coles,
The recurrence or eruption frequency needs to be based on          2001; Mendoza-Rosas and De la Cruz-Reyna, 2008, 2010).
historical records and precise dating of older events. Unfor-      This method has already been applied to other volcanoes
tunately, this is not an easy task as the reconstruction of the    for which little or incomplete data exists, like the Citlalte-
geological record of this volcanic region is far from accurate,    petl volcano database with only six eruptions, or El Chichón
lacking systematic dating of recent eruptions, and the histor-     volcano with 12 eruptions (Mendoza-Rosas and De la Cruz-
ical records are imprecise and lack detail in some cases.          Reyna, 2008, 2010). This is the case with our time series
   Despite these limitations, we can still analyse the volcanic    of volcanic records for the Canary Islands. The methodol-
hazard using the available historical data, covering the last      ogy does not require stationarity or completeness for the full
600 yr since the Spaniards occupied the archipelago. A set         eruptive series, since it depends on the number of excesses of
of fifteen relatively well documented eruptions form the his-      eruptions large enough to represent the behavior of the stud-
torical volcanism of the Canary Islands (Table 2). A few           ied volcanoes.
other eruptions have also been reported in historical times           First, we analyze the historical eruptive series to assess
but their age and location is imprecise and do not constitute      independence and homogeneity of the process. Second, we
reliable information. Most of the historical eruptions in the      perform a Weibull analysis of the distribution of repose time
Canary Islands have been short lived (from few weeks to few        between successive eruptions. Third, we analyze the non-
months) basaltic, strombolian to violent strombolian erup-         homogeneous Poisson process with a generalized Pareto dis-
tions, which have generated scoria cones of different sizes        tribution as intensity function.
and lava flows of different extent (Romero, 1991). All the
eruptions occurred in historical time, which goes from 1402
to present, have typically been separated a few tens of years      2     Geological setting
but in some cases some have occurred in a very narrow pe-
                                                                   The Canary Islands are a roughly linear 500 km long chain
riod of time (e.g. Arafo, Fasnia, Siete Fuentes in Tenerife), or
                                                                   grown on the passive margin of the African Plate within
have lasted for some years (Timanfaya eruption in Lanzarote,
                                                                   the eastern Central Atlantic Ocean (Fig. 1). The Canarian
1730–1736).
                                                                   archipelago is the result of a long volcanic and tectonic activ-
   Studies of volcanic time series have been done using
                                                                   ity that started at around 60 Ma ago (Robertson and Stillman,
stochastic principles to study eruption patterns on specific
                                                                   1979; Le Bas et al., 1986; Marinoni and Pasquaré, 1994).
volcanoes or volcanic groups (Wickman, 1976; Reyment,
                                                                      Several contrasting models have been proposed to explain
1969; Klein, 1982; De la Cruz-Reyna, 1991, 1993). Bebbing-
                                                                   the origin of the Canary Islands. These include a hotspot ori-
ton and Lai (1996a) applied a Weibull renewal model to de-
                                                                   gin (Schmincke, 1982; Hoernle and Schmincke, 1993; Car-
scribe the patterns of New Zealand volcanoes. Other studies
                                                                   racedo et al., 1998), a propagating fracture from the Atlas
used transition probabilities of Markov chains (Carta et al.,
                                                                   (Le Pichon and Fox, 1971; Anguita and Hernán, 1975), and
1981; Aspinall et al., 2006; Bebbington, 2007), change-point
                                                                   mantle decompression melting associated with uplift of tec-
detection techniques (Mulargia et al., 1987; Burt et al., 1994),
                                                                   tonic blocks (Araña and Ortiz, 1991). However, each and
Rank-order statistics (Pyle, 1998), Bayesian analysis of vol-
                                                                   every one of the latter hypotheses presents some inconsisten-
canic activity (Ho, 1990; Solow, 2001; Newhall and Hoblitt,
                                                                   cies with the local and regional geology. A unifying model
2002; Ho et al., 2006; Marzocchi et al., 2008; Sobradelo
                                                                   has been proposed by Anguita and Hernán (2000) who con-
and Martı́, 2010), non-homogeneous models (Ho, 1991; Beb-
                                                                   sider the existence of a residual of a fossil plume under
bington and Lai, 1996b), a mixture of Weibull distributions
                                                                   North Africa, the Canary Islands, and western and central
(Turner et al., 2007), geostatistical hazard-estimation meth-
                                                                   Europe defined through seismic tomography (Hoernle et al.,
ods (Jaquet et al., 2000; Jaquet and Carniel, 2006), and a mix-
                                                                   1995). Thus, volcanism is assumed to occur where an effi-
ture of exponential distributions (Mendoza-Rosas and De la
                                                                   cient fracture system allows the magma to ascend (Anguita
Cruz-Reyna, 2009, 2010; Dzierma and Wehrmann, 2010a,b).
                                                                   and Hernán, 2000), i.e. the central European rift system,
Extreme-value methods have been applied to geological and
                                                                   the volcanic provinces of the westernmost Mediterranean
historical eruption time series combined (Mendoza-Rosas
                                                                   (Balearic and Alborán basins), Iberia, the Canary Islands and
and De la Cruz-Reyna, 2008, 2010) and historical series of
                                                                   Cape Verdes (Hoernle et al., 1995).
large volcanic magnitudes (Coles and Sparks, 2006).

Nat. Hazards Earth Syst. Sci., 11, 2741–2753, 2011                             www.nat-hazards-earth-syst-sci.net/11/2741/2011/
R. Sobradelo et al.: Volcanic hazard for the Canary Islands 2743
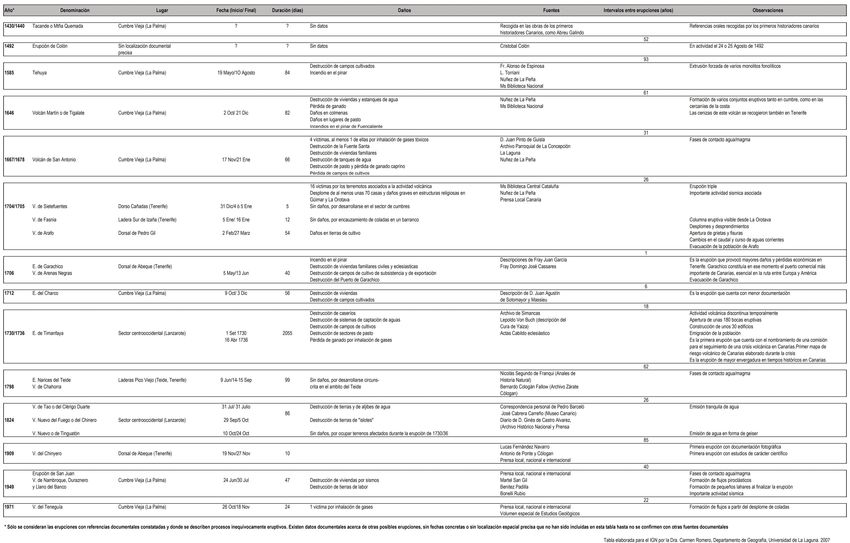
Fig. 1. Distribution of historical volcanism in the Canary Islands.
Although all islands except for La Gomera show Holocene from the geological maps at 1:25000 of IGME (Spanish Ge-
volcanic activity, historical volcanism has been restricted to ological Survey, www.igme.es) and from a field revision of
the La Palma, Lanzarote and Tenerife islands (see Fig. 1). the historical eruptions that we have undertaken in this study.
In all cases, historical eruptive activity has been related to In compiling the historical dataset of volcanic eruptions
basic magmas ranging in intensity from strombolian to vio- for the Canary Islands, only those eruptions with well-
lent strombolian, originating scoria cones and lavas. In most documented references and clearly described eruptive pro-
cases, historical eruptions occurred on the active rift zones cesses have been considered. There are documents that make
along eruptive fissures occasionally generating alignments reference to other possible eruptions, but they will not be in-
of cones. The duration of the eruptions ranged from a few cluded until further documentation sources are confirmed.
weeks to a few months, except in the case of the Timanfaya
The original dataset includes fifteen volcanic eruptions
eruption in 1730 that lasted for six years. The total volumes
historically documented between 1430 and 1971 on three
of extruded magma range from 0.01 to >1.5 km3 , in the case
different islands (Lanzarote, Tenerife, La Palma). We have
of Timanfaya. The eruption sequences that may be deduced
also considered the eruption of Montaña Cangrejo in Tener-
from the successions of deposits differ from one eruption to
ife (Erupción de Colón in Table 1), that is supposed to
another and reveal that eruptions did not follow a common
have been observed by Columbus on his way to America
pattern. In all cases, the resulting volcanic cones were con-
and that has now been confirmed by Carracedo et al. (2007,
structed during single eruptive episodes (i.e. they must be re-
2011). We have considered the eruptions of Siete Fuentes
ferred to as monogenetic), commonly including several dis-
(from 31 Decemebr 1704 to 5 January 1705) and Fasnia
tinctive phases that do not show significant temporal separa-
(from 5 January 1705 to 16 January 1705) in Tenerife as one
tions between them.
unique event. The Arafo eruption (from 2 February 1705
to 27 March 1705) happened later in time and the materials
3 Historical records of volcanic eruptions in the Canary have a slightly different composition than Fasnia and Siete
Islands Fuentes, suggesting that this could be a different eruption.
The eruptions of Tao, Nuevo del Fuego and Tiguantón in
Table 2 shows the data used for this study. It includes fifteen Lanzarote are considered as one unique event. They have
clearly different volcanic eruptions historically documented been listed in Romero (1991) as different episodes but they
between 1430 and 1971 for which the eruption magnitude are clearly related in terms of timing, petrology and loca-
has been computed using existing information on lava and tion of vents on the same eruptive fissure, so we may assume
pyroclasts volume. These data have been compiled from the the three eruptive events were related to the same batch of
original information on Table 1 and complemented with data magma. We consider them as part of the same eruption event
on surface extent and volume of erupted products calculated if the location of the vent is not the same, but the eruptions
www.nat-hazards-earth-syst-sci.net/11/2741/2011/ Nat. Hazards Earth Syst. Sci., 11, 2741–2753, 20112744 R. Sobradelo et al.: Volcanic hazard for the Canary Islands
Table 1. Original table of volcanic eruptions historically documented in the Canary Islands (Romero, 1991).
Nat. Hazards Earth Syst. Sci., 11, 2741–2753, 2011 www.nat-hazards-earth-syst-sci.net/11/2741/2011/R. Sobradelo et al.: Volcanic hazard for the Canary Islands 2745
Table 2. Volcanic Eruptions dataset used in the study for the volcanic hazard assessment of the Canary Islands.
Event Location Volcan Start Date End Date Lava Pyroclasts Magnitude
ID volume volume
(km3 ) (km3 )
1 La Palma Tacante 1430/1440 ? 0.024 0.026 4
2 Tenerife Colon eruption 1492 ? 0.032 0.006 4
3 La Palma Tehuya 19 May 1585 10 Aug 1585 0.015 0.004 4
4 La Palma Tigalate 2 Oct 1646 21 Dec 1646 0.017 0.000 4
5 La Palma Sant Antonio 17 Nov 1677 21 Jan 1678 0.023 0.006 4
6 Tenerife Sietefuentes /Fasnia 31 Dec 1704 16 Jan 1705 0.004 0.002 3
7 Tenerife Arafo 2 Feb 1704 27 Mar 1705 0.035 0.008 4
8 Tenerife Arenas Negras 5 May 1706 13 Jun 1706 0.022 0.014 4
9 La Palma Charco 9 Oct 1712 3 Dec 1712 0.019 0.021 4
10 Lanzarote Timanfaya 1 Sept 1730 16 Apr 1736 1.775 0.000 6
11 Tenerife Chahorra 9 Jun 1798 15 Sept 1798 0.016 0.009 4
12 Lanzarote Tao/ Nuevo del Fuego/ 31 Jul 1824 24 Oct 1824 0.001 0.000 2
Tinguatón
13 Tenerife Chinyero 19 Nov 1909 27 Nov 1909 0.010 0.005 4
14 La Palma Nambroque, Duraznero 24 Jun 1949 30 Jul 1949 0.016 0.050 4
and Llano del Banco
15 La Palma Teneguı́a 26 Oct 1971 18 Nov 1971 0.010 0.005 4
Table 3. Dickey-Fuller Unit Root test.
Volcanic eruptions are natural phenomena where the fre-
quency of the events decreases as their size or magnitude
Test setup:
increases. The fact that the magnitude distribution is irreg-
H0 : Series is not stationary
ular is not necessarily an indication of incompleteness in the
H1 : Series is stationary
reject H0 if p-value < 0.05 catalog. When we are dealing with a historical catalog, it
is very difficult for a high magnitude eruption to go unno-
Results: ticed. Compared with other volcanoes, a catalog of 15 erup-
Dickey-Fuller = −2.5224, p-value = 0.3734 tions in 600 yr seems consistent. There are no records of any
p-value > 5%, not enough statistical evidence to reject more high magnitude eruptions in historical times other than
the hypothesis that the series is not stationary
the high magnitude eruption of Timanfaya. For this reason,
we assume that the catalog for high magnitude eruptions in
historical times is complete. On the other hand, the histor-
have the same age and the composition of the extruded prod- ical records for the oldest low magnitude eruptions are not
ucts indicate they come from the same batch of magma. This as clear and accurate as for the most recent low magnitude
is the case for Tiguantón but not the case for Siete fuentes, eruptions.
Fasnia and Arafo, which have a different magma composi- To deal with the difficulties derived from the possible lack
tion. These criteria have been applied consistently through- of catalog completeness for the Canary Islands, we measure
out the database. the size of each eruption with its magnitude based on the
In order to classify the eruptions and apply the NHGPPP, logarithmic scale for magnitude (Pyle, 2000):
we have calculated for each case the total volume of ex-
truded magma (DRE) based on the volume of exposed ma- M = log10 [mass(tephra + lava)erupted(kg)] − 7
terials (lavas and pyroclastic deposits), so our total volumes We have calculated the total magnitude of each erup-
are minimum estimates (Table 2). Although rapid erosion of tion (in Kg) assuming a density for the basaltic magma of
tephra and uncertain lava flow thicknesses may cause prob- 2850 kg m−3 (Table 2). To account for the possible missing
lems in making accurate calculations, order of magnitude de- data catalog, for which historical records are inaccurate or
terminations still provide a useful comparison between erup- unavailable, observed occurrence rates for magnitudes 4 and
tions. We have computed the volume estimates calculating 6 were used to extrapolate unobserved records using the best
separately the volumes of tephra and lavas for each eruption. fit to the class magnitude values of eruptions estimated with
Tephra and lava volumes have been calculated with the help the power law described by Newhall and Self (1982), which
of a DEM at a resolution of 5 m, the digital geological maps says that the eruption occurrence rate λM (number of erup-
of IGME at 1:25000, and checking extension and thicknesses tions per unit time) of each class magnitude M is related to
variations of the deposits and lavas in the field. the eruption size M as:
www.nat-hazards-earth-syst-sci.net/11/2741/2011/ Nat. Hazards Earth Syst. Sci., 11, 2741–2753, 20112746 R. Sobradelo et al.: Volcanic hazard for the Canary Islands
The family of GPDs describes the behavior of individual
extreme events. It considers observations from a collection of
logλM = a − bM iid random variables where we keep those that exceed a fixed
where a and b are constants that describe the power law de- threshold u. As we increase the threshold, the two-parameter
cay of occurrences with increasing magnitude over a given GPD family represents the limiting behavior of this new col-
time interval. lection of random variables. This makes the family of GPDs
a suitable choice for modeling extreme events.
The EOT method includes all the values of the variable
4 The method: extreme value theory (EVT) that exceed an a-priori established threshold, u, fixed accord-
ing to the model needs, providing a physically based defi-
Volcanic eruption datasets are usually small and the erup- nition of what must be considered an extreme event. The
tive recurrence is usually very long, and as it happens with choice of the threshold value has a strong subjective com-
other natural phenomena like earthquakes, tsunamis etc., the ponent. This random variable is defined by the transformed
higher the magnitude the longer the time interval in between random variable
events. To face this problem of working with small datasets,
and to be able to obtain a mathematical quantification of the Y = X − u,for all X > u (1)
volcanic hazard as accurate as possible, we look for meth-
ods that allow us to work with databases which are small where Y is the excess over the threshold u.
and sometimes incomplete (Coles, 2001; Davison and Smith, The parameter that will be used as random variable to es-
1990; Beguerı́a, 2005). These methods are part of a branch of timate the probability of occurrence of a future eruption, and
statistics called extreme value theory, in which as the name thus the volcanic hazard, will be the time interval T between
implies, extreme values are atypical and rare events located eruptions, also called repose period, together with the mag-
at the tail of the distribution. nitude M.
Just as normal distribution proves to be the important lim- The generalized Pareto distribution can be fitted to data on
iting distribution for sample sums or averages, as is made ex- excesses of high thresholds by a variety of methods including
plicit in the central limit theorem, another family of distribu- the maximum likelihood method (ML) and the method of
tions proves important in the study of the limiting behaviour probability weighted moments (PWM). We use the Davison
of sample extrema. This is the family of extreme value dis- and Smith (1990) graphical method.
tributions. Extreme value theory and the central limit theory The NHGPPP is also appropriate for linking historical and
are derived in a similar manner. Both consider the limiting geological records, should they become available in the fu-
distributions of independent identically distributed (iid) ran- ture. So this method sets the base for future analyses and
dom variables under an affine transformation. In the absence updates should geological records were found.
of empirical or physical evidence for assigning an extreme As a first step before model fitting is undertaken, a num-
level to a process, an asymptotic argument is used to gen- ber of exploratory graphical methods provide useful prelim-
erate extreme value models. But extreme values are scarce, inary information about the data and in particular, their tail.
making it necessary to estimate levels that are much higher We explain these methods in the next section. To apply the
than those that have already been observed. In fact, the goal NHGPPP for volcanic hazard assessment, we first need to
of an extreme value analysis is to quantify the statistical be- examine the data to assess independence between successive
havior of processes at unusually high levels. In particular, events and homogeneity of the process. We will use a serial
extreme value analysis requires an estimation of the proba- correlation scatterplot to test for independence and to test for
bility of events that are more extreme than any that have ever homogeneity, we first assess the stationarity by using the au-
been observed. This implies an extrapolation from observed tocorrelation function (ACF) and the Dickey-Fuller unit root
levels to unobserved levels. Extreme value theory provides test. These tests should be done on a portion of the time series
a family of models to make such extrapolation. In fact there in which no significant eruption data are missing, which in
are no more serious competitor models than those provided most cases is the historical eruption dataset of intermediate-
by extreme value theory (Coles, 2001). to-high eruption magnitudes.
There are different extreme value theory methods (Coles, After independence and homogeneity have been assessed,
2001). Depending on how we define our extreme values, we we do a Weibull analysis of the repose periods between erup-
select the method. In our case, it is more convenient to de- tions to quantitatively describe the stationarity of the series
fine our values as peaks or exceedances over a threshold, and through the distribution shape parameter. The further from 1
so we use the Exceedances over a threshold (EOT) method the shape parameter is, the more evidence that the process is
to sample the original data, i.e. Xi > u for some value of i. not stationary.
This method is based on a limiting function called GPD, as After the data has been analyzed we apply the NHGPPP
opposed to the Annual Maximum method with is based on to estimate the volcanic hazard. The method is applied to an
the Gumbel distribution as the limiting function. independent, non-overlapping series of events occurring in a
Nat. Hazards Earth Syst. Sci., 11, 2741–2753, 2011 www.nat-hazards-earth-syst-sci.net/11/2741/2011/R. Sobradelo et al.: Volcanic hazard for the Canary Islands 2747
Fig. 3. Autocorrelation function for the repose intervals of the Ca-
nary Islands’ time series.
The diagram in Fig. 2 shows a large dispersion of points
and the correlation coefficient between consecutive repose
times is 0.3062, indicating a very low serial correlation. We
do not have enough evidence to say that consecutive repose
intervals are time-dependent. If new geological data arrive
Fig. 2. Scatterplot of consecutive repose intervals for the Canary in the future we do not rule out the possibility of a new out-
Islands time series. come for the time-dependence analysis, but for the time be-
ing, based on the available data, we assume independence of
repose times based on the above mentioned tests.
space B with an intensity density λ(xi ), where xi are the B-
Next, we look at the stationarity of the process. A time
domain variables where the process develops. In our case xi
series is stationary if its underlying statistical structure does
are the coordinates T (time) and eruption magnitude M of a
not evolve with time. The correlogram is a simple diagram
two-dimensional space.
which can help diagnose non-stationarity. If a series is non-
stationary then the theoretical autocorrelations will be nearly
5 Statistical analysis of the Canary Islands historic 1 for all lags k. Thus, if the estimated correlogram fails to die
volcanic data using EVT down (or dies down very slowly), the series is non-stationary.
The theoretical correlogram is a plot of the theoretical au-
Assuming that past history of a volcano should reflect at least tocorrelations between consecutive repose periods of lag k,
some relevant features of its expected future behavior, we corr(xt ,xt−k ), against k. Figure 3 shows the autocorrelation
look at the time series of historical volcanic eruptions on the function (ACF) of the Canary Islands’ time series.
Canary Islands. The time series dataset has fifteen volcanic The argumentation of the non-stationarity based in the
events historically documented since 1430 (Romero, 1991). shape of the ACF is arguable since the ACF is sensible to
seasonal variations, which at the same time could correspond
5.1 Exploratory analysis of the Canary Islands volcanic to a stationary process. For this reason, to assess stationarity,
data we complement the visual ACF analysis in Fig. 3 with the
Dickey-Fuller unit root test.
5.1.1 Independence and stationarity assessment
The Dickey-Fuller unit root test was proposed by Dickey
We want to test the eruptive time series for independence be- and Fuller (1979). In its most basic form, the test compares
tween successive events. We look at the independence of the null hypothesis H0 : xt = xt−1 + t , i.e. that the series is a
repose intervals between eruptions by means of a serial cor- random walk without a drift, against the alternative hypoth-
relation scatterplot, where the duration of each interval Ti +1 esis H1 : xt = c + αxt−1 + t where c and α are constants
between two successive eruptions is plotted against the pre- with | α |< 1. According to H1 , the process is a station-
vious repose interval durations Ti . For the particular case of ary AR(1) with mean µ = c/(1 − α). To see this, note that,
the Canary Islands, the repose interval between eruptions is under H1 we can write xt = µ(1 − α) + αxt−1 + t , so that
defined as the elapsed time between the start of one eruption xt − µ = α(xt−1 − µ) + t . Table 3 shows the SAS output
and the start of the next. for the Dickey-Fuller test. The test statistic has a value of
−2.5224, and is associated with a p-value of 0.3734, indicat-
ing that there is not enough statistical evidence to reject the
www.nat-hazards-earth-syst-sci.net/11/2741/2011/ Nat. Hazards Earth Syst. Sci., 11, 2741–2753, 20112748 R. Sobradelo et al.: Volcanic hazard for the Canary Islands
null hypothesis that the series is not stationary. This result
is consistent with the visual analysis of the ACF, where the
series fails to die down. In this preliminary analysis of the
time series no significant correlation was found, thus we can
assume independence of consecutive repose periods. Addi-
tionally, we found no evidence to assume that the series is
stationary, so based on the ACF and the Dickey-Fuller test
for stationarity, we can say that the Canary Islands’ volcanic
eruptions time series is not stationary.
5.1.2 Distribution of the repose periods: Weibull versus
Exponential
We look at the Weibull distribution to analyze the characteris-
tics of consecutive repose periods and quantitatively describe
the stationarity characteristic of the time series through the Fig. 4. Distribution of observed repose intervals with duration
distribution shape parameter. greater than T decades (bars) for the Canary Islands since 1402.
The survival Weibull distribution shows a much better fitting than
The Weibull distribution has been widely applied in sta-
the exponential distribution.
tistical quality control, earthquake hazard assessment, and
many other applications. It has also been used to model
volcanic eruption sequences (Bebbington and Lai, 1996b). one another. The number of events between time a and time
The 2-parameter cumulative Weibull distribution and sur- b, N (b)−N (a), is said to have a Poisson distribution of mean
vival functions are given by λ. When the rate parameter, or intensity, of the process is not
k constant, the Poisson process is said to be non-homogeneous,
F (t) = 1 − exp−(t/α)
and the generalized rate function is given by λ(t). As seen in
and a preliminary analysis of the data, the Canary Islands time se-
ries is non-stationary, and we will model the volcanic hazard
S(t) = 1 − F (t) with a non-homogeneous Poisson process (NHPP). Since we
respectively, where α is a scale parameter, and k is a shape use the EOT method to sample the original data, we can use
parameter. the GPD to model the intensity of the NHPP. Hence, we will
The shape parameter reflects the stationary or non- be using a NHGPPP to estimate the volcanic hazard for the
stationary character of the time series. In the present paper, Canary Islands. (See Mendoza-Rosas and De la Cruz-Reyna
we obtain the distribution parameters using a fairly simple (2008) for further details on this methodology).
graphical method (Bebbington and Lai, 1996a). The proba- To calculate the probabilities of occurrence of an erup-
bility of having a repose period of duration greater than t has tion in the different magnitude classes, we use the number of
been obtained from the survival function 1 − F (t). excesses inferred from the eruption occurrence rate of each
The resulting Weibull distribution parameters are 1.63 class magnitude, this is, the events above a certain threshold
for the shape parameter and 4.37 for the scale parameter. u (Xi − u, for some i).
Figure 4 shows the comparison between Exponential and For the particular case of volcanic eruptions, the magni-
Weibull distributions. We see that the Weibull survival func- tude of the eruptions and the time of their occurrence are
tion provides a better fit to the repose periods than the ex- viewed as points in a two-dimensional space, which formally
ponential function, because the shape parameter accounts is the realization of a point process (Cox and Isham, 1980).
for the non-stationarity of the time series. Additionally, the The intensity measure 3(B) of this two-dimensional Poisson
shape parameter value being far from 1 confirms once more process on the space B = [t1 ,t2 ] ∗ (u,∞) with [t1 ,t2 ] ⊂ [0,1]
the non-stationarity of the process. A shape parameter of 1 is given by
would correspond to an exponential, that models very well 1/β
β(x − u)
stationary data, which is not the case here. 3(B) = (t2 − t1 ) 1 − (2)
θ
5.2 Volcanic hazard assessment for the Canary Islands
where β, and θ are the parameters of the GPD.
We then estimate the volcanic hazard for the Canary Is- The GPD is described by a shape parameter β, a scale pa-
lands using the NHGPPP. A Poisson process is a collection rameter θ, and a location parameter u (threshold), and has the
{N(t) : t ≥ 0} of random variables, where N(t) is the number following cumulative distribution function:
of events that have occurred up to time t (starting from time
0). These events occur continuously and independently of
Nat. Hazards Earth Syst. Sci., 11, 2741–2753, 2011 www.nat-hazards-earth-syst-sci.net/11/2741/2011/R. Sobradelo et al.: Volcanic hazard for the Canary Islands 2749
Table 4. Probability of at least one event of Magnitude M > x in the next t years in the Canary Islands estimated with a NHGPPP. (Pr(X = 0)
and Pr(X ≥ 1) are the probability of having no eruption and the probability of having at least one eruption, respectively, of a certain magnitude
in a particular time interval; NHM and HM are the probability estimated with the NHGPPP and the Homogeneous Poisson, respectively, for
magnitude M; λ̂ is the estimated parameter rate for the NHGPPP and σ̂ is the estimated standard deviation for the Pr(X ≥ 1) computed with
the NHGPPP, based on the Delta method.)
Magnitude > 1 NHM>1 HM>1
Years Pr(X = 0) λ̂ Pr(X ≥ 1) σ̂ Pr(X ≥ 1)
1 0.72422 0.3227 0.27578 0.01128 0.283100
20 0.00158 6.4532 0.99842 1.068 × 10−06 0.998715
50 9.853 × 10−08 16.1329 1.00000 1.044 × 10⁻¹⁴ 1.000000
75 3.093 × 10⁻¹¹ 24.1993 1.00000 1.543 × 10⁻²¹ 1.000000
100 9.708 × 10⁻¹⁵ 32.2658 1.00000 2.027 × 10⁻²⁸ 1.000000
Magnitude > 2 NHM>2 HM>2
Years Pr(X = 0) λ̂ Pr(X ≥ 1) σ̂ Pr(X ≥ 1)
1 0.84203 0.1719 0.15797 0.00813 0.091181
20 0.03211 3.4387 0.96789 0.00024 0.852244
50 0.00018 8.5968 0.99982 1.955 × 10−08 0.991608
75 2.510 × 10−06 12.8953 1.00000 5.416 × 10⁻¹² 0.999231
100 3.411 × 10−08 17.1937 1.00000 1.334 × 10⁻¹⁵ 0.999930
Magnitude > 3 NHM>3 HM>3
Years Pr(X = 0) λ̂ Pr(X ≥ 1) σ̂ Pr(X ≥ 1)
1 0.91805 0.0855 0.08195 0.00480 0.026759
20 0.18084 1.7102 0.81916 0.00373 0.418695
50 0.01391 4.2754 0.98609 0.00006 0.742362
75 0.00164 6.4131 0.99836 1.150 × 10−06 0.869228
100 0.00019 8.5508 0.99981 2.132 × 10−08 0.933623
Magnitude > 4 NHM> 4 HM>4
Years Pr(X = 0) λ̂ Pr(X ≥ 1) σ̂ Pr(X ≥ 1)
1 0.96289 0.0378 0.03711 0.00234 0.007327
20 0.46940 0.7563 0.5306 0.01111 0.136780
50 0.15096 1.8907 0.84904 0.00287 0.307686
75 0.05865 2.8361 0.94135 0.00065 0.423957
100 0.02279 3.7815 0.97721 0.00013 0.520701
The sample mean excess plot is given by:
P
βy 1/β i:xi >u (xi − u)
Gβ,θ (y) = 1 − (1 − ) for β 6 = 0 x̄u = (4)
θ Nu
Gβ,θ (y) = 1 − e−y/θ for β = 0 where Nu is the number of excess xi over a threshold u.
Davison and Smith (1990) introduced a diagnostic plot to
Another related property of the GPD refers to the mean ex- decide how well the model fits the data. The mathematical
cess: if Y = X −u is a GP-distributed variable, then the mean basis for this method is Eq. (3), where the key feature is that
excess over threshold u is: if Y is GPD, then the mean excess over a threshold u, for
any u > 0, is a linear function of u (Coles, 2001; Lin, 2003;
θ − βu Beguerı́a, 2005). In Fig. 5 we plot the mean of the excesses,
E(X − u|X > u) = (3)
1+β obtained with Eq. (4), vs their thresholds. The x-axis is the
threshold and the y-axis is the sample mean of all excesses
for β > −1, u > 0 and θ − uβ > 0 over that threshold. As we can see, the mean excess follows
www.nat-hazards-earth-syst-sci.net/11/2741/2011/ Nat. Hazards Earth Syst. Sci., 11, 2741–2753, 20112750 R. Sobradelo et al.: Volcanic hazard for the Canary Islands
Fig. 5. Plot of exceedance and excess mean vs. threshold for the
Canary Islands.
Fig. 6. Probabilities calculated with NHGPPP (solid lines) and Ho-
R2
a nearly straight line, with a of 0.8415, suggesting a good mogeneous Poisson distribution (dashed lines) of at least one erup-
tion, with a magnitude greater than a given M threshold for the
fit. A regression line of mean of exceedances over the thresh-
Canary Islands eruptive series.
old has been added to confirm that the series follows the
GPD. Since we are working with effusive eruptions only, we
assumed an upper bound of six for the estimation of the mag-
the estimated eruption rates of large magnitude eruptions are
nitudes, and mapped the probabilities to the [1,6] magnitude
introduced.
interval. Hence, according to Davison and Smith (1990), the
Based on the existing historical data, the probability of
preceding results indicate that the NHGPPP is satisfactory
an event in the Canary Islands increases more rapidly in the
and appropriate to model the Canary Islands eruptive time
first 20 yr, with a 99.84 % chance of an event of a magnitude
series.
greater than one in the next 20 yr and leveling out after that
The Pareto generalized parameters for the process, derived at 99.99 %. There is a probability of 27.58 % of an event of a
from the regression parameters on Fig. 5 and Eq. (3) are magnitude between 1 and 6 in the next 12 months and 3.71 %
0.104 for shape and 1.711 for the scale. Using Eq. (2) we of an event of a magnitude between 4 and 6 for the same pe-
estimate the intensity λ̂ of the NHGPPP and obtain the prob- riod. There is ongoing work to assess the data in the volcanic
ability estimations of at least one eruption of a certain mag- eruptions catalog for the Canary Islands more accurately. In
nitude in a given time interval. Since the approach of ex- this respect, these probability results may vary should new
ceedances assumes that the scale measuring the phenomena geological records become available.
is open, we mapped the probabilities of eruptions to the mag-
nitude interval 1 to 6. Table 4 and Fig. 6 show the probability
of having at least one eruption Pr(X ≥ 1) computed as one 6 Discussion and conclusions
minus the probability of having no eruption 1 − Pr(X = 0)
of a certain magnitude M in a given time window, estimated The Canary Islands are an active volcanic region densely
using the NHGPPP with intensity rate λ̂. To measure the populated and visited by several million tourists every year.
volatility of the estimated probabilities Prob(X
d ≥ 1) we com- Nearly twenty eruptions have been reported by written
pute the standard deviation σ̂ of the estimator. We use the chronicles in the last 600 yr. This gives an average of an
Delta method q to determine its asymptotic distribution, and eruption every 25–30 yr, which suggests that the probability
we get σ̂ = n1 e−2λ̂ λ̂. Additionally, in Fig. 6, we compare of having a new eruption in the near future is not so low.
the results obtained from the NHGPPP with the volcanic haz- Under these circumstances and in order to reduce the poten-
ard estimates obtained from direct application of the homo- tial volcanic risk of this region, it is highly recommendable
geneous Poisson distributions for the same eruption series. to undertake hazard assessment, and determine the eruption
We see that the probabilities of occurrence of eruptions in recurrence for the area.
the lower magnitude scales, calculated with the non homo- Recent volcanism in the Canary Islands is not well known
geneous method proposed here, differ very little from the and is poorly constrained in terms of age of the eruptions.
standard Poisson method. The probabilities of occurrence of For the island of Tenerife alone, Carracedo et al. (2007,
eruptions exceeding moderate magnitudes are significantly 2011) have conducted a systematic geochronological study
higher with the NHGPPP. This difference is due to the addi- for Teide and the volcanism associated with the rift zones, but
tional information that the GPD adds to the NHGPPP when this study is still far from being complete. Therefore, the data
Nat. Hazards Earth Syst. Sci., 11, 2741–2753, 2011 www.nat-hazards-earth-syst-sci.net/11/2741/2011/R. Sobradelo et al.: Volcanic hazard for the Canary Islands 2751
catalog to be used for statistical and probabilistic assessment magnitude instead of VEI and limited the study to levels of
of the Canary Islands to establish the eruption recurrence is magnitude up to six. However, the eruption magnitude, mea-
formed uniquely by historical records. The model can be sured as the total erupted volume, only takes into account
easily updated in the future should new volcanic records be one of the three measures of the VEI. Hence, the probability
dated. estimates for volume alone are expected to be higher than the
As in any data analysis, we should be aware of various estimates for volume of products, eruption cloud height and
layers of uncertainty, perhaps magnified in an extreme value qualitative observations combined. With this in mind, given
analysis. On one level, there is the parameter uncertainty: the current data, it is not surprising to observe a probability
even if we had abundant, good quality data to work with and of 27.58 % of having a volcanic event of magnitude greater
a good model, our parameter estimates are still subject to a than 1 in the next year in the Canary Islands, most likely in
standard error. Model uncertainty is also present – we may any of the three for which historical data exist (Lanzarote,
have good data but a poor model. Using extreme value meth- Tenerife, La Palma) but without excluding the other four is-
ods we are at least working with a good class of models, but lands. Even if there are no historical records documented for
they are applicable over high thresholds and we must decide all the islands, we cannot rule out the probability of an event
where to set the threshold. If we set the threshold too high forming there since they are part of the same archipelago and
we have few data and we introduce more parameter uncer- there are traces of previous volcanic eruptions. We do not
tainty. If we set the threshold too low we lose our theoretical have enough data to do an individual hazard analysis for each
justification for the model. But even more serious than pa- island alone.
rameter and model uncertainty is the data uncertainty. It is It is important to highlight the fact that the Canary Islands
never possible to have enough data in an extreme value anal- have a probability greater than zero of undergoing a new
ysis. In Table 4 the expected value of the random variable λ̂ volcanic event in the upcoming years. Hence, these results
provides a good estimation of the aleatoric uncertainty due to should be taken into account in the assessment of volcanic
the complexity of the process, and the standard deviation σ̂ risk and in the design of prevention and response measures,
provides a good estimation of the epistemic uncertainty, due particularly of major eruptions to which larger areas may be
to our limited knowledge of the process. one hundred per cent vulnerable.
Extreme value methods do not predict the future with cer- The results obtained only apply to the probabilities of hav-
tainty, but they do offer good models for explaining the ex- ing a basaltic eruption in the near future, as historical vol-
treme events we have seen in the past (McNeil, 1997). Even canism has been always represented by this kind of erup-
with a good tail estimate, we cannot be sure that the future tion. However, the existence of several eruptions of phono-
does not hold some unexpected catastrophic volcanic erup- litic magmas from Teide in Holocene times on the island
tion. The extreme value method used in this paper to assess of Tenerife, the last one having occurred only 1000 yr ago
the volcanic hazard for the Canary Islands does not predict (Carracedo et al., 2007), reminds us that hazard assessment
the future with certainty, but it is a model based on rigorous should also consider phonolitic eruptions. Despite their be-
mathematical theory concerning the behaviour of extrema. ing concentrated during the Holocene exclusively on Tener-
Based on past experience (Mendoza-Rosas and De la Cruz- ife, these eruptions may generate hazards that could have a
Reyna, 2008), the GPD is a good approximation in the tail for much greater impact than basaltic eruptions; thus, their po-
our volcanic data, and the probability results yielded by the tential effects should not be neglected in a more complete
extreme value method used here to assess the volcanic haz- volcanic hazard assessment for the Canary region.
ard for the Canary Islands should not be neglected. It may
well be that, by trial and error, some other distribution can Acknowledgements. We thank Olivier Jaquet and an anonymous
be found which fits the data even better in the tail, but such a referee for their comments and suggestions that greatly contributed
distribution would be an arbitrary choice, and we would have to improving this manuscript. This research has been partially
less confidence in extrapolating it beyond the data. funded by MICINN grant CGL2008-04264 and Grant MTM2008-
The probability results obtained are very high. This is 06747-C02-00 from the Ministerio de Ciencia e Innovación.
partly due to the fact that the area of study is the quasi lin-
Edited by: G. Macedonio
ear 500 km long chain grown on the passive margin of the
Reviewed by: O. Jaquet and two other anonymous referees
African Plate containing the actual Canarian archipelago,
signifying that there are several possible vent locations for
an eruption. Also, we must consider the fact that we are
References
measuring magnitudes (total erupted volumes) and not VEI
(Volcanic Explosivity Index) Newhall and Self (1982). The Anguita, F. and Hernán, F.: A propagating fracture model versus a
VEI is a combination of volume of products, eruption cloud hot-spot origin for the Canary Islands, Earth Planet. Sci. Lett.,
height and qualitative observations. It is mainly applied 27, 11–19, 1975.
to explosive eruptions and is not appropriate for eruptions Anguita, F. and Hernán, F.: The Canary Islands origin: a unifying
which are mainly effusive. This is the reason why we used model, J. Volcanol. Geoth. Res., 103, 1–26, 2000.
www.nat-hazards-earth-syst-sci.net/11/2741/2011/ Nat. Hazards Earth Syst. Sci., 11, 2741–2753, 20112752 R. Sobradelo et al.: Volcanic hazard for the Canary Islands Araña, V. and Ortiz, R.: The Canary Islands: Tectonics, magma- examined: Probabilities of future eruptions at Villarrica and tism, and geodynamic framework, in: Magmatism in Extensional Llaima Volcanoes, Southern Volcanic Zone, Chile, J. Volcanol. Structural Settings and the Phanerozoic African Plate, edited by: Geoth. Res., 193, 82–92, doi:10.1016/j.jvolgeores.2010.03.009, Kampunzu, A. and Lubala, R., Springer, New York, 209–249, 2010a. 1991. Dzierma, Y. and Wehrmann, H.: Statistical eruption forecast for Aspinall, W., Carniel, R., Jaquet, O., Woo, G., and Hincks, T.: Us- the Chilean Southern Volcanic Zone: typical probabilities of vol- ing hidden multi-state Markov models with multi-parameter vol- canic eruptions as baseline for possibly enhanced activity fol- canic data to provide empirical evidence for alert level decision- lowing the large 2010 Concepción earthquake, Nat. Hazards support, J. Volcanol. Geoth. Res., 153, 112–124, 2006. Earth Syst. Sci., 10, 2093–2108, doi:10.5194/nhess-10-2093- Bebbington, M.: Identifying volcanic regimes using hidden Markov 2010, 2010b. models, Geophys. J. Int., 171, 921–942, 2007. Ho, C.: Bayesian analysis of volcanic eruptions, J. Volcanol. Geoth. Bebbington, M. and Lai, C.: Statistical analysis of New Zealand Res., 43, 91–98, 1990. volcanic occurrence data, J. Volcanol. Geoth. Res., 74, 101–110, Ho, C.: Time trend analysis of basaltic volcanism for the Yucca 1996a. Mountain site, J. Volcanol. Geoth. Res., 46, 61–72, 1991. Bebbington, M. and Lai, C.: On nonhomogeneous models for vol- Ho, C., Smith, E., and Keenan, D.: Hazard area and probability of canic eruptions, Math. Geol., 28, 585–600, 1996b. volcanic disruption of the proposed high-level radioactive waste Beguerı́a, S.: Uncertainties in partial duration series modeling of repository at Yucca Mountain, Nevada, USA, Bull. Volcanol., 69, extremes related of the choice of the threshold value, J. Hydrol., 117–123, 2006. 303, 215–230, 2005. Hoernle, K. and Schmincke, H.: The role of partial melting in the Burt, M., Wadge, G., and Scott, W.: Simple stochastic modelling of 15-Ma geochemical evolution of Gran Canaria: a blob model for the eruption history of a basaltic volcano: Nyamuragira, Zaire, the Canary hotspot, J. Petrol., 34, 599–626, 1993. Bull. Volcanol., 56, 87–156, 1994. Hoernle, K., Zhang, Y., and Graham, D.: Seismic and geochemical Carracedo, J., Day, S., Guillou, H., Rodrı́guez, E., Canas, J., and evidence for large-scale mantle upwelling beneath the eastern At- Pérez, F.: Hotspot volcanism close to a passive continental mar- lantic and western and central Europe, Nature, 374, 34–39, 1995. gin, Geol. Mag., 135, 591–604, 1998. Jaquet, O. and Carniel, R.: Estimation of volcanic hazard using Carracedo, J., Rodrı́guez-Badioloa, E., Guillou, H., Paterne, M., geostatistical models, in: Statistics in Volcanology, edited by: Scaillet, S., Pérez-Torrado, F., Paris, R., Fra-Paleo, U., and Mader, H., Coles, S., Connor, C., and Connor, L., IAVCEI Pub- Hansen, A.: Eruptive and structural history of Teide Volcano lications, Geological Society of London, 89–103, 2006. and rift zones of Tenerife, Canary Islands, Bull. Geol. Soc. Am., Jaquet, O., Low, S., Martinelli, B., Dietrich, V., and Gilby, D.: 119(9-10), 1027–1051, 2007. Estimation of volcanic hazards based on Cox stochastic pro- Carracedo, J., Guillou, H., Nomade, S., Rodrı́guez-Badiola, E., cesses, Phys. Chem. Earth, 25, 571–579, doi:10.1016/S1464- Pérez-Torrado, F., Rodrı́guez-González, A., Paris, R., Troll, 1895(00)00087-9, 2000. V., Wiesmaier, S., Delcamp, A., and Fernández-Turiel, J.: Klein, F.: Patterns of historical eruptions at Hawaiian volcanoes, J. Evolution of ocean-island rifts: The northeast rift zone of Volcanol. Geoth. Res., 12, 1–35, 1982. Tenerife, Canary Islands, Geol. Soc. Am. Bull., 123 562–584, Le Bas, M., Rex, D., and Stillman, C.: The early magmatic chronol- doi:10.1130/B30119.1, 2011. ogy of Fuerteventura, Canary Islands, Geol. Mag., 123, 287–298, Carta, S., Figari, R., Sartoris, G., Sassi, E., and Scandone, R.: A sta- 1986. tistical model for Vesuvius and its volcanological implications, J. Le Pichon, X. and Fox, P.: Marginal offsets, fracture zones and the Volcanol. Geoth. Res., 44, 129–151, 1981. early opening of the North Atlantic, J. Geophys. Res., 76, 6294– Coles, S. (Ed.): An Introduction to Statistical Modeling of Extreme 6308, 1971. Values, Springer-Verlang, London, 2001. Lin, X.: Statistical modelling of severe wind gust, International Coles, S. and Sparks, R.: Extreme value methods for modelling Congress on Modelling and Simulation, Townsville 14–17 July, historical series of large volcanic magnitudes, in: Statistics in 2, 620–625, 2003. Volcanology, edited by Mader, H., Coles, S., Connor, C., and Marinoni, L. and Pasquaré, G.: Tectonic evolution of the emer- Connor, L., Geological Society of London for IAVCEI, London, gent part of a volcanic ocean island: Lanzarote, Canary Islands, 47–56, 2006. Tectonophysics, 239, 111–135, 1994. Cox, D. and Isham, V. (Eds.): Point Process, Chapman and Hall, Marzocchi, W., Sandri, L., and Selva, J.: BET EF: a probabilistic London, 1980. tool for long- and shortterm eruption forecasting, Bull. Volcanol., Davison, A. and Smith, R.: Models for exceedances over high 70, 623–632, 2008. thresholds, J. R. Stat. Soc., 52(B), 393–442, 1990. McNeil, A.: Estimating the tails of loss severity distributions using De la Cruz-Reyna, S.: Poisson-Distributed Patterns of Explosive extreme value theory, ASTIN Bulletin, 27, 117–137, 1997. Eruptive Activity, Bull. Volcanol., 54, 57–67, 1991. Mendoza-Rosas, A. and De la Cruz-Reyna, S.: A statistical method De la Cruz-Reyna, S.: Random patterns of occurrence of explosive linking geological and historical eruption time series for volcanic eruptions at Colima Volcano, México, J. Volcanol. Geoth. Res., hazard estimations : Applications to active polygenetic volca- 55, 51–58, 1993. noes, J. Volcanol. Geoth. Res., 176, 277–290, 2008. Dickey, D. and Fuller, W.: Distribution of the Estimators for Au- Mendoza-Rosas, A. T. and De la Cruz-Reyna, S.: A mixture of toregressive Time Series With a Unit Root, J. Am. Stat. Assoc., exponentials distribution for a simple and precise assessment of 74, 427–431, 1979. the volcanic hazard, Nat. Hazards Earth Syst. Sci., 9, 425–431, Dzierma, Y. and Wehrmann, H.: Eruption time series statistically doi:10.5194/nhess-9-425-2009, 2009. Nat. Hazards Earth Syst. Sci., 11, 2741–2753, 2011 www.nat-hazards-earth-syst-sci.net/11/2741/2011/
R. Sobradelo et al.: Volcanic hazard for the Canary Islands                                                                            2753

Mendoza-Rosas, A. T. and De la Cruz-Reyna, S.: Hazard estimates        Romero, C. (Ed.): Las manifestaciones volcánicas históricas del
  for El Chichón volcano, Chiapas, México: a statistical approach      archipiélago canario, Consejerı́a de polı́tica territorial, Gobierno
  for complex eruptive histories, Nat. Hazards Earth Syst. Sci., 10,     autónomo de Canarias, 2 tomos, Santa Cruz de Tenerife, 1991.
  1159–1170, doi:10.5194/nhess-10-1159-2010, 2010.                     Schmincke, H.: Volcanic and chemical evolution of the Canary Is-
Mulargia, F., Gasperini, P., and Tinti, S.: Identifying different        lands, in: Geology of the Northwest African Margin, edited by:
  regimes in eruptive activity: an application to Etna volcano, J.       von Rad, U., Hinz, K., Sarnthein, M., and Seibold, E., Springer,
  Volcanol. Geoth. Res., 34, 89–106, 1987.                               Berlin, 273–306, 1982.
Newhall, C. and Hoblitt, R.: Constructing event trees for volcanic     Sobradelo, R. and Martı́, J.: Bayesian event tree for long-term vol-
  crises, Bull. Volcanol., 64, 3–20, 2002.                               canic hazard assessment: Application to Teide-Pico Viejo stra-
Newhall, C. and Self, S.: The volcanic explosivity index (VEI): an       tovolcanoes, Tenerife, Canary Islands, J. Geophys. Res., 115,
  estimate of the explosive magnitude for historical eruptions, J.       B05206, doi:10.1029/2009JB006566, 2010.
  Geophys. Res., 87, 1231–1238, 1982.                                  Solow, A.: An empirical Bayes analysis of volcanic eruptions,
Pyle, D.: Forecasting sizes and repose times of future extreme vol-      Math. Geol., 33, 95–102, 2001.
  canic events, Geology, 26, 367–370, 1998.                            Turner, M., Cronin, S., Bebbington, M., and Platz, T.: Developing
Pyle, D.: Sizes of volcanic eruptions, in: Encyclopedia of Volca-        probabilistic eruption forecasts for dormant volcanoes: a case
  noes, edited by: Sigurdsson, H., Academic, San Diego, Califor-         study from Mt Taranaki, New Zealand, Bull. Volcanol., 70, 507–
  nia, 263–269, 2000.                                                    515, doi:10.1007/s00445-007-0151-4, 2007.
Reyment, R.: Statistical analysis of some volcanologic data, Re-       UNESCO: Report of consultative meeting of experts on statisti-
  garded as series of point events, PAGEOPH, 74, 57–77, 1969.            cal study of natural hazards and their consequences, Tech. Rep.
Robertson, A. and Stillman, C.: Submarine volcanic and associated        SC/WS/500, New York, 1972.
  sedimentary rocks of the Fuerteventura Basal Complex, Canary         Wickman, F. E.: Markov models of repose-period patterns of vol-
  Islands, Geol. Mag., 116, 203–214, 1979.                               canoes, in: Random Processes in Geology, edited by: Merriam,
                                                                         D., Springer-Verlag, Berlin, 135–161, 1976.

www.nat-hazards-earth-syst-sci.net/11/2741/2011/                                 Nat. Hazards Earth Syst. Sci., 11, 2741–2753, 2011
You can also read