ASSESSMENT OF NEWFOUNDLAND AND LABRADOR (DIVISIONS 2HJ3KLNOP4R) SNOW CRAB - DFO-MPO
←
→
Page content transcription
If your browser does not render page correctly, please read the page content below
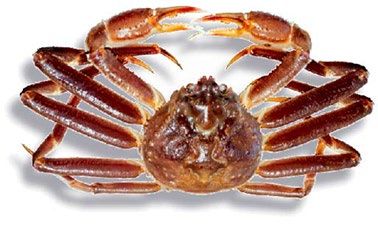
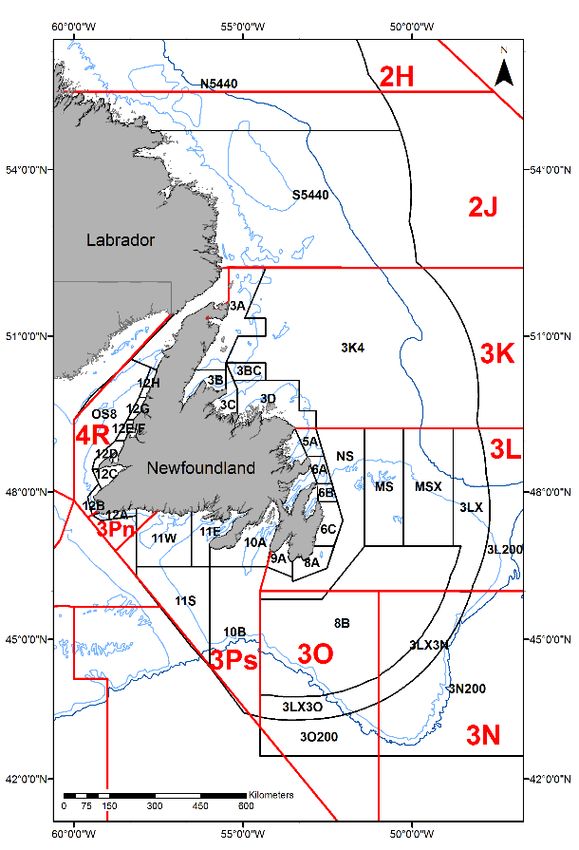
Canadian Science Advisory Secretariat
Newfoundland and Labrador Region Science Advisory Report 2021/009

 ASSESSMENT OF NEWFOUNDLAND AND LABRADOR
 (DIVISIONS 2HJ3KLNOP4R) SNOW CRAB

 Context
 Snow Crab (Chionoecetes opilio) occupy a broad
 geographic range in the Northwest Atlantic from
 Greenland to southern Nova Scotia. Distribution in
 waters off Newfoundland and southern Labrador is
 widespread and continuous with the genetic stock
 spanning throughout the region.
 Crab harvesters use fleets of baited conical traps. The
Snow Crab (Chionoecetes opilio) minimum legal size is 95 mm carapace width (CW).
 This regulation excludes females and a large
 proportion of adult males from the fishery thereby
 potentially partially safeguarding stock reproductive
 capacity.
 Total Allowable Catch (TAC) management was
 initiated in the late-1980s. This led to the development
 of multiple TAC-controlled Crab Management Areas
 (CMAs - Fig. 1) with about 2,400 license holders
 across numerous fleet sectors under enterprise
 allocation in 2019. All fleets have designated trap
 limits, quotas, trip limits, dedicated fishing areas within
 CMAs, and pre-determined fishing seasons.
 Stock status is assessed annually within Assessment
 Divisions (ADs) comprised of combinations of the
 Northwest Atlantic Fisheries Organization (NAFO)
 Divisions. Resource status is evaluated based on
 trends in exploitable biomass indices, recruitment
 prospects, and mortality indices, as well as fishery
 catch per unit of effort (CPUE). Data are derived from
 multispecies bottom trawl surveys in
 Divs. 2HJ3KLNOP, DFO inshore trap surveys in
 Divs. 3KLPs, fishery logbooks, at-sea observer
 measurements, collaborative trap surveys, as well as
 biological sampling from multiple sources.
 A Regional Peer Review Process meeting was held
 February 25-26, 2020, in St. John’s, Newfoundland
 and Labrador (NL) to assess the status of the Snow
 Figure 1: Map of NAFO Divisions (red) Crab resource in NL.
 and Newfoundland and Labrador Snow
 Crab Management Areas (black).

March 2021
Newfoundland and Labrador Region 2HJ3KLNOP4R Snow Crab

SUMMARY
Overall – Divisions 2HJ3KLNOP4R
• Landings have declined since 2009 (53,400 t) to their lowest level in 25 years (total 26,400
 t in 2019), reflecting decreasing TACs. Only Assessment Division (AD) 3Ps experienced
 increased landings in recent years.
• Effort was at or near decadal lows in all ADs during 2019.
• Fishery CPUE increased to or remained near time-series averages within each AD during
 2019, with the exceptions of ADs 3L Inshore and 3LNO Offshore, where it is near historic
 lows within their respective time-series.
• The overall exploitable biomass has increased in both trawl and trap surveys during the
 past 1-2 years, but remains near historic lows. In 2019, the largest increases occurred in
 ADs 3K, 3LNO Offshore, and 4R3Pn, while all other ADs had little change or conflicting
 signals. The coverage of the trawl survey in 2019 was severely reduced due to weather in
 Divs. 2HJ3K, such that biomass estimates, particularly in AD 2HJ, are likely an overestimate
 of true stock status.
• Fishery Exploitation Rate Indices (ERIs) were near or below time-series averages in all
 ADs in 2019, with the exception of ADs 2HJ and 3L Inshore. Status quo removals would
 further reduce exploitation rates in all ADs in 2020, with the exception of AD 2HJ, where it
 would remain high.
• Total mortality in exploitable crab has decreased in all ADs over the past 3 years. It
 remains highest in AD 2HJ and lowest in AD 3LNO Offshore.
• Recent climate conditions and pre-recruit abundance indices suggest favourable prospects
 for recruitment into the exploitable biomass over the next 2-4 years in most ADs.
• In 2020, all ADs are projected to be in the provisional cautious zone of the DFO Science
 proposed Precautionary Approach Framework, with the exception of AD 3LNO Offshore,
 which is projected to be in the provisional healthy zone.
Environment
• Cold bottom temperatures, mostly driven by the Cold Intermediate Layer (CIL), are favorable
 for the early benthic stages of Snow Crab. These cold conditions are associated to the
 positive phase of the North Atlantic Oscillation (NAO). The recent NL climate has
 experienced these cold conditions between the mid-1980s and the mid-1990s, and from
 about 2012 to 2017. Since Snow Crab biomass is highly correlated with a 6-8 year lagged
 NAO index, this recent cold period suggests improved environmental prospects for Snow
 Crab.
• Chlorophyll concentration and zooplankton biomass were below normal in the mid-2010s,
 increasing to values above the long-term (1999-2015) average after 2017. Additionally,
 there have been changes in zooplankton community structure (less large energy-rich, and
 more small less energy-rich copepods) as well as changes in seasonality (weaker spring
 and stronger summer and fall zooplankton signals) which may change the quality and timing
 of food availability for upper trophic levels.
• Ecosystem conditions in most of the NL bioregion are indicative of limited productivity of the
 fish community. Total biomass levels remain much lower than prior to the collapse in the
 early-1990s. After some recovery since the collapse in the Newfoundland Shelf and Grand

 2

Newfoundland and Labrador Region 2HJ3KLNOP4R Snow Crab

 Bank ecosystem units, current levels of total biomass are reduced from those observed in
 the early-2010s.
• The predation index indicates that current predation rate on Snow Crab appears of similar
 level in the Newfoundland Shelf (2J3K) and Southern Newfoundland (3Ps). These are an
 order of magnitude higher than the estimated level for the Grand Bank (3LNO). While
 predation mortality remains among the highest in recent years, they have shown important
 declines from the peak levels observed in the 2016-2018 period. The conditions that allowed
 groundfish (known predators of crab) rebuilding in the mid to late 2000s appear to have
 eroded. If environmental conditions remain favourable, these declines in predation pressure
 could improve the prospects for Snow Crab in the coming years.
Assessment Division 2HJ
• Recent and ongoing data deficiencies in most assessment metrics are increasingly affecting
 stock assessment methods.
• This is the only AD not showing recent or projected improvements in the exploitable
 biomass. Continued high fishery exploitation rates appear to be impairing potential recovery
 of the exploitable biomass.
Assessment Division 3K
• Localized trap surveys do not yet show improvements of the same magnitude in the
 exploitable biomass evident in other assessment indices in the major management areas.
 However, this is consistent with a delayed response of trap surveys to changes in stock size.
Assessment Division 3L Inshore
• There is considerable spatiotemporal variability in stock status among management areas.
 Recent and projected improvements in the exploitable biomass are most apparent in
 Bonavista and Trinity Bays (CMAs 5A & 6A).
Assessment Division 3LNO Offshore
• AD 3LNO Offshore is the major contributor to overall stock status trends. Projected
 improvements in the exploitable biomass are consistent in most management areas.
Assessment Division 3Ps
• There are conflicting signals between the status of the exploitable biomass between the
 trawl (decrease in 2019) and trap (increase in 2019) survey indices.
• Recent increases in the exploitable biomass appear to be concentrated in the major fishing
 grounds and there is uncertainty if they will be sustained into 2020.
Assessment Division 4R3Pn
• Recent and ongoing data deficiencies in most assessment metrics are increasingly affecting
 stock assessment methods.
• Improvements into the exploitable biomass appear limited to Bay St. George (CMA 12C)
 and the Bay of Islands (CMA 12EF).

BACKGROUND
Species Biology
The Snow Crab life cycle features a planktonic larval period after spring hatching, involving
several stages before settlement. Benthic juveniles of both sexes molt frequently and may
become sexually mature at approximately 40 mm carapace width (CW) (~4 years of age).

 3
Newfoundland and Labrador Region 2HJ3KLNOP4R Snow Crab

Snow Crab grow by molting in late winter or spring. Females cease molting after sexual maturity
is achieved at 35-75 mm CW and do not contribute to the exploitable biomass. Sexually mature
(adolescent) males generally molt annually until their terminal molt, when they develop enlarged
claws (adults) that likely enhance their competitiveness for mating. Males molt to adulthood at
any size larger than approximately 40 mm CW, and so only a portion of any cohort will recruit to
the fishery at 95 mm CW. Age is not determined, but Snow Crab are believed to recruit to the
exploitable biomass at 8-10 years in warm areas and at slightly older ages in cold areas (Dawe
et al. 2012), due to less frequent molting at low temperatures. After recruiting to the biomass as
soft-shelled crab, it takes almost a full year for shells to become filled with meat and the crab to
be of commercial quality.
Snow Crab is a stenothermal species and temperature has a profound effect on production,
early survival, and subsequent recruitment to fisheries (Foyle et al. 1989, Dawe et al. 2008,
Marcello et al. 2012). Cold conditions during early life history are associated with increased
survey biomass indices and fishery CPUE several years later. Low temperature also promotes
relatively small size-at-terminal molt (Dawe et al. 2012), resulting in an increased portion of
Snow Crab failing to recruit to the fishery. However, with respect to overall productivity, under
light exploitation the positive effects of cold water on suitable habitat provision and early survival
appear stronger than the negative effect on size-at-terminal molt in regulating stock and fishery
productivity.
Adult legal-sized males remain new-shelled throughout the remainder of the year of their
terminal molt. They are considered to be pre-recruits until the following year when they begin to
contribute to the exploitable biomass as older-shelled adults. Males may live a maximum of
about six to eight years as adults after the terminal molt, but such longevity is not thought to be
common, particularly in heavily exploited areas.
Snow Crab undertake an ontogenetic migration from shallow cold areas with hard substrates to
warmer deeper areas with soft substrates (Mullowney et al. 2018a). Large males are most
common on mud or mud/sand in deep areas, while smaller Snow Crab are common on harder
substrates typically associated with shallow areas. Some Snow Crab also undertake a migration
in the winter or spring for mating and/or molting. Although the dynamics of winter and spring
migrations are not fully understood, they are known to be associated with different mating
periods for first-time spawning (primiparous) and multiple-time spawning (multiparous) females
and are generally from deep to shallow areas. Snow Crab are opportunistic feeders, with their
diet including fish, clams, polychaete worms, brittle stars, shrimp, Snow Crab, and other
crustaceans. Predators include various groundfish, other Snow Crab, and seals.
The Fishery
The fishery began in Trinity Bay (CMA 6A, Fig. 1) in 1967. Initially, Snow Crab were taken as
gillnet by-catch, but within several years a directed trap fishery developed in inshore areas
along the northeast coast of Divs. 3KL. The minimum legal mesh size of traps is 135 mm (5 ¼”)
to allow small crab to escape. Under-sized and new-shelled males that are retained in the traps
are returned to the sea and an unknown proportion dies.
Until the early-1980s, the fishery was prosecuted by approximately 50 vessels limited to 800
traps each. In 1981, fishing was restricted to the NAFO Division adjacent to where the license
holder resided. During 1982 to 1987, there were major declines in the resource in traditional
areas in Divs. 3K and 3L, while new fisheries started in Div. 2J, Subdiv. 3Ps, and offshore
Div. 3K. A Snow Crab fishery began in Div. 4R in 1993.
Licenses supplemental to groundfishing were issued in Div. 3K and Subdiv. 3Ps in 1985, in
Div. 3L in 1987, and in Div. 2J in the early-1990s. Since 1989, there has been a further

 4
Newfoundland and Labrador Region 2HJ3KLNOP4R Snow Crab

expansion in the offshore fishery. Temporary permits for inshore vessels
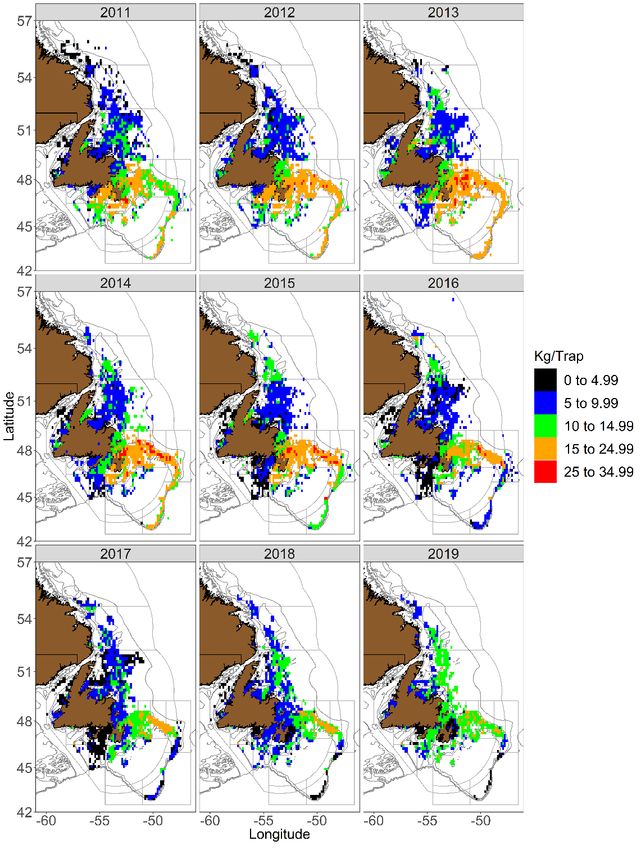
Newfoundland and Labrador Region 2HJ3KLNOP4R Snow Crab

The spatial distribution of the fishery grew as licences and landings increased throughout the
1980s-90s. The resource is now deemed fully-exploited, with fishing effort typically spanning
from the fringes of the Makkovik Bank off central Labrador in the north to the far offshore slope
edges of the Grand Bank in Divs. 3LNO, to near the border of Quebec in the westernmost
portions of Div. 4R (Fig. 3). Fishery CPUE is typically highest in Divs. 3LNO and occasionally off
the south coast in Subdiv. 3Ps (Fig. 3).

Figure 3: Locations of fishery sets and catch rates (kg/trap) from logbooks (2011-19).

 6
Newfoundland and Labrador Region 2HJ3KLNOP4R Snow Crab

Overall effort decreased in 2019 to under three million trap hauls per year which is the lowest
level in two decades (Fig. 4). Overall CPUE was at a time-series low in 2018, but returned to
historical lows in 2019 (Fig. 5).

Figure 4: Estimated number of trap hauls per year for the fishery in Divs. 2HJ3KLNOP4R.

Figure 5: Fishery CPUE (kg/trap) for Divs. 2HJ3KLNOP4R. Solid line is standardized CPUE and band is
95% confidence intervals. Vertical dashed line represents the beginning of the cod moratorium in most
ADs.

 7
Newfoundland and Labrador Region 2HJ3KLNOP4R Snow Crab

ASSESSMENT
The numerous CMAs have no biological basis and the resource is assessed at larger-scale
Assessment Divisions (ADs), which are comprised of combinations of NAFO Divisions. Div. 2H
is combined with Div. 2J (AD 2HJ) as the resource extends only into the southern portion of
Div. 2H and is managed at a spatial scale that extends over the Divisional boundary line.
Similarly, Divs. 3LNO Offshore, representing the Grand Bank, is assessed as a unit because the
resource is managed at that unit. Div. 3L Inshore is assessed separately because of differences
in data availability, with the trawl survey not normally extending to inshore bays. Finally,
Subdiv. 3Pn is combined with Div. 4R (AD 4R3Pn) to conform to management boundaries.
Div. 3K (AD 3K) and Subdiv. 3Ps (AD 3Ps) are assessed at the NAFO Division level.
Resource status was evaluated based on trends in survey exploitable biomass indices, fishery
CPUE, fishery recruitment prospects, and mortality indices. Information was derived from
multiple sources: multispecies bottom trawl surveys conducted during fall in ADs 2HJ, 3K, and
3LNO Offshore and spring in AD 3Ps, Industry-DFO Collaborative Post Season (CPS) trap
surveys in all ADs, DFO inshore trap surveys in ADs 3K, 3L Inshore and 3Ps, fishery data from
logbooks, and observer catch-effort data.
Bottom temperature data from various surveys were incorporated into a Snow Crab thermal
habitat index, defined as the areal extent of water below 2°C in each AD. Cool conditions (a high
index) are deemed favourable for long-term production potential in the stock.
Generally, more data are available for offshore than inshore CMAs within ADs. Trawl survey
data are often only available for offshore areas because inshore areas are excluded when
issues and time constraints occur in these surveys, which have become the norm in recent
years. However, in AD 3Ps, the spring trawl survey covers most of the inshore fishing areas,
and in AD 2HJ virtually all the Snow Crab habitat is covered by the trawl survey. Observer
coverage and sampling has also been more extensive in offshore CMAs of most ADs compared
to inshore areas.
The spring and fall bottom trawl surveys are based on a stratified random sampling scheme and
are used to provide an index of exploitable biomass that is expected to be available for the
upcoming fishery in the same year (spring AD 3Ps) or the following year (fall ADs 2HJ, 3K, and
3LNO Offshore). A Campelen shrimp trawl has been used for the multispecies surveys since
1995. Fisheries have begun earlier since the mid-2000s and now overlap with the timing of the
spring trawl survey in AD 3Ps.
The CPS trap survey, historically based on a fixed-station grid design, is more spatially limited
than the trawl survey as it targets only portions of commercial fishing grounds. A set of core
stations was selected from this survey for calculating catch rates (kg/trap) of legal-sized adults.
These core stations were identified as stations surveyed in 7 of the past 10 years. A
stratification scheme conforming to the limited survey footprint was used for estimating biomass
indices. The survey also includes small-meshed traps, deployed on select stations, to provide
data on recruitment prospects.
The exploitable biomass index is based only on male Snow Crab of legal size (≥95 mm CW). It
is used together with an exploitable biomass index from the CPS trap survey to evaluate trends
in biomass available to the fishery. In ADs 3L Inshore and 4R3Pn, no trawl survey is conducted,
so the CPS and DFO trap survey(s) exploitable biomass index is used. This is less preferred
because trends in trap survey indices tend to lag behind trawl survey indices by a year or two in
showing changes in stock size (Mullowney et al. 2018b).
Trawl and trap survey exploitable biomass indices are derived using ogive mapping (‘Ogmap’)
(Evans et al. 2000). Biomass estimates are not absolute because the capture efficiency of Snow

 8
Newfoundland and Labrador Region 2HJ3KLNOP4R Snow Crab

Crab by the survey trawl is unknown, but low, and the effective fishing area of a baited trap is
also unknown. Trawl efficiency is directly related to substrate type and crab size (Dawe et al.
2010), and so varies considerably spatially. Efficiency is lower and more variable on hard
substrates than on soft substrates. Trawl survey catch rates also appear affected by the diurnal
cycle, being higher during dark periods. Other potential factors affecting trawl catchability
include vessel and gear configuration. Trap effective fishing areas could potentially be affected
by numerous factors including bait type, quantity, and quality, soak times, gear spacing, ocean
currents, and crab density. For the trawl and AD-level trap surveys, raw Ogmap exploitable
biomass estimates were adjusted by a catchability factor (Q) in each AD. This Q was
determined through logbook catch rate Delury depletion models, with each year in the time-
series scaled by a time-series Q, calculated as the median ratio of annual survey biomass to
Delury logbook biomass in each AD. For trap surveys, the effective fishing area of a trap was
estimated at 0.01 km2 to enable spatial expansion and biomass estimation in Ogmap.
Bottom trawl surveys also provide data on recruitment, defined as crab just entering into the
exploitable biomass. Recruitment prospects for the upcoming fishery are inferred from biomass
indices or catch rates of new-shelled legal-sized Snow Crab (immediate recruits) from post-
season or in-season trawl surveys. Trawl and trap surveys also provide indices of pre-recruit
abundance, based solely on adolescent (non-terminally-molted) males 65-94 mm CW. The
adolescents of these groups would be expected to be recruited into the exploitable biomass in
approximately two to four years.
Trawl surveys also provide abundance indices for males of all sizes. The abundance index for
the smallest Snow Crab consistently captured (approximately 15-50 mm CW) may indicate
recruitment prospects approximately five to seven years later, depending on AD. Longer-term
recruitment prospects are inferred from the relationship of exploitable biomass indices with the
annual average of monthly directional anomalies of the North Atlantic Oscillation (NAO) index.
The NAO is an index of the relative strength of atmospheric forcing in the Northern Atlantic and
its impacts have a strong impact on the ocean climate of the NL shelf, with positive phases
associated with generally cool conditions. The annual NAO anomalies are lagged by six to eight
years, with a smoothed 3-period moving average centred value used in cross-correlations. The
strong correlation of NAO with subsequent exploitable biomass at these lags is consistent with
the notion of strong effects of climate in regulating Snow Crab success in early life stages
(Dawe et al. 2008, Marcello et al. 2012).
Total annual mortality rates in any given year t ( ) were calculated as a 2-period moving
average of stage-specific biomass indices of exploitable Snow Crab:
 ( )
 = 1 −
 � ( − 1) + ( − 1)�
where,
 = recruitment (shell conditions soft, new)
 = residual (shell conditions intermediate, old, very old)
 t-1 = denotes survey of previous year
Trends in exploitation rate are inferred from changes in the exploitation rate index (ERI), defined
as landings divided by the exploitable biomass index from the most recent trap or trawl survey,
with biomass indices smoothed as a two-year moving average to account for year effects in
survey performance. Natural mortality rates are unknown, but predation is highest on smaller
crab (e.g.
Newfoundland and Labrador Region 2HJ3KLNOP4R Snow Crab

Finally, fishery CPUE is used as an index of fishery performance. Annual CPUE (kg/trap) is
based on logbook information on catch and effort for individual or daily set hauls and is
standardized using a linear mixed model incorporating main and random effects of time
(calendar day and year) and space (CMA nested in AD), as well as trap soak times. The CPUE
model also includes a weighting factor accounting for the importance of the grid cell (10’ x 10’
nautical mile) where the set occurred, defined as the number of years the cell has been fished.
Resource Status
 Landings & Effort
In AD 2HJ, landings have remained near 1,700 t for the past six years (Fig. 6), while effort has
remained consistent (Fig. 7). In AD 3K, landings have remained relatively low for the past
four years (6,000 t in 2019), while effort declined to a two-decade low in 2019. In AD 3L Inshore,
landings declined by 67% from a time-series high in 2015 to 2,750 t in 2019. The 2019 landings
were 7% below the TAC. In 2019, effort decreased from the time-series high to the time-series
average. In AD 3LNO Offshore, landings were the lowest level in two decades, declining by
48% from 2016 to less than 13,000 t in 2019 due to reductions in the TAC. Effort expanded
rapidly from 1992 to the mid-2000s and has oscillated at a similar level until decreasing in 2019
to a two-decade low. In AD 3Ps, landings increased from decadal lows to almost 2,800 t in
2019, exceeding the 2,649 t TAC. Effort declined by 60% since 2014 to approach its lowest
level in two decades in 2018 and remained low in 2019. Finally, in AD 4R3Pn, landings have
steadily declined since a recent peak in 2013 and were 186 t in 2019, 39% below the TAC,
while effort has remained at a low level.

 10
Newfoundland and Labrador Region 2HJ3KLNOP4R Snow Crab

Figure 6: Annual landings and TAC by Assessment Division (1995-2019); solid gray bars are landings,
horizontal yellow lines are the TAC.

 11
Newfoundland and Labrador Region 2HJ3KLNOP4R Snow Crab

Figure 7: Annual effort (trap hauls) by Assessment Division.

 12
Newfoundland and Labrador Region 2HJ3KLNOP4R Snow Crab

 Figure 8: Fishery CPUE (kg/trap) by Assessment Division. Solid line is standardized CPUE and
 shaded band is 95% confidence intervals. Dotted lines are raw means and hashed lines are raw
 medians. Vertical dashed line represents the beginning of the cod moratorium in most ADs.

 13
Newfoundland and Labrador Region 2HJ3KLNOP4R Snow Crab

 CPUE
Fishery CPUE trends lag behind survey biomass trends by one to two years in most ADs, thus
the fishery is typically delayed in reflecting stock status. In AD 2HJ, standardized CPUE has
remained near the decadal average in recent years (Fig. 8). In AD 3K, standardized CPUE
increased in 2019 from a time-series low in 2017 to near the time-series average. In AD 3L
Inshore, in 2018 standardized CPUE had declined by 68% since 2013 to below 5 kg/trap, its
lowest level in the time-series, increasing only slightly to around 5 kg/trap in 2019. In AD 3LNO
Offshore, standardized CPUE most recently peaked near a time-series high in 2013 and
declined to its lowest level since 1992 in 2018. It increased in 2019, but is still at a historic low
level. In AD 3Ps, standardized CPUE increased from time-series lows in 2016 and 2017 to more
than 5 kg/trap in 2018 and further increased in 2019. Finally, in AD 4R3Pn, standardized CPUE
has increased from a low in 2018 to near time-series average in 2019.
 Exploitable Biomass
Multispecies trawl surveys indicate that the exploitable biomass was highest at the start of the
survey series (1996-98) (Fig. 9). It declined from the late-1990s to 2003 and then varied without
trend until 2013. From 2013 to 2016, it declined by 80%. There have been modest increases in
the past three years, with a further increase in 2019, though still below the previous low levels of
the mid-2000s. Meanwhile, the trap survey index declined by nearly 60% in 2017 and 2018 to a
time-series low. It increased slightly in 2019, but remains near the time-series low (Fig. 10). The
lack of residual crab in the exploitable biomass in recent years is concerning and in-part reflects
a relatively high level of exploitation occurring on the stock coupled with a prolonged period of
poor productivity; however, 2019 shows some positive signs of increasing residual crab.

Figure 9: Trawl survey exploitable biomass indices (t * 1000) by shell condition for combined ADs. Soft
and new-shell crab represent recruitment (green) and intermediate and old-shell crab represent residual
biomass (red). Dashed lines shows annual estimates and solid lines are two-year moving average
estimates. Shaded grey 95% confidence intervals apply to annual estimates.

 14
Newfoundland and Labrador Region 2HJ3KLNOP4R Snow Crab

Figure 10: Trap survey exploitable biomass indices (t * 1000) for combined ADs. Dashed line shows
annual estimate, shaded area represents the 95% confidence intervals, and solid line is two-year moving
average estimate.

In AD 2HJ, the exploitable biomass index has changed little during the past 15 years
(Figs. 11-12). Despite consistency across the two surveys, stock status interpretation is
compromised by incomplete trap surveys in the past three years (Fig. 12) and reduced
coverage of the fall multispecies trawl survey in 2019. In AD 3K, the post-season trawl
exploitable biomass index increased slightly from near time-series lows for the past five years,
however there was reduced coverage of the fall multispecies trawl survey in AD 3K in 2019
(primarily in areas of traditionally low Snow Crab biomass). The increase is not reflected in the
trap survey, which may be due to exclusion of a key Snow Crab area in the trap survey in 2019.
In AD 3L Inshore, the exploitable biomass is severely depleted in some areas. The trap survey
exploitable biomass index remained near a time-series low in 2019, and was particularly low in
CMAs 6B, 6C and 9A (Fig. 1). In AD 3LNO Offshore, the trawl-derived exploitable biomass
index showed an increase in 2019, however the trap-derived exploitable biomass index showed
a more modest increase and remains near the time-series low. In AD 3Ps, the trawl and trap
survey exploitable biomass indices showed conflicting signals in 2019, with a similar level as
2018 in the in-season trawl survey and an increase in the post-season trap survey index.
However, the increases in exploitable biomass appear to be concentrated on the major fishing
grounds and there is uncertainty as to whether they will be sustained into 2020. Finally, in AD
4R3Pn, the exploitable biomass is very low, with few residual Snow Crab in the population. The
trap survey exploitable biomass index most recently peaked in 2012 and declined to a time-
series low in 2017. The index increased slightly in 2018 and 2019 (Fig. 12).

 15
Newfoundland and Labrador Region 2HJ3KLNOP4R Snow Crab

Figure 11: Trawl survey exploitable biomass indices (t * 1000) by shell condition for trawl-surveyed
Assessment Divisions. Soft and new-shell crab represent recruitment (green) and intermediate and old-
shell crab represent residual biomass (red). Dashed lines shows annual estimates and solid lines are two
year moving average estimates. Shaded grey 95% confidence intervals apply to annual estimates.

 16
Newfoundland and Labrador Region 2HJ3KLNOP4R Snow Crab

Figure 12: Trap survey exploitable biomass indices (t * 1000) by Assessment Division. Dashed line shows
annual estimate, shaded area represents the 95% confidence intervals, and solid line is two-year moving
average estimate. White dots depict incomplete surveys.

 17
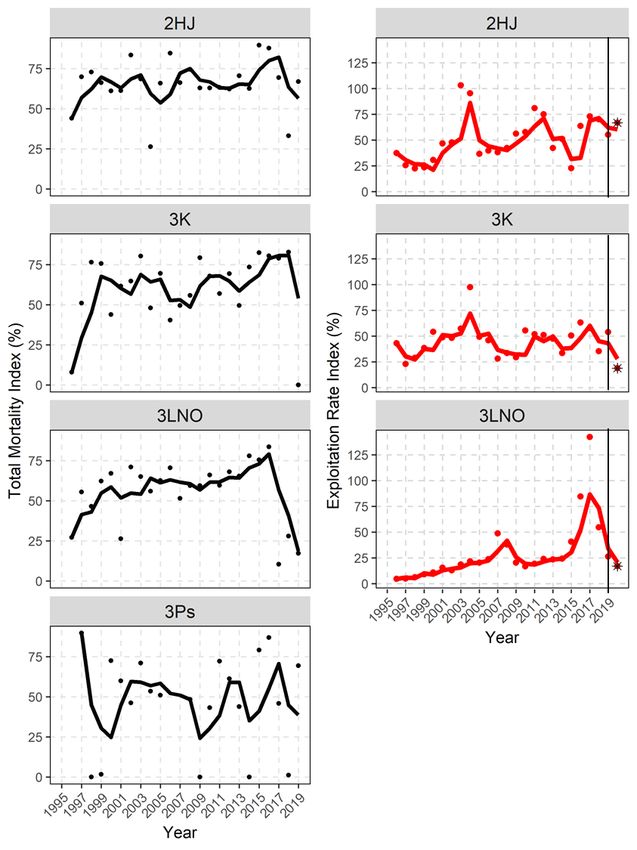
Newfoundland and Labrador Region 2HJ3KLNOP4R Snow Crab

 Mortality
Total mortality in exploitable crab was very high in all ADs during 2015-17 (Fig. 13). There are
no indices of total mortality for ADs 3L Inshore and 4R3Pn as this calculation uses trawl survey
data. In AD 2HJ, total mortality declined slightly in 2018, with a further decline in 2019. In AD
3K, total mortality was at its highest level for the past three years, however, it declined in 2019.
In AD 3LNO Offshore, total mortality declined from its highest observed level in 2016 to a time-
series low in 2019. Finally, in AD 3Ps, total mortality in exploitable crab has varied considerably
throughout the times-series, but the two-year moving average remained low in 2019. The high
variability in the total mortality index in AD 3Ps likely reflects the shell condition-based
methodology, with a spring survey potentially compromising the efficacy of the subjective shell
condition classifications.
Trends in total mortality generally reflect those of fishing-induced mortality, as measured by
exploitation rate indices. ADs currently experiencing notable recovery in the exploitable biomass
(3K, 3LNO Offshore) are associated with reduced total mortality rates and associated reductions
in exploitation rates, while ADs remaining at low levels with little signs of recovery (2HJ) are
associated with persistent high total mortality and exploitation rates. Evidence suggests that
reducing exploitation rates constitutes an effective strategy toward promoting recovery of the
exploitable biomass. This is further bolstered by the presence of stronger residual components
to the exploitable biomass in less heavily exploited areas.
In AD 2HJ, the exploitation rate index has been at or above the long-term average for the past
four years (Fig. 13). Status quo removals in 2020 would maintain the exploitation rate index at
this high level. In AD 3K, the exploitation rate index declined from a decadal high in 2017 to
near time-series average levels in 2019. Under status quo removals in 2020 the exploitation rate
index would decrease to time-series lows. In AD 3LNO Offshore, the exploitation rate index
increased by a factor of five from 2014-17, but decreased in 2019 to at or near time-series
average levels. The exploitation rate index would decline slightly with status quo removals in
2020.
There are no trawl-based biomass indices available in ADs 3L Inshore and 4R3Pn from which to
calculate exploitation rate indices. Accordingly, the shorter time-series of trap surveys are used
as the basis (Fig. 14).The trap-based biomass index is also used for AD 3Ps as the trawl survey
takes place within season, as opposed to post-season as in the other ADs. In AD 3L Inshore,
the overall trap survey-derived exploitation rate index increased to its highest observed level in
2018, but decreased in 2019 closer to the time-series average. The decline in exploitation rate
index does not wholly reflect management control, but rather an inability to take quotas in some
areas, and if recent quotas were fully taken the exploitation rate index would be higher. Status
quo removals would decrease the exploitation rate index to a time-series low in 2020. In AD
3Ps, the exploitation rate index increased slightly in 2019, but remained low. The exploitation
rate index would decline with status quo removals in 2020. In AD 4R3Pn, the overall exploitation
rate index declined to near the time-series low in 2019. Status quo removals in 2020 would
further decrease the exploitation rate index.

 18
Newfoundland and Labrador Region 2HJ3KLNOP4R Snow Crab

Figure 13: (Left panels) Trends in the annual (points) and two year moving average (solid line) total
annual mortality index (%) of exploitable crab by Assessment Division. Note if annual mortality index was
Newfoundland and Labrador Region 2HJ3KLNOP4R Snow Crab

Figure 14: Trends in the annual (points) and two year moving average (solid line) trap-based exploitation
rate indices (%) by Assessment Division; 2020 stars depict annual projected exploitation rate indices
under status quo removals in the 2020 fishery.

 Recruitment
Overall recruitment into the exploitable biomass has been very low in recent years and will
remain low in 2020 (Fig. 9). In most ADs, the exploitable biomass is presently dominated by
incoming recruits. In AD 2HJ, recruitment into the exploitable biomass has changed little during
the past 15 years (Fig. 11). The 2019 trawl survey suggests recruitment will remain unchanged
in 2020. This suggests little change in fishery prospects for 2020. In AD 3K, the post-season
trawl and trap survey indices of recruitment into the exploitable biomass have shown some
slight increases in 2019 (Fig. 11 and Fig. 15), suggesting potential for improvement in the
fishery in 2020. In AD 3LNO Offshore, recruitment into the exploitable biomass has been at or
near time-series lows in both the trawl (Fig. 11) and trap (Fig. 15) surveys in recent years, but
increased slightly in 2018 and 2019. This suggests better prospects for the 2020 fishery. In AD
3Ps, there were conflicting signals in the trawl and trap surveys, with the trap survey showing a
larger increase. Recruitment into the exploitable biomass was near a decadal high in 2018 and
2019 (Fig. 11 and Fig. 15), with the exception of Fortune Bay. Due to the conflicting signals
between surveys, there is uncertainty surrounding the degree of improved prospects for the
2020 fishery.
For ADs where no trawl surveys occur, trap-derived indices are used. In AD 3L Inshore
recruitment into the exploitable biomass steadily declined to a time-series low in 2017 and
recruitment indices from DFO and CPS trap surveys remained near their lowest levels in 2019
(Fig. 15). The increase in recruitment is localized to CMAs 5A, 8A and 9A, and not seen across
the AD. This suggests a continuation of a depleted exploitable biomass and a poor performing
fishery in that AD in 2020. In AD 4R3Pn, recruitment into the exploitable biomass was low from
2014 to 2017; however, survey data from 2018 and 2019 (Fig. 15) suggest localized
improvements may occur in 2020.

 20
Newfoundland and Labrador Region 2HJ3KLNOP4R Snow Crab

Figure 15: Trends in CPUE (kg/trap) by shell condition (blue = total, red = residuals, green = recruits) for
exploitable crab from core stations in the CPS survey in Assessment Divisions (2004-19). Shaded area
represents the 95% confidence interval.

 21
Newfoundland and Labrador Region 2HJ3KLNOP4R Snow Crab

Pre-recruit abundance indices for trawl and trap surveys provide an index of recruitment
prospects for the next two to four years. In reality however, the proportion of the 65–94 mm CW
adolescents measured by these surveys that reach the exploitable biomass depends on several
factors including mortality and the size at which crab terminally molt. The overall abundance of
pre-recruits in the stock increased to near or above the time-series average in 2019. This largely
reflects trends in the largest AD (3LNO Offshore). Both surveys are suggesting the potential for
localized improvements of recruitment into the exploitable biomass in forthcoming years, with
the exception of AD 2HJ (Figs. 16-17). Potential for localized improvements of recruitment are
suggested by increased abundance of pre-recruits in the trap surveys in ADs 3K, 3L Inshore,
3LNO Offshore, and 4R3Pn. Although there was a decrease in AD 3Ps, the pre-recruit
abundance index remains at a high level for the time-series. These localized aggregations
appear most pronounced in CMAs 3BC, 9A, and MSX, where there were large pulses of
adolescents in 2019. The scenario of low exploitable biomass levels in these ADs coupled with
increased potential of recruitment into the biomass suggests soft-shell crab incidence may be
high in the fishery in some areas over the next couple of years if measures to ensure efficient
transition of these crab into the exploitable biomass are not taken.
 Ecosystem Perspective
Overall, broad-scale climate indices appear favourable for improved recruitment to occur in
most major areas of the stock range over the next few years (Fig. 18). However, the recent
positive NAO phase did not translate into bottom conditions as cold as observed in the early-
1990s which created favourable conditions for young stages of crab. The thermal habitat index
(defined as the areal extent of
Newfoundland and Labrador Region 2HJ3KLNOP4R Snow Crab

Figure 16: Overall trawl survey pre-recruit biomass index (t * million) by Assessment Division (1995-
2019).

 23
Newfoundland and Labrador Region 2HJ3KLNOP4R Snow Crab

Figure 17: Annual CPUE (#/trap) of pre-recruits from small-mesh traps at core stations in the CPS trap
survey by Assessment Division (2004-19).

Figure 18: Stock-level exploitable biomass index in relation to a lagged index of the North Atlantic
Oscillation (NAO) defined as an average of monthly values from six to eight years ago.

 24
Newfoundland and Labrador Region 2HJ3KLNOP4R Snow Crab

Figure 19: Snow Crab thermal habitat indices by Assessment Division and year (1980-2019). Note: f = fall
and s = spring.

Since the collapse of most of the finfish community in the early-1990s, the Snow Crab resource
appeared to have largely been under bottom-up temperature control for much of the past two
decades (Mullowney et al. 2014). However, recent assessments have highlighted that other
factors such as top-down forcings from heavy exploitation and increased predation have
increased in importance.
While predation mortality remains high in recent years, there have been declines from the peaks
of 2016-18 (Fig. 20). Given that the regulating effect of predation is thought to be most important
on small to intermediate-sized crab (Chabot et al. 2008), a delay would be expected between
the time the predation index decreases and crab become available to the fishery. A decline in
predation mortality coupled with now decreased fisheries exploitation rates and increasing pre-
recruit abundance indices in most ADs (Fig. 17) indicates a positive outlook in the next two to
seven years if fishing pressure levels remain low enough to allow the crab to continue to recruit
into the exploitable biomass.

 25
Newfoundland and Labrador Region 2HJ3KLNOP4R Snow Crab

Figure 20: Consumption of Snow Crab by predators by Assessment Division. Green represents estimated consumption and red is an index of
predation mortality.

 26
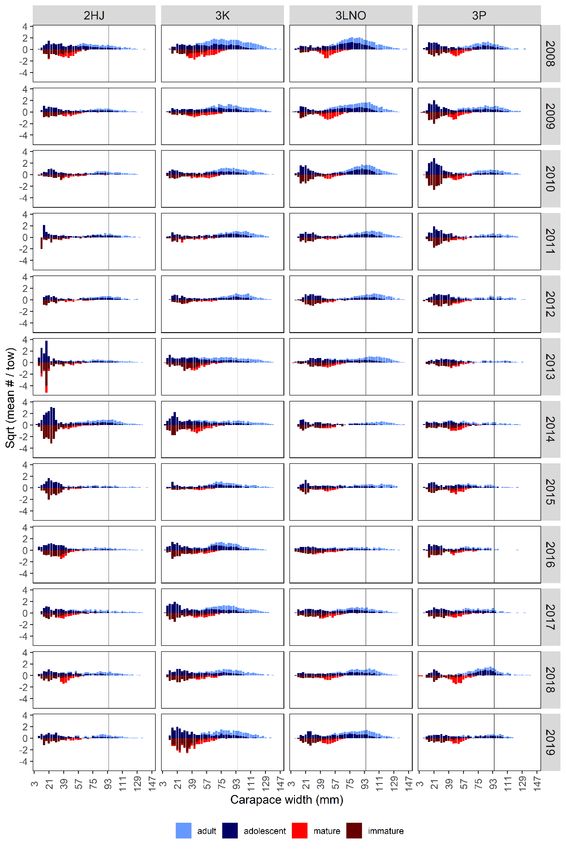
Newfoundland and Labrador Region 2HJ3KLNOP4R Snow Crab

With respect to overall ecosystem productivity, ecosystem conditions in the NL Bioregion are
indicative of a low productivity state. Total community biomass levels remain much lower than
prior to the collapse in the early-1990s. The concerns of low ecosystem productivity extend into
the bases of the food-web, with changes in zooplankton community structure (less large energy-
rich and more small less energy-rich copepods) as well as changes in seasonality (weaker
spring and stronger summer and fall zooplankton signals) which may impact the quality and
timing of transfer of energy to higher trophic levels.
 Outlook
There is still concern about the future of the Snow Crab stock in NL, particularly because the
overall exploitable biomass remains near low levels. However, there are indications that several
ecosystem-related factors may be encouraging both short and long-term growth of the stock,
including cool bottom water temperatures and a decline in predation. There are also signals of
increased abundances of pre-recruit and small-sized Snow Crab (Fig. 21), particularly in ADs
3K and 3LNO Offshore, indicating a positive outlook in the next two to seven years if fishing
pressure levels allow the crab to recruit into the exploitable biomass.
Compounding potential issues of a low productivity state is that recruitment levels which already
appear modest relative to historic highs are likely to be further moderated by intrinsic growth
responses of males. A sharp decline in male size-at-maturity (i.e., size-at-terminal molt)
occurred in all major ADs in recent years (DFO 2019). Explicit reasons for this growth response
in males is unknown with investigations on-going, but both bottom-up (temperature, nutrition)
and top-down (fishing, predation) influences, or a combination of several factors, could be
causalities. The emergence or potential reversal of this phenomenon will be important to
monitor moving forward as persistent decreased size-at-maturity would negatively impact stock
and subsequently fishery productivity.

 27
Newfoundland and Labrador Region 2HJ3KLNOP4R Snow Crab

Figure 21: Abundance indices by carapace width for juveniles plus adolescent males (dark blue), adult
males (light blue), immature females (dark red), and mature females (red) from spring (AD 3Ps) and fall
(ADs 2HJ, 3K, and 3LNO) trawl surveys. Vertical line is legal-size. Data standardized by vessel.

 28
Newfoundland and Labrador Region 2HJ3KLNOP4R Snow Crab

 Precautionary Approach
In June 2018, DFO Science held a CSAS Regional Peer Review process to develop a
Precautionary Approach (PA) Framework for Snow Crab in the NL Region. The key objective of
the meeting was to define Limit Reference Points (LRPs) consistent with the PA for
Newfoundland and Labrador Snow Crab, based on the best scientific information available.
DFO Science proposed a PA Framework for the NL Snow Crab resource and fishery
(Mullowney et al. 2018b). The adopted parts of the framework include the LRPs, differentiating
the Critical from Cautious Zones, and the Upper Removal Reference (URR). Harvest Control
Rules (HCRs) and Upper Stock References (USRs) have been proposed but not adopted into
the framework. Accordingly, proposed USRs presented in this assessment are tentative. The
overarching HCR for the framework is that the stock is considered to be in the lowest zone of
the three metrics examined, which include female egg clutches, fishery CPUE, and fishery
discards. The framework uses generalized additive models, peer-reviewed in a previous
assessment, to project forward one year anticipated fishery CPUE and discard rates.
In 2020 most ADs are projected to fall within the provisional cautious zone of the DFO Science
proposed Precautionary Approach Framework with the exception of AD 3LNO Offshore which is
projected to be in the healthy zone (Fig. 22). These projections assume status quo landings.
In early-2020, members of the harvesting sector submitted an alternative PA Framework for
Snow Crab to be reviewed by DFO Science. It was noted during the 2020 Snow Crab
assessment that several participants from the harvesting sector do not support DFO Science’s
current proposed PA framework for use in decision-making.

 29
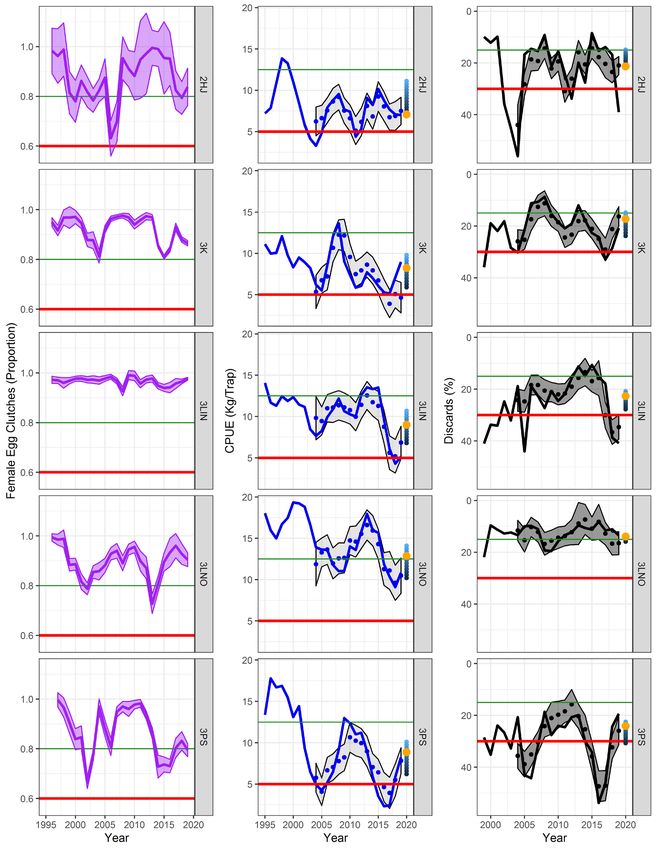
Newfoundland and Labrador Region 2HJ3KLNOP4R Snow Crab

Figure 22: Observed trends in proportion of females with full egg clutch (left), CPUE (middle), and %
discards (right) (solid lines) as well as predicted values for CPUE and discards (points) in relation to Limit
Reference Points (red horizontal lines) and provisional Upper Stock References (green horizontal lines)
for each metric in the proposed Precautionary Approach Framework, by Assessment Division. Shaded
areas represent 95% confidence (egg clutches) or prediction (CPUE and discards) intervals. Orange
points represent predicted values under status quo landings in forthcoming fishery. Vertical blue shades
in 2020 are the predicted values under varying levels of Exploitation Rate Index (ERI) (light to dark blue:
ERI = 0-60%).

 30
Newfoundland and Labrador Region 2HJ3KLNOP4R Snow Crab

Sources of Uncertainty
There are several sources of uncertainty that affect the interpretation of trends in biomass,
recruitment, and mortality that represent the basis for this assessment. Uncertainties that affect
post-season survey indices are more important than those that affect indices based on fishery
performance because surveys are used to predict fishery performance. In contrast, past fishery
performance does not predict future fishery performance.
 Surveys
Interpretation of trends in exploitable biomass and pre-recruit abundance indices from surveys
is highly uncertain if the survey was incomplete, such as in AD 2HJ trap surveys in the past
three years. There are consistent issues with coverage in the CPS trap survey that affect the
interpretation of stock status trends, including spatial bias and abandonment of survey areas in
times of poor fishery performance. As well, the multispecies trawl surveys fail to sample inshore
areas in some NAFO Divisions. Additionally, the multispecies trawl survey in Fall 2019
experienced a significant number of un-fishable weather days and sea conditions which
impacted coverage in ADs 2HJ and 3K most significantly. In an attempt to determine the
impacts of this reduced coverage on the exploitable biomass estimates in these ADs, test
datasets were generated mimicking the 2019 coverage for the time-series, as well as using the
maximum, median, and minimum catches from 2016-18 to generate datasets of possible
catches for the missed strata in 2019. Analyses of these datasets found it to be likely that the
2019 exploitable biomass indices for ADs 2HJ and 3K are overestimations, particularly in AD
2HJ.
Trawl efficiency is directly related to substrate type and crab size, and so varies considerably
spatially. Efficiency is lower and more variable on hard substrates than on soft substrates. Thus,
annual survey catchability depends on the conditions at the positions randomly selected for the
survey each year. Interpretation of indices from the spring trawl survey in AD 3Ps is more
uncertain than for those from the fall surveys because they occur after a variable fraction of
fishery removals.
Exploitable biomass indices and pre-recruit catch rates from trap surveys are also affected by
annual variation in catchability of crabs. There is uncertainty in interpreting trends from the CPS
survey because it has limited spatial coverage. Also, catch rates in this survey may be affected
by adverse weather and other factors that affect soak time and trap efficiency.
For the present assessment, all biomass estimates were smoothed as two-year moving
averages to partially account for such inconsistencies in annual survey performance.
Small-meshed traps are included in sampling by the CPS trap survey at some stations in most
areas to provide an index of future recruitment based on catch rates of pre-recruits. However,
there is uncertainty associated with historically limited spatial coverage by small-meshed traps,
especially in shallow-water small-crab habitat, and high variability in trap catchability. Small
adolescents may be particularly susceptible to trap catchability effects due to competition with
larger and adult males. Recent efforts to increase the amount and distribution of small-mesh
pots, as well as broader distribution of the CPS survey stations should address some of these
uncertainties going forward.
Crab movements across divisional boundaries may affect the extent to which distributions
during timing of various surveys are reflected in subsequent fisheries or the extent to which
modes of growth progression can be followed from one year to the next. In the 2019
assessment, there was evidence presented of a large redistribution of exploitable crab out of
AD 3K and into AD 2HJ during the past year and back into AD 3K in 2019. Such issues have

 31
Newfoundland and Labrador Region 2HJ3KLNOP4R Snow Crab

the potential to greatly affect stock status interpretations at small spatial scales such as the
CMAs used to manage the fishery.
 Short-Term Recruitment
Predicting recruitment is complicated by variation in the proportion of pre-recruits that molt in
any given year. Molt frequency is inversely related to body size and directly related to
temperature such that growth is slower under cold regimes (e.g. Divs. 3LNOPs) than under
warm regimes (e.g. Divs. 2J3K4R).
 Long-Term Recruitment
There is high uncertainty about the reliability of qualitatively relating recent climate events to
long-term recruitment potential. Strong direct linkages of future biomass to climate forcings such
as the NAO (Colbourne et al. 2011) could fail if additional factors such as excessive fishing or
high predation affect recruitment and yield. Moreover, under greenhouse gas-forced warming,
there is uncertainty regarding whether such long-term oscillations will persist as they have in the
past or how they will interact with additional forcings.
 Fishery Indices
Completion and timely return of logbooks is mandatory in this fishery. Data for the current year
is typically incomplete at the time of the assessment and so the associated CPUE and effort
values are potentially biased and considered preliminary. Overall, for the current assessment,
approximately 60% or more of the 2019 logbooks were available for each AD. ADs 3K, 3L
Inshore and 3LNO Offshore had returns greater than 80%, while the other ADs had lower
returns. The reliability of the logbook data can be suspect with respect to effort (i.e., under-
reporting) and areas fished. However, logbook data provide the broadest coverage and
therefore the most representative fishery performance index.
There is uncertainty regarding the effects of changes in some fishing practices (e.g., location,
seasonality, soak time, trap mesh size, high-grading, and bait efficiency) on commercial catch
rates (CPUE) and their interpretation as indicators of trends in exploitable biomass. Some of
these changes (e.g., in mesh size and soak time) also affect catch rates of undersized crabs
and so can compromise the utility of catch rate of undersized crabs as an index of future
recruitment.
Fishery catch rates are standardized in a mixed model incorporating fishing day and soak time
to account for potential inaccuracies, but other factors remain that can potentially bias their
utility as indices of fisheries performance. Fishery CPUE is also characterized by both a lag in
response to changes in stock size and an asymptotic curve indicative of trap saturation which
affects its ability to measure exploitable biomass.
There are concerns regarding the utility of the observer data from at-sea sampling during the
fishery due to low and inconsistent spatio-temporal coverage, especially in ADs 2HJ, 3L Inshore
and 4R3Pn. These concerns introduce bias in interpreting trends in catch rates at broad spatial
scales. Observer-based indices are also biased by inconsistent sampling methods and levels
resulting from changing priorities. There are also concerns relating to variability in experience of
observers in subjectively assigning shell stages. This introduces uncertainty in inferring recent
recruitment trends and prospects based on catch rates of new-shelled crabs.
 Mortality Indices
Indices of fishery-induced mortality are subject to uncertainties associated with both survey and
fishery data. Mortality indices are not estimated for years when the associated survey biomass
index was not available or reliable. Total mortality estimation relies on shell-condition
classifications, and such classifications may be especially difficult during spring surveys. An

 32
Newfoundland and Labrador Region 2HJ3KLNOP4R Snow Crab

exploitation rate index is estimated for ADs 3L Inshore and 4R3Pn based on the post-season
trap survey biomass index. However, this index may be biased by annual changes in the
distribution of crabs or fishing effort inside versus outside the limited survey areas.
 Ecosystem Change
Prolonged warming to approximately 2010-12 in waters surrounding most of NL promoted a
general loss of productivity in coldwater crustaceans such as Snow Crab and Northern Shrimp
(Pandalus borealis) and some recovery in pelagic and groundfish species. However, bottom
conditions have since cooled. The extent of community reorganizations resulting from such
instability and change is unknown. Ultimately, if temperatures continue to warm as expected
under greenhouse gas scenarios, the prognosis for Snow Crab would be poor. However, the
rates, extent, and even direction of future climate and community changes in the marine shelf
ecosystem are highly uncertain. Moreover, it is uncertain the extent to which changes in
zooplankton community structure will resonate through the food-web to affect future Snow Crab
success.

CONCLUSIONS AND ADVICE
Assessment Division 2HJ
The exploitable biomass has consisted largely of incoming recruits for the past fifteen years with
few residual Snow Crab in the population. This suggests high mortality of large adult males. The
exploitation rate index has been high throughout most of the time-series relative to other ADs
within NL, as well as other fished Snow Crab stocks globally. Status quo removals in 2020
would maintain the exploitation rate index at a high level. It is advised to lower the exploitation
rate to promote recovery of the exploitable biomass. Following the DFO Science proposed
Precautionary Approach the stock status would be projected to be in the provisional cautious
zone in 2020 with no recovery toward the provisional healthy zone.
Assessment Division 3K
The exploitable biomass has consisted largely of incoming recruits for the past five years with
few residual Snow Crab in the population, however there was a signal of increased residual
Snow Crab in the population in 2019. Total mortality in exploitable crab decreased in 2019 from
a very high level in recent years. This drastic decrease appears due in part to a shift in the
distribution of exploitable crab back into AD 3K from AD 2HJ in 2019. The exploitation rate index
has been high throughout most of the time-series relative to other ADs within NL, as well as
other fished Snow Crab stocks globally, but has started to decline. Status quo removals in 2020
would reduce the exploitation rate index to a time-series low. Following the DFO Science
proposed Precautionary Approach the stock status would be projected to be in the provisional
cautious zone in 2020 with no recovery toward the provisional healthy zone.
Assessment Division 3L Inshore
The exploitable biomass is severely depleted in some areas, increased slightly overall in 2019,
but remains near the time-series low. Catch rates have been particularly low in CMAs 6B and
6C, with no signals of upcoming recruitment. The overall exploitation rate index decreased from
very high levels over the past five years; however, it remained high in many of the CMAs in this
AD in 2019. The decline in exploitation rate does not wholly reflect management control, rather
an inability to take quotas in some areas, and if recent quotas were fully taken the exploitation
rates would be higher. Status quo removals would reduce the exploitation rate index in 2020.
Following the DFO Science proposed Precautionary Approach, the stock status would be
projected to be in the provisional cautious zone in 2020 with no recovery toward the provisional
healthy zone.

 33
Newfoundland and Labrador Region 2HJ3KLNOP4R Snow Crab

Assessment Division 3LNO Offshore
The exploitable biomass has undergone some recovery in the past three years and there is a
signal of increased residual Snow Crab in the population in 2019. This recovery has been
associated with a decrease in exploitation rate and a reduced level of total mortality in
exploitable crab. Status quo removals would reduce the exploitation rate index to near the long-
term average in 2020. This is a level near which productive fisheries have historically occurred.
Following the DFO Science proposed Precautionary Approach the stock status would be
projected to be in the provisional healthy zone in 2020; however increases in exploitation rate
could result in an inability of stock status indices to reach the provisional healthy.
Assessment Division 3Ps
Signals in the exploitable biomass index between the trawl and trap surveys are conflicting in
2019, with a slight decrease in exploitable biomass index in the trawl survey, but an increase in
the trap survey. The trap survey increase appears to be concentrated in the major fishing
grounds and it is uncertain if they will be sustained into 2020. Total mortality in exploitable crab
was high in 2019, but the three year moving average was much lower. Status quo landings
would result in the exploitation rate index reaching a time-series low in 2020. Following the DFO
Science proposed Precautionary Approach, the stock status would be projected to be in the
provisional cautious zone in 2020, with potential to fall into the provisional critical zone with a
high exploitation rate.
Assessment Divisions 4R3Pn
The exploitable biomass is very low; however there have been slight improvements in the last
two years. These improvements are primarily due to recruitment, with low levels of residual
Snow Crab in the population in this AD. Status quo removals would reduce the exploitation rate
index in 2020 to a time-series low. A high incidence of soft-shell crab in the fishery in CMA 12EF
is anticipated under high exploitation. It is advised to set the exploitation rate index at a low level
in 2020 to promote further recovery of the resource.

OTHER CONSIDERATIONS
Bitter Crab Disease
Bitter Crab Disease (BCD) is fatal to crab and predominately occurs in new-shelled crab of both
sexes. It appears to be acquired during molting and can be detected visually during autumn.
Surveys indicate that it has been most persistent in AD 3K, albeit at low levels, however there
was a decrease in incidence in 2019. Prevalence is most typical in small Snow Crab (Mullowney
et al. 2011). Although BCD had been unusually high in large males in AD 3K in recent years,
there were no large males observed with BCD in 2019.
Reproductive Biology
The percentage of mature females carrying full clutches of viable eggs has generally remained
high throughout the time-series wherever measured, but localized declines in heavily fished
areas have been observed in recent years. Fishery-induced mortality on mature males
(including undersized males) could adversely affect insemination of females in the presence of
high exploitation. A current study is investigating the presence of sperm limitation in females
associated with high exploitation rates of males in some areas in recent years.
Management Considerations
Conservation measures that exclude females and males smaller than 95 mm CW, including a
portion of the adult (large-clawed) males, from the fishery are aimed to protect reproductive

 34
You can also read