Reduction in life expectancy in Brazil after - COVID-19 - Nature
←
→
Page content transcription
If your browser does not render page correctly, please read the page content below
Articles
                                                                                                          https://doi.org/10.1038/s41591-021-01437-z

Reduction in life expectancy in Brazil after
COVID-19
Marcia C. Castro 1 ✉, Susie Gurzenda                         1
                                                              , Cassio M. Turra            2
                                                                                            , Sun Kim         1
                                                                                                               , Theresa Andrasfay               3
                                                                                                                                                     and
Noreen Goldman4

Brazil has been heavily affected by coronavirus disease 2019 (COVID-19). In this study, we used data on reported total deaths
in 2020 and in January–April 2021 to measure and compare the death toll across states. We estimate a decline in 2020 life
expectancy at birth (e0) of 1.3 years, a mortality level not seen since 2014. The reduction in life expectancy at age 65 (e65) in
2020 was 0.9 years, setting Brazil back to 2012 levels. The decline was larger for males, widening by 9.1% the female–male
gap in e0. Among states, Amazonas lost 60.4% of the improvements in e0 since 2000. In the first 4 months of 2021, COVID-19
deaths represented 107% of the total 2020 figures. Assuming that death rates would have been equal to 2019 all-cause rates
in the absence of COVID-19, COVID-19 deaths in 2021 have already reduced e0 in 2021 by 1.8 years, which is slightly larger than
the reduction estimated for 2020 under similar assumptions.

A
         s of 9 June 2021, COVID-19 has officially claimed more                expectancy. A summary of findings and implications of these esti-
         than 3.7 million lives worldwide, 48% of which were in the            mates is shown in Table 1.
         Americas. The actual death toll is likely to be higher due               Before COVID-19, e0 in Brazil lagged behind many countries
to deficient surveillance, limited testing that prevented proper               in Asia, Europe and the Americas. In Latin America, at least four
diagnosis, issues of compliance with protocols for reporting a sus-            countries experienced secular mortality declines at earlier dates:
pected COVID-19 death and location of the death (for example, at               Argentina, Uruguay, Costa Rica and Cuba9. Between 1945 and
home)1,2. Together, the United States and Brazil account for 28%               2020, e0 in Brazil increased from 45.5 years to 76.7 years10, an aver-
of the world’s death toll and 59% of the death toll in the Americas.           age of almost 5 months per calendar year. Similarly to Brazil, many
In both countries, the pandemic response in 2020 was disparate                 other countries in Latin America experienced a relatively fast pace
regionally, with lamentable national coordination3,4, resulting in             of mortality improvement during this period, benefitting from the
a high and unequal mortality burden5,6. Brazil continues to face               public health and medical progress of their forerunners9,11.
a challenging situation. April 2021 was the deadliest month since
the pandemic began: nine capital cities reported more deaths than              Results
births, and, by 25 April, the number of COVID-19 deaths in 2021                Decline in e0 and e65 in 2020. Based on the total number of deaths
surpassed that reported in 2020.                                               reported in Brazil in 2019 and 2020, we constructed period life
    The consequences of that death toll can be measured by e0, which           tables and calculated the difference in life expectancy between 2019
indicates the average number of years a newborn would be expected              and 2020 by state and sex (Methods). We estimated a reduction of
to live if born in a specific year and subject to the prevailing mortal-       1.31 years in e0 from 2019 to 2020 (Fig. 1a, Supplementary Table 1
ity rates in that year throughout life. Changes in e0 can reflect dif-         and Methods), with a larger drop for males (1.57 years) than females
ferences in expected longevity between two periods, such as before             (0.95 years). The highest absolute and relative decline among states
versus during a pandemic. For example, the 1918 influenza pan-                 was estimated for Amazonas (3.46 years), followed by Amapá (3.18
demic was estimated to have reduced e0 in the United States by 7–12            years) and Pará (2.71 years), all in the North region. Rio Grande do
years7. Mortality due to COVID-19 is estimated to have reduced e0              Sul, in the South, was the only state with an estimated increase in e0
in the United States by 1.13 years, setting it back to values observed         from 2019 to 2020 for both sexes (0.07 years) but a decline for males
in 2003 (ref. 8).                                                              of 0.11 years.
    Similarly, given the higher risk of dying from COVID-19 at older               We also estimated changes in e65 (Fig. 1b and Supplementary
ages5, the death toll can be measured by e65, defined as the average           Table 2)5. The estimated decline for Brazil was 0.94 years for both
number of years that a 65-year-old person would be expected to live            sexes, 0.66 years for females and 1.17 years for males. Across states,
if subject to the underlying mortality rates for ages 65 and above in          the largest declines were estimated for Amazonas (3.14 years),
a specific year.                                                               Amapá (2.46 years) and Pará (2.44 years). e65 declined by a larger
    Considering the large COVID-19 death toll in Brazil, with                  percentage for males than females in all states, reflecting men’s
marked regional inequalities, our goal was to quantify the loss in             higher risks of dying from COVID-19 (ref. 5). In Amazonas, male
e0 and e65 in 2020 and in the first 4 months of 2021 due to the pan-           e65 was estimated to decline by 20% from 2019 to 2020.
demic. Estimates are presented by sex and state, and we measured                   On average, larger declines in e0 and e65 were estimated in the North
and compared changes across states and in female–male gaps in life             regions and smaller in the South regions (Fig. 1c), broadly mirroring

Department of Global Health and Population, Harvard T. H. Chan School of Public Health, Boston, MA, USA. 2Demography Department, Cedeplar,
1

Universidade Federal de Minas Gerais, Belo Horizonte, Brazil. 3Leonard Davis School of Gerontology, University of Southern California, Los Angeles, Los
Angeles, CA, USA. 4Office of Population Research and Princeton School of Public and International Affairs, Princeton University, Princeton, NJ, USA.
✉e-mail: mcastro@hsph.harvard.edu

Nature Medicine | www.nature.com/naturemedicine
Articles                                                                                                               NATure MeDICIne

the patterns across states (Fig. 1d). States in the North and Northeast
have the worst indicators of income inequality, poverty, access to         Table 1 | Policy summary
infrastructure and availability of physicians and hospital beds12,13. In   Background            Brazil’s national response to the COVID-19
the Northeast, however, the estimated decreases in life expectancy                               pandemic has been distressing, resulting in a
in 2020 are smaller than in the North. Governors in that region                                  high and unequal mortality burden. The country
imposed the most rigorous measures of physical distancing, in direct                             comprises only 2.7% of the world’s population
opposition to recommendations from the President14. The South                                    but 12.7% of COVID-19 deaths worldwide (as of 9
was the last region to be severely hit by COVID-19 in 2020 (ref. 15),                            June 2021). That death toll will result in substantial
producing the relatively small estimates of life expectancy decline.                             reductions in life expectancy in 2020 and 2021,
    Following multiple decrement life table methods previously used                              with marked differences by sex and state.
to measure the effect of COVID-19 on life expectancy8,16,17, we cal-       Main findings and     Several methods were used to estimate the
culated two additional sets of estimates of life expectancy decline:       limitations           decline in life expectancy at birth and at age
(1) the difference between 2020 life expectancy estimated above                                  65. We show that 2020 life expectancy in the
and a scenario in which COVID-19 mortality has been eliminated                                   presence of COVID-19 is equivalent to mortality
from 2020 (DT20; Supplementary Tables 3 and 4 and Methods);                                      levels observed in Brazil as far back as 20 or
and (2) the difference between 2019 life expectancy estimated from                               more years in some states. The effect on 2021 life
2019 death records and a scenario in which 2019 all-cause mor-                                   expectancy is estimated to be even larger. Despite
tality has been inflated to include COVID-19 mortality (DT19;                                    the assumptions underlying these estimates, it is
Supplementary Tables 5 and 6 and Methods). Both methods resulted                                 unquestionable that the death toll from COVID-19
in larger estimates of life expectancy decline compared to the dif-                              in Brazil has been catastrophic.
ference between 2019 and 2020 period life tables (Supplementary            Policy implications   Our findings show that life expectancy in Brazil
Tables 1 and 2): for example, for Brazil (both sexes), the decline in                            declined substantially in 2020, that it is expected
e0 was estimated at 1.92 years (DT20) and 1.67 years (DT19) versus                               to decline even more in 2021 and that the
1.31 years (difference between 2019 and 2020 life tables).                                       pre-pandemic trajectory of improvement in life
    The main results presented in the text are based on differences                              expectancy is likely to slow down in at least the
between the 2019 and 2020 life tables, for two primary reasons. First,                           next 2 years. Without enhanced coordination of
differences in these period life expectancies capture both direct and                            the pandemic response, expansion of testing and a
indirect mortality effects of COVID-19 in 2020. Death rates from                                 rapid increase in vaccination, Brazil will continue to
non-COVID-19 causes in 2020 likely changed between 2019 and                                      experience an unbearable loss in human life.
2020, decreasing for some causes (for example, from reduced expo-
sure to other infections) and increasing in others (for example, from
delayed or foregone healthcare or overburdening of the healthcare          in e0 in Brazil over 2 decades, 19% were lost due to COVID-19
system). DT19 and DT20 assess the effect of including and exclud-          (Supplementary Table 8). Among the states, Amazonas lost approx-
ing, respectively, only deaths for which COVID-19 was listed as the        imately 60% for both sexes and 68% among males. In 15 states
underlying cause on the death certificate. Second, in contrast to          (including the entire Southeast region), this loss was higher among
DT19 and DT20, the method based on the difference in life expec-           males (Fig. 3a). A much higher loss was estimated for e65: 29% for
tancy between 2019 and 2020 makes no assumption about indepen-             both sexes in Brazil (Supplementary Table 9). Among males, two
dence of causes of death (that is, that the risks of dying from other      states, Amazonas and Pará, both in the North region, lost all that
causes are unaffected by the addition or elimination of COVID-19           was gained over 2 decades (Fig. 3b).
mortality), an assumption that was almost certainly violated during           As a result, estimated e0 in Brazil in the presence of COVID-19
the pandemic.                                                              reflects levels observed in 2014 (Supplementary Table 10). Among
                                                                           the states, the largest setback was estimated for Amazonas and Pará
Changes in the sex and state gaps in life expectancy. We com-              (levels of 2006 for both sexes, 2008 and 2010 for females and 2005
pared the gap in life expectancy between males and females in the          and 2002 for males). The estimated setback for e65 was overwhelm-
period life tables constructed for 2019 and 2020 (Methods). Our            ing, equalling values last observed as far back as the early 2000s in
results point to an overall widening of the female–male gap in e0 of       most states in the North region and before 2000 in Amazonas, Pará
0.6 years in Brazil (9.1% increase). In Amapá, the female–male gap         and Goiás.
is estimated to increase by 2.1 years, the highest among the states
(Fig. 2a and Supplementary Table 7). Larger relative female–male           Provisional decline in life expectancy in 2021. In just the first 4
gaps were estimated for e65—an increase of 16.3% in 2020 in Brazil         months of 2021, Brazil surpassed the number of COVID-19 deaths
and a 107% increase in 2020 in Amapá.                                      during all of 2020. This was the case for 12 of the 27 states (Fig. 4a).
    We also calculated state inequalities in life expectancy, measured     Therefore, we estimated the provisional decline in life expectancy
as the difference between the lowest and the highest state life expec-     in 2021 thus far; this estimate is based on the DT19 method noted
tancy, to assess changes due to COVID-19 (Methods). The state gap          earlier but, in this case, adding confirmed 2021 COVID-19 deaths
remained roughly the same for both e0 and e65 (Fig. 2b). Also, the         to the deaths expected among those who did not die of COVID-
states with extreme values changed only for e65 for both sexes, with       19, who are assumed to be subject to 2019 mortality rates for the
the lowest shifting from Roraima in 2019 to Amazonas in 2020. As           remainder of 2021 (Supplementary Table 11).
high life expectancies are predominantly in the South region and               The estimated decline in 2021 e0 is 1.78 years (1.86 years for
the lowest are in the North, these results suggest that COVID-19           males and 1.64 years for females). Because the 2021 estimates are
mortality reproduced regional inequalities, reflecting the pandem-         based on deaths that occurred in only a 4-month period, the mag-
ic’s disproportionate burden among vulnerable groups5 but also spa-        nitudes of declines are not directly comparable with those for 2020
tial patterns of COVID-19 spread18.                                        using the DT19 method (Supplementary Tables 5 and 6). However,
                                                                           for a given year, we can identify states with the largest reductions.
Effect on improvements in life expectancy from 2000 to 2020.               Among the states, Amazonas, Rondônia, Roraima and Mato Grosso
We quantified the effect of COVID-19 on reversing the progress in          had the largest declines in e0 in both 2020 and 2021 (Fig. 4b,c). For
mortality reduction since 2000 (Methods). Of the gains achieved            e65, the decline in 2021 was estimated at 1.05 years for both sexes

                                                                                                      Nature Medicine | www.nature.com/naturemedicine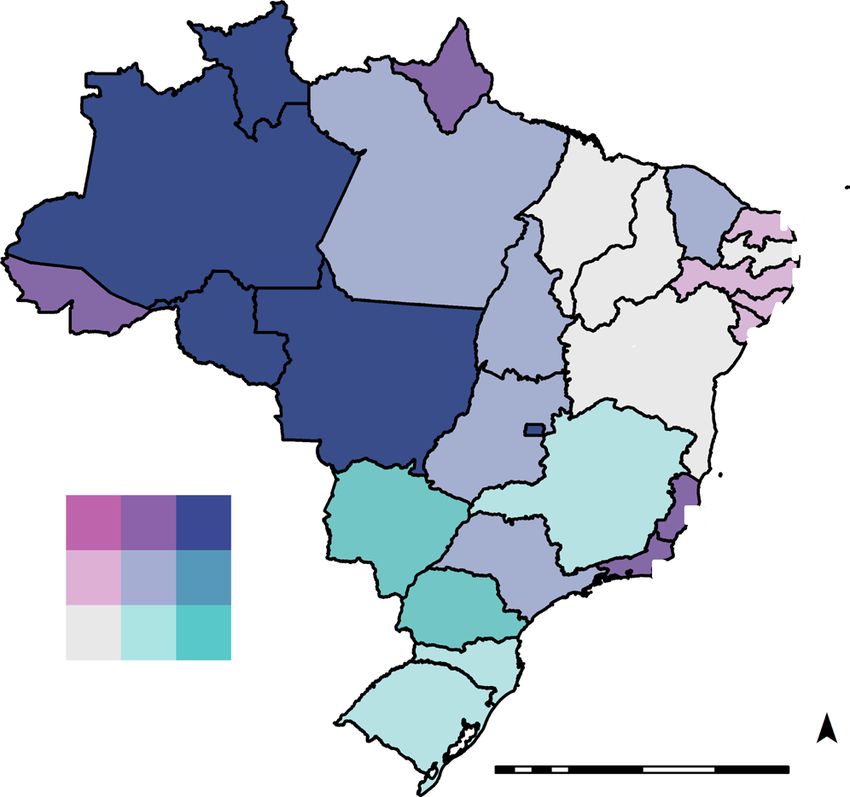
NATure MeDICIne Articles
a 4.0 b 4.0
Total Male Female Total Male Female
3.5 3.5
Brazil total Brazil male Brazil female Brazil total Brazil male Brazil female
3.0 3.0
2.5 2.5
e65, 2019–e65, 2020
e0, 2019–e0, 2020
2.0 2.0
1.5 1.5
1.0 1.0
0.5 0.5
0.0 0.0
–0.5 –0.5
RO ACAM RR PA AP TO MA PI CE RN PB PE AL SE BA MG ES RJ SP PR SC RS MS MT GO DF RO ACAM RR PA AP TO MA PI CE RN PB PE AL SE BA MG ES RJ SP PR SC RS MS MT GO DF
North Northeast Southeast South Central-West North Northeast Southeast South Central-West
c d
RR AP RR AP
AM PA MA CE RN AM PA MA CE RN
PB PB
Pl PE Pl PE
AC AC
AL AL
RO TO RO TO
SE SE
MT BA MT BA
DF DF
GO GO
(Years) ~1.5 ~2.7 ~3.5 MG MG
MS ES COVID-19 deaths MS ES
~3.2
e65, 2019–e65, 2020
per 100,000 people, 2020
SP RJ SP RJ
~2.0 < 65
PR 65–79.9 PR
~1.0
80–94.9
SC SC
e0, 2019 - e0, 2020 95–119.9
N N
RS 120 or more RS
0 200 400 800 1,200 1,600 0 200 400 800 1,200 1,600
Kilometers Kilometers
Fig. 1 | Changes in life expectancy by state and sex. a, Estimated change in life expectancy at birth in 2020 based on the difference from life tables
calculated for 2019 and 2020 by state and sex. State acronyms by region: North: AC = Acre, AP = Amapá, AM = Amazonas, PA = Pará, RO = Rondônia,
RR = Roraima and TO = Tocantins; Northeast: AL = Alagoas, BA = Bahia, CE = Ceará, MA = Maranhão, PB = Paraíba, PE = Pernambuco, PI = Piauí, RN = Rio
Grande do Norte and SE = Sergipe; Center-West: DF = Distrito Federal, GO = Goiás, MT = Mato Grosso and MS = Mato Grosso do Sul; Southeast:
ES = Espírito Santo, MG = Minas Gerais, RJ = Rio de Janeiro and SP = São Paulo; South: PR = Paraná, RS = Rio Grande do Sul and SC = Santa Catarina. b,
Estimated change in e65 in 2020 based on the difference from life tables calculated for 2019 and 2020 by state and sex. c, Bivariate choropleth map of the
estimated change in e0 and e65 in 2020 based on the difference from life tables calculated for 2019 and 2020 by state. d, Number of COVID-19 deaths in
2020 per 100,000 people by state (Methods).
(Fig. 4d). As with 2020, for both e0 and e65, the lowest declines in Nevertheless, the estimates might still suffer from incomplete and/
2021 were concentrated in the Northeast, whereas the South, which or delayed reporting of deaths, especially those for 2021, with
had relatively smaller declines in 2020, is estimated to have a much potential variation in completeness across states. It is also the case
greater loss in 2021. that the difference in life expectancy between 2019 and 2020 could
encompass secular changes unrelated to the pandemic. We surmise
Discussion that the estimates derived from the decrement life table techniques
Our results quantify the effect of the COVID-19 death toll on life (DT19 and DT20) are higher than those reported in the text because
expectancy in Brazil. We show that life expectancy in the presence of additional biases related to violation of the assumption of inde-
of COVID-19 is equivalent to levels observed in Brazil as far back as pendence between COVID-19 and other causes and misdiagnosis
20 or more years in some states. We calculate three sets of estimates of cause of death.
of life expectancy decline but argue that those based on the differ- When intense shocks like a pandemic or war occur, life expec-
ence in life expectancy between 2019 and 2020, which include all tancy drops, but it often rebounds quickly. This was the case with
reported deaths in those 2 years, are the most defensible because the 1918 influenza pandemic in the United States, when e0 in 1919
they do not depend on accurate classification of cause of death, was higher than in 1917, likely due, in part, to selective mortal-
determination of whether the death was directly or indirectly due ity of individuals with tuberculosis19. We argue that, in the case of
to COVID-19 or assumptions about independence among causes. COVID-19 in Brazil, the rebound will not happen in 2021, and the
Nature Medicine | www.nature.com/naturemedicine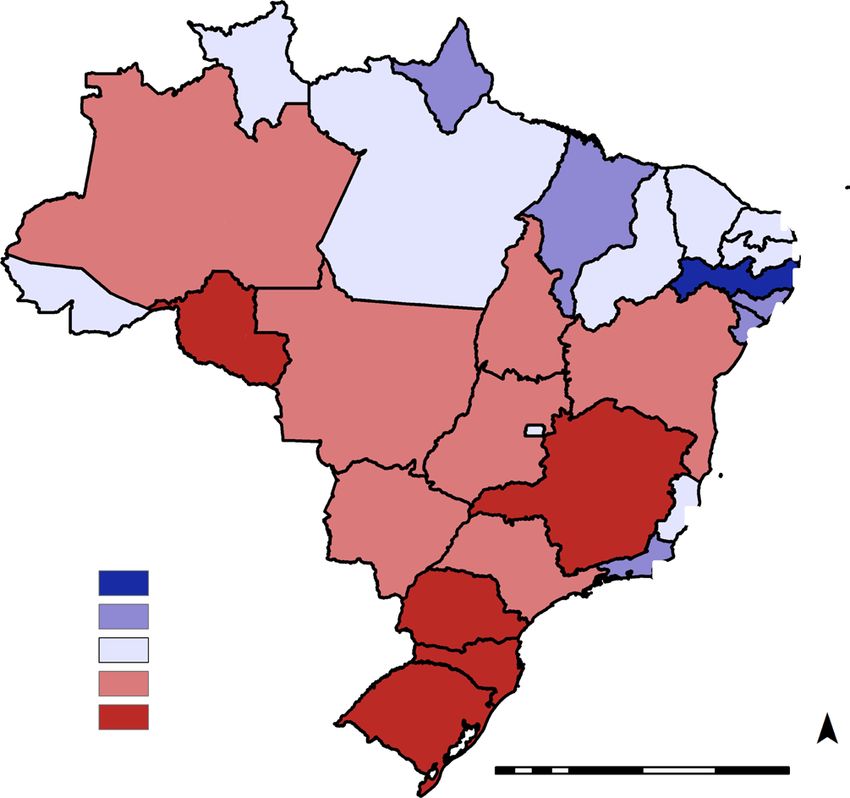
Articles NATure MeDICIne
a b 6 (SC, RR) 6
2.5
(SC, AL) 2019 2020
(SC, RR)
e0 e65
5 5
2.0
Brazil e0 Brazil e65
4 4 (SC, RR)
Female−male gap
1.5 )
RR AM)
C, ,
(S (SC
State gap
3 3 (MG, AM)
1.0
0.5 2 2
0.0 1 1
–0.5 0 0
RO ACAM RR PA AP TO MA PI CE RN PB PE AL SE BA MG ES RJ SP PR SC RS MS MT GODF Total Male Female Total Male Female
e0 e65
North Northeast Southeast South Central-West
Fig. 2 | Changes in gaps of e0 and e65 by state and sex. a, Change (in years) in the female–male gap in e0 and e65 based on the difference from life tables
calculated for 2019 and 2020 by state and sex. Lines represent changes for Brazil. Bars, organized by major regions, show changes for the states.
State acronyms by region: North: AC = Acre, AP = Amapá, AM = Amazonas, PA = Pará, RO = Rondônia, RR = Roraima and TO = Tocantins; Northeast:
AL = Alagoas, BA = Bahia, CE = Ceará, MA = Maranhão, PB = Paraíba, PE = Pernambuco, PI = Piauí, RN = Rio Grande do Norte and SE = Sergipe;
Center-West: DF = Distrito Federal, GO = Goiás, MT = Mato Grosso and MS = Mato Grosso do Sul; Southeast: ES = Espírito Santo, MG = Minas Gerais;
RJ = Rio de Janeiro and SP = São Paulo; South: PR = Paraná, RS = Rio Grande do Sul and SC = Santa Catarina. b, Gap (in years) in state e0 and e65 in 2019 and
2020, calculated as the difference between the largest and smallest life expectancy among states (Methods). Labels above bars indicate the states with
extreme (high and low) life expectancies in 2019 and 2020.
a 80
b 130
Brazil 120 Brazil
70 Central-West Central-West
110
North North
Northeast Northeast
100
60 South AP South
Southeast Southeast
90
50 RO 80
RR AM
70 RO
GO
Female
Female
40 RJ MT AM
60 GO
CE AP
CE MA RJ
PA MT
30 DF 50 RR
MA PA
ES AC
SP Brazil 40 DF
Brazil RN
MS SE ES
20 AL RN PI PE AL BA SE
PE
30 SP
TO BA AC PI
MG MG MS PB
PB PR TO
20 RS
10 SC RS PR
10 SC
0 0
0 10 20 30 40 50 60 70 80 0 10 20 30 40 50 60 70 80 90 100 110 120 130
Male Male
Fig. 3 | Loss in e0 and e65 by state and sex. Percentage loss due to COVID-19 mortality relative to increases in female and male e0 (a) and e65 (b) between
2000 and 2020 by state. States are colored according to major regions. State acronyms by region: North: AC = Acre, AP = Amapá, AM = Amazonas,
PA = Pará, RO = Rondônia, RR = Roraima and TO = Tocantins; Northeast: AL = Alagoas, BA = Bahia, CE = Ceará, MA = Maranhão, PB = Paraíba,
PE = Pernambuco, PI = Piauí, RN = Rio Grande do Norte and SE = Sergipe; Center-West: DF = Distrito Federal, GO = Goiás, MT = Mato Grosso and
MS = Mato Grosso do Sul; Southeast: ES = Espírito Santo, MG = Minas Gerais, RJ = Rio de Janeiro and SP = São Paulo; South: PR = Paraná, RS = Rio Grande
do Sul and SC = Santa Catarina.
pre-pandemic trajectory of annual gains in e0 will likely slow down. remains extremely high, with about 2,000 daily deaths but a very
We offer five reasons as to why. slow immunization rollout. As of 25 May 2021, 20 of the 27 capital
First, we estimate that COVID-19 deaths in the first 4 months cities have intensive care unit occupancy above 80% (half of those
of 2021 have already reduced e0 by 1.8 years, and the ultimate above 90%)20. As of 29 May 2021, the number of COVID-19 deaths
effect on 2021 e0 will be even greater. After recording the highest in Brazil was 137% of those reported in 2020; in Amazonas, for
number of monthly COVID-19 deaths in April 2021, transmission every COVID-19 death in 2020, there have been 1.5 deaths in 2021.
Nature Medicine | www.nature.com/naturemedicine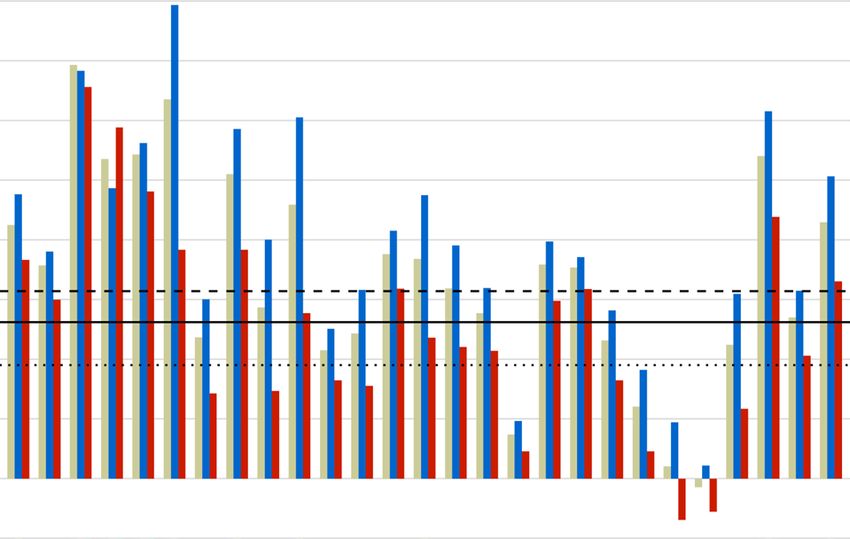
NATure MeDICIne Articles
a b
RR AP RR AP
AM PA MA CE RN AM PA MA CE RN
PB PB
Pl PE Pl PE
AC AC
AL AL
RO TO RO TO
SE SE
MT BA BA
MT
DF DF
GO GO
MG (Years) ~1.5 ~2.2 ~4.5
MG
Ratio of COVID-19
MS ES ~4.3 ES
Decline in e0, 2020
deaths reported in 2021 to MS
those reported in 2020 (%)
SP RJ ~2.4 SP RJ
< 50
50–74.9 PR PR
~1.7
75–99.9
SC SC
100–149.9 Decline in e0, 2021
N N
150 or more RS RS
0 200 400 800 1,200 1,600 0 200 400 800 1,200 1,600
Kilometers Kilometers
c 5.0 d 3.0
Total Male Female Total Male Female
4.5
Brazil total Brazil male Brazil female Brazil total Brazil male Brazil female
2.5
4.0
3.5
2.0
Decline in e65, 2021
Decline in e0, 2021
3.0
2.5 1.5
2.0
1.0
1.5
1.0
0.5
0.5
0.0 0.0
RO AC AM RR PA AP TO MA PI CE RN PB PE AL SE BA MG ES RJ SP PR SC RS MS MT GO DF RO AC AM RR PA AP TO MA PI CE RN PB PE AL SE BA MG ES RJ SP PR SC RS MS MT GO DF
North Northeast Southeast South Central-West North Northeast Southeast South Central-West
Fig. 4 | COVID-19 mortality in 2021 and changes in life expectancy by state and sex. a, Ratio of COVID-19 deaths reported in 2021 (January–April) to
those reported in 2020 (%). Numbers above 100 indicate more deaths in 2021 than 2020. State acronyms by region: North: AC = Acre, AP = Amapá,
AM = Amazonas, PA = Pará, RO = Rondônia, RR = Roraima and TO = Tocantins; Northeast: AL = Alagoas, BA = Bahia, CE = Ceará, MA = Maranhão,
PB = Paraíba, PE = Pernambuco, PI = Piauí, RN = Rio Grande do Norte and SE = Sergipe; Center-West: DF = Distrito Federal, GO = Goiás, MT = Mato Grosso
and MS = Mato Grosso do Sul; Southeast: ES = Espírito Santo, MG = Minas Gerais, RJ = Rio de Janeiro and SP = São Paulo; South: PR = Paraná, RS = Rio
Grande do Sul and SC = Santa Catarina. b, Bivariate choropleth map of the estimated change in life expectancy at birth in 2020 and 2021 based on the
DT19 method (Supplementary Tables 5 and 11). Estimated change in e0 (c) and e65 (d) in 2021.
Manaus, the capital of Amazonas, observed a very high attack rate conditions of individuals with diabetes worsened in 2020 due to
after the first wave of the pandemic in 2020 (ref. 21). In January 2021, reduced physical activity, postponement of medical appointments
Manaus witnessed one of the most tragic scenarios of overwhelmed and interruption in regular drug treatment31. These are some exam-
hospital capacity, running out of not only hospital beds but also ples of deteriorating health conditions that not only will generate a
oxygen22. A new variant of concern (P.1, now called Gamma), which higher demand for healthcare services but also might affect future
emerged in the city in November 2020, is estimated to be 1.4–2.2 mortality patterns.
times more transmissible than other lineages, and at least 17% of Third, reports of long-term consequences of COVID-19 among
the P.1 infections in Manaus in 2021 were reinfections23,24. As of 23 survivors continue to emerge32,33, including fatigue and neurologi-
May 2021, P.1 was the most prevalent strain in the country (92% of cal, pulmonary and cardiovascular complications, among oth-
the samples analyzed)25. Also in May 2021, the first case of the Delta ers. A large study showed a higher risk of death 6 months after
variant (B.1.617.2), first detected in India, was reported in Brazil26. COVID-19 diagnosis, even among those who did not require hos-
Second, COVID-19 disrupted primary care services in Brazil27. pitalization34. Therefore, COVID-19 sequelae might shorten indi-
This compromised screening for cancer, with a reduction of about vidual lifespan.
35% in new diagnoses28. Child immunization was reduced, par- Fourth, the economic crisis that hit Brazil in 2014 has contributed
ticularly among impoverished children in the North region29. to increases in mortality35, poverty and inequality36. From April to
Disruption in treatment and diagnosis of tuberculosis and HIV December 2020, an emergency basic income program mitigated the
might increase mortality over the next 5 years30. Overall health challenges imposed by the pandemic37 (for example, unemployment),
Nature Medicine | www.nature.com/naturemedicine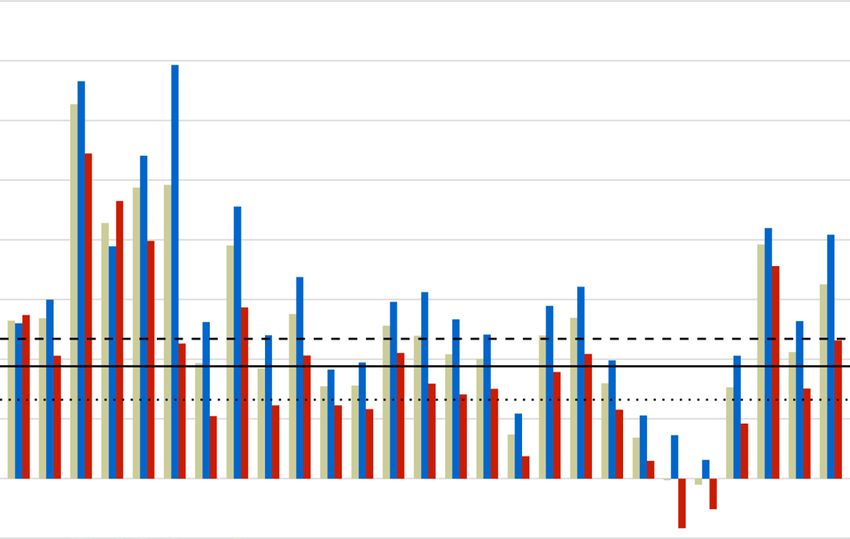
Articles                                                                                                                                NATure MeDICIne

but this benefit ended in December 2020. Although some cities tem-                    4. Nuzzo, J. B., Bell, J. A. & Cameron, E. E. Suboptimal US response to COVID-19
porarily closed some businesses in response to the unprecedented                          despite robust capabilities and resources. JAMA 324, 1391–1392 (2020).
                                                                                      5. Baqui, P., Bica, I., Marra, V., Ercole, A. & van der Schaar, M. Ethnic
COVID-19 surge in early 2021, no financial support was provided                           and regional variations in hospital mortality from COVID-19 in
from January to March 2021. A more limited version of the basic                           Brazil: a cross-sectional observational study. Lancet Glob. Health 8,
income program was re-established in April 2021. COVID-19 exac-                           E1018–E1026 (2020).
erbated inequality, exposing the most vulnerable to food insecurity                   6. Holmes, L. et al. Black–white risk differentials in COVID-19 (SARS-COV2)
                                                                                          transmission, mortality and case fatality in the United States: translational
and severe hunger38,39.
                                                                                          epidemiologic perspective and challenges. Int. J. Environ. Res. Public Health
    Fifth, reductions in the health budget and changes in the health                      17, 4322 (2020).
financing model are likely to affect health outcomes40. They might                    7. Smith, D. W. & Bradshaw, B. S. Variation in life expectancy during the
reduce access to and coverage of primary care and increase infant                         twentieth century in the United States. Demography 43, 647–657 (2006).
mortality and avoidable deaths. Ultimately, inequality might                          8. Andrasfay, T. & Goldman, N. Reductions in 2020 US life expectancy due to
                                                                                          COVID-19 and the disproportionate impact on the Black and Latino
become worse, exacerbating an already distressing scenario due to                         populations. Proc. Natl Acad. Sci. USA 118, e2014746118 (2021).
COVID-19.                                                                             9. Palloni, A., Pinto, G. & Beltrán-Sánchez, H. Two centuries of mortality
    In a previous paper, we described the spatiotemporal patterns of                      decline in Latin America: from hunger to longevity. https://www.ssc.wisc.edu/
the spread of COVID-19 cases and deaths in Brazil18. We showed                            cdha/latinmortality/wp-content/uploads/book_Ch2.pdf (2015).
that a largely unmitigated pandemic, in a context of local inequali-                  10. Simões, C. C. S. Breve histórico do processo demográfico. in Brasil: uma
                                                                                          visão geográfica e ambiental no início do século XXI. 40–74 https://biblioteca.
ties, resulted in a high and unequal mortality burden. The magni-                         ibge.gov.br/index.php/biblioteca-catalogo?id=297884&view=detalhes (IBGE,
tude of the COVID-19 death toll was not homogenous across states                          Coordenação de Geografia, 2016).
and was associated with the pattern of spread18. We calculated the                    11. Vaupel, J. W., Villavicencio, F. & Bergeron-Boucher, M.-P. Demographic
correlation between the speed of the spread of COVID-19 deaths                            perspectives on the rise of longevity. Proc. Natl Acad. Sci. USA 118,
(measured by the locational Hoover Index)18 and the decline in                            e2019536118 (2021).
                                                                                      12. Noronha, K. V. M. S. et al. The COVID-19 pandemic in Brazil: analysis of
e0. We found that the faster the speed at which COVID-19 spread                           supply and demand of hospital and ICU beds and mechanical ventilators
across municipalities (a lower locational Hoover Index), the larger                       under different scenarios. Cad. Saúde Pública 36, e00115320 (2020).
the changes in e0 (Pearson correlation = −0.724, P < 0.001).                          13. Rocha, R. et al. Effect of socioeconomic inequalities and vulnerabilities on
    In summary, the death toll of COVID-19 in Brazil has been cata-                       health-system preparedness and response to COVID-19 in Brazil: a
strophic. State-level gains in longevity achieved over years or even                      comprehensive analysis. Lancet Glob. Health 9, e782–e792 (2021).
                                                                                      14. Pereira, A. K., Oliveira, M. S. & Sampaio, T. S. Heterogeneidades das
decades were reversed by the pandemic. The lack of a coordinated,                         políticas estaduais de distanciamento social diante da COVID-19: aspectos
prompt and equitable response informed by science, as well as the                         políticos e técnico-administrativos. Revista de Administração Pública 54,
promotion of disinformation, have been the hallmark of the current                        678–696 (2020).
administration27. In late April 2021, a parliamentary commission of                   15. Ranzani, O. T. et al. Characterisation of the first 250,000 hospital admissions
inquiry was launched to investigate the government’s handling of                          for COVID-19 in Brazil: a retrospective analysis of nationwide data. Lancet
                                                                                          Respir. Med. 9, 407–418 (2021).
the pandemic response41. Brazil does not lack a universal healthcare                  16. Aburto, J. M. et al. Quantifying impacts of the COVID-19 pandemic through
system, a network of community health agents to target vulnerable                         life expectancy losses: a population-level study of 29 countries. Preprint at
communities, sufficient data and a capable cadre of researchers tire-                     medRxiv https://doi.org/10.1101/2021.03.02.21252772 (2021).
lessly advancing knowledge and informing policy. What it lacks is                     17. Heuveline, P. & Tzen, M. Beyond deaths per capita: comparative COVID-19
                                                                                          mortality indicators. BMJ Open 11, e042934 (2021).
leadership commitment to save lives. After more than 195,000 lives
                                                                                      18. Castro, M. C. et al. Spatiotemporal pattern of COVID-19 spread in Brazil.
were reported to have been lost in 2020 to COVID-19, no policy                            Science 372, 821–826 (2021).
changes have appeared in 2021. As many countries speed up vacci-                      19. Noymer, A. & Garenne, M. The 1918 influenza epidemic’s effects on
nation coverage and witness declines in cases and deaths, Brazil lags                     sex differentials in mortality in the United States. Popul. Dev. Rev. 26,
behind. Without a change in coordination of pandemic response,                            565–581 (2000).
                                                                                      20. Fundação Oswaldo Cruz. Boletim Extraordinário do Observatório Covid-19
expansion of testing and a rapid increase in vaccination, Brazil will                     Fiocruz. https://portal.fiocruz.br/sites/portal.fiocruz.br/files/documentos/
soon become a serious threat to national and global health secu-                          boletim_covid_2021_extraordinario_maio.pdf (2021).
rity42. The consequences, sadly and unacceptably, will continue to                    21. Buss, L. F. et al. Three-quarters attack rate of SARS-CoV-2 in the
be measured in human lives lost, and the future demographic con-                          Brazilian Amazon during a largely unmitigated epidemic. Science 371,
sequences might be even worse than those reported here.                                   288–292 (2021).
                                                                                      22. Phillips, T. Covid eruption in Brazil’s largest state leaves health workers
                                                                                          begging for help. The Guardian. https://www.theguardian.com/world/2021/
Online content                                                                            jan/14/brazil-manaus-amazonas-covid-coronavirus (2021).
Any methods, additional references, Nature Research report-                           23. Faria, N. R. et al. Genomics and epidemiology of a novel SARS-CoV-2
ing summaries, source data, extended data, supplementary infor-                           lineage in Manaus, Brazil. Preprint at https://www.medrxiv.org/content/10.110
mation, acknowledgements, peer review information; details of                             1/2021.02.26.21252554v1 (2021).
                                                                                      24. Faria, N. R. et al. Genomics and epidemiology of the P.1 SARS-CoV-2 lineage
author contributions and competing interests; and statements of                           in Manaus, Brazil. Science 372, 815–821 (2021).
data and code availability are available at https://doi.org/10.1038/                  25. Fundação Oswaldo Cruz. Rede Genômica Fiocruz. Demonstrativos de
s41591-021-01437-z.                                                                       linhagens e genomas SARS-CoV-2. http://www.genomahcov.fiocruz.br/
                                                                                          tabela-de-dados/ (2021).
Received: 19 April 2021; Accepted: 11 June 2021;                                      26. Santos, M. C. et al. First reported cases of SARS-CoV-2 sub-lineage B.1.617.2
                                                                                          in Brazil: an outbreak in a ship and alert for spread. https://virological.org/t/
Published: xx xx xxxx                                                                     first-reported-cases-of-sars-cov-2-sub-lineage-b-1-617-2-in-brazil-an-outbreak-
                                                                                          in-a-ship-and-alert-for-spread/706 (2021).
References                                                                            27. Lotta, G., Wenham, C., Nunes, J. & Pimenta, D. N. Community health
1. Marinho, F. et al. Excess mortality in Brazil: a detailed description of trends        workers reveal COVID-19 disaster in Brazil. Lancet 396, 365–366 (2020).
   in mortality during the COVID-19 pandemic. Vital Strategies. https://www.          28. Marques, N. P. et al. Cancer diagnosis in Brazil in the COVID-19 era. Semin.
   vitalstrategies.org/resources/excess-mortality-in-brazil-a-detailed-description-       Oncol. https://doi.org/10.1053/j.seminoncol.2020.12.002 (2021).
   of-trends-in-mortality-during-the-covid-19-pandemic/ (2020).                       29. Silveira, M. F. et al. Missed childhood immunizations during the COVID-19
2. Woolf, S. H., Chapman, D. A., Sabo, R. T., Weinberger, D. M. & Hill, L.                pandemic in Brazil: analyses of routine statistics and of a national household
   Excess deaths from COVID-19 and other causes, March–April 2020. JAMA                   survey. Vaccine 39, 3404–3409 (2021).
   324, 510–513 (2020).                                                               30. Hogan, A. et al. Report 19: the potential impact of the COVID-19 epidemic
3. Barberia, L. G. & Gómez, E. J. Political and institutional perils of Brazil’s          on HIV, TB and malaria in low- and middle-income countries. https://doi.
   COVID-19 crisis. Lancet 396, 367–368 (2020).                                           org/10.25561/78670 (Imperial College London, 2020).

                                                                                                                     Nature Medicine | www.nature.com/naturemedicine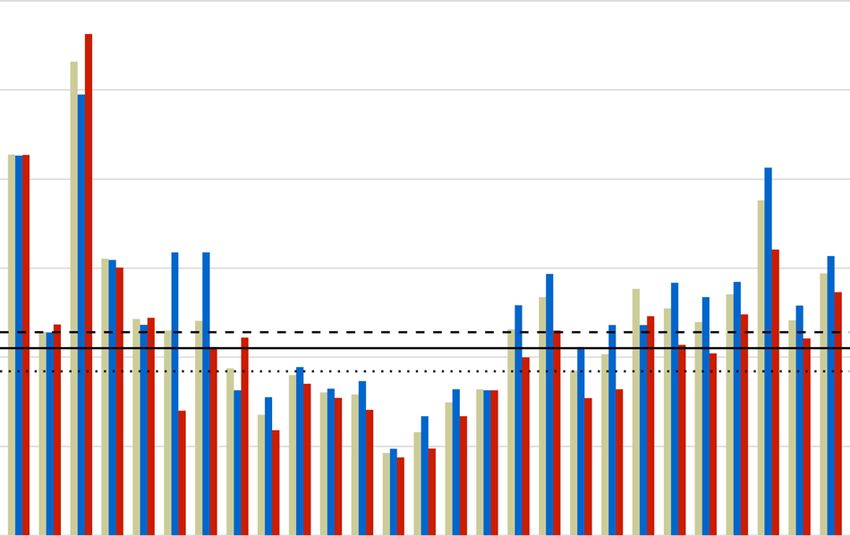
NATure MeDICIne                                                                                                                                     Articles
31. Barone, M. T. U. et al. The impact of COVID-19 on people with diabetes in         38. Carvalho, C. A., Viola, P. C. A. F. & Sperandio, N. How is Brazil facing the
    Brazil. Diabetes Res. Clin. Pract. 166, 108304 (2020).                                crisis of food and nutrition security during the COVID-19 pandemic? Public
32. Abbasi, J. Researchers investigate what COVID-19 does to the heart. JAMA              Health Nutr. 24, 561–564 (2021).
    325, 808–811 (2021).                                                              39. Rede PENSSAN. VIGISAN. Inquérito Nacional sobre Insegurança Alimentar
33. Huang, C. et al. 6-month consequences of COVID-19 in patients discharged              no Contexto da Pandemia da Covid-19 no Brasil. http://olheparaafome.com.
    from hospital: a cohort study. Lancet 397, 220–232 (2021).                            br/VIGISAN_Inseguranca_alimentar.pdf (2021).
34. Al-Aly, Z., Xie, Y. & Bowe, B. High-dimensional characterization of               40. Castro, M. C. et al. Brazil’s unified health system: the first 30 years and
    post-acute sequelae of COVID-19. Nature 594, 259–264 (2021).                          prospects for the future. Lancet 394, 345–356 (2019).
35. Hone, T. et al. Effect of economic recession and impact of health and social      41. Phillips, T. Brazil begins parliamentary inquiry into Bolsonaro’s Covid
    protection expenditures on adult mortality: a longitudinal analysis of 5565           response. The Guardian. https://www.theguardian.com/world/2021/apr/27/
    Brazilian municipalities. Lancet Glob. Health 7, e1575–e1583 (2019).                  brazil-begins-parliamentary-inquiry-into-bolsonaros-covid-response (2021).
36. Barbosa, R. J., Souza, P. H. G. F. & Soares, S. S. D. Distribuição de Renda nos   42. Ventura, D. F. L., Giulio, G. M. & Rached, D. H. Lessons from the Covid-19
    Anos 2010: uma década perdida para desigualdade e pobreza. https://www.               pandemic: sustainability is an indispensable condition of global health
    ipea.gov.br/portal/index.php?option=com_content&view=article&id=                      security. Ambiente & Sociedade 23, e0108 (2020).
    37022&Itemid=448 (2020).
37. Duque, D. Auxílio Emergencial faz pobreza cair em plena pandemia.                 Publisher’s note Springer Nature remains neutral with regard to jurisdictional claims in
    https://blogdoibre.fgv.br/posts/auxilio-emergencial-faz-pobreza-cair-em-plena-    published maps and institutional affiliations.
    pandemia (2020).                                                                  © The Author(s), under exclusive licence to Springer Nature America, Inc. 2021

Nature Medicine | www.nature.com/naturemedicine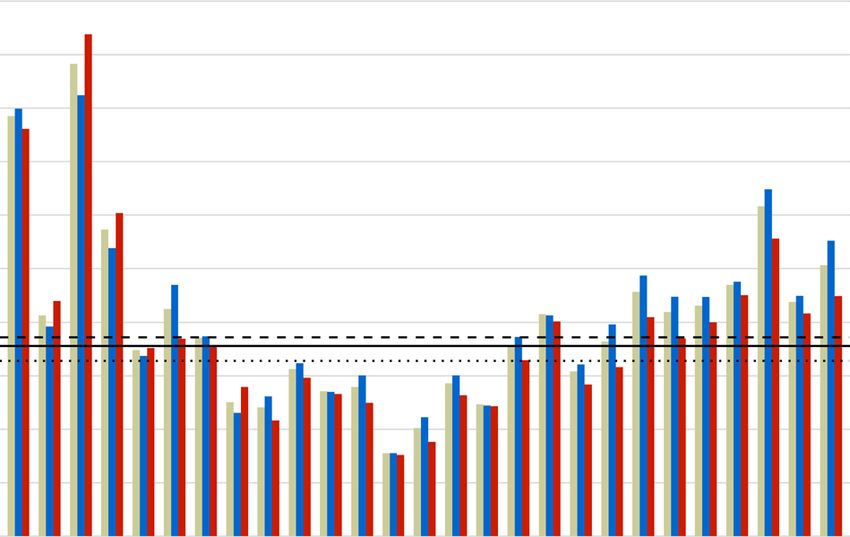
Articles                                                                                                                                                  NATure MeDICIne

Methods                                                                                   between the highest and lowest state life expectancies; the loss due to COVID-
Data. We used several data sources to estimate the changes in e0 and e65 due to           19 relative to increases in e0 and e65 (by sex and state) over the past two decades
COVID-19 by state and sex in Brazil. First, we obtained mid-year population               (2000–2020) (Supplementary Tables 8 and 9); and the setback in life expectancy
projections for 2018–2020 and abridged life tables estimated for 2000–2020 by             due to COVID-19 identified by the years when the life expectancies estimated for
state, age and sex from the Brazilian Institute of Geography and Statistics (Instituto    2020 and 2021 were last observed (Supplementary Table 10).
Brasileiro de Geografia e Estatística, or IBGE, in Portuguese) (https://www.ibge.             Second, we calculated cause-deleted life tables for 2020 (DT20), which examine
gov.br/en/statistics/social/population/18176-population-projection.html).                 the consequences of eliminating COVID-19 mortality from 2020 deaths44. We
    Second, we used deaths from all causes by age, sex, cause of death and state          calculated nRx, the age-specific and sex-specific ratio of deaths from all causes other
of residence provided by the Mortality Information System from the Ministry               than COVID-19 to deaths inclusive of COVID-19.
of Health for 2019 (n = 1,345,543) and 2020 (n = 1,541,556). We removed 2,689                 Third, for both 2020 and 2021, we calculated life tables based on the addition
(0.20%) and 2,722 (0.18%) records in 2019 and 2020, respectively, that did not have       of COVID-19 mortality to the mortality pattern of 2019 (DT19). Previous studies
information on sex and/or age. Records with ill-defined, unspecified or unattended        used this approach to estimate life tables in the presence of COVID-19 (refs. 8,17).
deaths (codes R99 and R98) in 2020 were treated as non-COVID-19 deaths (4.9%              For the base case scenario (absence of COVID-19), we used mortality rates
(75,484/1,541,556)).                                                                      reported in 2019, which we treated as cause-deleted life tables (that is, there were
    Third, because local health authorities have 60 d to report deaths from any           no deaths from COVID-19 in 2019), and applied these to the population at risk
cause, delayed death registration might be an issue in 2021, and, thus, for the first     to obtain expected deaths in the absence of COVID-19. Expected deaths in the
4 months of 2021, we used confirmed COVID-19 deaths as reported by Brasil.io,             presence of COVID-19 are calculated by assuming that individuals who do not
which compiles epidemiological bulletins from the 27 state health departments.            die of COVID-19 in 2020 and 2021 are subject to the mortality rates of 2019. For
These records, aggregated at the state level, are publicly available by date on           DT19, nRx is calculated as the ratio of expected deaths in the absence of COVID-19
the website (https://brasil.io/covid19/). We abstracted death data on 18 May              to expected deaths in the presence of COVID-19.
2021, for all states, as reported through 30 April 2021 (n = 209,458 confirmed                For both DT20 and DT19, after estimating the ratio of non-COVID-19 deaths
COVID-19 deaths). Because these data are not available by age and sex, we used            to all-cause deaths, we then used this ratio to estimate the counterfactual life tables
de-identified publicly available data on severe acute respiratory illness (SARI)          in which COVID-19 was eliminated and COVID-19 was included, respectively.
hospitalizations from the Influenza Epidemiological Surveillance Information              We made the assumption of proportionality between forces of decrement from
System (Sistema de Informação de Vigilância Epidemiológica da Gripe, or                   cause i (or all causes except i) and the force of decrement from all other causes
SIVEP-Gripe, in Portuguese). The dataset provides the age and sex structure of            combined8,45. (In contrast to this assumption, the potential dependence between
hospitalized COVID-19 deaths, and frequent updates are made publicly available            COVID-19 and other causes might lead to modified probabilities of dying from
by the Ministry of Health (https://opendatasus.saude.gov.br/nl/dataset). Because          other causes if COVID-19 were eliminated or added as a cause of death.) We
in-hospital COVID-19 deaths represent 89% of all COVID-19 deaths reported in              applied standard life table relationships to complete these counterfactual life
2021, we use them to proxy for the age–sex distributions of all COVID-19 deaths.          tables44. We calculated the probability of surviving from age x to age x + n (npx),
                                                                                          the probability of dying between age x and x + n (nqx) and the average person-years
Estimating total deaths. To estimate total deaths in the presence of COVID-19,            lived in the interval by those dying in the interval (nax):
we used different methodological approaches. For 2019 and 2020, our estimates
                                                                                                                                                   n Dx
                                                                                                                                                   ∗
include deaths from all causes registered in the Mortality Information System.                                                    n Rx      =
For 2021, as the base case scenario, we calculated the number of deaths that                                                                       n Dx

would occur in the absence of COVID-19 ( ∗n Dx ). To do this, we multiplied the
age group-specific and sex-specific mortality rates from 2019 from each state by                                                        (
                                                                                                                                             1
                                                                                                                                                   ∗ log( ∗ p
                                                                                                                                                                 )
                                                                                                                                                          n x)
the corresponding projected population for March 2021. Next, we estimated total                                           n px   =e         n Rx

2021 deaths, including COVID-19 confirmed deaths ( n DCOV    x   ), reported by Brasil.
io. Here, we assumed that individuals who did not die of COVID-19 in the first 4
                                                                                                                                 n qx   = 1 − n px
months of 2021 would be subject to the 2019 age group-specific and sex-specific
mortality rates. Thus, we estimated total deaths in 2021, inclusive of COVID-19
deaths, as n Dx = ( n Kx − n DCOV
                                x   )( ∗            COV
                                        n Mx ) + n Dx   , where n Dx is the number of                                              1               n qx
                                                                                                                                                   ∗
                                                                                                                  n ax   =n+                              ∗ ( n ax − n )
                                                                                                                                                             ∗
deaths estimated to occur in 2021 in the age range x to x + n; n Kx is the population                                             n Rx
                                                                                                                                            ∗
                                                                                                                                                   n qx
at risk in the age range x to x + n; ∗n Mx are age-specific mortality rates in the
absence of COVID-19 (assumed to be 2019 mortality rates); and n DCOV      x   is the
number of confirmed COVID-19 deaths. For all intervals except ages 0–1, 1–5 and                                           ∞ a90    =        ∞ a90
                                                                                                                                            ∗
                                                                                                                                                       ∗∞ R90
90+, the interval length n is 5 years wide.
                                                                                          where * indicates that the measure is from the life table that does not contain
Estimating person-years lived and period rates. Estimates of period mortality             COVID-19 as a cause of death.
rates require an estimate of the population exposed to the risk of dying. Usually, the         We estimated reductions in e0 and e65 due to COVID-19, for each state and
mid-year population is a good approximation of person-years lived during the year.        sex, from the difference between the 2020 period life table and the DT20 estimates
However, in the presence of COVID-19, this assumption might not hold because              (Supplementary Tables 3 and 4), between the 2019 period life table and the DT19
deaths were unevenly distributed over the year. Also, demographic projections did         estimates for 2020 (Supplementary Tables 5 and 6) and between the 2019 period
not account for the pandemic context and might have overestimated population size.        life table and the DT19 estimates for 2021 (Supplementary Table 11).
    To calculate person-years for 2020, we first interpolated population projections,          We performed all demographic analyses in Microsoft Excel version 16.44
assuming exponential growth by age, sex and state, for the first day of each              and data cleaning and processing in Stata version 15.1 (Stata Corporation) and
month in 2020. We assumed that those dying in a given month from any cause                R version 4.0.0 (2020). We created data visualizations in R, ArcMap version 10.8
contributed, on average, 0.5/12 person-years, whereas the contribution of survivors       (ESRI) and Adobe Illustrator CS6.
was 1/12 person-years. To compute the total persons-years lived for 2020, we added
the monthly contributions. To avoid inconsistencies between life tables estimated         Reporting Summary. Further information on research design is available in the
for 2019 and 2020, we applied the same methodology to 2019. We approximated               Nature Research Reporting Summary linked to this article.
the population at risk in 2021 by interpolating IBGE population projections to the
mid-analysis period (1 March 2021).                                                       Data availability
                                                                                          The data required to reproduce the results presented in this paper are available at
Changes in life expectancy. We used three approaches to assess changes in life            https://github.com/mcastrolab/Brazil-Covid19-e0-change/tree/main/data.
expectancy due to COVID-19. First, as our main specification, we constructed
period life tables that considered deaths by state, sex and age group. We used
death rates from all causes (including COVID-19) to calculate single-decrement            Code availability
life tables in 2019 and 2020. We did not make any corrections for the                     The calculation and figure codes required to reproduce the results presented in this
under-registration of deaths. Over the last decades, the completeness of death            paper are available at https://github.com/mcastrolab/Brazil-Covid19-e0-change/
registration has improved steadily in Brazil43, and data completeness is likely to be     tree/main/code.
similar for 2019 and 2020. Therefore, our estimates would not be seriously affected
by missing deaths unless a different pattern of errors emerges in 2020. To the extent     References
that correction factors are approximately equal for 2019 and 2020, our estimates          43. IBGE. Tábuas Abreviadas de Mortalidade por Sexo e Idade. Brasil, Grandes
are not seriously affected by missing deaths. For each state and sex, we calculated           Regiões e Unidades da Federação 2010. in Estudos e Pesquisas. Informação
the difference between the two life tables to estimate reductions in e0 and e65 due to        Demográfica e Socioeconômica. Número 30 116 (Instituto Brasileiro de
COVID-19 (Supplementary Tables 1 and 2). We also used these period life tables to             Geografia e Estatística–IBGE, Diretoria de Pesquisas, Coordenação de
calculate the female–male gap in e0 and e65 (Supplementary Table 7); the difference           População e Indicadores Sociais, 2013).

                                                                                                                          Nature Medicine | www.nature.com/naturemedicine
NATure MeDICIne Articles
44. Preston, S., Heuveline, P. & Guillot, M. Demography: Measuring and Modeling M.C.C. and C.M.T. wrote the first draft of the manuscript. All authors contributed to the
Population Processes (Wiley-Blackwell, 2000). interpretation of results and manuscript editing.
45. Chiang, C. L. Introduction to Stochastic Processes in Biostatistics (Wiley, 1968).
Competing interests
The authors declare no competing financial interests.
Acknowledgements
T.A. is supported by the National Institute on Aging (grant no. T32 AG000037).
C.M.T. is supported by the Brazilian National Council for Scientific and Technological Additional information
Development. M.C.C., S.G.K. and S.K. are supported by the National Institutes of Health Supplementary information The online version contains supplementary material
(grant no. 2U19AI089681-08). available at https://doi.org/10.1038/s41591-021-01437-z.
Correspondence and requests for materials should be addressed to M.C.C.
Author contributions Peer review information Nature Medicine thanks Pedro Hallal, Usama Bilal and
M.C.C. and N.G. conceived the research. M.C.C., N.G., C.M.T. and T.A. defined Vladimir Canudas Romo for their contribution to the peer review of this work. Jennifer
the methodology. T.A., S.G. and S.K. wrote the codes for analysis. M.C.C. and S.G. Sargent was the primary editor on this article and managed its editorial process and peer
conducted the formal analysis. M.C.C., N.G., T.A. and C.M.T. interpreted the data. review in collaboration with the rest of the editorial team.
M.C.C. and S.G. conducted data curation. M.C.C. and S.K. produced all visualization. Reprints and permissions information is available at www.nature.com/reprints.
Nature Medicine | www.nature.com/naturemedicinenature research | reporting summary
Corresponding author(s): Marcia C Castro
Last updated by author(s): Jun 1, 2021
Reporting Summary
Nature Research wishes to improve the reproducibility of the work that we publish. This form provides structure for consistency and transparency
in reporting. For further information on Nature Research policies, see our Editorial Policies and the Editorial Policy Checklist.
Statistics
For all statistical analyses, confirm that the following items are present in the figure legend, table legend, main text, or Methods section.
n/a Confirmed
The exact sample size (n) for each experimental group/condition, given as a discrete number and unit of measurement
A statement on whether measurements were taken from distinct samples or whether the same sample was measured repeatedly
The statistical test(s) used AND whether they are one- or two-sided
Only common tests should be described solely by name; describe more complex techniques in the Methods section.
A description of all covariates tested
A description of any assumptions or corrections, such as tests of normality and adjustment for multiple comparisons
A full description of the statistical parameters including central tendency (e.g. means) or other basic estimates (e.g. regression coefficient)
AND variation (e.g. standard deviation) or associated estimates of uncertainty (e.g. confidence intervals)
For null hypothesis testing, the test statistic (e.g. F, t, r) with confidence intervals, effect sizes, degrees of freedom and P value noted
Give P values as exact values whenever suitable.
For Bayesian analysis, information on the choice of priors and Markov chain Monte Carlo settings
For hierarchical and complex designs, identification of the appropriate level for tests and full reporting of outcomes
Estimates of effect sizes (e.g. Cohen's d, Pearson's r), indicating how they were calculated
Our web collection on statistics for biologists contains articles on many of the points above.
Software and code
Policy information about availability of computer code
Data collection All data used to run the analysis are available at https://github.com/mcastrolab/Brazil-Covid19-e0-change/tree/main/data
Data analysis We performed all demographic analyses in Microsoft Excel v.16.44, and data cleaning and processing in Stata v.15.1 (Stata Corp., College
Station, TX, USA) and R v.4.0.0 (R core team, 2020). We created data visualizations in R, ArcMap v.10.8 (ESRI; Redlands, CA), and Adobe
Illustrator CS6. All codes used to run the analysis are available at https://github.com/mcastrolab/Brazil-Covid19-e0-change/tree/main/code
For manuscripts utilizing custom algorithms or software that are central to the research but not yet described in published literature, software must be made available to editors and
reviewers. We strongly encourage code deposition in a community repository (e.g. GitHub). See the Nature Research guidelines for submitting code & software for further information.
Data
Policy information about availability of data
All manuscripts must include a data availability statement. This statement should provide the following information, where applicable:
- Accession codes, unique identifiers, or web links for publicly available datasets
April 2020
- A list of figures that have associated raw data
- A description of any restrictions on data availability
Several sources were used: https://www.ibge.gov.br/en/statistics/social/population/18176-population-projection.html, https://brasil.io/covid19/, https://
opendatasus.saude.gov.br/nl/dataset. All data used to run the analysis are available at https://github.com/mcastrolab/Brazil-Covid19-e0-change/tree/main/data
1nature research | reporting summary
Field-specific reporting
Please select the one below that is the best fit for your research. If you are not sure, read the appropriate sections before making your selection.
Life sciences Behavioural & social sciences Ecological, evolutionary & environmental sciences
For a reference copy of the document with all sections, see nature.com/documents/nr-reporting-summary-flat.pdf
Life sciences study design
All studies must disclose on these points even when the disclosure is negative.
Sample size We used data on all deaths reported in the country. No sample involved
Data exclusions We removed 2,689 (0.20%) and 2,722 (0.18%) deaths in 2019 and 2020, respectively, that did not have information on sex and/or age.
Replication N/A
Randomization N/A
Blinding N/A
Reporting for specific materials, systems and methods
We require information from authors about some types of materials, experimental systems and methods used in many studies. Here, indicate whether each material,
system or method listed is relevant to your study. If you are not sure if a list item applies to your research, read the appropriate section before selecting a response.
Materials & experimental systems Methods
n/a Involved in the study n/a Involved in the study
Antibodies ChIP-seq
Eukaryotic cell lines Flow cytometry
Palaeontology and archaeology MRI-based neuroimaging
Animals and other organisms
Human research participants
Clinical data
Dual use research of concern
April 2020
2You can also read