Indiana University Health Bloomington Hospital
     Community Health Needs Assessment

                  2011-2012
←
→
Page content transcription
If your browser does not render page correctly, please read the page content below
Indiana University Health Bloomington Hospital
Community Health Needs Assessment
2011-2012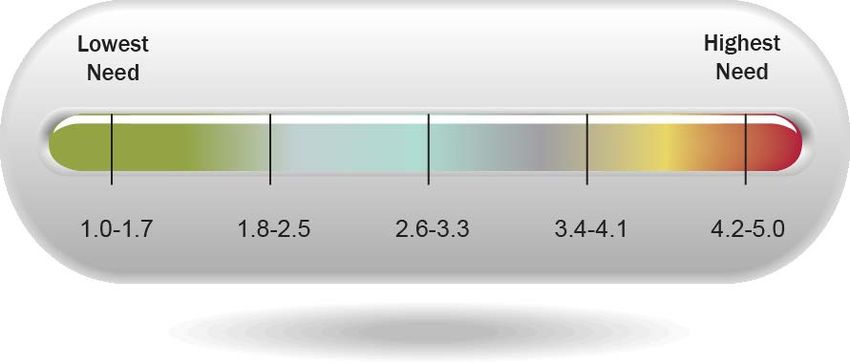
1 Table of Contents

1     INTRODUCTION .................................................................................................................................... 5
    1.1      Purpose ........................................................................................................................................ 5
    1.2      Objectives ..................................................................................................................................... 5
2     EXECUTIVE SUMMARY ......................................................................................................................... 6
    2.1      Overall IU Health Bloomington Hospital Community ............................................................... 6
    2.2      Primary Service Area ................................................................................................................... 7
3     STUDY METHODS ................................................................................................................................. 8
    3.1      Analytic Methods ......................................................................................................................... 8
    3.2      Data Sources................................................................................................................................ 8
    3.3      Information Gaps ......................................................................................................................... 9
    3.4      Collaborating Organizations ....................................................................................................... 9
4     DEFINITION OF COMMUNITY ASSESSED ........................................................................................ 10
5     SECONDARY DATA ASSESSMENT ................................................................................................... 11
    5.1      Demographics ............................................................................................................................ 11
    5.2      Economic Indicators .................................................................................................................. 12
      5.2.1         Employment ....................................................................................................................... 12
      5.2.2         Household Income and People in Poverty....................................................................... 13
      5.2.3         Insurance Coverage ........................................................................................................... 15
      5.2.4         Indiana State Budget ........................................................................................................ 16
    5.3      Discharges for Ambulatory Care Sensitive Conditions ........................................................... 18
    5.4      County Level Health Status and Access Indicators ................................................................ 18
      5.4.1         County Health Rankings.................................................................................................... 18
      5.4.2         Community Health Status Indicators ............................................................................... 20
    5.5      ZIP Code-Level Health Access Indicators ................................................................................ 22
    5.6      Regional Chronic Conditions and Preventive Behaviors ........................................................ 23
    5.7      Medically Underserved Areas and Populations....................................................................... 25
    5.8      Health Professional Shortage Areas ........................................................................................ 26
    5.9      Description of Other Facilities and Resources Within the Community ................................. 27
    5.10        Review of Other Assessments of Health Needs.................................................................. 28
      5.10.1        South Central Community Action Program (SCCAP) Community Needs Assessment 28

                                                                                                                                           2|Page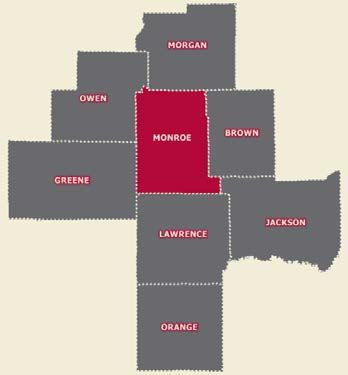
5.10.2       Monroe County Asset Building Coalition Strategic Plan................................................. 29
6     PRIMARY DATA ASSESSMENT ........................................................................................................ 31
    6.1     Focus Group Findings ................................................................................................................ 31
      6.1.1        Identification of Persons Providing Input ........................................................................ 31
      6.1.2        Prioritization Process and Criteria.................................................................................... 32
      6.1.3        Description of Prioritized Needs ....................................................................................... 32
    6.2     Community Survey Findings ..................................................................................................... 33

                                                                                                                                 3|Page
IU Health Community Health Needs Assessment Team Members
Robin Eggers, MBA
Director
Community Outreach and Engagement
Indiana University Health
reggers1@iuhealth.org

Stephanie Berry, MS
Manager, System Coordination
Community Outreach and Engagement
Indiana University Health
sberry@iuhealth.org

Sarah Moore, MPH, CHES
Project Manager, Community Benefit
Community Outreach and Engagement
Indiana University Health
sketterer@iuhealth.org

April Poteet
Community Outreach Associate
Community Outreach and Engagement
Indian University Health
apoteet@iuhealth.org

Caroline Hodgkins
Masters of Public Health Intern
Community Outreach and Engagement
Indiana University Health
chodgkins@iuhealth.org

                                                           4|Page
1 INTRODUCTION
1.1 Purpose

This report provides an overview of findings from a community health needs assessment (CHNA)
conducted on behalf of Indiana University Health (IU Health) Bloomington Hospital (IU Health
Bloomington) in order to assess health needs in the county service areas served by the hospital.
This assessment was initiated by IU Health Bloomington to identify the community’s most
important health issues, both overall and by county, in order to develop an effective
implementation strategy to address such needs. It was also designed to identify key services where
better integration of public health and healthcare can help overcome barriers to patient access,
quality, and cost-effectiveness. The hospital also assessed community health needs to respond to
the regulatory requirements of the Patient Protection and Affordable Care Act of 2010 (PPACA),
which requires that each tax-exempt hospital facility conduct an independent CHNA.

IU Health Bloomington completed this assessment in order to set out the community needs and
determine where to focus community outreach resources. The assessment will be the basis for
creating an implementation strategy to address those needs. This report represents IU Health
Bloomington’s efforts to share knowledge that can lead to improved health and the quality of care
available to their community residents while building upon and reinforcing IU Health Bloomington’s
existing foundation of healthcare services and providers.

1.2 Objectives

The 2011 IU Health Bloomington CHNA has four main objectives:

   1. Develop a comprehensive profile of health status, quality of care, and care management
      indicators overall and by county for those residing within the IU Health Bloomington service
      area, specifically within the primary service area (PSA) of Monroe County, Indiana.
   2. Identify the priority health needs (public health and healthcare) within the IU Health
      Bloomington PSA.
   3. Serve as a foundation for developing subsequent detailed recommendations on
      implementation strategies that can be utilized by healthcare providers, communities,
      and policy makers in order to improve the health status of the IU Health
      Bloomington community.
   4. Supply public access to the CHNA results in order to inform the community and provide
      assistance to those invested in the transformation to the community’s healthcare network.

                                                                                      5|Page
2 EXECUTIVE SUMMARY
2.1 Overall IU Health Bloomington Hospital Community
• Service Area Counties: Monroe, Lawrence, Owen, Greene, Orange, Morgan, Brown, and Jackson
• Service area population in 2010: 385,200
• 85% of the IU Health Bloomington inpatient discharge population resides in Monroe (55%),
Lawrence (12%), Owen (10%), and Greene (9%) counties
• Five of the eight service area counties (Monroe, Orange, Morgan, Brown and Jackson counties) are
expected to increase in population by 2015
• The 65+ population is projected to increase substantially by 2015 for all counties, and the
0-4-year-old population is also projected to increase in Monroe, Owen, Orange, and Jackson counties
• Similar to poverty rates for Indiana and the US, rates for all counties except Morgan have increased
from 2008 to 2009
• 18% of community discharges were for patients with Medicaid, 38% were for patients with Medicare,
and 7% were for uninsured or self-pay patients
IU Health Bloomington’s entire community service area extends into eight counties: Monroe,
Lawrence, Owen, Greene, Orange, Morgan, Brown, and Jackson. Although Monroe County fared well
on most indicators, poor social and economic factors in surrounding service area counties may
contribute to the poor lifestyle choices that are prevalent in the overall community, such as
substance abuse, poor diet, and lack of physical activity.
The needs listed below specify theTophealth
Community Health
issues identified Needs
through the assessment as priority
needs across the entire community served by the hospital. These problems affect most of the
The needs listed below specify the health issues identified by the assessment as priority needs across the
community service area counties, but particularly apply to the primary service area of Monroe
entire community served by the hospital. These problems affect most of the community service area
County.
counties, but particularly apply to the PSA of Monroe County.
Mental health and addiction
Access to healthcare
Obesity and diabetes
Chronic disease management
Senior health
6|Page2.2 Primary Service Area
Monroe County comprises the majority of the IU Health Bloomington Hospital community. It
accounts for all of the primary service area’s (PSA) total population, and 55% of the inpatient
discharge population of the total community service area.
Monroe County has lower rates of unemployment than the state of Indiana and the national
average. The median household income and poverty rates of Monroe County are also below the
Indiana state and national averages.
Other characteristics of Monroe County are as follows:
• Monroe County has seen almost a 14.5% increase in population since 2000, a rate higher than
the average rate for the entire IU Health Bloomington service area (6%), the state of Indiana (7%),
and the entire nation (10%)
• The senior population (65+) is projected to increase at a significantly higher rate for Monroe County
than the rate of increase for the total IU Health Bloomington service area and the entire state
• Approximately 5% of Monroe County community discharges were ambulatory care sensitive
conditions (ACSC) in 2007, which was lower than the rate for all other service area counties
• Based on County Health Rankings, Monroe County ranked 17th out of 92 counties in the state of
Indiana for overall health outcomes, and 5th out of 92 counties for overall health factors
• Monroe County compared favorably for most Community Health Status Indicators; however, it
compared unfavorable for chronic health conditions such as breast and lung cancer
• Among the seven ZIP code areas included within Monroe County, the city of Bloomington includes
two with the highest community health needs based on CNI assessment of economic and structural
health indicators; the need for these areas was scored as moderately high
• 506 Monroe County community members responded to IU Health Bloomington’s CHNA survey,
and 41% rated their community as “Somewhat Unhealthy” or “Very Unhealthy”
7|Page3 STUDY METHODS
3.1 Analytic Methods
In order to provide an appropriate overarching view of the community’s health needs, conducting
a local health needs assessment requires the collection of both quantitative and qualitative data
about the population’s health and the factors that affect it. For this CHNA, quantitative analyses
assessed the health needs of the population through data abstraction and analysis, and qualitative
analyses were conducted through structured interviews and conversations with community leaders
in areas served by IU Health Bloomington Hospital. The qualitative community orientation portion
of the analysis was critically important to include in this assessment’s methodology, as it provides
an assessment of health needs from the view of the community rather than from the perspective of
the health providers within the community.
3.2 Data Sources
CHNAs seek to identify priority health status and access issues for particular geographic areas and
populations. Accordingly, the following topics and data are assessed:
• Demographics, eg, population, age, sex, race
• Economic indicators, eg, poverty and unemployment rates, and impact of state
budget changes
• Health status indicators, eg, causes of death, physical activity, chronic conditions, and
preventive behaviors
• Health access indicators, eg, insurance coverage, ambulatory care sensitive conditions
(ACSC) discharges
• Availability of healthcare facilities and resources
Data sets for quantitative analyses included:
• Dignity Health (formerly Catholic Health West)—Community Needs Index
• Centers for Disease Control and Prevention
• Centers for Medicare & Medicaid Services
• Community Health Status Indicators Project
• Dartmouth Atlas of Health Care
• Indiana Department of Workforce Development
• Indiana Hospital Association Database
• Kaiser Family Foundation
• National Research Corporation—Ticker
• Robert Wood Johnson Foundation—County Health Rankings
• STATS Indiana data—the Indiana Business Research Center, IU Kelley School of Business
• Thomson Reuters Market Planner Plus and Market Expert
• US Bureau of Labor Statistics
• US Census Bureau
• US Department of Commerce, Bureau of Economic Analysis
• US Health Resources and Services Administration
8|PageWhile quantitative data can provide insights into an area, these data need to be supplemented with
qualitative information to develop a full picture of a community’s heath and health needs. For this
CHNA, qualitative data were gathered through surveys of members of the public, and a focus group
with health leaders and public health experts.
3.3 Information Gaps
To the best of our knowledge, no information gaps have affected IU Health Bloomington’s ability to
reach reasonable conclusions regarding community health needs. While IU Health Bloomington has
worked to capture quantitative information on a wide variety of health conditions from a wide array
of sources, IU Health Bloomington realizes that it is not possible to capture every health need in the
community and there will be gaps in the data captured.
To attempt to close the information gap qualitatively, IU Health Bloomington conducted community
conversations and community input surveys. However, it should be noted that there are limitations
to these methods. If an organization from a specific group was not present during the focus group
conversations with community leaders, such as seniors or injury prevention groups, then that need
could potentially be underrepresented during the conversation.
3.4 Collaborating Organizations
The IU Health system collaborated with other organizations and agencies in conducting this needs
assessment for the IU Health Bloomington community. These collaborating organizations are
as follows:
Bloomington Chamber of Commerce
Bloomington Mayor’s Office
City of Bloomington
DWA Healthcare Communications Group
IU Health Bloomington Hospital
Monroe County Health Department
United Way of Monroe County
Volunteers in Medicine
Verité Healthcare Consulting, LLC
9|Page4 DEFINITION OF COMMUNITY ASSESSED
This section identifies the community assessed by IU Health Bloomington Hospital. The PSA of IU
Health Bloomington includes Monroe County. The secondary service area (SSA) is comprised of
seven contiguous counties. The community definition is consistent with the inpatient discharges for
2010, as illustrated in Table 1 and Figure 1 below.
Table 1
IU Health Bloomington Hospital Inpatient Discharges by County and Service Area, 2010
Source: IHA Database, 2010.
In 2010, the IU Health Bloomington PSA included 8230 discharges and its SSA, 6120 discharges.
The community was defined based on the geographic origins of IU Health Bloomington inpatients.
Of the hospital’s inpatient discharges, approximately 55% originated from the PSA and 41% from
the SSA (Table 1).
Figure 1
Counties in the IU Health Bloomington Hospital Service Area Community, 2010
10 | P a g e5 SECONDARY DATA ASSESSMENT
5.1 Demographics
IU Health Bloomington Hospital is located in Monroe County, a county located in south central
Indiana. Monroe County includes ZIP codes within the towns of Bloomington, Ellettsville, and
Unionville. Based on the most recent Census Bureau (2010) statistics, Monroe County’s population
is 137,974 persons with approximately 50% being female and 50% male. The county’s population
estimates by race are 85.8% White, 3.1% Hispanic or Latino, 3.4% Black, 5.6% Asian, 0.3%
American Indian or Alaska Native, and 2.3% persons reporting two or more races.
Monroe County has relatively high levels of educational attainment, as compared to other Indiana
counties. Almost half of the population had an associate’s, bachelor’s, or graduate/professional
degree, a percentage that has increased slightly since 2000 (44.5% to 48%). An additional 18.8%
had some college, but no degree. As of 2010, 24.3% of the population was a high school graduate
or equivalent; however, this percentage has decreased by 1.9% since 2000.
Within the entire service area, the total population for the PSA is 137,974 and the total population
for surrounding counties is 247,226, as illustrated in Table 2 below.
Table 2
Service Area Population, 2010
Source: US Census Bureau, 2012.
Population growth can help to explain changes in community characteristics related to health
status, and thus plays a major role in determining the specific services that a community needs.
The Monroe County population has increased 14.4% since 2000, when the population was
estimated to be 120,561 persons. Comparatively, Monroe County’s population has increased faster
than the average population across the total service area, which increased by approximately 5.89%
from 2000 to 2010. Indiana’s total 2010 population estimate of 6,483,802 was up by 6.6% from
2000, and population growth was up by 10% for the entire nation.
11 | P a g eMonroe County’s total population is projected to increase 4.96% by 2015. Its population is
expected to decline only for persons aged 25-44 (-18.77%).
At 21.56%, the 65+ population is expected to grow the fastest among all Monroe County age
cohorts between 2010 and 2015. In general, an older population can produce increased demand
for healthcare services and a potential increase in the prevalence of certain chronic conditions. The
rate of population growth in Monroe County for persons 65+ is expected to increase more rapidly
than the combined IU Health Bloomington service area (17.27%) and the state of Indiana (15.40%),
as illustrated in Table 3 below.
Table 3
Projected 2010-2015 Service Area Population Change
Source: Indiana Business Research Center, IU Kelley School of Business, 2012 (based on US Census data for 2010).
5.2 Economic Indicators
The following topics were assessed to examine various economic indicators with implications for
health: (i) Employment, (ii) Household Income and People in Poverty, (iii) Indiana State Budget;
and (iv) Uninsurance.
5.2.1 Employment
In 2010, the average share of jobs in Monroe County was highest within the areas of healthcare
and social assistance, accommodation and food services, retail trade, manufacturing,
administrative support for waste management/remediation services, professional and scientific
services, construction, and wholesale trade. Monroe County has a diverse group of major employers
12 | P a g ereported by the Indiana Department of Workforce Development, including: Indiana University-
Bloomington, IU Health Bloomington Hospital, Cook Group, Inc., General Electric (GE) Company,
Baxter Healthcare Pharmaceuticals, Stone Belt, Modus Link PTS, Inc., Wal-Mart Supercenter, and
Otis Elevator Company.
Monroe County reported a somewhat better unemployment rate than the rates of most surrounding
counties, as well as that of the state and national average rates; however, the rate increased
slightly from 2010 to 2011. Table 4 summarizes unemployment rates at December 2010 and
December 2011.
Table 4
Unemployment Rates, December 2010 and December 2011
Source: US Bureau of Labor Statistics, 2012.
5.2.2 Household Income and People in Poverty
Areas with higher poverty rates tend to have poorer access to healthcare, lower rates of preventive
care, higher rates of preventable hospital admissions, and poorer health outcomes in general.
According to the US Census, in 2009, the national poverty rate was at 14.3%, increasing from
13.2% in 2008. In Indiana, 14.4% of the state population lived in poverty, which was a 1.9%
increase from the 2008 poverty rate (12.9%).
For Monroe County, a poverty rate of 21.9% was reported in 2009, rising from 20.7% from
2008 (1.2%). Comparatively for Indiana, Hendricks County has the lowest poverty rate at 5.1%
and Monroe County has the highest poverty rate at 21.9%. Table 5 illustrates the poverty rates
by year between 2007 and 2009.
13 | P a g eTable 5
Percentage of People in Poverty, 2007-2009
Source: US Census Bureau, 2012.
Morgan County was the only county in the IU Health Bloomington service area to have a decrease in
poverty rates between 2008 and 2009 (-0.4%). Comparisons of each service area county’s poverty
rates, as well as those for the state of Indiana and the entire US, are displayed in Figure 2 below.
Figure 2
Percentage Change in Poverty Rates between 2008 and 2009
Decreased poverty rate
Increased poverty rate
-1.0% -0.5% 0.0% 0.5% 1.0% 1.5% 2.0% 2.5% 3.0% 3.5%
Monroe 1.2%
Lawrence 1.1%
Owen 0.9%
Greene 2.9%
Orange 1.0%
Morgan -0.4%
Brown 2.0%
Jackson 2.8%
Indiana 1.5%
US 1.1%
Source: US Census Bureau, 2012.
14 | P a g eIncome level is an additional economic factor that has been associated with the health status of a
population. Based on US Census Bureau (2009) data, Monroe County’s per capita personal income
was estimated to be $29,648, with a median household income around $36,061, which are both
below the state rates. The rates are compared to the Indiana state average of per capita income of
$33,323, with a median household income around $45,427, and the US national average of per
capita income of $38,846, with a median household income of $50,221.
5.2.3 Insurance Coverage
National statistics on health insurance indicate that 16% of the United States population is
uninsured. Of the US population that is insured, 49% are insured through an employer, 5% through
individual providers, 16% through Medicaid, 12% through Medicare, and 1% through other
public providers.
In Indiana, it is estimated that 14% of the population are uninsured, 7% of which are children.
Of the Indiana residents who are insured, 16% residents are insured through Medicaid, 14%
through Medicare, 52% through their employer, 3% through individual providers, and 1% through
other public providers. 1
Based on inpatient discharge data from the Indiana Hospital Association (IHA), 38% of Monroe
County residents have commercial insurance, 18% are insured through Medicaid, 35% are insured
through Medicare, 7% pay out-of-pocket (uninsured), and 2% have other government insurance or
are unknown.
At IU Health Bloomington Hospital, it is estimated that 36% of discharged patients have
commercial insurance, 18% are insured through Medicaid, 38% are insured through Medicare,
7% pay out-of-pocket (uninsured), and 1% have other government insurance or are unknown
(see Figure 3).
Figure 3
Insurance Coverage
2009 Monroe County and IU Health Bloomington Hospital Inpatient Discharges
Source: IHA Discharge Database, 2010.
1. Kaiser State Health Facts 2009-2010, Kaiser Family Foundation. http://www.statehealthfacts.org.
15 | P a g e5.2.4 Indiana State Budget
The recent recession has had major implications not only for employment, but also for state budget
resources devoted to health, public health, and social services. Outlined below are findings from
the fiscal year (FY) 2010-2011 health service expenditures and achievements, as well as pertinent
changes related to healthcare within the FY 2012-2013 biennium budget.
Fiscal Year 2010-2011 Health Services
• In FY 2010, Health and Welfare accounted for 38.9%, or $10.2 billion, of expenses
o The change in expenses from FY 2009 was a decrease of $19.1 million, or 0.2%
o Some of the major expenses were Medicaid assistance ($6.0 billion), the US
Department of Health and Human Services Fund ($1.4 billion), and the federal food
stamp program, $1.5 billion
• The Medicaid Assistance Fund received $4.5 billion in federal revenue in FY 2011, as
compared to $4.0 billion in FY 2010
o The Fund distributed $6.0 billion in Medicaid assistance during the year, which is an
increase of $598.3 million over FY 2010
o The total change in the fund’s balance was an increase of $114.4 million from
FY 2010 to FY 2011
• The US Department of Health and Human Services Fund is a new fund created during the
2011 fiscal year with the implementation of the new statewide accounting system to
account for federal grants that are used to carry out health and human services programs
o The fund received $1.2 billion in federal grant revenues and expended $1.4 billion
o The change in fund balance from FY 2010 to FY 2011 was an increase of
$134.9 million
• The Children’s Health Insurance Plan (CHIP) spent $138.1 million in FY 2011
o At the end of FY 2011, CHIP was serving 83,494 clients, an increase of 4.7%
compared to the average number of clients served by CHIP in FY 2010
• From 2005 to 2011, the Department of Child Services (DCS) has increased the total
number of filled Family Case Manager (FCM) positions in Indiana by 838, from 792
to 1630
• In January 2010, DCS established the Indiana Child Abuse and Neglect Hotline to serve as
the central reporting center for all allegations of child abuse or neglect in Indiana; the
Hotline is staffed with 62 FCMs, also known as Intake Specialists, who are specially trained
to take reports of abuse and neglect
Fiscal Year 2012-2013 Budget
• Pension obligations are fully met and the Medicaid forecast is fully funded. This 2012-2013
budget increases funding in key areas such as K-12 education, student financial aid,
Medicaid, and pensions
• The budget does not include any appropriations for the implementation of the Patient
Protection Affordable Care Act (PPACA); however, it is projected that costs will begin
to be incurred during this biennium, with General Fund appropriations needed in the
FY 2014-2015 biennium budget
16 | P a g e• The budget removes statutory restrictions that prevented the Family and Social Services
Administration (FSSA) from reducing staffing levels at either the Evansville State Hospital
or the Evansville Psychiatric Children’s Center, regardless of the number or type of patients
being treated at each facility
• The budget eliminates the Indiana Tobacco Prevention and Cessation (ITPC) Board,
and transferred its responsibilities to the Indiana State Department of Health (ISDH) on
July 1, 2011; the ISDH totals include annual appropriations of $8.1 million from the
Tobacco Master Settlement Fund for tobacco prevention and cessation efforts
• The ISDH budget saw a 16.6% decrease in general fund appropriations for the
FY 2012-2013 biennium budget
• The budget appropriates $48.8 million annually for The Community and Home Options to
Institutional Care for the Elderly and Disabled (CHOICE) In-Home Services, one of very few
programs to not be reduced compared to FY 2011 appropriation levels
• FY 2012 HHS divisional and program budgets that have been reduced as compared to
FY 2011 appropriation levels include:
o Division of Aging Administration (-33%)
o Tobacco Use Prevention & Cessation Program (-25%)
o Community Health Centers (-25%)
o Department of Child Services (-24%)
o Residential Care Assistance Program for the elderly, blind, disabled (-22%)
o Child Psychiatric Services Fund (-17%)
o Minority Health Initiative (-15%)
o Prenatal Substance Abuse & Prevention (-15%)
o Office of Women’s Health (-15%)
o Children With Special Healthcare Needs (-15%)
o Cancer Education & Diagnosis—Breast (-15%)
o Cancer Education & Diagnosis—Prostate (-15%)
o Disability and Rehabilitation Services (-11%)
17 | P a g e5.3 Discharges for Ambulatory Care Sensitive Conditions
Ambulatory care sensitive conditions (ACSC) are health issues that, in theory, do not require
hospitalizations if adequate ambulatory (primary) care resources are available and accessed.
Methodologies for quantifying ACSC discharges have been well-tested for more than a decade.
Disproportionately large numbers of ACSC discharges indicate potential problems with the
availability or accessibility of ambulatory care services. Table 6 illustrates the estimated
percentage of 2007 ACSC discharges per Medicare enrollee for the IU Health Bloomington Hospital
PSA, the SSA, and the overall service area.
Table 6
Percentage of ACSC Discharges Per Medicare Enrollee in 2007
Source: Dartmouth Atlas of Health Care, 2007.
5.4 County Level Health Status and Access Indicators
5.4.1 County Health Rankings
The Robert Wood Johnson Foundation, along with the University of Wisconsin Population Health
Institute, created County Health Rankings to assess the relative health of county residents within
each state for all 50 states. These assessments are based on health measures of health outcomes,
specifically length and quality of life indicators, and health factors, including indicators related to
health behaviors, clinical care, economic status, and the physical environment.
Based on the 92 counties in the state of Indiana, counties may be ranked from 1 to 92, where
1 represents the highest ranking and 92 represents the lowest. Table 7 summarizes County Health
Ranking assessments for Monroe and surrounding counties in Indiana; rankings for counties were
converted into quartiles to indicate how each county ranks versus others in the state. The table also
illustrates whether a county’s ranking worsened or improved from rankings in 2011.
18 | P a g eTable 7
Relative Health Status Indicators for Monroe County and Surrounding Counties
Source: County Health Rankings, 2012.
Monroe County fell within the 75th percentile, ranking 17th in the state for overall health outcomes
(length and quality of life), which is the second highest ranking for health outcomes among the
eight counties in the IU Health Bloomington service area. Comparatively, Brown County ranked in
the 75th percentile as well with a ranking of 6th in the state for health outcomes.
In preventable health factors, Monroe County ranked 5th in terms of overall health-related factors
(determinants of health); individual scores are displayed in Table 7 above. More than half (7 out of
13) of Monroe County’s health-related factor rankings fell within the top 25% of Indiana counties;
however, community safety was ranked in the bottom 25%, and several indicator rankings
19 | P a g edecreased from 2011 to 2012. In addition to the above, some additional indicators ranked in the
bottom half of Indiana counties including built environment (63rd) and family and social
support (56th).
Specific indicator rankings for Monroe County that fell between 2011 and 2012 include alcohol
use, employment, and overall physical environment. However, despite the fall in the rankings for
these indicators, several were ranked higher than the overall service area across all eight counties.
Monroe County ranked higher than the overall service area for many indicators, but especially for
those of education (difference of 45), tobacco use (difference of 42), diet and exercise (40), quality
of care (37), sexual activity (34), and employment (33).
Across all IU Health Bloomington service area counties, built environment, access to care,
morbidity, tobacco use, family and social support, education, income, and mortality indicators are
ranked most consistently in the bottom half of all Indiana counties.
5.4.2 Community Health Status Indicators
The Community Health Status Indicators (CHSI) Project of the US Department of Health and Human
Services compares many health status and access indicators to both the median rates in the US
and to rates in “peer counties” across the US Counties are considered “peers” if they share
common characteristics such as population size, poverty rate, average age, and population density.
Monroe County has 39 designated “peer” counties in 22 states, including Delaware and Madison
counties in Indiana, Clark and Richland counties in Ohio, Champaign County in Illinois, Bay,
Calhoun, Jackson, and Kalamazoo counties in Michigan, and Fayette County in Kentucky. Table 8
below highlights the analysis of CHSI health status indicators with highlighting in cells that
compare favorably or unfavorably both to the US as a whole and to peer counties. Indicators are
found to be unfavorable for a county when its rates are higher than those of the entire nation and
designated peer counties, and are considered favorable when the rates for the county are lower
than those of the US or peer counties.
Monroe County compared unfavorably to US and peer county benchmarks for two health
conditions, breast cancer (female) and lung cancer. Several indicators related to birth and infant
care were favorable for Monroe County (where rates and percentages for the indicators in Monroe
County are lower than those for the entire nation or for peer counties), including low birth weight,
very low birth weight, premature births, births to women under the age of 18, births to unmarried
women, no care in first trimester, infant mortality, neonatal infant mortality, and post-neonatal
infant mortality. Chronic condition indicators related to colon cancer, coronary heart disease, motor
vehicle injuries, and unintentional injury were also favorable.
The indicators comparing unfavorable to US and peer counties across most of the eight counties
within the IU Health Bloomington Health service area include lung cancer, coronary heart disease,
stroke, no care in the first trimester, and suicide.
20 | P a g eTable 8
Favorable and Unfavorable Health Status Indicators, Monroe and Surrounding Counties
Source: Community Health Status Indicators Project, Department of Health and Human Services, 2009.
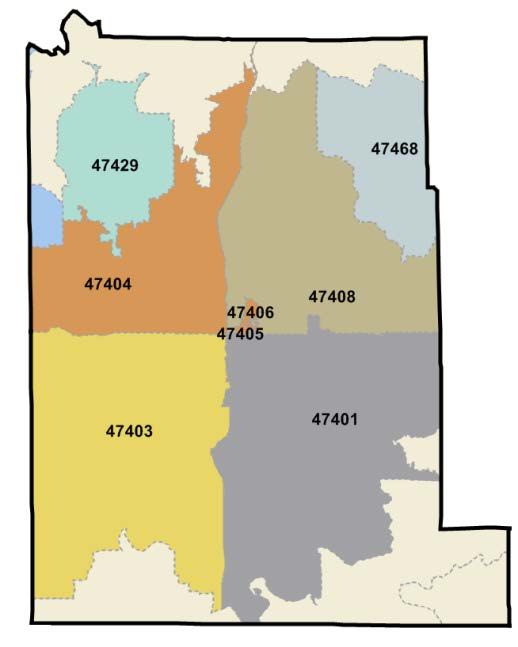
21 | P a g e5.5 ZIP Code-Level Health Access Indicators
The Community Need Index (CNI) was created in 2005 by Dignity Health (formerly Catholic Health
West) in collaboration with Thomson Reuters. CNI identifies the severity of health disparities
related to housing, English as a second language (ESL), and education level for ZIP codes in the
United States. In addition to health indicators, CNI includes economic and structural indicators in its
assessment of the overall health of a community. Scores are assigned on a scale of one to five with
one indicating the least amount of community need and five indicating the most (see Figure 4). The
CNI assessments illustrate correlations between high need/high scores and high hospital utilization
in specific ZIP codes. Table 9 below summarizes the CNI for ZIP codes in Monroe County.
Figure 4
Community Need Index Rating Scale
Table 9
CNI Scores for Monroe County
County City ZIP Code Rank
47404 3.8
47405 3.8
47406 3.8
Bloomington
47403 3.6
Monroe
47408 3.4
47401 3.2
Ellettsville 47429 2.4
Unionville 47468 2.0
Source: Community Need Index, 2011.
Within Monroe County, CNI scores indicate needs are moderately high within ZIP codes 47404,
47406, and 47403 (all in Bloomington), and community needs are relatively low in ZIP codes
47468 (Unionville) and 47429 (Ellettsville).
22 | P a g e5.6 Regional Chronic Conditions and Preventive Behaviors
The National Research Corporation, one of the largest online healthcare surveys in the US,
measures health needs throughout the country. Its Ticker program provides a wide array of data
that measure needs in communities, most notably its Chronic Conditions and Preventive Health
Behaviors surveys. These surveys provide estimates of chronic conditions and related behaviors
within a population of interest.
These estimates are based on a monthly internet survey of over 270,000 individuals across the
country. For this CHNA, Ticker data utilized represent the “Bloomington Regional Market.”
These Ticker data identified the following top ten chronic conditions:
• High blood pressure
• High cholesterol
• Allergies—other
• Arthritis
• Smoking
• Depression/anxiety disorder
• Sinus problem
• Allergies—hay fever
• Obesity/weight problems
• Sleep problems/insomnia
Most chronic conditions and corresponding preventive behaviors of interest have been compared
to the Indiana and US averages. These comparisons indicate that the Bloomington Region
experiences relatively higher percentages of high cholesterol and depression/anxiety disorders
than the state or US averages. The region also contains a much higher percentage of BMI
screenings than those for the US or state of Indiana; and similarly, the percentage of obesity and
weight problems are lower than the Indiana average. The charts in Figure 5 below illustrate the
chronic conditions and preventive behaviors for the Indiana University Health “Bloomington
Regional Market”, Indiana, and the entire nation.
23 | P a g eFigure 5
Chronic Conditions and Preventive Behaviors in the Indiana University Health “Bloomington Regional Market”
0% 20% 40% 60%
59% US Average
Blood Pressure Test 60%
60% Indiana Average
38% Bloomington Region
High Blood Pressure 41%
39%
0% 20% 40% 60%
2%
BMI Screen 2%
9%
US Average
Weight Loss 4%
Indiana Average
4%
Program 4% Bloomington Region
17%
Obesity 20%
18%
0% 20% 40% 60%
41% US Average
Cholesterol Test 41%
39% Indiana Average
33%
High Cholesterol 34%
Bloomington Region
37%
0% 20% 40% 60%
16% US Average
Diabetes Screening 17%
12% Indiana Average
18%
Diabetes 19% Bloomington Region
11%
0% 20% 40% 60%
Mental Health 8% US Average
8%
Screening 6% Indiana Average
21%
Depression/Anxiety 25% Bloomington Region
27%
0% 20% 40% 60%
Stop Smoking 4% US Average
4%
Program 3% Indiana Average
28%
Smoker 31% Bloomington Region
28%
Source: Ticker, National Research Corporation, 2012.
24 | P a g e5.7 Medically Underserved Areas and Populations
The Health Resources and Service Administration (HRSA) has calculated an Index of Medical
Underservice (IMU) score for communities across the US. The IMU score calculation includes the
ratio of primary medical care physicians per 1000 persons, the infant mortality rate, the
percentage of the population with incomes below the poverty level, and the percentage of the
population older than 64. IMU scores range from zero to 100, where 100 represents the least
underserved and zero represents the most underserved.
Any area or population receiving an IMU score of 62.0 or below qualifies for Medically Underserved
Area (MUA) or Medically Underserved Population (MUP) designation. Federally Qualified Health
Centers (FQHCs) may be established to serve MUAs and MUPs. Populations receiving an MUP
designation include groups within a geographic area with economic barriers or cultural and/or
linguistic access barriers to receiving primary care. When a population group does not qualify for
MUP status based on the IMU score, Public Law 99-280 allows MUP designation if “unusual local
conditions which are a barrier to access to or the availability of personal health services exist and
are documented, and if such a designation is recommended by the chief executive officer and local
officials of the State where the requested population resides.” 2 Table 10 below illustrates the areas
that have been designated as MUAs or MUPs in the IU Health Bloomington community.
Table 10
MUAs and MUPs in the IU Health Bloomington Hospital Community
Source: Health Resources and Services Administration, US Department of Health and Human Services, 2012.
2. Guidelines for Medically Underserved Area and Population Designation. US Department of Health and Human
Services, Health Resources and Services Administration. http://bhpr.hrsa.gov/shortage/.
25 | P a g eOwen, Green, and Brown counties had service areas designated as a MUA. Those counties where
the entire county was designated as an MUP included Monroe, Lawrence, and Jackson counties.
5.8 Health Professional Shortage Areas
An area can receive a federal Health Professional Shortage Area (HPSA) designation if a shortage
of primary care, dental care, or mental healthcare professionals is found to be present. HPSAs can
be: “(1) An urban or rural area (which need not conform to the geographic boundaries of a political
subdivision and which is a rational area for the delivery of health services); (2) a population group;
or (3) a public or nonprofit private medical facility.”
Table 11 below lists the HPSAs in the IU Health Bloomington community.
Table 11
HPSAs in the IU Health Bloomington Hospital Community
Source: Health Resources and Services Administration, US Department of Health and Human Services, 2011
26 | P a g e5.9 Description of Other Facilities and Resources Within the Community
The IU Health Bloomington Hospital community contains a variety of resources that are available to
meet the health needs identified through this CHNA. These resources include facilities designated
as FQHCs, hospitals, public health departments, and other organizations.
Table 12 below lists the other facilities and resources in the IU Health Bloomington community.
Table 12
Resources in Monroe and Surrounding Counties
Sources: Health Resources and Services Administration, US Department of Health and Human Services, 2011; Indiana
State Department of Health, Health Care Regulatory Services, 2011.
27 | P a g e5.10 Review of Other Assessments of Health Needs
5.10.1 South Central Community Action Program (SCCAP) Community Needs Assessment
Community Action Agencies (CAAs) across the state assess the needs of their communities every
three years. This is done through the analysis of state and county level data (ie, Census Bureau and
Bureau of Labor Statistics data), client data as reported to Community Services Block Grant (CSBG)
Results Oriented Management Accountability (ROMA) system, and surveying a sampling of both
CAA clients and stakeholders (community partners).
The purpose of the needs assessment is to provide a complete body of information regarding the
specific area to determine if needs are being met and what gaps remain in the community
between programs/services and continuing community needs. The assessment covers the South
Central Community Action Program’s (SCCAP) service area, which includes the counties of Morgan,
Monroe, Brown, and Owen.
A client survey was randomly sent in September 2010 to those who had received services from
SCCAP in 2009. There were 13,772 surveys returned statewide, of which 628 were from SCCAP
clients. Clients who received the survey were asked what their community needs were and what the
barriers were to clients having those needs met.
Key conclusions from the assessment were:
• Most counties served by SCCAP experienced increases in population growth since 2000;
however, one county served by SCCAP, Brown County, actually saw a slight decrease in
population since 2000
• In 2009, in SCCAP’s service area, 39,824 individuals lived in poverty or below the FPG; of
those individuals in poverty 7971 were children (under the age of 18 years old) and 1730
were seniors (65 years old and over)
• Monroe County, served by SCCAP, had the highest poverty rate in the state and was almost
double the state poverty rate in 2009; Owen County, also served by SCCAP, had a poverty
rate higher than the state poverty rate; SCCAP’s other service area counties had poverty
rates lower than the state’s poverty rate in 2009
• The number of children served by the Network increased in 2009 by 27.4% from 2007;
from 2008 to 2009, there was an increase of 21% in the number of children served who
were 6 to 11 years old and a 28% jump in the number of children served who are 12 to
17 years old
• The number of clients served by SCCAP who have completed a two or four year degree
decreased by 53.6% since 2007, while clients served by SCCAP who completed a high
school diploma or equivalency increased 29.5% and the number of clients who completed
some postsecondary education have increased 30.7% since 2008
• In 2009, Community Action Agency Client Survey data showed that about 190,000 clients,
or 56% of those who were asked, reported that they had no health insurance
o This was a substantial increase of 41% from 2007
o Additionally, the client survey asked if anyone in the family was covered by Hoosier
Healthwise, Medicare, or Healthy Indiana (Medicaid) and the vast majority, 77%,
responded yes
• The number of clients who were homeowners increased 32% since 2007 and the number
of clients who were renters increased 15% during this same time period
o These numbers might be reflective of the increase in population growth seen in
most of the counties served by SCCAP since 2000
28 | P a g e• The following were identified by SCCAP’s client survey respondents as top
community needs:
o Assistance to pay their electric/gas bills
o Health insurance coverage
o Affordable housing
o Assistance to pay their rent or mortgage;
o Food assistance
• The following were identified by SCCAP’s client survey respondents as barriers to having
their needs met:
o Cost was a barrier for child care, health insurance, and transportation (price of gas
and can’t afford car repairs)
o No jobs in their field was a barrier to work
• SCCAP offers many programs and services; some of the programs SCCAP offers that
specifically address the community needs and barriers identified by clients include:
o Energy Assistance Program
o Head Start
o Family Development Program
o Individual Development Accounts (IDAs)
• 73% of those surveyed responded to the question asking if they had utilized any of
these services
o Out of those, over one-third stated they had received services four or more times
o About 23% had only received services once
• Only 11% statewide, and 19% of SCCAP client survey respondents, said that they used
a food bank more than once a month
5.10.2 Monroe County Asset Building Coalition Strategic Plan
Generated for Monroe County community leaders and state policy makers by the Asset Building
Coalition in partnership with the Monroe County Commissioners, this strategic plan and
epidemiological profile presents data and analysis to support the development of a framework for
advancing the mission of the Asset Building Coalition and the Indiana Substance Abuse
Prevention System.
An Indiana Prevention Resource Center (IPRC) Alcohol, Tobacco and Other Drugs (ATOD) survey
was conducted on students in grades six through twelve in schools within the county in March and
April 2005. The IPRC school surveys and the recent (2006) findings of the State Epidemiological
and Outcomes Workgroup (SEOW) showed the county listed as a “High Need” priority county
for alcohol.
Key conclusions were:
• The cultural and economic polarity evident in the county is related to the costs and benefits
of having a large university thriving in the midst of an otherwise rural community
• Monroe County Community School Corporation (MCCSC)
o In the 2007-2008 academic year, 25% of all students received free lunch
o 16.5% of all students enrolled were minority students, and 16.5 % were in
special education
o In 2006-2007, the attendance rate was 95.2% and the graduate rate was 86.3%
• The Richland Bean Blossom School Corporation (RBB School) corporation provides public
schooling for the Richland and Bean Blossom townships, which includes the towns of
Ellettsville and Stilesville
29 | P a g eo In 2006-2007, 20% of all students received free lunches
o Minority student enrollment was 4.9%, and special education enrollment
was 19.6%
o In 2006-2007, the attendance was 95.2% and the graduation rate was 84.7%
• 14% of all Monroe County residents live in poverty; 31% of people in county living in poverty
are black, 17% are white, and 30% are Hispanic
• Given the poverty rate of 15.4% of children aged 0-17 in the county, it is safe to conclude
that a high percentage of these youth may be experiencing low bonding with their
respective neighborhoods
o This is important because it decreases the chances for bonding and sustaining
relationships with positive non-parent adults
• 15.2% of MCCSC 8th graders reported first use of alcohol at ages 12-13
• 29.9% of MCCSC 10th grade students reported first use of alcohol at ages 14-15
• Over a quarter of retail outlets for alcohol were in noncompliance with alcohol codes
• The 18-25 year old demographic is responsible for 83% of all substance related offenses
scripted by Bloomington Police Department and Indiana University Police Department
• There is a spike in operating while impaired (OWI) and public intoxication arrests among
21 to 23 year olds; and whites have the highest percentages for these offenses
• In 2006, Bloomington Hospital had 712 emergency room (ER) visits and concurrent
hospital admits for 18-25 year olds with alcohol-related conditions as a primary or
secondary diagnosis
30 | P a g e6 PRIMARY DATA ASSESSMENT
IU Health Bloomington Hospital’s approach to gathering qualitative data for its CHNA consisted of a
multi-component approach to identify and verify community health needs for the IU Health
Bloomington service area. This included the following components:
1. Hosting multiple one and a half to two-hour community conversation focus groups with
public health officials and community leaders in attendance to discuss the healthcare
needs of the service area and what role IU Health Bloomington could play in addressing
the identified needs.
2. Surveying the community at large through the hospital’s website, with special emphasis
to garner input from low income, uninsured, or minority groups.
6.1 Focus Group Findings
6.1.1 Identification of Persons Providing Input
Local leaders with a stake in the community’s health were invited to attend a focus group session
held at IU Health Bloomington Hospital. Attendees who participated in the focus group are listed in
Table 13 below.
Table 13
Focus Group Participants
Name Title, Affiliation Expertise
Former Executive Ms. Thompson is representative of a community perspective regarding access to
Elizabeth
Director, Volunteer’s in care. As former Executive Director of VIM, she works to provide access to care for
Thompson
Medicine (VIM) underserved and low-income populations.
Mr. Lessow is representative of a community perspective toward healthy living.
Executive Director, As Executive Director of the United Way in Monroe County, he works for an
Barry Lessow United Way of organization that believes in helping people learn more, earn more, and lead safe
Monroe County and healthy lives in order to create programs that assist in accomplishing
those goals.
Mr. Kruzan is representative of a community perspective toward healthy living. As
Mark Kruzan Mayor of Bloomington mayor of Bloomington, Mayor Kruzan is knowledgeable on what the community’s
needs are, and the resources that are available to address those needs.
Ms. Caudill is representative of a community perspective toward overall public
Administrator,
health. As an employee of the health department, she understands the issues
Penny Caudill Monroe County
and obstacles involved in the area of public health, as well as ways to address
Health Department
and improve them.
Mr. Peterson is representative of a community perspective toward healthy living.
Board Member, IU Health As a board member at IU Health Bloomington, he is knowledgeable on what the
Daniel Peterson
Bloomington Hospital community’s needs are, and the resources that are available to address
those needs.
Board Member, IU Health Ms. Rogers is representative of a community perspective toward healthy living.
Bloomington Hospital & As a board member at IU Health Bloomington, she is knowledgeable on what the
Ellie Rogers
Member of Local Council community’s needs are, and the resources that are available to address
of Women those needs.
Mr. Moore is representative of a community perspective toward healthy living.
CEO, IU Health
Mark Moore As CEO of IU Health Bloomington, he is knowledgeable on what the community’s
Bloomington Hospital
needs are, and the resources that are available to address those needs.
Ms. Weiss-Kennedy is a representative of a community perspective toward
Director, Community
Carol Weiss- healthy living. As Director of Community Health at IU Health Bloomington
Health, IU Health
Kennedy Hospital, she is knowledge on what the community’s needs are, and the
Bloomington Hospital
resources that are available to address those needs.
31 | P a g e6.1.2 Prioritization Process and Criteria
To obtain a more complete picture of the factors that play into the Monroe County community’s
health, input from local health leaders was gathered through three separate focus group sessions.
The first two were one and a half-hour live group sessions at IU Health Bloomington Hospital, and
the other one was each held as an hour-long phone conference for those who were not able to
meet in person. The one and a half-hour live group sessions were held at IU Health Bloomington
Hospital. IU Health facilitators mailed letters and made follow-up telephone calls inviting public
health officials and community leaders to attend the focus group discussion, paying special
attention to including organizations that represent the interest of low-income, minority, and
uninsured individuals. The goal of soliciting these leaders’ feedback was to gather insights into the
quantitative data that may not be easily identified from the secondary statistical data alone.
Upon arrival to the focus group, participants were asked to list their believed five prioritized health
needs for the IU Health Bloomington community. These responses were collected and aggregated
into a comprehensive list of identified needs to be further discussed later in the session and ranked
for severity of need within the community. IU Health facilitators then provided participants with a
presentation featuring IU Health’s mission, current outreach priorities, and local health data,
including demographics, insurance information, poverty rates, county health rankings, causes of
death, physical activity, chronic conditions, preventive behaviors, and community needs index.
Upon completion of the data presentation, IU Health facilitated a discussion on the comprehensive
list of identified needs from earlier in the session. The objective of this method was intended to
inspire candid discussions prior to a second identification of five prioritized health needs by each
participant. The votes on the five prioritized health needs were tallied and final input from the
group was encouraged during this process in order to validate the previously identified needs.
Following additional discussion, participants were also asked to address what they thought the role
of IU Health Bloomington could be in meeting the local health needs.
6.1.3 Description of Prioritized Needs
The focus group identified the following five needs as priorities for IU Health Bloomington:
1. Mental health and addiction.
2. Access to healthcare.
3. Obesity and diabetes.
4. Chronic disease management.
5. Senior health.
These prioritized needs are discussed in more detail below.
1. Mental health and addiction needs were the overall top ranked needs, with a psychologist and
psychiatrist shortage as the main concern discussed. It was mentioned that homelessness,
substance abuse, and mental health issues coexist; and, this is a growing challenge that Monroe
County currently lacks the support to manage. Of additional concern is the lack of education on
proper diagnosis and the mental health services available in the area. Leaders within the
community also discussed the lack of appropriate psychiatric medication management and the
need for more support for this.
2. Access to healthcare was the second greatest concern mentioned within all three focus groups,
and addressed not only the lack of healthcare services, but also the overall affordability of receiving
32 | P a g eYou can also read