Assessing the Impact of the COVID-19 Pandemic in Spain: Large-Scale, Online, Self-Reported Population Survey
←
→
Page content transcription
If your browser does not render page correctly, please read the page content below
JOURNAL OF MEDICAL INTERNET RESEARCH                                                                                                             Oliver et al

     Original Paper

     Assessing the Impact of the COVID-19 Pandemic in Spain:
     Large-Scale, Online, Self-Reported Population Survey

     Nuria Oliver1, PhD, ING; Xavier Barber2, BSc, MSc, Prof Dr; Kirsten Roomp3, BSc, PhD; Kristof Roomp4
     1
      The Institute for Human(ity)-Centric Artificial Intelligence, ELLIS Unit Alicante Foundation, Alicante, Spain
     2
      Center of Operations Research, Universidad Miguel Hernández, Elche, Spain
     3
      Luxembourg Centre for Systems Biomedicine, University of Luxembourg, Belvaux, Luxembourg
     4
      Microsoft, Redmond, WA, United States

     Corresponding Author:
     Nuria Oliver, PhD, ING
     The Institute for Human(ity)-Centric Artificial Intelligence
     ELLIS Unit Alicante Foundation
     Avenida Universidad
     Alicante, 03690
     Spain
     Phone: 34 630726085
     Email: nuria@alum.mit.edu

     Abstract
     Background: Spain has been one of the countries most impacted by the COVID-19 pandemic. Since the first confirmed case
     was reported on January 31, 2020, there have been over 405,000 cases and 28,000 deaths in Spain. The economic and social
     impact is without precedent. Thus, it is important to quickly assess the situation and perception of the population. Large-scale
     online surveys have been shown to be an effective tool for this purpose.
     Objective: We aim to assess the situation and perception of the Spanish population in four key areas related to the COVID-19
     pandemic: social contact behavior during confinement, personal economic impact, labor situation, and health status.
     Methods: We obtained a large sample using an online survey with 24 questions related to COVID-19 in the week of March
     28-April 2, 2020, during the peak of the first wave of COVID-19 in Spain. The self-selection online survey method of nonprobability
     sampling was used to recruit 156,614 participants via social media posts that targeted the general adult population (age >18 years).
     Given such a large sample, the 95% CI was ±0.843 for all reported proportions.
     Results: Regarding social behavior during confinement, participants mainly left their homes to satisfy basic needs. We found
     several statistically significant differences in social behavior across genders and age groups. The population’s willingness to
     comply with the confinement measures is evident. From the survey answers, we identified a significant adverse economic impact
     of the pandemic on those working in small businesses and a negative correlation between economic damage and willingness to
     stay in confinement. The survey revealed that close contacts play an important role in the transmission of the disease, and 28%
     of the participants lacked the necessary resources to properly isolate themselves. We also identified a significant lack of testing,
     with only 1% of the population tested and 6% of respondents unable to be tested despite their doctor’s recommendation. We
     developed a generalized linear model to identify the variables that were correlated with a positive SARS-CoV-2 test result. Using
     this model, we estimated an average of 5% for SARS-CoV-2 prevalence in the Spanish population during the time of the study.
     A seroprevalence study carried out later by the Spanish Ministry of Health reported a similar level of disease prevalence (5%).
     Conclusions: Large-scale online population surveys, distributed via social media and online messaging platforms, can be an
     effective, cheap, and fast tool to assess the impact and prevalence of an infectious disease in the context of a pandemic, particularly
     when there is a scarcity of official data and limited testing capacity.

     (J Med Internet Res 2020;22(9):e21319) doi: 10.2196/21319

     KEYWORDS
     COVID-19; SARS-CoV-2; public health authorities; large-scale online surveys; infectious disease; outbreak; public engagement;
     disease prevalence; impact; survey; spain; public health; perception

     http://www.jmir.org/2020/9/e21319/                                                                      J Med Internet Res 2020 | vol. 22 | iss. 9 | e21319 | p. 1
                                                                                                                           (page number not for citation purposes)
XSL• FO
RenderX
JOURNAL OF MEDICAL INTERNET RESEARCH Oliver et al
intensive and often yield low response rates (as low as 10% or
Introduction less [4]). Moreover, the resulting sample might be biased and
Background difficult to reweight [5]. Given the limitations of these traditional
methods and given the need for rapid data collection, large-scale
The first cases of COVID-19 were reported in Wuhan, China online surveys can be a valuable method to quickly assess and
in December 2019. Since then, the SARS-CoV-2 virus has longitudinally monitor the situation and perceptions of the
spread worldwide, infecting over 24 million people and causing population in the context of a pandemic [6]. Thus, to shed light
over 825,000 deaths worldwide as of August 27, 2020 [1]. This on important, yet unknown, questions related to COVID-19,
virus has caused significantly more infections and deaths, we designed a 24-question online survey, called the
compared with previous outbreaks of other coronaviruses Covid19Impact survey, to be targeted to the Spanish population.
causing severe acute respiratory syndrome and Middle East The survey became viral 12 hours after its publication, yielding
respiratory syndrome. The World Health Organization declared over 140,000 answers. It is one of the largest surveys in the
a global COVID-19 pandemic on March 11, 2020, and to date world carried out in the context of the COVID-19 pandemic
has been unable to predict the duration of the pandemic [2]. [7].
The first confirmed case of COVID-19 in Spain was reported Population Surveys During the COVID-19 Pandemic
on January 31, 2020, when a German tourist tested positive in
the Spanish Canary Islands. However, this was an isolated Other efforts to collect data from the population regarding the
imported case. It was not until February 24 when Spain COVID-19 pandemic have been deployed in multiple countries.
confirmed several new COVID-19 cases related to a recent The largest study to date involved the Methods smartphone app,
SARS-CoV-2 outbreak in the north of Italy. Since that date, the with 2,618,862 participants who self-reported symptoms in the
number of COVID-19 cases grew exponentially in Spain so that United States and the United Kingdom [8]. The study asked
by March 30, 2020, there were over 85,199 confirmed cases, questions focused on risk factors and symptoms, and described
16,780 recoveries, and the staggering figure of 7424 deaths, a predictive model of COVID-19 based on these variables. In
according to the official numbers. On March 25, 2020, the death Canada, FLATTEN [9] has gathered data from respondents and
toll attributed to COVID-19 in Spain surpassed that of mainland asks simple health and demographic-related questions to help
China, and it was only surpassed by the death toll in Italy. The monitor the spread of the virus in an anonymous manner. The
economic and social impact of the COVID-19 pandemic in International Survey on Coronavirus asks questions focusing
Spain is without precedent. on the psychological impact of the crisis [10]. There were three
main findings from the analysis of this survey’s answers: many
To combat the pandemic, the Spanish Government implemented respondents found that both the population and their
a series of social distancing and mobility restriction measures. governments’ response to the COVID-19 pandemic was
First, all classes at all educational levels were cancelled in the insufficient, this insufficient response was associated with lower
main hot spots of the disease on March 10, in the Basque mental well-being, and a strong government response was
Country and on March 11, 2020, in the Madrid and La Rioja associated with an improvement in respondents’ views of other
regions. All direct flights from Italy to Spain were cancelled on people and their government together with better mental
March 10. On March 12, the Catalan Government quarantined well-being. The COVID-19:CH Survey in Switzerland aims to
four municipalities that were particularly affected by the virus. collect personal data related to COVID-19 testing with
On March 13, the Government of Spain declared a state of additional health- and potential exposure–related information
emergency for 2 weeks across the entire country. Since the state [11]. The data collected is presented to the public in a visual
of emergency was established, all schools and university classes format, giving information on, among other things,
were cancelled, large-scale events and nonessential travel were demographics, comorbidities, and symptoms. In Israel, the
forbidden, and workers were encouraged to tele-work. Despite Weizmann Institute and the Ministry of Health are collecting
these efforts, the daily growth rate in the number of confirmed data on basic demographics, health, and potential exposure [12].
COVID-19 cases continued to grow. Thus, on March 30, new The project aims to predict the location of COVID-19 outbreaks
mobility restriction and social distancing measures were by analyzing information collected about the virus symptoms
implemented; all nonessential labor activity was to be and public behavior in real time [6,13,14].
interrupted for a 2-week period. Moreover, the Spanish
Government extended the state of emergency first until April Numerous efforts with smaller numbers of respondents have
11 and then renewed on a biweekly basis until June 21. Although also taken place or are ongoing. In China, an early study was
these interventions put a halt to the normal daily lives of most conducted between January 27 and February 1, 2020, which
people in Spain, their impact on people’s economic, physical, relied on the Chinese social media and traditional media outlets
and mental well-being were unknown at the time, as was the asking about knowledge, attitudes, and practices toward
actual prevalence of the disease. COVID-19 [15]. Among its many findings, the authors reported
that most respondents felt that China could win the battle against
Given the growth rate in the number of confirmed COVID-19 the virus. An early international project was run from February
cases, rapid assessments of the population’s situation and 23 to March 2, 2020, collected data from the United Kingdom
perceptions of the infection are of paramount importance. and the United States using an online platform managed by
Traditional methods, such as population-representative Prolific Academic Ltd, and asked about knowledge and
household surveys are slow to design and deploy [3]. Phone perceptions of COVID-19 [16,17]. The survey provided potential
surveys are generally faster to conduct, yet they are labor information to guide public health. In mid-March and over 48
http://www.jmir.org/2020/9/e21319/ J Med Internet Res 2020 | vol. 22 | iss. 9 | e21319 | p. 2
(page number not for citation purposes)
XSL• FO
RenderXJOURNAL OF MEDICAL INTERNET RESEARCH Oliver et al
hours, responses were collected in the United States; the survey having on people’s finances is of great value to policy makers.
had been posted on 3 social media platforms (Twitter, Facebook, Finally, there is the personal experience related to having to be
and Nextdoor) and collected data on symptoms, concerns, and confined in the home for weeks. How much longer will the
individual actions [18]. They showed that 95.7% of respondents population be able to sustain this situation?
made lifestyle changes, including handwashing, avoiding social
In this paper, we describe the Covid19Impact survey, which
gatherings, social distancing, etc. In the United Kingdom, data
was designed to answer these questions. We present the
was collected attempting to identify sociodemographic adoption
methodology that we followed to gather a large-scale sample
of social-distancing measures, ability to work from home, and
via an online survey, followed by the analysis of the resulting
both the willingness and ability to self-isolate [19], providing
answers and the main insights derived from them. Finally, we
potential information to policy makers. An online survey
describe our conclusions and lines of future work.
(FEEL-COVID) used the snowball sampling method to collect
data in India and found that almost one-third of respondents
were negatively psychologically impacted by the pandemic
Methods
[20]. Sampling and Data Collection
Our work complements these previous related efforts by To answer the previously formulated questions, we designed a
focusing on Spain (one of the most affected countries by the 24-question anonymous online survey that we refer to as the
COVID-19 pandemic) and by addressing four areas of people’s Covid19Impact survey (Multimedia Appendix 1). The survey
experiences during the confinement: their social contact is divided in 4 sections that address four different dimensions
behavior, economic impact, labor situation, and health status. related to the population’s experience during the COVID-19
This Study crisis: their social contact in the last 2 weeks, the economic
impact of the pandemic, their workplace and labor situation,
Despite the availability of data regarding the number of and their health status. Moreover, the survey collects basic
confirmed COVID-19 cases, hospitalized and intensive care demographic (age range, gender, postal code) and home (type
patients, and deaths in the early stages of the COVID-19 of home and number and ages of people in the home) data.
pandemic, there was a scarcity of high-quality data about
important questions related to the population’s experience. We used the self-selection online survey method of
nonprobability sampling to recruit participants via social
First, there is the issue of underreporting confirmed cases and network posts (mainly Twitter and WhatsApp), asking the
COVID-19–related deaths. Work by the Imperial College Spanish population (18 years or older) to answer the survey.
COVID-19 Response Team [21] estimated that 15% of the This sampling method is particularly suitable during a
Spanish population could be infected by SARS-CoV-2. confinement situation where the mobility and social contact of
However, this figure was estimated to be much lower at around the population is greatly reduced. Thus, the online distribution
5.3% by the preliminary results of a seroprevalence study carried of the survey enabled fast access to it by large numbers of
out by the Spanish Ministry of Health [22,23]. Assessing the people.
percentage of infected individuals is of utmost importance to
build accurate epidemiological models and to assist policy In addition to distributing the survey on Twitter and WhatsApp,
makers in their decisions. we used snowball sampling [25]. The goal was to collect as
large of a sample as possible in a short amount of time, as the
Second, there are unknowns regarding the sources of infection. COVID-19 situation was rapidly evolving, and new government
Are people being infected by friends, family members, relatives, measures might be required. The objective is to gather a
and coworkers, or are they being infected when shopping in snapshot of people’s experiences regarding the four sections
supermarkets or at the bakery? The effectiveness of different previously described.
government interventions will depend on the answers to these
questions. Anticipating the start of new mobility restriction and social
distancing measures on Monday, March 30, 2020, we deployed
Third, the economic impact that the COVID-19 crisis will have the survey on Saturday, March 28 at 8 PM. Via social media
on people’s lives is yet to be quantified. According to the latest (Twitter and WhatsApp) and snowball sampling, we distributed
figures from the Spanish Industry, Commerce and Tourism the survey to a wide set of highly connected users who, in turn,
Ministry, only 0.2% of Spanish companies have 250 or more distributed it to their contacts. The survey was also distributed
employees, 44.6% of companies are micro (1-9 employees) or by professional organizations, town halls, civil groups, and
small (10-49 employees), and 54.4% of companies consist of associations. In the 12 hours that followed, the survey went
the self-employed [24]. Small businesses are generally viral in Spain, and by the afternoon of Monday, March 30, we
unprepared to confront such a crisis. Moreover, tourism had collected over 140,000 answers. Figure 1 illustrates the
represents 14.6% of Spanish gross domestic product (GDP) and growth in the number of answers over time, and the peak was
2.8 million jobs, and these are threatened by the COVID-19 reached in the time frame between 4 PM and 5 PM on Saturday,
pandemic [24]. Measuring the impact that the pandemic is March 29, with more than 15,000 answers in 1 hour.
http://www.jmir.org/2020/9/e21319/ J Med Internet Res 2020 | vol. 22 | iss. 9 | e21319 | p. 3
(page number not for citation purposes)
XSL• FO
RenderXJOURNAL OF MEDICAL INTERNET RESEARCH Oliver et al
Figure 1. Number of answers collected by the Covid19Impact survey in its first two days, reported in one hour intervals.
The initial version of the survey was delivered via Google Personal economic impact is assessed with questions Q15 and
Forms, which allowed us to write and deploy the survey in an Q16, followed by three questions (Q17-Q19) related to their
anonymous, scalable, and free manner within hours. The URL workplace situation. Finally, the last 5 questions (Q20-Q24)
to the Google Forms was shared via bit.ly, such that we could address their health state to assess how many people might be
estimate how many times the link had been shared. After infected by the virus, determine the ability of participants to
reaching 140,000 answers, we began to hit scale limitations in self-isolate, and collect feedback regarding testing availability
Google Forms, so on March 30, 2020, we moved the survey to and testing results.
Survey123 [26] for future editions of the data collection.
None of the questions, except for the consent question, were
Questionnaire Structure compulsory, and all the health-related questions included “I
All questions were anonymized to preserve privacy and no prefer not to answer” as a choice.
personal information was collected. In addition, the snowball Credibility and Validity
sampling methodology enabled the anonymous distribution of
Before widely deploying the survey, we carried out a pilot study
the survey. The survey can be found online [27].
to validate its content and proper anonymization with a small
First, the survey obtained explicit consent from the users. Only sample of participants. The questions were written in Spanish
when consent was granted and respondents confirmed they were and English. Once all the bugs were fixed and minor feedback
adults could respondents continue to the rest of the questions. about the wording of the questions was addressed, we proceeded
to widely deploy the survey.
The first section (question Q1-Q4) gathers basic demographics:
country, age range, gender, and postal code. Next, there are 3 Ethical Approval of the Research Protocol and
questions (Q5-Q7) related to the home situation: type of home, Instruments
number of people in the home, and their ages. The following 7
Before its deployment, the research protocol and instrument
questions (Q8-Q14) address the social contact behavior of the
were reviewed and approved by the cabinet of the President of
respondents during the last 2 weeks. This is an important section
the Valencian Region of Spain. The findings of this survey have
of the survey as we aim to understand the level of social
been regularly used and shared by the Valencian Government
interaction that people had despite the confinement and social
to assist their policy making during the COVID-19 pandemic
distancing measures. The questions asked about having had
[28].
contact with infected individuals, whether children were taken
care of outside the home, if they had an external person coming Data Exclusion, Cleansing, and Reweighting
to their house (eg, house cleaner), for what types of activities From a total of 156,614 answers, we eliminated all answers
had they left their home, and what transportation means had with blank or invalid postal codes. Moreover, we only analyzed
they used. The last two questions intend to capture people’s responses with nonblank answers related to age, gender,
perceptions of the confinement measures: if they thought the province, and profession (including those who reported not
measures were enough to contain the pandemic and for how working), yielding a final data set of 141,865 answers.
long they would be able to tolerate the containment situation.
http://www.jmir.org/2020/9/e21319/ J Med Internet Res 2020 | vol. 22 | iss. 9 | e21319 | p. 4
(page number not for citation purposes)
XSL• FO
RenderXJOURNAL OF MEDICAL INTERNET RESEARCH Oliver et al
Thus, we report the results of analyzing these 141,865 answers Statistical Analyses
collected between 8 PM GMT of March 28 and 11:59 PM GMT The sampling error, after reweighting the samples, was 0.43.
on April 2, 2020. With such a large sample, this survey is one This small sampling error, due to the large sample, yields a
of the largest population surveys on COVID-19 and the largest narrow 95% CI of ±0.8428 for all proportions reported.
in Spain published to date [7].
We use the Z test to compare two proportions, considering that
All questions were binary or categorical. Thus, we report the the data comes from a survey and as such, the variance of each
percentage of participants who selected each response. Because proportion is different to that of an infinite population test. We
our gender, age, geographic location, and profession use a chi-square test to compare the independence between two
distributions were not proportional to those of the general questions [29]. Differences between answers greater than 0.85
population of Spain, we computed a weighting factor, such that were statistically significant with PJOURNAL OF MEDICAL INTERNET RESEARCH Oliver et al
with 2 (n=42,513, 30.0%), 3 (n=36,879, 26.0%), or 4 (n=38,265, 60.7% of the respondents were female vs 39.3% male. This
27.0%) people, which is consistent with Spain’s demography. large difference is partially due to the larger percentage of
women (72.5%) who work in the health care sector vs men
The rest of the reported statistics in this paper correspond to
(27.5%) in Spain [32].
analyzing the reweighted sample to match in gender, age,
province, and profession the distribution in Spain according to When asked if an outside person regularly visited the home
the latest data published by the Spanish INE. (Q10), we identified a significant difference (P70 years) and younger respondents
Given that COVID-19’s fatality rates are largest for older adults
(n=141,365): 21.2% of older respondents regularly had a person
[33], we analyzed the age distribution of the homes with older
coming to their home versus only 13.6% in the case of younger
adults: 11.8% of respondents older than 50 years lived with an
adults (age 60 years) and 19.9% of respondents lived in
measures might need to be taken to protect the 21.2% of older
homes inhabited only by older adults. Intergenerational homes
adults who regularly receive external people in their homes.
are particularly important for the transmission of SARS-CoV-2
[34]. Respondents (n=140,686) left their homes during the social
distancing period for a variety of purposes (Q11), as shown in
Social Contact Behavior (Q8-Q14) Figure 2: covering basic needs (supermarkets, bakery, and
With respect to social contact behavior with individuals with a pharmacy) was the most common reason, reported by 47.8%
confirmed SARS-CoV-2 infection (Q8), 17.3% of respondents of respondents, followed by going to work (31.3% of
reported having had close contact with a person who was respondents). We identified statistically significant differences
infected with COVID-19 (n=140,008). The most common social (P60
context was a coworker (6.2%), a household member (6.1%), years) were more likely than younger participants (ageJOURNAL OF MEDICAL INTERNET RESEARCH Oliver et al
The last two questions in this section (Q13 and Q14) concerned Personal Economic Impact and Workplace Situation
the personal experience of respondents regarding the (Q15-Q19)
containment measures; 50.4% of participants (n=141,481)
An inevitable consequence of the COVID-19 pandemic is its
believed that the government should implement more measures
economic and labor impact. Spain is a country with mostly small
to contain the pandemic, and only 2.2% thought that the
businesses, many of which are family owned. Q15-Q19 aim to
measures were too severe. There was a significant difference
shed light on the individual experiences and fears of people
(PJOURNAL OF MEDICAL INTERNET RESEARCH Oliver et al
companies were facing bankruptcy even at this early stage of risk factor (48.3%) versus none of the listed risk factors (46.9%).
the pandemic. In addition, 4.9% of respondents were health care workers. The
risk factors that we asked participants about were hypertension,
Again, there is a gender-based statistically significant difference
diabetes, cardiovascular disease, respiratory illness,
(PJOURNAL OF MEDICAL INTERNET RESEARCH Oliver et al
Table 3. Testing needs, depending on the presence of symptoms.a
Testing Difficulty breathing, dry cough, or fever, %b Other or no symptoms, %b
Negative 2.3 0.6
No need 58.1 93.1
No test available 32.5 4.9
Positive 3.9 0.2
Waiting for results 1.2 0.1
No, but need one due to being caretaker of 2.1 1.1
person at risk
a
All differences between the symptoms/no symptoms groups were statistically significant (PJOURNAL OF MEDICAL INTERNET RESEARCH Oliver et al
Table 4. Selected variables and coefficients of the generalized linear model.
Variable Estimate SE T value P value
(Intercept) 0.12510 0.01636 7.647JOURNAL OF MEDICAL INTERNET RESEARCH Oliver et al
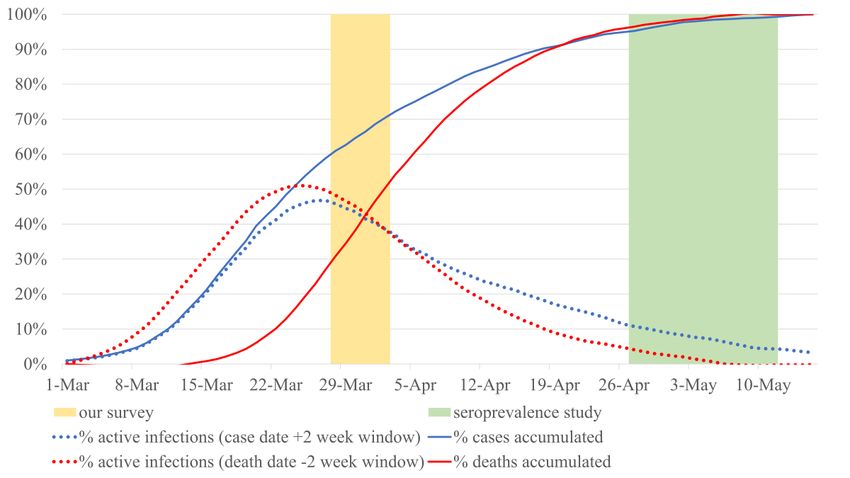
Figure 4. Two methods for estimating the proportion of active coronavirus infections during the time of our study in relation to those identified by the
seroprevalence study. Red dotted line based on the Mortality Monitoring System deaths, assuming infection started 2 weeks prior to death. Blue dotted
line based on reported positive cases, assuming infection ended 2 weeks after the case was reported. Cases and deaths from the Carlos III Health Institute
in Spain.
In our first estimate of the proportion, we used the excess beginning of our study, as 73% of the responses of our survey
mortality estimates provided by the Spanish Mortality were collected between March 28 and 29, 2020.
Monitoring System known as MoMo [40] and made two
In addition, we created a second model based only on symptoms.
assumptions: the number of deaths was proportional to the
Although it had a lower area under the curve (see Figure 3, left),
overall number of infected individuals and all infected
this model had a better defined time frame, since it only captured
individuals would have been infected for at least 2 weeks prior
the people who had symptoms during the time of our study—as
to death [41].
opposed to also capturing as-of-yet uninfected members of the
Our second estimate used the number of officially reported household who might be infected in the future. Thus, the
positive cases and assumed that individuals were infected for proportions computed previously would apply better to the
at least 2 weeks after their diagnosis. symptom-only model.
As shown in Figure 4, both estimates gave similar results; Table 5 shows the prevalence estimations of each of the models
according to the former, 47% (red dotted line) and, according based on our survey answers (symptom-only model and full
to the latter, 45% (blue dotted line) of individuals that were model) and of the seroprevalence study for each of the 17
detected by the seroprevalence study would have had an active autonomous communities in Spain. The symptom-only model
SARS-CoV-2 infection during the time of our study. Note that estimated a prevalence 40% lower than that of the
our survey responses have a significant skew toward the seroprevalence study.
http://www.jmir.org/2020/9/e21319/ J Med Internet Res 2020 | vol. 22 | iss. 9 | e21319 | p. 11
(page number not for citation purposes)
XSL• FO
RenderXJOURNAL OF MEDICAL INTERNET RESEARCH Oliver et al
Table 5. Comparison of inferred prevalence by two models based on the survey answers and the seroprevalence study.
Autonomous community Participants, n Symptom-only model, % (95% CI) Full model, % (95% CI) Seroprevalence survey, % (95% CI)
Andalucía 5691 2.2 (±0.3) 4.4 (±0.5) 2.7 (2.2-3.2)
Aragón 1463 2.0 (±0.3) 3.1 (±0.9) 4.9 (3.8-6.3)
Asturias 655 1.5 (±0.3) 4.0 (±1.5) 1.8 (1.3-2.5)
Balearic Islands 1222 1.9 (±0.3) 4.2 (±1.1) 2.4 (1.6-3.5)
Canarias 1052 1.4 (±0.2) 3.0 (±1.0) 1.8 (1.1-2.8)
Cantabria 497 2.8 (±0.3) 4.6 (±1.8) 3.2 (2.1-5.0)
Castilla y León 1994 3.7 (±0.4) 6.1 (±1.0) 7.2 (6.3-8.1)
Castilla-La Mancha 3469 8.0 (±0.3) 10.4 (±1.0) 10.8 (9.3-12.4)
Catalonia 5088 2.8 (±0.3) 4.8 (±0.6) 5.9 (4.9-6.9)
Valencia 102,021 1.6 (±0.3) 3.4 (±0.1) 2.5 (1.9-3.2)
Extremadura 656 2.3 (±0.4) 4.4 (±1.6) 3.0 (2.2-4.1)
Galicia 2257 1.3 (±0.3) 2.6 (±0.7) 2.1 (1.7-2.6)
Madrid 10,365 6.1 (±0.4) 8.8 (±0.5) 11.3 (9.8-13.0)
Murcia 3566 1.5 (±0.3) 3.2 (±0.6) 1.4 (0.8-2.4)
Navarra 580 3.6 (±0.4) 5.5 (±1.9) 5.8 (4.3-7.6)
País Vasco 1007 1.9 (±0.4) 3.9 (±1.2) 4.0 (3.1-5.2)
Rioja, La 220 1.8 (±0.4) 5.0 (±2.9) 3.3 (2.4-4.4)
National 141,803 3.0 (±0.3) 5.0 (±1.1) 5.0 (4.7-5.4)
The prevalence estimates by the full model are closer to the is an example of citizen’s science and people’s willingness to
estimates provided by the seroprevalence study. This finding help by contributing with their answers to achieve more
might be explained by the fact that 40% of the identified likely data-driven decision-making processes. Although the sample
infections by the full model were not based on symptoms, but has some biases, we used reweighting to mitigate them.
instead based on the variable that captures if the respondents
Second, we empirically corroborate the impact that close
shared their home with an infected individual. Due to the harsh
contacts play in the transmission of the disease. Over 16% of
nature of the lockdown in Spain at that time, including the
respondents reported having had close contact with someone
banning of all mobility except essential labor and basic needs
who was infected by SARS-CoV-2. This percentage was much
between March 30 and April 9, 2020 (both included) [42], many
higher (80.9%) among those who had tested positive for
of the new infections in the period between the end of our study
coronavirus. According to this finding, those testing positive
and the end of the seroprevalence survey (ie, between April 4
were likely infected by someone they knew and had close
and May 17) may have been household members captured by
contact with, rather than, for example, an unknown infected
our model.
stranger in a supermarket. This finding could have implications
for contact tracing strategies.
Discussion
Third, gender matters. Several statistically significant differences
Principal Findings were found between male and female respondents, with a pattern
Through the survey answers, we identified several patterns and of placing women in situations of higher vulnerability or
implications for the design of public policies in the context of exposure when compared to men. As in other aspects of society,
the COVID-19 pandemic. gender-based differences exist in the context of a pandemic. It
is a socially important factor that needs to be considered.
First, our work highlights the value of involving the population
and carrying out large-scale online surveys for a quick Fourth, age also matters. We identified statistically significant
assessment of the situation and perceptions during a pandemic. differences in the social contact behavior questions between
We were overwhelmed by the response to the survey. Mayors older participants (age >60 years) and younger participants (age
in large and small towns got involved and shared it with theirJOURNAL OF MEDICAL INTERNET RESEARCH Oliver et al
associations between age, gender, the ability to self-isolate, and individual in the household) plus demographic information, we
the probability of testing positive; older females without the built a generalized linear model and reported SARS-CoV-2
capacity to isolate themselves were almost twice as likely to prevalence estimations that are on par with those carried out by
test positive than otherwise. a seroprevalence study in Spain. As shown in related studies
[6], when public policy decisions need to be made rapidly in a
Participants demanded more measures, as 50.4% of respondents
situation of data scarcity and limited testing capacity, a
were supportive of implementing additional social distancing
large-scale population survey might be of great value to make
measures. This result might reflect the worry in people’s minds
fast assessments of prevalence, as it can be deployed rapidly
regarding the exponential progression of the pandemic and the
and enable the collection of results within hours.
lack of clear signs of flattening the curve at the time of
answering the survey. Finally, in the context of Spain, our survey revealed a lack of
tests; over 6.1% of respondents reported not being able to do
Moreover, the majority of respondents (76.5%) were willing to
the test despite their doctor’s recommendation. Moreover, a
remain in confinement for a month or more, and 32.4% of
significant difference was found between those who had at least
respondents reported being able to do so for 3-6 additional
one of three COVID-19 symptoms, namely, dry cough, fever,
months.
and difficulty breathing, and those who did not regarding the
Even at the end of March, the economic impact of the pandemic impact of testing unavailability; 32.5% of the symptomatic
was evident, particularly for those working in small companies, individuals reported that tests were not available despite their
19.4% of which reported to be facing bankruptcy. Moreover, doctor’s recommendation. Thus, we found that there was a need
over 47.3% of participants who worked in small companies for more tests.
reported having been impacted by the pandemic. In terms of
professions, hospitality, construction, and retail were the most
Limitations
affected. Hospitality represents 6.2% of the Spanish GDP [43] Although the sample size in our study is large, our methodology
and construction 5.6% [44]. We expect the economic impact to is not exempt of limitations. First, there are several sources of
be significantly larger as the pandemic progresses. bias in our study: selection bias, given that all participants
volunteered to fill out the survey without any incentive;
Among those who were working, 28.7% of respondents reported self-reported bias; and sampling bias as we used a nonprobability
tele-working and one-third leaving the home to go to work. The sampling technique. Geographically, we lacked representation
tele-work figure is lower than in other countries. For example, of several geographic regions in Spain and particularly rural
in the United States, it is estimated that 56%-62% of the areas. In our analysis, we tried to mitigate some of these biases
workforce could work remotely. Moreover, on March 31, 2020, by correcting for gender, age, location, and profession via
the government established labor mobility restrictions for all reweighting using the Spanish INE census data. However,
nonessential professions. Given that 71.2% of respondents reweighting does not eliminate the risk of selection bias. Second,
(n=141,865) reported having worked in the last month, our this is an in-the-wild study, and thus, people could have provided
expectation is that about 23% of the population would have untruthful answers. We addressed this limitation by filtering
been impacted by such measures. Regarding workplace entries without proper zip codes and entries that had
infections, we found that 11.1% of those who tested positive inconsistencies in them. In addition, our study provides a
(and did not work in the health care sector) had close contact snapshot over a 5-day time period, such that the results are only
with someone at work who had tested positive for coronavirus. representative of this time period. We have addressed this
Close, known contacts seem to play a large role on infections, limitation by deploying the study on a weekly basis since its
as 80.9% of those who had tested positive responded having first deployment at the end of March [28].
had close contact with a known infected individual. This finding Finally, our prevalence estimates have several limitations,
is relevant in the design of contact tracing, testing, and isolation including overestimation of symptoms due to the existence of
strategies. other flu-like illnesses at the time, and selection bias for
Quarantine infrastructure might be needed, as over 27.7% of symptomatic individuals who might have been more motivated
respondents reported not having the appropriate infrastructure to respond or forward the survey. We also lacked detail
to isolate themselves at home. Effective quarantine measures regarding which SARS-CoV-2 test respondents had taken, the
for asymptomatic or lightly symptomatic patients are key to reliability of these tests, and the relative timeframe of when the
control the spread of the pandemic. Thus, developing the needed tests were taken versus symptoms. However, as noted in the
infrastructure might be key to slowdown the transmission of manuscript, our goal is to show the value of large-scale, online,
the disease. self-reported population studies to quickly and cheaply
approximate the prevalence of COVID-19 when testing capacity
The number of SARS-CoV-2 infected individuals in Spain in is limited and data is scarce, as was the case in Spain at the time
March and April was certainly larger than what has been of the study and as might be the case in other countries in the
officially reported. In our survey, over 16.8% of respondents future.
reported having at least one possibly COVID-19–related
symptom. We show how the prevalence of a rapidly spreading Conclusions
disease such as COVID-19 can be estimated using a large-scale The COVID-19 pandemic is undoubtedly having a major impact
population survey. From the answers to two of the questions on the lives of people worldwide. Although there is data
(Q22: symptoms and Q8: contact with coronavirus-infected
http://www.jmir.org/2020/9/e21319/ J Med Internet Res 2020 | vol. 22 | iss. 9 | e21319 | p. 13
(page number not for citation purposes)
XSL• FO
RenderXJOURNAL OF MEDICAL INTERNET RESEARCH Oliver et al
regarding the number of reported cases, hospitalizations and The data is extremely rich and multifaceted. Thus, it offers
intensive care patients, and deaths, there is a scarcity of data numerous avenues of future work and deeper analysis according
about the individual experiences of people; their personal, to different dimensions, including location (at a zip code level),
financial and labor situations; their health state; and their which we have not covered in this paper.
attitudes toward the confinement measures. This paper reports
We have launched successive versions of the Covid19Impact
the first results of analyzing a large-scale, rich data set of
survey [27] in consecutive weeks throughout the COVID-19
self-reported information regarding the social contact, economic
pandemic to assess the COVID-19 situation from the perspective
impact, working situation, and health status of over 140,000
of the population in Spain over time and identify changes in
individuals in Spain. It is the largest population survey carried
people’s situations and perceptions regarding the pandemic.
out in Spain in the context of an infectious disease pandemic.
Acknowledgments
We thank the thousands of participants who volunteered to fill out this survey and shared it with their contacts. Their generosity
and enthusiasm have enabled this valuable data set to be collected. Kristof Roomp would like to thank his employer, Microsoft,
for letting him volunteer his time to help on this effort. This project has been carried out in collaboration with the Valencian
Government of Spain via the position of NO as Commissioner to the President of the Valencian Region on Artificial Intelligence
Strategy and Data Science against COVID-19. It was partially funded by the research project “CD4COVID” awarded by “FONDO
Supera COVID-19” from Banco Santander, the Spanish National Research Council and Conference of Rectors of Spanish
Universities.
Authors' Contributions
NO and Kristof Roomp conceptualized the study, interpreted and analyzed the data, drafted the manuscript, and provided
supervision. Kristof Roomp deployed the survey and parsed the responses. XB reweighted and analyzed the data. Kirsten Roomp
conceptualized the study, carried out the literature review and provided feedback to the manuscript. All authors approved the
final version of the manuscript.
Conflicts of Interest
None declared.
Multimedia Appendix 1
Survey questions translated from Spanish.
[DOCX File , 18 KB-Multimedia Appendix 1]
Multimedia Appendix 2
Univariate tables.
[DOCX File , 62 KB-Multimedia Appendix 2]
Multimedia Appendix 3
A .txt file is provided with the 141,865 survey answers used in this paper. To protect the anonymity of the survey respondents,
only province-level geographic location information is included, the timestamp has been removed, and the answers have been
randomly sorted to prevent deanonymization.
[TXT File , 44646 KB-Multimedia Appendix 3]
References
1. Coronavirus disease 2019 (COVID-19) situation reports. World Health Organization. 2020. URL: https://www.who.int/
emergencies/diseases/novel-coronavirus-2019/situation-reports
2. WHO Director-General's opening remarks at the media briefing on COVID-19 - 11 March 2020. World Health Organization.
2020 Mar 11. URL: https://www.who.int/dg/speeches/detail/
who-director-general-s-opening-remarks-at-the-media-briefing-on-covid-19---11-march-2020
3. Gong W, Taighoon Shah M, Firdous S, Jarrett BA, Moulton LH, Moss WJ, et al. Comparison of three rapid household
survey sampling methods for vaccination coverage assessment in a peri-urban setting in Pakistan. Int J Epidemiol 2019
Apr 01;48(2):583-595. [doi: 10.1093/ije/dyy263] [Medline: 30508112]
4. Kennedy C, Hartig H. Response rates in telephone surveys have resumed their decline. Pew Research Center. 2019 Feb
27. URL: https://www.pewresearch.org/fact-tank/2019/02/27/response-rates-in-telephone-surveys-have-resumed-their-decline/
5. Abraham K, Presser S, Helms S. How social processes distort measurement: the impact of survey nonresponse on estimates
of volunteer work in the United States. AJS 2009 Jan;114(4):1129-1165. [doi: 10.1086/595945] [Medline: 19824303]
http://www.jmir.org/2020/9/e21319/ J Med Internet Res 2020 | vol. 22 | iss. 9 | e21319 | p. 14
(page number not for citation purposes)
XSL• FO
RenderXJOURNAL OF MEDICAL INTERNET RESEARCH Oliver et al
6. Allen WE, Altae-Tran H, Briggs J, Jin X, McGee G, Raghavan R, et al. Population-scale longitudinal mapping of COVID-19
symptoms, behavior, and testing identifies contributors to continued disease spread in the United States. medRxiv 2020
Jun 11:A. [doi: 10.1101/2020.06.09.20126813] [Medline: 32577674]
7. Surveys. Oxford Supertracker: The Global Directory for COVID Policy Trackers and Surveys. URL: https://supertracker.
spi.ox.ac.uk/surveys/
8. Menni C, Valdes AM, Freidin MB, Sudre CH, Nguyen LH, Drew DA, et al. Real-time tracking of self-reported symptoms
to predict potential COVID-19. Nat Med 2020 Jul;26(7):1037-1040. [doi: 10.1038/s41591-020-0916-2] [Medline: 32393804]
9. Flatten. 2020. URL: https://flatten.ca/
10. Fetzer T, Witte M, Hensel L, Jachimowicz J, Haushofer J, Ivchenko A, et al. Perceptions of an insufficient government
response at the onset of the COVID-19 pandemic are associated with lower mental well-being. PsyArXiv 2020 Apr 16:A
[FREE Full text] [doi: 10.31234/osf.io/3kfmh]
11. COVID-19:CH Survey. 2020. URL: https://covid19survey.ethz.ch/survey
12. coronaisrael.org. 2020. URL: https://coronaisrael.org/en/
13. Rossman H, Keshet A, Shilo S, Gavrieli A, Bauman T, Cohen O, et al. A framework for identifying regional outbreak and
spread of COVID-19 from one-minute population-wide surveys. Nat Med 2020 May;26(5):634-638 [FREE Full text] [doi:
10.1038/s41591-020-0857-9] [Medline: 32273611]
14. Bagheri SHR, Asghari AM, Farhadi M, Shamshiri AR, Kabir A, Kamrava SK, et al. Coincidence of COVID-19 epidemic
and olfactory dysfunction outbreak. medRxiv 2020 Mar 27:A. [doi: 10.1101/2020.03.23.20041889]
15. Zhong B, Luo W, Li H, Zhang Q, Liu X, Li W, et al. Knowledge, attitudes, and practices towards COVID-19 among Chinese
residents during the rapid rise period of the COVID-19 outbreak: a quick online cross-sectional survey. Int J Biol Sci
2020;16(10):1745-1752 [FREE Full text] [doi: 10.7150/ijbs.45221] [Medline: 32226294]
16. Geldsetzer P. Knowledge and perceptions of COVID-19 among the general public in the United States and the United
Kingdom: a cross-sectional online survey. Ann Intern Med 2020 Jul 21;173(2):157-160 [FREE Full text] [doi:
10.7326/M20-0912] [Medline: 32196071]
17. Geldsetzer P. Use of rapid online surveys to assess people's perceptions during infectious disease outbreaks: a cross-sectional
survey on COVID-19. J Med Internet Res 2020 Apr 02;22(4):e18790 [FREE Full text] [doi: 10.2196/18790] [Medline:
32240094]
18. Nelson LM, Simard JF, Oluyomi A, Nava V, Rosas LG, Bondy M, et al. US public concerns about the COVID-19 pandemic
from results of a survey given via social media. JAMA Intern Med 2020 Apr 07:1020-1022 [FREE Full text] [doi:
10.1001/jamainternmed.2020.1369] [Medline: 32259192]
19. Atchison CJ, Bowman L, Vrinten C, Redd R, Pristera P, Eaton JW, et al. Perceptions and behavioural responses of the
general public during the COVID-19 pandemic: a cross-sectional survey of UK Adults. medRxiv 2020 Apr 03:A. [doi:
10.1101/2020.04.01.20050039]
20. Varshney M, Parel JT, Raizada N, Sarin SK. Initial psychological impact of COVID-19 and its correlates in Indian
Community: an online (FEEL-COVID) survey. PLoS One 2020;15(5):e0233874 [FREE Full text] [doi:
10.1371/journal.pone.0233874] [Medline: 32470088]
21. Flaxman S, Mishra S, Gandy A, Unwin H, Coupland H, Mellan T, et al. Report 13: Estimating the number of infections
and the impact of non-pharmaceutical interventions on COVID-19 in 11 European countries. Imperial College London
2020 Mar 30:1-35 [FREE Full text] [doi: 10.25561/77731]
22. Instituto Nacional de Estadística. URL: https://www.ine.es/en/
23. Pollán M, Pérez-Gómez B, Pastor-Barriuso R, Oteo J, Hernán MA, Pérez-Olmeda M, et al. Prevalence of SARS-CoV-2 in
Spain (ENE-COVID): a nationwide, population-based seroepidemiological study. Lancet 2020 Aug;396(10250):535-544.
[doi: 10.1016/S0140-6736(20)31483-5]
24. Datos enero 2020. Cifras PyME. 2020. URL: http://www.ipyme.org/Publicaciones/CifrasPYME-enero2020.pdf
25. Goodman LA. Snowball Sampling. Ann Math Statist 1961 Mar;32(1):148-170. [doi: 10.1214/aoms/1177705148]
26. Survey123. URL: https://survey123.arcgis.com/
27. Covid19Impact Survey. 2020. URL: https://covid19impactsurvey.org
28. Portal d'Informacio Argos. URL: http://www.argos.gva.es/va/inicio/
29. Rao JNK, Scott AJ. On simple adjustments to chi-square tests with sample survey data. Ann Statist 1987 Mar;15(1):385-397.
[doi: 10.1214/aos/1176350273]
30. Agresti A. Categorical Data Analysis. Hoboken, New Jersey: John Wiley & Sons; Mar 31, 2003.
31. Lumley T, Scott A. Fitting regression models to survey data. Statist Sci 2017 May;32(2):265-278. [doi: 10.1214/16-sts605]
32. INEbase. URL: https://www.ine.es/jaxiT3/Tabla.htm?t=4128
33. Wu JT, Leung K, Bushman M, Kishore N, Niehus R, de Salazar PM, et al. Estimating clinical severity of COVID-19 from
the transmission dynamics in Wuhan, China. Nat Med 2020 Apr;26(4):506-510 [FREE Full text] [doi:
10.1038/s41591-020-0822-7] [Medline: 32284616]
34. Bayer C, Kuhn M. Intergenerational ties and case fatality rates: a cross-country analysis. SSRN J 2020 Apr 13:1-12.
http://www.jmir.org/2020/9/e21319/ J Med Internet Res 2020 | vol. 22 | iss. 9 | e21319 | p. 15
(page number not for citation purposes)
XSL• FO
RenderXJOURNAL OF MEDICAL INTERNET RESEARCH Oliver et al
35. Ausín B, González-Sanguino C, Castellanos Á, Muñoz M. Gender-related differences in the psychological impact of
confinement as a consequence of COVID-19 in Spain. J Gender Stud 2020 Aug 04:1-10. [doi:
10.1080/09589236.2020.1799768]
36. Krantz SG, Rao ASRS. Level of underreporting including underdiagnosis before the first peak of COVID-19 in various
countries: Preliminary retrospective results based on wavelets and deterministic modeling. Infect Control Hosp Epidemiol
2020 Apr 09:1-3 [FREE Full text] [doi: 10.1017/ice.2020.116] [Medline: 32268929]
37. Tremlett G. How did Spain get its coronavirus response so wrong? 2020 Mar 26. URL: https://www.theguardian.com/world/
2020/mar/26/spain-coronavirus-response-analysis
38. Escudero J, Méndez R. El quebradero de cabeza de las cifras oficiales del coronavirus en España. El Confidencial. 2020
Mar 19. URL: https://www.elconfidencial.com/espana/2020-03-19/
coronavirus-comunicacion-datos-ministerio-sanidad_2505867/
39. Pearce E. What is anosmia and is it a symptom of COVID-19? ESM1. 2020 Mar 27. URL: https://www.ems1.com/
coronavirus-covid-19/articles/what-is-anosmia-and-is-it-a-symptom-of-covid-19-Mcy5H9WmR7v6gUbk/
40. MoMo Nacional. URL: https://momo.isciii.es/public/momo/dashboard/momo_dashboard.html
41. Tenforde MW, Kim SS, Lindsell CJ, Billig Rose E, Shapiro NI, Files DC, IVY Network Investigators, CDC COVID-19
Response Team. Symptom duration and risk factors for delayed return to usual health among outpatients with COVID-19
in a multistate health care systems network - United States, March-June 2020. MMWR Morb Mortal Wkly Rep 2020 Jul
31;69(30):993-998. [doi: 10.15585/mmwr.mm6930e1] [Medline: 32730238]
42. Orden SND/307/2020, 30 de marzo, por la que se establecen los criterios interpretativos para la aplicación del Real
Decreto-ley 10/2020, de 29 de marzo, y el modelo de declaración responsable para facilitar los trayectos necesarios entre
el lugar de residencia y de trabajo. BOE. 2020 Mar 30. URL: https://www.boe.es/buscar/pdf/2020/
BOE-A-2020-4196-consolidado.pdf
43. Anuario de la hostelería. Hosfrinor.com. 2019. URL: https://hosfrinor.com/wp-content/uploads/2019/12/
Anuario-de-la-Hosteleri%CC%81a-de-Espan%CC%83a-2019.pdf
44. Evolución anual del peso de la industria de la construcción en el PIB de España desde 2005 hasta 2018. Statista. URL:
https://es.statista.com/estadisticas/549605/aportacion-del-sector-de-la-construccion-al-pib-en-espana/
Abbreviations
GDP: gross domestic product
INE: National Institute of Statistics
Q: question
Edited by A Moorhead, G Eysenbach; submitted 11.06.20; peer-reviewed by C García, A Sudaryanto, P Valente; comments to author
11.08.20; revised version received 31.08.20; accepted 01.09.20; published 10.09.20
Please cite as:
Oliver N, Barber X, Roomp K, Roomp K
Assessing the Impact of the COVID-19 Pandemic in Spain: Large-Scale, Online, Self-Reported Population Survey
J Med Internet Res 2020;22(9):e21319
URL: http://www.jmir.org/2020/9/e21319/
doi: 10.2196/21319
PMID:
©Nuria Oliver, Xavier Barber, Kirsten Roomp, Kristof Roomp. Originally published in the Journal of Medical Internet Research
(http://www.jmir.org), 10.09.2020. This is an open-access article distributed under the terms of the Creative Commons Attribution
License (https://creativecommons.org/licenses/by/4.0/), which permits unrestricted use, distribution, and reproduction in any
medium, provided the original work, first published in the Journal of Medical Internet Research, is properly cited. The complete
bibliographic information, a link to the original publication on http://www.jmir.org/, as well as this copyright and license information
must be included.
http://www.jmir.org/2020/9/e21319/ J Med Internet Res 2020 | vol. 22 | iss. 9 | e21319 | p. 16
(page number not for citation purposes)
XSL• FO
RenderXYou can also read