WHAT IS HAPPENING? Child and Family Poverty on Prince Edward Island - Campaign 2000
←
→
Page content transcription
If your browser does not render page correctly, please read the page content below
WHAT IS HAPPENING?
Child and Family Poverty on Prince Edward Island

  Seventh Annual Report on Child and Family Poverty on Prince Edward Island – 2020,
 MacKillop Centre for Social Justice and PEI Coalition for a Poverty Eradication Strategy
                                   December 9, 2020

                                            1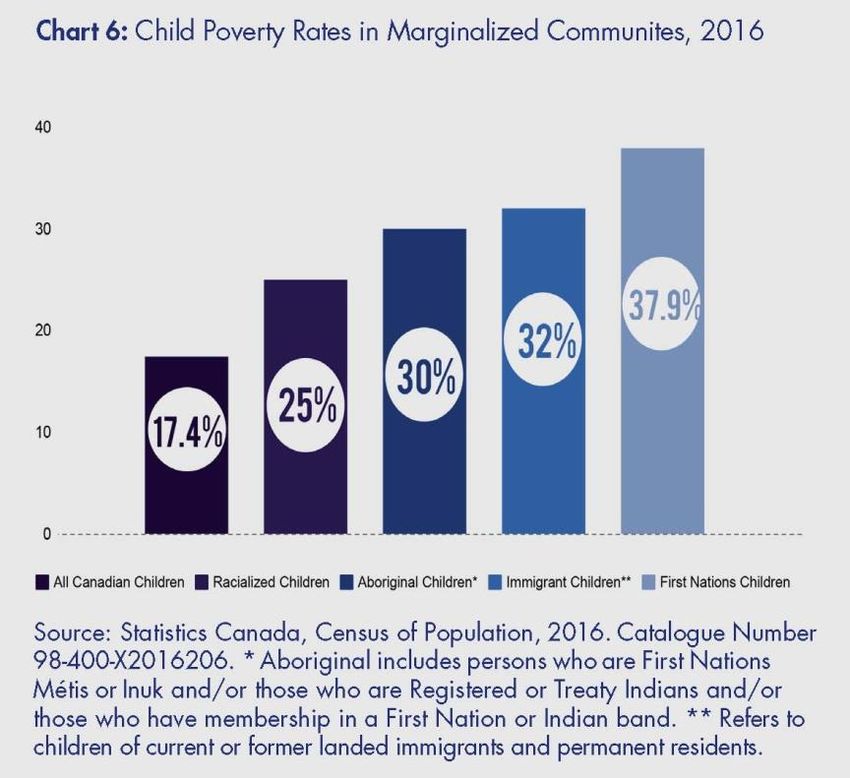
WHAT IS HAPPENING? WHERE ARE WE GOING?

Prince Edward Island 7th Annual Child Poverty Report Card, December 9, 2020

Introduction

In preparing and writing the Child Poverty Report Card one becomes aware of the huge amount of work
that still has to be done in this country to eradicate child poverty, meet our Sustainable Development
Goals and work in solidarity with poorer countries of the world to eradicate poverty by 2030. It does not
have to be so challenging. A country with Canada’s resources has the means to eradicate poverty and
establish a country where injustice gives way to Justice. There are no instant solutions but changing the
spending priorities of government and establishing a system of fair taxes in addition to creating decent
jobs with decent pay can go a very long way to transforming the current situation.

The Prince Edward Island Situation

Over the past few years, we saw a slight trend toward reductions in child poverty on PEI. Progress was
slow but the direction was positive. In this report card, we found that the direction reversed and that we
are witnessing a small trend toward increased poverty. In 2017, the percentage of children ages 0 to 17
on PEI was on a par with the Canadian rate of 18.6 %. This year, the latest available Statistics Canada
figures place the poverty rate at 19.4%, a 0.8% increase. This is the case three other provinces and in
Nunavut. The Canadian rate is 18.2% or 1.2% below the PEI rate. Why the increase? Why is the trend
reversing? The number of Island children ages 1 to 17 below the poverty line is 5,580, an increase of 260
over the previous year. Could it be the high cost of housing, food and childcare? Could it be a high
unemployment rate, seasonal work and part-time work paying low wages, the changes to Employment
Insurance or a combination of all of those problems? It is clear that the current wage level does not
constitute a Living Wage.

For the most part, the rate of unemployment is high, a serious problem because it causes much damage
to people and the society. People are affected negatively because unemployment creates higher
physical and mental costs, making them sicker and weaker. Unemployment places pressures on people,
that can lead to other serious effects including depression, alcoholism, and in some cases suicide.
Children and families are deeply affected and all of this stress creates additional costs to healthcare and
society. As Dr. Pavlina Tcherneva states, “If we added the costs we would not tolerate
unemployment.”i We tend to underestimate these costs. Unemployed people find it harder to be re-
employed later. According to Tcherneva, there is no natural rate of unemployment just as there is not
natural rate of homelessness. This is why it is very important to secure a living wage floor. A strong
social safety net would mean that the employer would not be responsible for the whole amount.

The current unemployment rate for PEI is 10.2%, the third highest in Canada. However, there is another
stark figure connected to work and that is the huge percentage of working poor, due in part to the
prevalence in PEI of low wage, seasonal and part-time work. The incidence of working poor is indicated
in this report by the percent of children in families with adjusted income below the Low Income
Measure (LIM). In 2018, this was 39.1% for children under 6 years old and 34.7% for children under 18.

                                                     2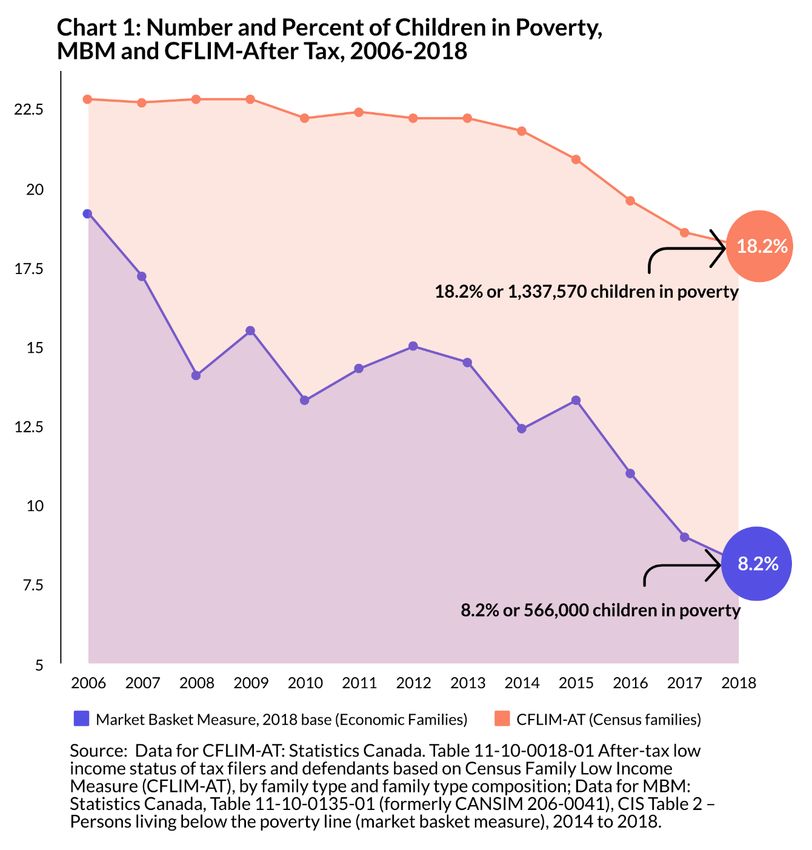
However, when After-tax income without government transfers is considered, child poverty rates
increase to 44.5% and 39.2% respectively.

Government transfers play a critical role in reducing child poverty in PEI. In 2018, transfers helped to
lower the After-tax child poverty rate to 19.4% for all children and to 21.3% for those under 6. Most
significant in this regard was the impact of the Canada Child Benefit. In total, government transfers
succeeded in lifting 5,710 children out of poverty.

As we follow this scenario on PEI, we find the Job Guarantee (JG) to be a very important program for
overcoming poverty and boosting the economy. By a JG we mean, a public option for work in decent
jobs with decent pay, including childcare, paid leave and a bottom up social safety net of 20% built in.
The JG would be federally- funded and administered locally. It is a Jobs Bank of public service jobs, which
are distinct from the Professional Public Service. It organizes human potential and power to fill the many
gaps that exist in communities and the greater society. The JG aims directly at the unemployed. It is not
compulsory or forced work. It is freely chosen and the jobs are permanent. It is seen as the final piece
of the social safety net.

The Latest Poverty Rates

    •   Children under 18 years, 19.4%, an increase of 0.8% over last year
    •   People age 18 to 64 years, 16.3%, an increase of 0.6% over last year.
    •   People over the age of 65, 16.4%, an increase of 0.7%, over last year.
    •   All ages, 16.9% an increase of 0.6% over last year.

The data compiled in this report card comes from Tax Filer data from Statistics Canada’s T1 Family File
TIFF)-2018 on low-income children under the age of 18. It uses the CFLIM-AT Census Family After-Tax
Low-Income Measure. It compares income of a census family to the rest of the population and
determines poverty thresholds set at 50% of the median Canadian standard of living.

COVID-19

The Labour Force Summary reports released on December 4, 2020 indicate that the seasonally
adjusted unemployment rate for PEI stands at 10.2%, the third highest rate in the country. The
province recovered 96% of its pre-COVID level of employment but remains below the Canadian rate
and has the third lowest recovery rate in the country. Males between the ages of 25 – 54 have a fairly
constant and positive trajectory and exceed the recovery rate by 2.1%, although progress is uneven
and males over the age of 55 exceed the rate by 4.9%. Females 25 – 54 are close to pre-COVID
recovery rates as are both sexes over 15 years.

Women over 55 years have the lowest recovery rate at minus 9.4%, followed by youth. Males
between 15 and 24 are faring better than females of the same age but both sexes are below the
COVID recovery rate.

The hardest hit industries are Trade (retail, wholesale), Accommodation and Food Services, and other
services under the services providing sector. Agriculture was also hard hit but Manufacturing, Goods
Producing, Other Primary Industries, and Business Services had strong performances.ii

                                                     3
As we mentioned in the 2019 Child Poverty Report Card, there is a great need to create decent jobs with
decent pay as a means to strengthen and improve the economy. To that end, we recommended the Job
Guarantee (JG) an idea that is gaining ground around the world. For some reason, politicians of the day
lack the political will to improve the job situation by creating socially useful jobs, which people can freely
choose as a way to overcome poverty for themselves and their children.

“It [JG] remains the only program that secures that essential, most basic
economic right for all – the right to a decent, useful, and remunerative
employment opportunity – at all times good or bad.”iii Dr. Pavlina Tcherneva
Research on a Living Wage for Charlottetown completed November 2, 2020 by Dr. Christine Saulnier of
the Nova Scotia Office of the Canadian Centre for Policy Alternatives (CCPS-NS) showed that a Living
Wage for Charlottetown is $19.30.

 Table 1. Number and Percent of Low Income Persons by Age
 Prince Edward Island, 2000-2018

         All Ages                 0 to 17 years           18 to 64 years         65 years and over
 Year    Number      Percent     Number Percent           Number Percent        Number Percent
 2000    20,680      15.2        6,820       19.7         11,950     14.2       1,920     10.7
 2001    20,000      14.6        6,680       19.7         11,140     13.2       2,190     12
 2002    20,350      14.9        6,820       20.4         11,120     13.2       2,410     13.1
 2003    20,390      14.9        6,720       20.4         11,380     13.3       2,290     12.2
 2004    20,950      15.3        6,870       21.2         11,720     13.6       2,360     12.5
 2005    21,490      15.8        6,570       21.2         12,190     14.2       2,740     14.2
 2006    21,030      15.5        6,310       20.6         11,980     14         2,730     13.9
 2007    21,730      15.9        6,230       20.5         12,300     14.3       3,210     15.9
 2008    22,680      16.6        6,590       22           12,820     14.9       3,270     15.9
 2009    21,630      15.7        6,200       20.9         12,380     14.2       3,050     14.4
 2010    21,820      15.7        5,910       20.2         12,620     14.4       3,300     15.1
 2011    22,280      16          5,970       20.6         13,030     14.8       3,290     14.5
 2012    22,640      16.3        6,240       21.9         13,010     15         3,390     14.3
 2013    23,050      16.6        6,250       22.3         13,210     15.3       3,590     14.5
 2014    23,750      17          6,300       22.6         13,610     15.8       3,840     15
 2015    23,790      16.9        6,250       22.3         13,640     15.8       3,910     14.7
 2016    23,280      16.2        5,750       20.3         13,560     15.5       3,970     14.4
 2017    23,710      16.3        5,320       18.6         13,910     15.7       4,480     15.7
 2018    25,100      16.9        5,580       19.4         14,700     16.3       4,820     16.4

Compared to the previous year there is a slight increase in poverty in the three main age categories:

                                                      4
Although an overall decline of 0.6% does not seem like a lot, it is concerning that, the long, slow climb
in the eradication of poverty is headed in the wrong direction.
Inequality remains a huge problem on PEI. The highest 10% of earners were the only category that
gained. They received 25% of all wealth in 2018 while the bottom 10% had 2.5% of the wealth. This is
a huge gap and while the bottom 10% are doing poorly; the top 10% are doing very well.
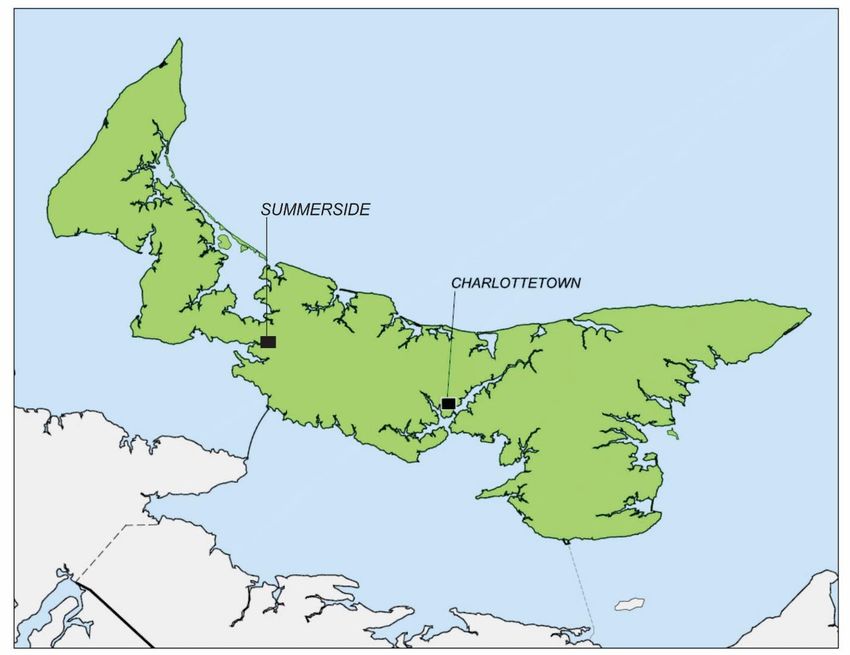
The overall poverty rate for Charlottetown is 20.1%, up from 18.8% in 2017.
Summerside’s rate is 21.6%, compared to 20.7% in 2017. Again, the trend is going in the wrong
direction.
Table 2 Percent of Children in Low Income
A Living Wage
What is included in the living wage household budget? For working age people, a living wage would
relieve the pressure of trying to make ends meet while at the same time falling behind.
Paying a Living Wage is a voluntary commitment that employers can make to increase the
wages of their employees.
The following Table 3 contains an itemized list used to calculate a Living Wage for Charlottetown.
Table 3 Average Costs
5Item Monthly Annually % of Total
Food $1,076.48 $12,917.77 19.1%
Clothing and Footwear $185.40 $2,224.83 3.3%
Shelter $1,398.06 $16,776.78 24.8%
Transportation $450.19 $5,402.30 8.0%
Child Care $1,005.45 $12,065.38 17.8%
Health Care $176.33 $2,115.96 3.1%
Contingency/Emergency $225.17 $2,702.00 4.0%
Parent Education $104.17 $1,250.00 1.8%
Household Expenses $610.63 $7,327.51 10.8%
Social Inclusion $407.08 $4,885.01 7.2%
Total $5,638.96 $67,667.53 100.0%
“A Living Wage is calculated at a level to ensure that workers do not struggle to pay for all their
household necessities including rent, heat, food, and essentials for families with children such as child
care.”iv (Christine Saulnier, Executive Director, N.S. CCPA.)
For Prince Edward Island, the three highest cost items in household budgets are shelter, food and child
care. These items are surprisingly expensive. Household expenses are high as well.
On November 2, the Canadian Centre for Policy Alternatives, Nova Scotia, along with the MacKillop
Centre for Social Justice and the PEI Coalition for a Poverty Eradication Strategy, released a report on a
Living Wage in Charlottetown. The study noted that a couple with two children, both parents working
full time, for a 35 hour work week, would need to earn $19.30 per hour to provide a small cushion
above the poverty line. The study noted that there are many gaps in public services and the thresholds
for tax credits. Income transfers and subsidy programs are too low, phase-out too quickly and have too
many strings and too much stigma attached. The more generous government income supports and
government services are the less pressure on employers.
The findings reveal just how inadequate the current minimum wage is, even for a family with both
parents working. The cost of food and shelter, the two largest expenses keeps increasing as wages fail to
keep pace. The minimum wage will rise on April 30/21, from $12.85 to $13.00 but this is only a 15 cent
an hour increase, and not nearly enough. The 2020 wage falls far short of what a family needs in order
to raise itself from poverty and have a small 2 weeks cushion in case of unforeseen emergencies. Given
the upcoming 15 cents hourly increase, a $6.45 hourly wage increase would be required to meet this
6goal. As indicated, not all of the money would have to come from the employer. A strengthened social
safety net would be a huge help.
Dr. Saulnier explains that, “The living wage is calculated to show exactly how much a household
would have to earn to cover all basic necessities and enjoy a minimum, decent life. It is
calculated to avoid severe financial stress, support the healthy development of the children, and
enable workers to participate in the social, civic and cultural lives of their communities. Actual
expenses are used to calculate the wage in order to reflect the rate of pay needed to meet their
basic needs. The wage is based on the actual costs, available government supports and services,
and norms of a specific community.”v
We recommend that the minimum wage for PEI be increased immediately to $15.00 an hour
and upgraded periodically until it amounts to a Living Wage and that it is indexed to inflation.
(See Appendix A for further recommendations.)
Housing
A vacancy rate in Charlottetown of 0.2% in 2018 brought the realization that housing is at a crisis point
especially for low- income families. The Living Wage report revealed that housing is the highest item in
peoples’ budgets at 25% or $16,776.78 annually. The vacancy rate improved to 1.2% by February 2020
but as the Living Wage findings of November 2020 pointed out, the current rates are too high and there
is not enough social housing. The current vacancy rate is still well below the healthy rate of 3 to 5%. At
current rates, the hourly rental wage for 2020 would have to be $17.37 an hour. A worker needs to earn
this amount to cover the cost of a 2-bedroom apartment. The high cost of rentals on PEI, are the prime
reason for high Island family costs.
Almost 70% of renters on PEI have less than a month of savings. This is the highest rate in Canada.
According to the Annual report of the Island Regulatory and Appeals Commission (IRAC), orders for
evictions in 2017 amounted to more than 87 fiscal terminations. In 2018/19, there were 128
terminations and in 2019/20, there were 123. There are various reasons for these evictions including the
high cost of rent and housing, and number of evictions by property owners who renovate their homes
for short-term rentals. The provincial government placed a moratorium on evictions but lifted it in June
2020.
The appeals office adjudicates disputes between tenants and property owners, establishes the rights
and responsibilities of tenants and property owners, and defines procedures to deal with violations and
the enforcement of obligations related to rental. In 2020, the Office issued a record 551 orders, a 54%
increase over the previous year. Of these, 90 were withdrawn and 76 were resolved between the
parties. Of the rest, 180 were terminations, 55 were due to rent increases.
Comparisons over the last 3 years
In 2017/18 the rentals office dealt with 323 allegations, violations and investigations of the rental Act
and its regulations. There were 29 over security deposits, 87 over termination, 201 over breach of
statuary conditions and 6 over rent increases.
7The number rose to 391 in 2018/19. Of these, 49 were over security deposits, 123 were over
termination, 201 were over breach of statuary conditions and 21 were over rent increases.
In 2019/20, the number rose to 531, of which 82 were over security deposits, 123 were terminations,
280 were breach of statutory conditions and 46 were on rent increases. vi
We recommend that the PEI government re-instate the moratorium on rent evictions
We recommend that the federal government double the federal contribution to the Canada Housing
Benefit and continue its expansion such that it becomes a universal benefit rather than rationed.
We further recommend that the federal government allocate $2 billion annually for new public
supportive housing for vulnerable populations in the country. (For further recommendations, see Appendix A)
CHILD CARE
Although childcare is the third most expensive household item, PEI has one of the strongest childcare
systems in the country. By its nature, childcare is a government responsibility, paid by the federal
government through our taxes and other additional federal government revenues. The federal
government’s Fall Economic Statement issued on November 30, 2020 stated that the government is
providing $20 million over the next 5 years to set up a Federal Secretariat on Early Learning with the aim
of establishing a Canada-wide system of Early Learning. The plan is welcome news but 5 years is a long
time to develop policy. The needs are great especially for struggling families. vii
The high cost of childcare takes up a huge amount of Island household budgets in spite of current
government investments. Thanks to high housing costs, Living Wage costs in Charlottetown were as high
as those in St John, New Brunswick although childcare was much less expensive (see table 4). This
information should urge governments to create decent jobs at decent pay and benefits including
childcare as a way to enable parents to work. Even with two parents working, many are struggling
because their income is insufficient at the current wage rate.
We recommend that the federal government:
o immediately set up the Federal Child Care Secretariat announced in the 2020 Economic
Update and mandate it to:
o Work with the Indigenous Early Learning and Child Care Secretariat;
o Consult with the Minister of Families, Children and Social Development’s Expert panel
on early learning and child care, child care advocates, policy experts and civil society
organizations including anti-poverty organizations and equality rights organizations;
o develop a detailed multi-year plan to build a pan-Canadian system of early learning and
child care in partnership with the provinces, territories and First Nations, Inuit and Metis
Nation governing bodies. (For further recommendations see Appendix A)
8Number and Percent of Low Income Children 0-17 by Family Type
Prince Edward Island, 2000-2018
Table 4 Number and percent of Low Income Children 0-17 by Family type
Table 4
Year # % # % # % # % # %
2000 6,820 19.7 6,400 18.7 2,700 10.1 3,700 50.5 420 97.9
2001 6,680 19.7 6,500 19.3 2,400 9.3 4,100 53.4 180 99.4
2002 6,820 20.4 6,640 20 2,540 9.9 4,100 54.2 180 99.5
2003 6,720 20.4 6,550 20 2,410 9.7 4,140 52.7 170 98.8
2004 6,870 21.2 6,720 20.9 2,470 10.2 4,260 53.9 150 99.3
2005 6,570 21.2 6,350 20.6 2,250 9.6 4,090 54.9 220 99.6
2006 6,310 20.6 6,090 20 2,310 9.9 3,780 52 220 99.6
2007 6,230 20.5 5,990 19.9 2,240 9.7 3,750 52.8 230 99.6
2008 6,590 22 6,370 21.4 2,400 10.6 3,960 55.6 220 99.6
2009 6,200 20.9 6,000 20.4 2,230 9.9 3,770 54 200 100
2010 5,910 20.2 5,720 19.7 2,210 10 3,510 50.4 190 99.5
2011 5,970 20.6 5,760 20 2,180 10 3,580 52.3 210 100
2012 6,240 21.9 6,030 21.3 2,360 11 3,660 54.4 220 99.5
2013 6,250 22.3 6,070 21.8 2,440 11.5 3,640 53.8 170 100
2014 6,300 22.6 6,110 22 2,430 11.6 3,680 55.2 190 100
2015 6,250 22.3 6,060 21.8 2,420 11.5 3,640 53.4 190 99.5
2016 5,750 20.3 5,540 19.7 2,270 10.6 3,270 48.7 220 99.5
2017 5,320 18.6 5,110 18 1,970 9.1 3,140 46.5 210 100
2018 5,580 19.4 5,340 18.7 2,270 10.4 3,070 45.1 240 100
There are 240 persons on PEI not in census families. This is the highest number since 2000. These are
young people on their own, not living in families. There are 3,070 lone parent families living below the
poverty line, the fewest in the last 20 years. Their poverty rate is at the lowest percentage in the last
20 years at 45.1% for a decrease of 1.4% over last year. By contrast, the overall number of families in
poverty increased by almost 1% from 5,320 in 2017 to 5,580 in 2018. This is the second lowest number
in the last 20 years. The number of low income couples with children increased by 300 from 1,970 in
2017 to 2,270, a rate of 10.4%, up by 1.3% over 2017. The number of children not in census families
increased by 30 from 210 in 2017 to 240, up by 0.7% in 2018. The highest since 2000.
Again, these small increases are in the wrong direction. The slight movement backwards is a concern.
9Table 5. This use of the above historical data begs the question, where are we today? What needs to be
done and what effect will the CERB payments have on the alleviation of poverty?
Lone parents are by far the largest number of families in poverty on PEI at 45.1%. Although their
numbers shrank between 2000 and 2018, this year’s percentage of those in poverty – 10.4%, is higher by
1.3% and is only exceeded by 2008 with 10.6%, 2012 to 2015 all over 11% and 2016 at 10.6%.
The number of lone parent families in poverty has been shrinking gradually.
Persons not in census families numbered 420 in 2000 and shrank annually since then until 2018 when
the numbers rose to 240, the second highest since 2000.
10The number of low-income families with children is at its second lowest since 2000, at 3,490, or 14.7%,
slightly higher than 2017. The number of low-income couples with children is 1,340 or 7.8%. The
number of lone parent families is at the lowest since 2000 at 2,160 or 32.4%.
Table 7.
Depth of Poverty
It is not acceptable to tolerate the thresholds in the gap below. They unveil the large gap between
income and the poverty threshold on PEI. Single mothers with one child are deprived of huge amounts
of needed money and this is barely noticed or mentioned. It is very serious that a family has an annual
deficit of over $9,000. Seeing this and seeing nothing done about it is even more serious. It begs us to
find and immediately enact the most effective policies to correct this injustice.
11Table 8. Depth of Low Income for Poor Families in Prince Edward Island, 2018
None of the above PEI family categories experienced a poverty gap below $9,000 in 2018. Couples with
one child, had the highest poverty rate in 2018 with a poverty line of $37,816 and a poverty gap of
$12,456 compared to $11,768 in the previous year. Why this family can slip backwards by $688.00 is a
clear signal that we need to change our approach.
Lone parents with one child, with a poverty line of $30,877, saw their poverty gap increase by
$358.00, with an income gap of $9,097 compared to $8,739 the previous year.
The poverty line for lone parents with two children is $37,816. These families slipped by $248.00 as
their poverty gap increased from $9,228 the previous year to $9,746 in 2018.
The only family category that reduced its gap was the couple with two children. These families gained
$1,832 as their poverty gap shrank from $12,528 in 2017 to $10,696 in 2018. This small reduction in the
poverty gap is no doubt mainly due to the Canada Child Benefit.
The size of the poverty gap is extremely problematic. How can a family, no matter what size, endure
such a huge gap between their income and the rate they receive on social assistance?
Which necessities do they have to cut and which nutritional needs are the children missing at crucial
times in their lives? How many of the ordinary things that average Islanders enjoy are unaffordable for
these families? How many miserable days do they have because they cannot afford to heat their homes
or there are leaks and drafts in their roofs, windows and doors? In addition, what kind of cultural and
recreation events are they unable to participate in and how does this affect their overall health? The list
goes on.
12Families with Children
Table 9. After Tax Median Income and
Poverty Gap, 2018
CANADA PRINCE EDWARD ISLAND
median income 19,230 21,780
lone parent With 1 child poverty gap 11,647 9,097
median income 27,090 25,360
couple With 1 child poverty gap 10,726 12,456
median income 25,090 28,340
lone parent With 2 children poverty gap 12,726 9,476
median income 32,990 32,970
couple With 2 children poverty gap 10,676 10,696
There is very little overall difference between median income on PEI and the National average. The rate
varies according to family category but in both cases, the gaps are too large. It is clear that while the
poverty rate for PEI children is above the Canadian average, it is below the average of the other Atlantic
Provinces – Newfoundland and Labrador at 20.8%, New Brunswick at 21.8% and Nova Scotia at 24.6%.
13Social Assistance
Households that qualify for social assistance payments on PEI also qualify for other financial support,
including:
Recurring additional social assistance payments (e.g. an annual back-to-school allowance);
Federal child benefits (for household with children);
GST/HST Credits;
Provincial Tax credits benefits.
Table 10
Single Single Single
Couple,
person person parent,
two
considered with a one
children
employable disability child
Basic social
$10,848 $12,648 $14,700 $22,464
assistance
Additional SA
$350
benefits
Federal child
$6,568 $11,083
benefits
Provincial child
benefits
GST/HST credit $287 $300 $725 $876
Provincial tax
$110 $110 $165 $165
credits/benefits
Total 2019 income $11,245 $13,058 $22,158 $34,938
Total annual welfare incomes in 2019 ranged from $11,245 for the single person
considered employable to $34,938 for the couple with two children.
Three of the example households received benefits through the Social Assistance
program; the single person with a disability received benefits through Accessibility
Supports, which replaced the Disability Supports Program in 2018.viii
14Provincial tax credits or benefits.
These together form social assistance payments that form a household’s total income. Households with
income from other sources may receive less and people with health disabilities may receive more.
Additional benefits include $350 extra for a couple with two children, $6,568 for one child and $11,083
for two children. The GST/HST credit amounts to $287 for a single person, $300 for a single person with
a disability, $725 for a single parent with one child and $876 for a couple with 2 children. In addition,
there are provincial tax credits/benefits. A single person gets a benefit of $110, a single person with a
disability gets $110, A single parent with one child gets $165 and a couple with 2 children gets $165.
The total annual incomes are, a single person, $11,245 a single person with a disability $13,058 a single
parent with one child $22,158 and a couple with two children $34,938.
If we compare those figures with the poverty line, the gap is huge. Put another way, Social Assistance
payments for a single person considered employable amount to 46% of the LIM. Single persons with a
disability receive 53% of the LIM. A single person with one child receives 64% of the LIM and a couple
with two children receives 71% of the LIM. ix
Percentages and poverty lines for the Market Basket Measure (MBM) are much lower as the MBM is not
capturing the entire scope. The Low Income Measure (LIM) is a much larger measure. The difference is
important as the MBM underestimates the extent of poverty.
The Province of PEI is the only province in Canada that does not have a child benefit. Having such a
benefit would help to enhance food security in the PEI.
15We recommend that the province establish a child benefit for PEI that is on a
par with the more generous provincial child benefits in Canada.
Table 11
16We recommend that the Low Income Measure (LIM) continue to be the official measure of poverty in
Canada as it is larger and wider in scope than the Market Basket Measure (MBM).
For Island children under six years poverty remains extremely high at 21.3%, more than one in 5. There
are 1,880 families with adjusted after tax incomes below the Low Income Measure (LIM) After Tax
threshold. This rate is 2.1% higher than the national rate of 19.2%.
Without government transfers children under six would face a 44.5% poverty rate and all children under
18 would have a 39.2% rate. This is due to their low working earnings. Without the Canada Child
Benefit, (CCB), the rate would be 34.5% for children under 6 and 31.5 for those under 18.
There are 10,000 children on PEI below the age of 18 (34.7%) in families with Adjusted Market Income
below the LIM-AT threshold. The Canadian average is 30.8%.
On PEI, 39.2% of children (11,290) in families with adjusted Income below the After-tax LIM are below
the poverty line if government transfers are subtracted. For children under 6 years the numbers are
even more dramatic as the percentage is 44.5%
There are 9,080 children below 18 or 31.5% with an adjusted AT family income minus the Canada Child
Benefit (CCB). The Canadian average is 27.4%. Overall PEI does better than the other Atlantic Provinces
and Nova Scotia has the worst rate.
Table 12
17There are 3,050 children below 6 or 34.5% in families with the adjusted After Tax (AT) family income
minus the Canada Child Benefit (CCB), below the LIM-AT threshold. The Canadian average is 28.8. There
are 3,450 or 39.1% of Island children below 6 with market income below the LIM After Tax threshold,
compared to a Canadian rate of 33%. This is the second lowest rate in the region, although the numbers
are quite close.
The figures indicate that the CCB is doing what it is supposed to do – reduce poverty but it is insufficient
on its own. It has not improved the poverty situation as much in its second year as it did in the first year.
Without the CCB, the rate for children under 18 would be 34.5%, a difference of 10%. Therefore, the
CCB is a very important vehicle in the struggle against child poverty but it needs to be increased for the
health and wellbeing of Island children.
At first glance, we tend not to notice the significance of Market Income, defined as the sum of earnings
(from employment and net-employment), net investment income, private retirement income, and the
items under other income. It is also called income before taxes and transfers. …After-Tax income is total
income less income tax. Market income - for low-income families is mostly the sum of income earned
from work.
We recommend that the PEI government take immediate steps in cooperation with the federal
government to establish a Job Guarantee (JG) for PEI in order to provide decent jobs with decent pay
and benefits. This method is catching on around the world to the benefit of workers, their families
and their societies. (For further recommendations, see Appendix A)
The situation of Marginalized Groups has not changed much for PEI or for Canada over the last few
years.
Table 13
18The above is a Canada-wide graph illustrating that the largest percentage of low-income children in
Canada are First Nations Children at 37.9%. Although the statistics are from 2016, things have not
changed much. Immigrant children are the second largest percentage at 32%, followed by Aboriginal
Children at 30%, racialized children at 25% and All Canadian Children at 17.4%. A breakdown for PEI is
not available.
Food Bank Use
As of the end of October 2020, demand for help from PEI Food Banks increased by 9% thus far this year.
This can be an indication of the impact of the COVID-19 on low-income people, and the situation of the
Island economy. The number of people asking the food bank for help at Christmas has also increased
over last year, according to Mike MacDonald, Executive Director of the PEI Food Banks.x
CONCLUSION
As noted in the introduction, there is still a huge amount of work to be done to achieve the goal of
poverty eradication. Governments at the federal and provincial levels could do much more to speed up
progress. It is amazing to see that things have gone in reverse even though the Canada Child Benefit
(CCB) was a welcome intervention. We are slipping behind the progress made in the last few years and
slipping behind the national average. This year we took special note of the high rate of poverty among
the working poor. Over the years, there has been far too much tolerance of this province’s high
unemployment rate and not enough time spent studying its consequences for people and Island society
in general. Society is paying a huge moral and financial cost for unemployment. The high rate will not go
away without a concerted effort. A high unemployment rate is often a way to keep wages low and this is
partly the reason why we have such a high percentage of working poor. Our economic recovery rate
from COVID is the third slowest in the country and women are recovering at a much slower rate than
men, especially women over the age of 55 years, and youth.
We have recommended a Living Wage as part of a solution to poverty and a means to enable people
who work a full 35-hour week to earn enough to place them above the poverty threshold. We calculated
that for Charlottetown, the rate would be $19.30 per hour and we pointed out that the employer does
not have to bear the full cost. A strong social safety net would pick up some of the cost. A living wage
would also raise the level of social assistance as it is becoming clearer that the huge gaps that exist
between social assistance income and the cost of living are intolerable. They make people sick, waste
human potential and talent and increase the cost of healthcare and other public services.
The Living Wage fits well with our proposal for a Job Guarantee. We see the JG as as outlined by Dr.
Pavlina Tcherneva as an excellent way to eradicate poverty. Economist James Galbraith stated that,
“The Job Guarantee is the next big, common-sense idea for economic reform”xi and Noam Chomsky
states that, “it points the way to a more civilized, indeed, survivable social order.”xii In this report card,
we have put forward workable alternatives. It is unbelievable to think that a1989 House of Commons, all
party resolution to wipe out poverty by the year 2000 has hardly made a dent in all those years despite
the fact that each year new and workable solutions are offered. The JG is catching on around the world
and has an excellent record of achievement.
19ACKNOWLEDGEMENTS
A special thanks to all who contributed to the content of this report card. The Campaign 2000 steering
committee and staff have been enormously helpful. Special thanks to Alan Meisner for his exceptional
work on statistics and graphs. Special thanks as well to Christine Saulnier for her work on establishing a
Living Wage for Charlottetown, to the local panel who assisted her – Bill Campbell, Dawn MacLeod,
Alyse Rossiter, Dr. Jennifer Taylor, Roxanne Carter Thompson, and to the members of the MacKillop
Centre for Social Justice and the PEI Coalition for a Poverty Eradication Strategy. Thanks as well to
Catherine Mullally and Patricia Power for their editing advice and to Bill Kays for technical assistance.
Thanks to Jennifer Burgess at the Department of Social Development and Housing, Government of PEI,
and many others.
APPENDIX A RECOMMENDATIONS
First, we agree with the recommendation made in the 2020 Campaign 2000 Report Card.
Further, we recommend the following to the Prince Edward Island government
• That the PEI and federal governments view the existence of poverty in this country as a
violation of peoples’ human rights and become more strategic in fulfilling the Sustainable
Development Goals. Poverty can be eliminated but we need decent jobs with decent pay and
benefits.
• That the PEI and federal governments establish a Job Guarantee Strategy based on public
work in public service in communities led by the federal government and administered locally
to provide decent jobs with decent pay for anyone who wishes to work.
• That the PEI and federal governments step up their efforts to provide new, adequate,
affordable, energy efficient social housing units and that the public sector lead the way in
order to assure affordability.
• That PEI and the federal governments throw their support behind the establishment of a
Universal National Pharmacare Plan based on the same principles as the Canada Health Act,
and based on the recommendations of the Hoskins Report and that the plan is set in motion in
2021. There is no time to linger on this recommendation.
• That the PEI government continue to make investments in delivery of programs that assure
affordable, nutritious food to children in the schools and in communities.
We ask the federal government to:
• Strengthen its Poverty Reduction Strategy (PRS) through strategic investments to meet more
ambitions poverty reduction targets and to be able to measure progress. This would require
the allocation of $6 billion dollars in the 2021 budget with the goal of reducing poverty by 50%
between 2015 and 2025, based on the Census Family Low Income Measure After Tax (CFLIM)
using T1 Family File data. The Poverty Reduction Act should recognize the right to an adequate
standard of living and contain mechanisms to realize these rights.
20• That the federal government increase the Canada Child Benefit (CCB) allocations in Budget
2021 to enable all families below the CFLIM-AT level to access CCB pandemic top-up amounts.
Moreover, in combination with a Dignity Dividend of $1,800 per low income person and child,
achieve an interim target of 50% reduction in child poverty by 2025, as measured by the
CFLIM-AT calculated using tax filer data.
• Further to eliminating 50% of poverty by 2025, the federal government must eliminate
barriers to accessing the CCB Benefit for families living at higher rates of poverty, i.e. First
Nations families living on reserve, children whose parents have irregular immigration status,
Black and racialized families, children with disabilities, and women experiencing domestic
violence.
• Ensure that preventing food insecurity among families is a built-in goal of the Canada Child
Benefit and ensure it is reported on as part of Canada’s Poverty Reduction Strategy.
• Convert the Disability Tax Credit to a refundable tax credit and extend compensation to the
lowest income people with disabilities.
• Increase funding to the Canada Social Transfer (CST) by $4 billion and remove arbitrary growth
restrictions as first steps towards ensuring that social and disability assistance programs bring
incomes up to the CFLIM-AT. Provide sufficient, stable and predictable funding that recognizes
regional economic variations. Design the program to ensure that federal, provincial and
territorial governments are accountable for meeting their human rights obligations to provide
adequate income support and require the development of minimum standards for income
benefits and social services funded through the CST. This must include the development of
minimum standards such as binding conditions stipulating income supplements including the
CCB, Child Disability Benefit, child support payments and child related Employment Insurance
benefits are not deducted.
• Make a binding condition on the CST that pandemic emergency benefits, be they the CERB,
the new Canada Recovery Benefit (CRB) or any other, are not clawed back from social
assistance benefits, nor negatively impact any other income benefit, including special
allowances for diet, medications, rent subsidies and others. N.B. It should be noted that the
PEI government claws back the CERB although this is a federal grant.
First Nations, Inuit and Metis
• Federal and provincial governments must collaborate with First Nations, Inuit, and Metis
governments and indigenous grass roots organizations to develop plans to: prevent, reduce
and eradicate child and family poverty in indigenous communities while ensuring respect for
inherent rights, treaties, title and jurisdiction; to assure full participation in economic growth,
sufficient, predictable, long-term funding for First Nations governments and institutions to
achieve well-being, and evidence-based closure of socio-economic outcome gaps by collecting
data to support measurement and reconciliation.
• Pay full compensation to the First Nations children, parents and grandparents who were
harmed by inequitable funding for child welfare services on reserve and lack of adherence to
21Jordan’s Principle as well as implement The Spirit Bear Plan to end inequalities across public
services.
Child Care
o Immediately set up the Federal Child Secretariat announced in the 2020 Economic Update
and mandate it to:
o Work with the Indigenous Early Learning and Child Care Secretariat;
o Consult with the Minister of Families, Children and Social Development’s Expert panel on
early learning and childcare, childcare advocates, policy experts and civil society
organizations.
o Develop a detailed multi-year plan to build a pan-Canadian system of early learning and
childcare in partnership with the provinces, territories and First Nations, Inuit and Metis
Nation governing bodies.
• Immediately allocate $2 billion (to supplement the $625 million transfer to the provinces
and territories of ELCC under the Safe Restart agreement) to assist with the safe recovery
of licensed childcare. Such funds must be earmarked for restoration and expansion of the
number of licensed childcare and early learning spaces; increase compensation for the
childcare workforce to ensure the return and retention of ELCC staff; and stabilize and
reduce Parent fees.
• Allocate $2 billion for ELCC in the 2021-22 budget and commit to increasing the allocation
each year after by $2 billion to gradually expand and develop an ELCC that is available to
all who want it.
Housing
• Enhance the National Housing Co-Investment Fund with an additional $3 billion annually
for new builds and repairs and existing units, allocate $2 billion annually for new
supportive housing for vulnerable populations, double the federal contribution to the
Canada Housing Benefit and continue expansion such that it becomes a universal benefit
rather than rationed.
• Accelerate the co-development of the three distinctions-based indigenous housing
strategies and commit to a fourth complementary Indigenous Housing Strategy to address
the needs of urban and rural indigenous people. Ensure that the accountability and
remedial mechanisms for those affected by ongoing systemic housing issues are
independent, fully resourced and implemented immediately.
Youth
• Create universal access to postsecondary education by eliminating tuition fees and
significantly bolster youth employment programs and apprenticeship opportunities.
• Implement post-care financial and social services to First Nations, Metis and Inuit youth
who were in child welfare and extend Jordan’s Principle past the age of 18. Reduce inflows
22into homelessness by implementing a targeted housing strategy and establishing a
national framework for extended care and support for youth in child welfare, in
collaboration with First Voice Advocates, territories and provinces.
Public Health
• Ensure that First Nations, Inuit and Metis communities co-develop food security strategies
to address their unique needs and future reconciliation efforts. As part of this, the federal
government must move swiftly to identify and implement more effective strategies to
address the very high prevalence of food insecurity among families in Nunavut, working in
partnership with people in that territory.
• Create legislation to invest $3.5 billion in annual federal transfers to provinces and
territories as part of the federal COVID-19 recovery plan and as a first step to full
implementation of a universal, comprehensive, Public Pharmacare system based on the
principles and recommendations of A Prescription for Canada: Achieving Pharmacare for
All 2019.
Decent Work
Immediately implement a $15/hr minimum wage indexed annually to inflation.
Extend emergency benefits beyond 26 weeks, lower the qualifying threshold for temporary EI
currently set at 120 hour and set a minimum guarantee (as set by CERB at $500.00 per week).
Permanently amend the Canada Labour Code to ensure workers have access to seven
permanent paid sick days with an additional fourteen days available during public health
emergencies.
• That the federal government comply with the rulings of the Human Rights Tribunal by
providing adequate funding for child welfare services on reserve, compensation to parents
and grandparents of children in care and ensure full application of Jordan’s Principle for First
Nations communities.
• That the federal government replace the absolute Market Basket Measure (MBM) with the
relative Low Income Measure – After Tax and that the MBM be adopted as a supplementary
measure to the Low Income measure
• That the federal government end immediately the division of EI on PEI into 2 zones thereby
ending the disparity that currently exists among EI recipients in this province, and that the
hours required for qualifying for EI be a uniform 360 hours across the country. It is also
necessary to eliminate some of the requirements for receiving EI and to raise the level of
benefits.
23• That government co-develop indicators for material deprivation as well as health and well-
being indicators with indigenous led communities and organizations and commit a reasonable
timeframe for the development of these measures.
• That the federal government double its contribution to the Canada Housing Benefit and
continue to expand it to a universal benefit.
• That the federal government invest more dollars annually to build housing for people suffering
from physical and mental disabilities.
• That the City of Charlottetown and the province change their public transportation systems to
electric vehicles and that they expand the existing service.
APPENDIX B
The Job Guarantee
The Job Guarantee is certainly an effective instrument to enhance poverty eradication in as quick and
effective way as possible compared to other proposals. We can do much more to help people find
decent jobs with decent pay and benefits. The JG is not inflationary and therefore eradicates the hazard
of rapid price rises that consume government grants. There is no magic solution to poverty but it can be
solved in a way that lays solid groundwork for now and for the future. This is essential. The Job
Guarantee is a well thought out and analyzed model that goes a long way to solve the problem. Poverty
is not complex but its solution requires that we tackle it in its various dimensions. Under the JG,
employment rises and socially useful production rises, providing goods and services at the local level. A
decent job with decent pay and benefits is an instrument of Justice that suits the needs of our times e.g.
green jobs and other jobs that enhance the society. We have seen that low wages are a big part of the
poverty picture on PEI. One of the main findings of this report card is that there are very many jobs with
low wage rates and undesirable working conditions. The goal is to provide alternatives in the form of
decent good jobs with decent pay.
AS well as being an inflation stabilizer, the JG is a countercyclical mechanism, which is a recessions and
expansions leveler in the business cycle. It seeks to ensure full employment over the short and long
term. In other words, as Dr. Tcherneva explains, “providing Income alone does not eliminate poverty
and does nothing for those who want to work. The market does not magically provide goods or provide
the benefits promised by those who provide income alone as the solution. People want paid work.”xiii
She refers to the great economist, Amartya Sen who taught that what matters is not just freedom but
substantive freedom. That is, policy has to 1) recognize what individuals themselves want and value; 2) it
must provide these opportunities; and 3) it must remove obstacles from taking advantage of those
opportunities. xiv
The JG is gaining momentum in Europe, Britain, India, the USA and other countries. All people who want
a job would be able to find one either in their own communities or close to home. The scourge of
unemployment with all its accompanying health effects would practically disappear as new targets are
24set for all people who wish to work. This would enhance family living, strengthen communities and
reduce the demand on the healthcare system. Decent and livable pay, including benefits, with decent
work would enable balanced diets, personal fulfillment, adequate housing, shelter, and many other
benefits including enhanced economic benefits for the society. Green jobs would be at the forefront as
we attempt to un-choke a warming planet.
We can do lots more work in a warming, carbon-congested planet. The need for work will only grow if
we succeed in creating a regenerative society. Many modern economists are very much in favour of the
(JG). They are especially interested in its effects on the business cycle – expansion, peak, contraction and
trough. These four steps would no longer apply to that cycle. The JG would smooth things out by
stabilizing employment at a high level, while at the same time buffering shocks to employers. The JG
effectively sets a wage floor, a set minimum livable wage and reaches the most vulnerable people. It
cuts out under-the table exploitative deals and comes at a time when it is most needed - as
unemployment increases due to COVID-19 and there is more and more need for healthcare, social care
and environmental care.
A JG would uniquely tackles unemployment, public health deficits and environmental neglect together.
Its counter-cyclical features make it an ideal fit for all economic weathers.
Large sums of money are spent on addressing our serious medical problems and environmental blight.
However, we do not understand the cost of unemployment to our society and its people. Since it is
already paid for we have everything to gain by eliminating it as much as possible, thereby relieving those
pre-existing expenditures. We could create needed Jobs to fill real human needs thus enriching our
society. Disadvantaged regions can benefit greatly by creating good jobs close to home thereby
restoring dignity and relieving stigma. These regions will experience much needed equality and respect.
Dr. Tcherneva often quotes Bill Vickrey’s description of unemployment as “economic vandalism.” She
points out that it will take years to overcome the damage done by COVID-19. Without a concrete effort,
remaining jobs could be poorly paid with no benefits or basic employment protections. The JG
guarantees those basic protections and points to the policies we need in order to create jobs on
demand.
As one observer stated, “when things get bad the government becomes the ‘employer of last resort’ and
becomes the best friend of workers.” It has the power to create jobs and to save jobs and could have
already done a better job of this during the COVID. The funding was not the issue. Canada’s $381 billion
deficit expected for 2021, the largest COVID-19 investment in the industrialized world, should go a long
way to stimulate the economy. Despite its claims and ambitions, the private sector is not able to create
the many needed jobs in a short time. As Dr. Tcherneva explains, “the government must play a direct
role in restoring jobs by hiring the unemployed. It can happen through large-scale public investment
that creates millions of jobs, well- paying and covering all skill levels.” There is plenty of work to do and
local communities would play a large role in identifying those needs, as this is a “bottom up” program.
According to Dr. Tcherneva, the Job Guarantee is the third and indispensable piece of any
comprehensive job creation and job preservation strategy. It is a program guaranteeing that anyone
who walks into the unemployment office can walk out with an employment option offering a minimum
living income with benefits. The JG is a public option for jobs in the public service sector that offers on-
25the-job training and assistance with transitioning to other employment opportunities. It raises the wage
floor by establishing a labour standard for minimum pay and working conditions for all jobs in the
economy. This policy ensures that precarious and poorly paid work is extinguished along with the
Corona virus by increasing competition in the labour market. Tcherneva asks, “Why toil away at the
minimum wage if the local green JG project offers $15/hour and benefits”. As an alternative to the most
precarious private sector work, the JG pressures firms to improve their pay and benefits if they wish to
retain and attract employees. Many private sector workers will get a pay raise, because of the JG, which
in turn will boost spending, growth, and firm profits. Businesses that can only survive by paying poverty
wages will no longer be viable; nor will those that use the ‘threat of the sack’ to create the most difficult
working conditions (wage theft, discrimination, harassment) for the lowest wage and most vulnerable
workers. The JG will give workers the power to say “no” to abusive employers. It will also act as a
stepping-stone for young people entering the labour market, an employment opportunity for caregivers
who wish to return to paid work, and a bridge to civilian employment for former inmates and veterans.
The bottom line is that mass unemployment is avoidable. The JG will give stability to workers who have
to find more than one job a day to try to make ends meet. Employers will have to give full-time work in
one place. This will improve mental and physical health.
We have been unable to envision a world or policies that prevent unemployment and the pain it inflicts
on families and communities. The stronger the job protection policies now, the bigger and bolder the
mobilization efforts tomorrow, the more nimble and effective the JG program can be.
i
Pavlina R. Tcherneva, the Case for a Job Guarantee, Polity Press, Medford, MS
ii
Canadian Labour Force Summary for October, 2020
iii
Pavlina R. Tcherneva, A Federal Job Guarantee, Harvard Law School Forum, March, 2018
iv
Christine Saulnier, The Living Wage for Charlottetown, November 2, 2020
v
Ibid
vi
Annual Report of IRAC, 2020
vii
Jesse Snyder, Charlottetown Guardian, Liberals could post $381-billion deficit, December 2, 2020
viii
Maytree, Welfare-in-Canada/Prince Edward Island,
ix
Ibid
x
Mike MacDonald, information by phone, December 8, 2020
xi
James K. Galbraith, University of Texas, Austin, June, 2020
xii
Noam Chomsky, June 2020
xiii
Pavlina R, Tcherneva, The Case for a Job Guarantee, June 2020
xiv
Pavlina R Tcherneva, ibid.
26You can also read