Delay of Gratification Predicts Eating in the Absence of Hunger in Preschool-Aged Children - Giuliani Lab
←
→
Page content transcription
If your browser does not render page correctly, please read the page content below
ORIGINAL RESEARCH
                                                                                                                                                published: 19 March 2021
                                                                                                                                         doi: 10.3389/fpsyg.2021.650046

                                                Delay of Gratification Predicts Eating
                                                in the Absence of Hunger in
                                                Preschool-Aged Children
                                                Nicole R. Giuliani 1* and Nichole R. Kelly 2
                                                1
                                                 Department of Special Education and Clinical Sciences, Prevention Science Institute, University of Oregon, Eugene, OR,
                                                United States, 2 Department of Counseling Psychology and Human Services, Prevention Science Institute, University of
                                                Oregon, Eugene, OR, United States

                                                Poor ability to regulate one’s own food intake based on hunger cues may encourage
                                                children to eat beyond satiety, leading to increased risk of diet-related diseases.
                                                Self-regulation has multiple forms, yet no one has directly measured the degree to which
                                                different domains of self-regulation predict overeating in young children. The present
                                                study investigated how three domains of self-regulation (i.e., appetitive self-regulation,
                                                inhibitory control, and attentional control) predicted eating in the absence of hunger
                                                (EAH) in a community sample of 47 preschool-aged children (M age = 4.93, SD = 0.86).
                                                Appetitive self-regulation, as measured using a delay of gratification task, was significantly
                                                and negatively associated with EAH 1 year later (p < 0.5). Measures of inhibitory
                           Edited by:
                      Oh-Ryeong Ha,             and attentional control did not significantly predict EAH. These results suggest that
   University of Missouri–Kansas City,          food-related self-regulation may be a better predictor of overeating behaviors than
                         United States
                                                general measures of self-regulation.
                         Reviewed by:
                    Brittany Matheson,          Keywords: self-regulation, eating in the absence of hunger, preschool, taste test, inhibitory control, delay of
     Stanford University, United States         gratification
                    Naomi Kakoschke,
         Commonwealth Scientific and
      Industrial Research Organisation          INTRODUCTION
                     (CSIRO), Australia

                   *Correspondence:             Developing healthy eating habits early in life is critical to establishing a healthy lifestyle and
                        Nicole R. Giuliani      preventing the onset of diet-related diseases. Diet-related diseases once thought to be applicable
                  giuliani@uoregon.edu          only to adults (e.g., metabolic syndrome, type 2 diabetes, non-alcoholic fatty liver disease) are now
                                                being seen in children with increasing frequency (Daniels, 2006; Lucan, 2015). In the same way
                    Specialty section:          that individuals with a high body mass index (BMI) in childhood are more likely to continue to
          This article was submitted to         have a high BMI in adulthood (Guo et al., 2002), eating habits and food preferences established
                        Eating Behavior,
                                                in childhood track into and through adulthood (Devine et al., 1998; Skinner et al., 2002; Nicklaus
                a section of the journal
                Frontiers in Psychology
                                                et al., 2004). As such, a better understanding of individual differences in eating behaviors related to
                                                high BMI and associated diseases is necessary to advance interventions aimed at improving health
          Received: 06 January 2021
                                                outcomes across the lifespan.
         Accepted: 11 February 2021
          Published: 19 March 2021
                                                    Many people eat not only in response to satiety, but also in response to external cues and
                                                emotions; these behaviors can lead to patterns of intake that go beyond energy needs (Dallman,
                               Citation:
Giuliani NR and Kelly NR (2021) Delay
                                                2010), increasing risk for diet-related diseases (Bleich et al., 2015). While often thought of in the
  of Gratification Predicts Eating in the       context of adulthood, this phenomenon is also reliably seen in children and families (Blissett et al.,
Absence of Hunger in Preschool-Aged             2010; Pieper and Laugero, 2013). The gold standard for measuring such eating behaviors in the
 Children. Front. Psychol. 12:650046.           laboratory is use of an “eating in the absence of hunger” paradigm (EAH; Birch et al., 2003), which
     doi: 10.3389/fpsyg.2021.650046             measures the degree to which an individual continues consuming palatable foods beyond satiety. In

Frontiers in Psychology | www.frontiersin.org                                         1                                           March 2021 | Volume 12 | Article 650046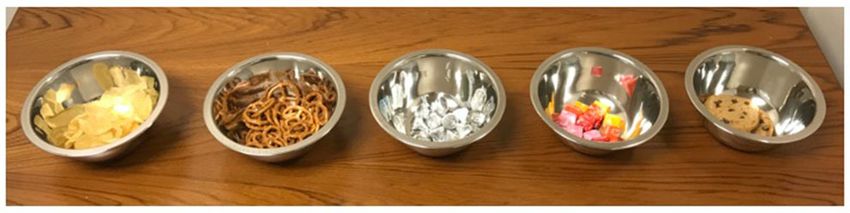
Giuliani and Kelly                                                                                         Delay of Gratification Predicts EAH in Preschoolers

children, EAH is associated with decreased satiety responsiveness            TABLE 1 | Demographic information.
(Carnell and Wardle, 2007) and greater adiposity (Cutting et al.,
                                                                             Demographics                                           M (SD)              %
1999; Fisher and Birch, 2002; Hill et al., 2008; Zocca et al., 2011),
both of which are related to an increased risk for elevated adult            Child Demographics                            Session 1 Session 2
BMI and associated chronic diseases (Freedman et al., 2001;                    Age (years)                                 4.00 (0.77) 4.93 (0.86)
Juonala et al., 2011). Importantly, EAH has been successfully                  Female Race                                                             49%
measured in children as young as 21 months (Asta et al., 2016),                  Caucasian                                                           87.23%
and has been used as a laboratory measurement of overeating                      Asian                                                                2.13%
in people of all ages (Fisher and Birch, 2002; Hill et al., 2008;                Hispanic                                                               0%
Appelhans et al., 2011).                                                         Multiracial                                                          8.51%
    Extant data suggest that difficulties with self-regulation
                                                                                 Native American/Indian                                               2.13%
(Johnson and Birch, 1994; Disantis et al., 2011), may increase
                                                                               Preschool attendance                                                   61.7%
risk for children’s tendency eat beyond satiety (McPhie et al.,
                                                                             Household/parent demographics
2014). Self-regulation (SR) is defined as the ability to regulate
                                                                               Mother highest level of education (years)          15.36 (2.46)
one’s own arousal, emotion, and behavior (Kopp, 1982; Bridgett
                                                                               Mother body mass index (kg/m2 )                    30.07 (8.01)
et al., 2013). SR capacity relies on executive function (EF;
                                                                               Gross family income                         $71,406.38 ($46,531.57)
Hofmann et al., 2012), a set of higher-level cognitive processes
that support an individual’s ability to regulate their behavior and
emotion (Bridgett et al., 2013). Indeed, preschool-aged children
with lower teacher-rated cognitive development scores have been
                                                                             to identify potential targets of intervention to alter developmental
shown to engage in more emotional-based EAH (Pieper and
                                                                             trajectories related to eating behaviors and the risk for associated
Laugero, 2013). While this study investigated and did not find an
                                                                             diet-related diseases.
association between experimental tasks assessing EF and EAH,
                                                                                 Therefore, in the present study we sought to investigate the
the authors acknowledged that their sample (N = 29) may have
                                                                             associations between three separate forms of SR and EAH in a
been too small to find such effects (Pieper and Laugero, 2013).
                                                                             community sample of preschoolers. Appetitive SR was measured
Indeed, a broader literature on EF abilities has shown that it is
                                                                             using a delay of gratification task, and two separate forms of
meaningfully related to eating behaviors in preschool- (Allom
                                                                             behavioral SR were measured via attentional and inhibitory
and Mullan, 2014; Levitan et al., 2015; Reimann et al., 2020)
                                                                             control tasks. We hypothesized that (1) all measured domains of
and school-aged (Riggs et al., 2010a,b; Nederkoorn et al., 2015;
                                                                             SR would be inversely associated with EAH, such that greater SR
Kelly et al., 2020) children (but see Hughes et al., 2015; Tan and
                                                                             ability would predict lower EAH, and (2) this association would
Lumeng, 2018). A few studies have compared subdomains of EF
                                                                             be the strongest with regard to delay of gratification as compared
(e.g., inhibitory control, updating), and suggest that they may
                                                                             to both forms of behavioral SR. Given past research suggesting
be uniquely related to eating behavior (Allom and Mullan, 2014;
                                                                             that both delay of gratification and inhibitory control are
Gettens and Gorin, 2017).
                                                                             associated with EAH, we ran additional exploratory analyses to
    Like EF, SR is not a single construct. While work on SR and
                                                                             examine whether interactions between appetitive and behavioral
related constructs often conceptualizes them as unitary processes
                                                                             SR significantly predicted EAH.
(e.g., Wiebe et al., 2011; Deater-Deckard, 2014), many models
divide SR into different domains based on the degree of emotion
involved (e.g., Metcalfe and Mischel, 1999; Willoughby et al.,               METHODS
2011; Bridgett et al., 2015). This multifaceted perspective on
SR has been employed in the eating field, with most models                   Participants
separating out cool (i.e., solely behavioral) SR tasks from hot (i.e.,       The sample for the present study consisted of 47 preschoolers
emotional) SR tasks (e.g., Pieper and Laugero, 2013). One of the             (M age at Session 2 = 4.93, SD = 0.86, range = 3.78–6.83
tasks used to assess hot SR is the classic delay of gratification            years) who participated in a follow-up session (hereby referred
paradigm (Willoughby et al., 2011), which requires individuals               to as Session 2) following engagement in a larger study on SR in
to control their desire to consume a single snack in order                   parents and children (hereby referred to as Session 1). Of the 89
to gain a second snack. It may be that this process, which                   families who participated in the larger study, 75 signed a consent
we refer to as “appetitive SR,” is conceptually more similar to              form allowing the research team to recontact them for additional
self-regulating the desire to consume a tempting food in the                 research opportunities. The subsample who returned ∼1 year
absence of hunger as compared to more classic EF tasks or                    later for Session 2 did not differ from the full sample with regard
other forms of behavioral SR. However, no studies have directly              to child age, sex, gross family income, maternal education, or
compared appetitive and behavior SR with regard to eating in                 maternal BMI (p-values > 0.28). Demographics for the present
young children. Individual differences in SR abilities appear                sample are detailed in Table 1.
around age 3 (Carlson et al., 2004), and show dramatic growth                    Families were recruited via physical and online flyers; criteria
through age 5 (Diamond, 2002). As such, the preschool period                 for participation were biological mothers over age 18 with
(defined here as aged 3 through 5) may be the ideal time to                  children ages 3 through 5 who had not yet entered kindergarten
investigate the precise associations between SR and EAH in order             at the time of Session 1. Exclusion criteria were if mothers

Frontiers in Psychology | www.frontiersin.org                            2                                           March 2021 | Volume 12 | Article 650046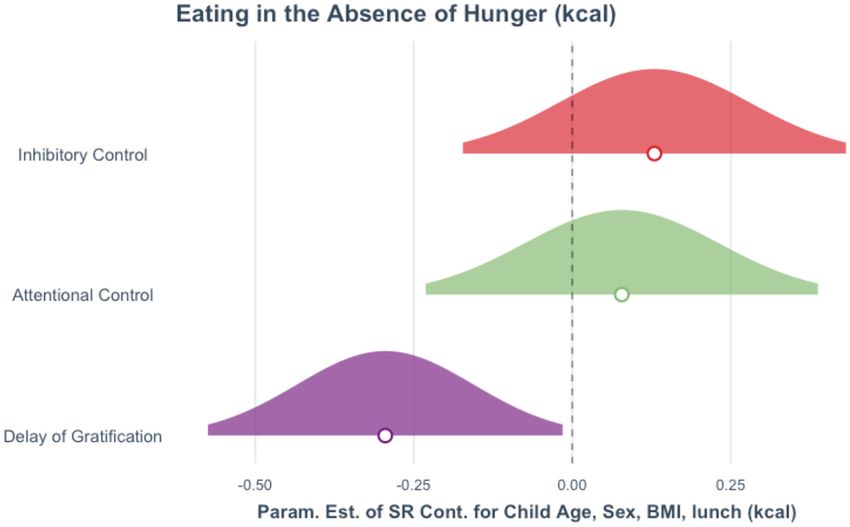
Giuliani and Kelly                                                                                      Delay of Gratification Predicts EAH in Preschoolers

had less than half-time custody of the child, had a history                  Self-Regulation Tasks (Session 1)
of significant neurological disorder, or were taking medication              Delay of Gratification Task
that affects cognitive function; if the child had a developmental            As detailed in Murray and Kochanska (2002), children were first
delay, sensory impairment, or the mother believed the child                  asked to choose a preferred snack from an array of fruit snacks,
could not participate in the study successfully; or if the family            M&Ms, and goldfish crackers. The experimenter placed the snack
was involved with child welfare services or reported that their              on a napkin in front of the children and asked them to wait until
primary language was not English. There were no additional                   they rang a bell before retrieving it. The child was then told that
eligibility criteria to participate in Session 2. All study procedures       they would receive a second snack if they were able to wait until
were approved by the University’s Committee for the Protection               the bell was rung. Four trials were conducted, where the child
of Human Subjects.                                                           had to wait 30, 60, 120, and 180 s for the bell to ring. Halfway
                                                                             through each trial, the experimenter picked up the bell as if they
Protocol                                                                     were about to ring it. For each trial, the child was given a score
In Session 1, mothers and children came into the laboratory                  representing waiting behavior: 0 (eats the snack before the bell
for a roughly 3-h visit consisting of video-recorded parent-child            is lifted), 1 (eats the snack after the bell is lifted), 2 (touches the
interactions, mother-completed surveys, and child assessments                bell or snack before the bell is lifted), 3 (touches the bell or snack
of self-regulation, emotion identification, and school readiness.            after the bell is lifted), or 4 (waits for bell to ring before touching
Measures relevant to the present analyses are described below. In            snack or bell). The final score was the average score over four
Session 2, dyads returned to the same laboratory roughly 1 year              trials, such that a child with an average score of 0 ate the snack
later (M = 364.17 days, SD = 56.29) for a 2-h session scheduled              before the bell was lifted for all trials, and a child with an average
around the time of day when mothers identified that the child                score of 4 waited until the bell was rung for all trials.
usually ate lunch (all sessions began between 11 a.m. and 2 p.m.,
with 80.9% beginning at 11 a.m.). At the beginning of this session,          Flanker Task
mothers provided informed consent, after which both mother                   The Flanker Task was administered via the NIH Toolbox
and child were weighed and measured for height in triplicate.                Cognition Battery, which was adapted from the Attention
Then, the child was presented with a 10,000 calorie test meal food           Network Task (Rueda et al., 2004) and is normed for
array. Mothers were instructed to help their child eat lunch from            administration for children as young as 3 years old (Zelazo et al.,
the food array, but not eat anything themselves. These meals were            2014). Children were presented with a stimulus on the center
video recorded. After lunch, mothers were asked to complete                  of a tablet screen and were required to indicate the left-right
surveys while the child performed an EAH paradigm framed as                  orientation while inhibiting attention to the stimuli flanking it.
a taste test in another room with the experimenter. Children                 On some trials the orientation of the flankers was congruent with
were reunited with their mothers after 15 min. Families were then            the orientation of the central stimulus and on the other trials the
debriefed, thanked, and compensated $40 for their time.                      flankers were incongruent. The test consisted of a block of 20 fish
                                                                             trials (designed to be more engaging and easier to see, and to
Measures                                                                     make the task easier for children) and a block of 20 arrow trials,
Family Demographics (Session 1)                                              shown only if the participant scores >90% on the fish stimuli. The
At Session 1, mothers were asked to report the birth date, sex, and          NIH Toolbox uses a two-vector method to score performance,
the race/ethnicity of their child. From that, age was calculated as          which incorporated both accuracy and reaction time (RT) for
the number of days between the child’s birth and the session date,           participants who maintained a high level of accuracy (>80%
divided by 365.25. Mothers also reported the gross family income             correct), and accuracy only for those who did not meet this
and her highest level of educational attainment by degree.                   criterion. While age-referenced standardized scores are available
                                                                             for this task, we used raw scores in the present analyses in order
Anthropomorphic Measurements (Session 2)                                     to match the other SR tasks, for which age-referenced scores were
Mother and child BMI were assessed using laboratory                          not available.
measurements of height (inches) and weight (pounds) at
the beginning of Session 2. Individuals were asked to remove                 Go/NoGo Task
shoes and heavy clothing, and stand with their shoulders and                 Two GNG tasks were administered to children in the present
heels against a wall. They were asked to take a breath in and out,           study. First, children performed the Zoo Game (detailed in
and their height was measured using a stadiometer mounted on                 Grammer et al., 2014). Briefly, the task asked children to help a
a flat wall at the exhale. This was done three times, and height             zookeeper put animals back in their cages by pressing a button
(in inches) was calculated as the average of all measurements.               as quickly as they can (Go [G] trials), unless they see Fred, a
Similarly, weight (in pounds) was measured three times using                 monkey who is helping the zookeeper (NoGo [NG] trials). The
a digital scale and averaged. BMI was then calculated using the              task began with three practice blocks in which children can
following equation: weight/height2 x 703. We converted BMI to                practice (1) pressing the button on the laptop when they see an
z-score relative to same-age, same-sex peers (Mei et al., 2002)              animal, (2) pressing the button within a certain time limit, and
using Baylor College of Medicine’s online BMI-percentile-for-age             (3) practice inhibiting their response when they see the monkey.
calculator (https://www.bcm.edu/cnrc-apps/bodycomp/bmiz2.                    To increase the salience of the task, feedback was added at the end
html) for use in analyses.                                                   of each trial, such that children saw a smiling face if they correctly

Frontiers in Psychology | www.frontiersin.org                            3                                       March 2021 | Volume 12 | Article 650046
Giuliani and Kelly Delay of Gratification Predicts EAH in Preschoolers
withheld their response on NG trials and a mad face if they either They were told that they had as much time as they needed,
pressed the button on NG trials or did not press the button on then granted access to a frequently used (Mirch et al., 2006;
G trials. Timing of this task was modified for the age range of Tanofsky-Kraff et al., 2009; Shomaker et al., 2010a,b) ad libitum
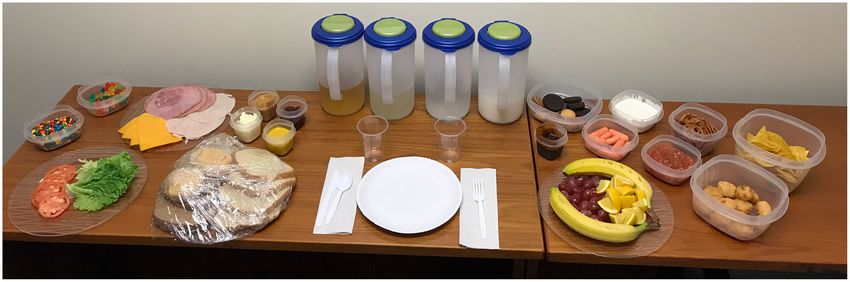
the children in the present study by increasing the duration of test meal varied in macronutrients (>10,000 kcal, Figure 1)
the stimulus presentation and decreasing the number of trials. and consisting of items most children like (e.g., bread, cheese,
As such, each trial began with a 500–700 ms jittered fixation meat, chips, candy, cookies, fruit, chicken nuggets, water, milk,
cross, 1,200 ms stimulus presentation, 500 ms black screen, and lemonade, apple juice). Mothers indicated before the session if
1,000 ms feedback. Responses could be made while the stimulus there were any foods that should be omitted from the array due to
was on the screen or at any point during the following 500 ms. A allergies or vegetarian preferences (total N = 3; remove red food
total of 90 trials were completed, 25% of which were NG. Percent dye = 1, remove meat items = 2). All food items were weighed
correct was calculated across both types of trials. in grams (g) to the nearest single decimal before families entered
We also asked children to complete the Fish GNG Task from the lunch room. When families completed lunch, experimenters
the Early Years Toolbox (detailed in Howard and Okely, 2015). ensured that they had not saved any food for later, and then
Briefly, the task asks children to respond to G trials (“catch fish,” weighed the remaining test meal food items when families
80% of trials) and withhold responding on NG trials (“avoid were no longer able to see the lunch room. Energy content
sharks,” 20% of trials). The task begins with go instructions and macronutrient composition for each item were determined
followed by 5 practice go trials, no-go instructions followed by according to data from the USDA National Nutrient Database
5 practice no-go trials, combined GNG instructions followed by for Standard Reference, Release 24, and from the manufacturer
a mixed block of 10 practice trials (80% go trials), and a recap of labels on packaged food items. Total energy intake in kilocalories
instructions prior to the task commencing. Feedback in the form (kcal) was determined by subtracting the food weights after the
of auditory tones was provided on all practice trials. The task itself participant’s meal from premeal weights.
did not contain feedback, and was comprised of 75 test stimuli
divided evenly into three test blocks (each separated by a short Eating in the Absence of Hunger (Session 2)
break and a reiteration of instructions). Stimuli were presented Immediately after the completion of lunch, mothers were asked
in pseudo-random order, such that a block never began with to complete a set of surveys in the waiting room, and children
a no-go stimulus and no more than two successive trials were were escorted to a room containing the following foods displayed
no-go stimuli, separated by a 1,000 ms interval between stimuli. in separate bowls (Figure 2): potato chips (28g; Kettle brand Sea
Percent correct was calculated across both types of trials. Due
to computer error, data from 15 participants were not recorded.
Given the similarities in performance for the two GNG tasks
(r = 0.439, p < 0.001), a composite score was created by z-scoring
and averaging performance.
Test Meal (Session 2)
After anthropomorphic measurements were collected, mother-
child dyads were escorted to a private room for lunch. They
FIGURE 2 | Taste test food array (from left to right: chips, pretzels, Hershey’s
were instructed that the lunch was only for the child, but the kisses, Starburst, cookies).
mother was to help the child eat until they were no longer hungry.
FIGURE 1 | Test meal food array.
Frontiers in Psychology | www.frontiersin.org 4 March 2021 | Volume 12 | Article 650046Giuliani and Kelly Delay of Gratification Predicts EAH in Preschoolers
Salt), pretzel twists (28g; Rold Gold brand Tiny Twists), chocolate missing data from the GNG tasks. The majority of the data
drops (90g, Hershey brand kisses, individual-wrapped), fruit points lost were due to a computer error, which is considered
chew candies (150g; Starbursts brand, individually-wrapped), to be missing completely at random. Therefore, we imputed all
and chocolate chip cookies (70g; Grandma’s brand). Mothers had the missing data using multiple imputation implemented using
indicated which foods their child should not eat due to allergies the mice package in R (van Buuren and Groothuis-Oudshoorn,
beforehand; children performed their taste test using only the 2011).
foods that were permitted by their mothers (total N = 1; removed All analyses were run using R (R Core Team, 2019). Zero-
red/pink Starburst containing red food dye). Consistent with order associations between scores on the three SR tasks were
the original paradigm used in the proposed age range (Cutting first run using Pearson’s correlations, adjusted for multiple
et al., 1999; Fisher and Birch, 1999), children were instructed to tests using the Benjamini-Hochberg correction (Benjamini and
taste each of the foods and provide a rating from 1 to 5 using Hochberg, 1995); adjusted p-values are presented. Associations
a smiling-face scale where 1 = “very tasty” and 5 = “not very between SR and EAH were tested using three separate linear
tasty” validated for use in the assessment of taste in pediatric regression models, one for each form of SR. To explore the
populations (Mistry et al., 2018). Children were encouraged to interactions between the different forms of SR on EAH, we
complete the taste test within 5 minutes, and were then told that entered all three forms of SR in the same model and tested
they had to remain in the room while their mother completed two- and three-way interactions between SR tasks. Interactions
her surveys. They were told that they could eat as much of the were interrogated and plotted using the R package interactions
remaining food as they wanted, as well as play with a bin of (Long, 2019). Covariates in all models included child BMI z-
toys in the room opened by the experimenter. The experimenter score (Session 2) and total calories consumed (kcal) during the
remained in the room with the child for the full duration of test meal (Session 2). Confirmatory analyses were also analyzed
the taste test and subsequent play period, and was instructed to using % estimated energy requirements (calculated according to
minimize interactions with the child. After 15 minutes, the child the Institute of Medicine guidelines; Institute of Medicine of the
was escorted to their mother. EAH was measured by calculating National Academies, 2005); the pattern of results did not change.
the difference in weight (g) of each snack before and after the
eating period and summing across all snacks. Energy intake was RESULTS
calculated using the same methods as for the test meal.
Confirmatory Results
Analyses As shown in Table 2, zero-order correlations between SR tasks
Study variables were assessed for skew and kurtosis; variables revealed that delay of gratification (as measured by Snack Delay
with a skewness or kurtosis over ±1 were transformed to score) was not significantly associated with either attentional
improve distributions and re-assessed. Total calories consumed control (as measured by the Flanker Task), r(45) = 0.22, p = 0.16,
during lunch was identified as non-normally distributed. or inhibitory control (as measured by the Go/NoGo composite),
The distribution of this variable was greatly improved by r(45) = 0.13, p = 0.48. Attentional and inhibitory control were
transformation using the transform Tukey function in the significantly positively associated, r(45) = 0.43, p = 0.01.
R package rcompanion (Mangiafico, 2019), which follows the Delay of gratification at Session 1 was negatively associated
Tukey’s Ladder of Powers principle to improve the distribution with total calories consumed (kcal) during the EAH paradigm
of skewed variables. This transformed variable was used for all 1 year later at Session 2, b = −12.46, 95% CI [−23.95, −0.97],
subsequent analyses. A missing data analysis revealed that 7 SE = 5.86, t (41.13) = −2.13, p = 0.040 (Table 3A). Attentional
participants were missing data from the Flanker task, and 2 were control at Session 1 was not associated with EAH at Session 2,
TABLE 2 | Descriptive data of self-regulation, test meal, and EAH variables, and correlations with confidence intervals.
Variable M SD Range 1 2 3 4
1. Snack Delay Task 1.80 1.71 0–4
2. Flanker Task (raw score) 20.43 12.07 4–40 0.22
[−0.09, 0.48]
3. Go/NoGo Task composite 0.04 0.76 −2.12–1.62 0.11 0.44**
[−0.19, 0.40] [0.13, 0.67]
4. Test meal (total kcal consumed) 492.57 300.14 128.54–1351.30 −0.03 0.37* 0.11
[−0.32, 0.26] [0.09, 0.60] [−0.19, 0.39]
5. EAH (total kcal consumed) 120.90 72.11 27.64–319.99 −0.27 0.15 0.18 0.37**
[−0.52, 0.01] [−0.16, 0.44] [−0.11, 0.45] [0.10, 0.60]
M and SD are used to represent mean and standard deviation, respectively. Correlations were run on the pooled estimates from multiply imputed data sets. Values in square brackets
indicate the 95% confidence interval for each correlation. The confidence interval is a plausible range of population correlations that could have caused the sample correlation (Cumming,
2014). EAH, eating in the absence of hunger. * Indicates p < 0.05. ** Indicates p < 0.01.
Frontiers in Psychology | www.frontiersin.org 5 March 2021 | Volume 12 | Article 650046Giuliani and Kelly Delay of Gratification Predicts EAH in Preschoolers
TABLE 3 | Results of the multiple regression analyses by self-regulation domain. b = 0.38, 95% CI [−1.59, 2.34], SE = 1.03, t (33.38) = 0.37, p = 0.71
(Table 3B), nor was inhibitory control, b = 13.50, 95% CI
Predictor t p b R2
[−13.33, 40.34], SE = 13.69, t (40.94) = 0.99, p = 0.33 (Table 3C).
(A) Appetitive self-regulation 0.185 Visualization of these results for total calories consumed are
Intercept −2.195 0.034 −1493.736* shown in Figure 3.
Snack Delay −2.126 0.040 −12.462* A direct comparison of the confidence intervals for the effects
Child BMIz −0.670 0.507 −8.224
of SR on EAH by domain revealed that, while the confidence
Kcal consumed at lunch‡ 2.405 0.021 1410.550*
intervals overlapped (Figure 4), the 95% confidence interval for
(B) Attentional control 0.105
delay of gratification did not include the estimated associations
Intercept −1.808 0.078 −1350.670
of attentional and inhibitory control with EAH. We compared
standardized regression coefficients using Eid et al.’s (2011)
Flanker Task 0.375 0.710 0.376
formulas implemented in the Psychometrica online calculator
Child BMIz −0.442 0.661 −5.675
(Lenhard and Lenhard, 2014), which revealed that the effect of
Kcal consumed at lunch‡ 1.945 0.059 1261.262
delay of gratification on EAH was indeed significantly higher
(C) Inhibitory control 0.120
than the effect of inhibitory control, z = −2.15, p = 0.016, but
Intercept −1.852 0.071 −1324.944
not attentional control, z = −1.35, p = 0.089. An exploratory
Go/NoGo Task composite 0.986 0.330 13.502
direct comparison of the tasks assessing all three SR domains in
Child BMIz −0.193 0.848 −2.499
the same model revealed that no one SR domain was significantly
Kcal consumed at lunch‡ 2.019 0.050 1244.224
associated with EAH when controlling for the other two SR
The dependent variable for all regressions was EAH, defined as total calories (kcal) domains as well as child BMI z-score and total calories consumed
consumed during the taste test. BMIz = z-scored body mass index. All parameters were during lunch (p-values > 0.11). Full models, data, and R scripts
calculated using pooled estimates from multiply imputed data sets. ‡ Variable transformed.
are available online – https://osf.io/wbntq/.
*p < 0.05.
FIGURE 3 | Visualization of the main effect of child self-regulation on eating in the absence of hunger (EAH) controlling for child age, child sex, child BMI, and the
number of calories (kcal) consumed during the lunch test meal, in the domains of (A) delay of gratification (b = −12.46, p = 0.04), (B) attentional control (p = 0.67),
and (C) inhibitory control (p = 0.34). One of the multiply imputed data sets was chosen at random for plotting purposes.
Frontiers in Psychology | www.frontiersin.org 6 March 2021 | Volume 12 | Article 650046Giuliani and Kelly Delay of Gratification Predicts EAH in Preschoolers
FIGURE 4 | Visualization of the effects of self-regulation on eating in the absence of hunger (EAH) by self-regulation (SR) domain, controlling for child age, child sex,
child BMI, and the number of calories (kcal) consumed during the lunch test meal. Each curve represents the 95% confidence interval, circles represent the
standardized parameter estimates for inhibitory control (ß = 0.130), attentional control (ß = 0.078), and delay of gratification (ß = −0.295). One of the multiply imputed
data sets was chosen at random for plotting purposes.
Exploratory Results TABLE 4 | Results of the multiple regression analyses examining interactions
As shown in Table 4, there was a significant interaction between between self-regulation domains.
delay of gratification and inhibitory control at Session 1 on Predictor t p b R2
EAH at Session 2, b = 42.22, 95% CI [3.85, 80.58], SE = 19.57,
t (27.18) = 2.16, p = 0.04. Simple slopes analyses performed on one 0.325
of the multiply imputed data sets revealed that the slope of the Intercept −2.198 0.037 −1796.711
association between delay of gratification and calories consumed Snack Delay (z-scored) −2.241 0.033 −32.180*
was significant for individuals who performed worse than −1 SD Flanker (z-scored) 1.561 0.130 24.877
below or at the mean on inhibitory control (−1 SD: b = −57.46, GNG (z-scored) −1.366 0.183 −27.139
SE = 21.62, t = −2.66, p = 0.01; mean: b = −32.03, SE = 12.44, Child BMIz −1.243 0.225 −18.717
t = −2.57, p = 0.01). In other words, children who were at or Kcal consumed at lunch‡ 2.366 0.025 1663.941*
below the mean on both the Snack Delay and Go/NoGo Tasks Snack*Flanker −1.680 0.105 −25.787
consumed the most calories (Figure 5). All other interactions Snack*GNG 2.157 0.040 42.217*
were non-significant (p-values > 0.11). Flanker*GNG −0.811 0.425 −14.911
Snack*Flanker*GNG 0.414 0.682 7.483
DISCUSSION The dependent variable for all regressions was the total calories (kcal) consumed during
the taste test. Snack, Snack Delay Task score; GNG, Go/NoGo Task composite variable;
In this study, we first hypothesized that SR would inversely BMIz, z-scored body mass index. All parameters were calculated using pooled estimates
from multiply imputed data sets. ‡ Variable transformed. *p < 0.05.
predict EAH ∼1 year later in a community population of
preschool-aged children. In partial support of this hypothesis, we
found that there was a significant negative association between There was no significant association between SR and EAH in the
Snack Delay Task score in Session 1 and total calories consumed domains of attentional or inhibitory control (p-values > 0.33).
during the taste test at Session 2. Children who were able to Our second hypothesis was that the association between SR
wait until the end of all delay periods on the Snack Delay Task and EAH would be strongest in the domain of appetitive SR,
consumed, on average, approximately 50 calories fewer than such that delay of gratification be a better predictor of EAH as
children who were unable to wait during any of the delay periods. compared to inhibitory and attentional control. In support of this
Frontiers in Psychology | www.frontiersin.org 7 March 2021 | Volume 12 | Article 650046Giuliani and Kelly Delay of Gratification Predicts EAH in Preschoolers
FIGURE 5 | Visualization of the interaction between inhibitory control (Go/NoGo Task) and delay of gratification (Snack Delay Task) on eating in the absence of hunger
(EAH), controlling for child age, child sex, child BMI, and the number of calories (kcal) consumed during the lunch test meal, b = 42.22, p = 0.04. One of the multiply
imputed data sets was chosen at random for plotting purposes.
hypothesis, we found that the only significant effect of SR on later each domain develops somewhat independently with increasing
EAH was in the domain of appetitive SR, and a direct comparison integration across childhood (Russell and Russell, 2020). The
of the standardized regression coefficients revealed that the present findings that delay of gratification was not significantly
effect of delay of gratification on EAH was indeed significantly associated with either attentional or inhibitory control in children
higher than the effect of inhibitory control (the comparison aged 3–6 fits within this framework. As such, longitudinal studies
with attentional control was at the trend level). However, the of associations with pediatric EAH are warranted. Interventions
effect of delay of gratification on EAH was not significant when aimed at improving eating habits should be developed in age-
controlling for attentional and inhibitory control. This is most appropriate ways, including the relative SR domain development
likely due to a combination of reduce degrees of freedom with of the target population.
an already moderate sample size, as well as the shared variance This study had some limitations. First, only 47 of the 75
between the three SR tasks (see Table 2). Therefore, while delay of families we contacted participated in Session 2. While these
gratification performance on the Snack Delay Task is a significant families did not meaningfully differ from the full set of families
predictor of later EAH, we are unable to use these data to with regard to demographics, there may be other differences
definitively conclude that it is a better predictor compared to that we did not capture. Second, because these were secondary
other measures of SR. analyses, we did not run a priori power analyses to determine the
Taken in context with the literature on SR and eating behavior, necessary sample size to achieve appropriate statistical power to
future research should examine how the link between SR and test our hypotheses. A post hoc sensitivity analysis in G∗ Power
EAH changes over time. SR-related skills are some of the last (Faul et al., 2009) revealed that the present sample size of 47
neurocognitive skills to fully develop and each domain appears was powered (α = 0.05, power = 0.8) to detect small-to-medium
to grow at a different pace (Brocki and Bohlin, 2004; Casey effect sizes (f2 = 0.18). The present findings found a small
et al., 2005; Huizinga et al., 2006). However, most of these effect of delay of gratification on EAH (f2 = 0.12), and thus
studies do not include children as young as those in the current should be interpreted with caution. Third, the composition of
study. A recent review of the SR literature separating food and the participants in this study was relatively homogeneous with
non-food SR in early childhood concluded that, while there are regard to race and ethnicity; as such these results may not be
suggestions of common underpinnings of both forms of SR, generalizable to other racial/ethnic groups. These families were
Frontiers in Psychology | www.frontiersin.org 8 March 2021 | Volume 12 | Article 650046Giuliani and Kelly Delay of Gratification Predicts EAH in Preschoolers
not recruited based on obesity risk, and were limited with regard DATA AVAILABILITY STATEMENT
to child BMI. We also limited our sample to biological mothers
to reduce caregiving variance, which additionally reduces the The raw data supporting the conclusions of this article will be
generalizability of these findings. Fourth, families were told that made available by the authors, without undue reservation.
their meals were being video recorded. While the cameras were
unobtrusively placed in the room, this may have affected how ETHICS STATEMENT
much the child ate or how the mother fed the child. Fifth,
while we asked families to join us during their typical lunch The studies involving human participants were reviewed and
time, we do not have information as to what the children approved by University of Oregon Institutional Review Board.
ate prior to the laboratory session. Lastly, as they were done Written informed consent to participate in this study was
in controlled laboratory settings, the test meal and taste test provided by the participants’ legal guardian/next of kin.
protocols may not fully approximate eating behavior in the
real world. AUTHOR CONTRIBUTIONS
The purpose of this study was to quantify the degree to
which SR in preschool-aged children predicted EAH across NG and NK designed the study, edited drafts, and approved
three different domains of SR. While previous studies have the final version. NG collected and analyzed the data and
documented a link between EF and eating behaviors associated wrote the manuscript. All authors contributed to the article and
with increased weight and risk of diet-related diseases (e.g., approved the submitted version.
Allom and Mullan, 2014; Levitan et al., 2015; Reimann et al.,
2020), this is the first time that different domains of SR have FUNDING
been directly compared in the same sample of preschool-
aged children. We found that appetitive SR, as measured by This study was funded by a New Investigator Grant from the
performance on a delay of gratification task, was significantly Medical Research Foundation of Oregon to NG.
negatively associated with EAH about 1 year later. Performance
on inhibitory and attentional control tasks was not. There ACKNOWLEDGMENTS
was also a significant interaction between appetitive SR and
inhibitory control, such that children who evinced poor The authors are grateful to the students from the Giuliani
performance on the tasks assessing both forms of SR ate a and Kelly laboratories who helped gather these data, especially
greater number of calories during the EAH session than other Lindsay Kraft and Claire Guidinger. We appreciate the families
children. These results support previous findings that self- who participated in this research, as well as Derek Kosty and the
regulation is meaningfully associated with eating behavior, but rest of our colleagues at the Prevention Science Institute. The
suggest that these effects may be strongest in the domain of special thanks to Michelle Byrne for missing data and multiple
appetitive self-regulation. imputation support.
REFERENCES Bridgett, D. J., Burt, N. M., Edwards, E. S., and Deater-Deckard, K.
(2015). Intergenerational transmission of self-regulation: a multidisciplinary
Allom, V., and Mullan, B. (2014). Individual differences in executive review and integrative conceptual framework. Psychol. Bull. 141, 602–654.
function predict distinct eating behaviours. Appetite 80, 123–130. doi: 10.1037/a0038662
doi: 10.1016/j.appet.2014.05.007 Bridgett, D. J., Oddi, K. B., Laake, L. M., Murdock, K. W., and Bachmann, M.
Appelhans, B. M., Woolf, K., Pagoto, S. L., Schneider, K. L., Whited, N. (2013). Integrating and differentiating aspects of self-regulation: effortful
M. C., and Liebman, R. (2011). Inhibiting food reward: delay control, executive functioning, and links to negative affectivity. Emotion 13,
discounting, food reward sensitivity, and palatable food intake in 47–63. doi: 10.1037/a0029536
overweight and obese women. Obesity 19, 2175–2182. doi: 10.1038/oby. Brocki, K. C., and Bohlin, G. (2004). Executive functions in children aged 6 to
2011.57 13: a dimensional and developmental study. Dev. Neuropsychol. 26, 571–593.
Asta, K., Miller, A. L., Retzloff, L., Rosenblum, K., Kaciroti, N. A., and Lumeng, doi: 10.1207/s15326942dn2602_3
J. C. (2016). Eating in the absence of hunger and weight gain in low-income Carlson, S. M., Mandell, D. J., and Williams, L. (2004). Executive function and
toddlers. Pediatrics 137:e20153786. doi: 10.1542/peds.2015-3786 theory of mind: Stability and prediction from ages 2 to 3. Dev. Psychol. 40,
Benjamini, Y., and Hochberg, Y. (1995). Controlling the false discovery rate: a 1105–1122. doi: 10.1037/0012-1649.40.6.1105
practical and powerful approach to multiple testing. J. R. Stat. Soc. Ser. B Carnell, S., and Wardle, J. (2007). Measuring behavioural susceptibility to obesity:
57, 289–300. validation of the child eating behaviour questionnaire. Appetite 48, 104–113.
Birch, L. L., Fisher, J. O., and Davison, K. K. (2003). Learning to overeat: maternal doi: 10.1016/j.appet.2006.07.075
use of restrictive feeding practices promotes girls’ eating in the absence of Casey, B. J., Tottenham, N., Liston, C., and Durston, S. (2005).
hunger. Am. J. Clin. Nutr. 78, 215–220. doi: 10.1038/nrm2621 Imaging the developing brain: what have we learned about cognitive
Bleich, S. N., Jones-Smith, J., Wolfson, J. A., Zhu, X., and Story, M. (2015). development? Trends Cogn. Sci. 9, 104–110.doi: 10.1016/j.tics.2005.
The complex relationship between diet and health. Health Aff. 34, 1813–1820. 01.011
doi: 10.1377/hlthaff.2015.0606 Cumming, G. (2014). The new statistics: why and how. Psychol. Sci. 25, 7–29.
Blissett, J., Haycraft, E., and Farrow, C. (2010). Inducing preschool children’s doi: 10.1177/0956797613504966
emotional eating: relations with parental feeding practices. Am. J. Clin. Nutr. Cutting, T. M., Fisher, J. O., Grimm-Thomas, K., and Birch, L. L. (1999).
92, 359–365. doi: 10.3945/ajcn.2010.29375 Like mother, like daughter: familial patterns of overweight are mediated
Frontiers in Psychology | www.frontiersin.org 9 March 2021 | Volume 12 | Article 650046Giuliani and Kelly Delay of Gratification Predicts EAH in Preschoolers by mothers’ dietary disinhibition. Am. J. Clin. Nutr. 69, 608–613. Kelly, N. R., Jaramillo, M., Ramirez, S., Altman, D. R., Rubin, S. G., Yang, S. B., doi: 10.1097/00004583-199910000-00028 et al. (2020). Executive functioning and disinhibited eating in children and Dallman, M. F. (2010). Stress-induced obesity and the emotional nervous system. adolescents. Pediatr. Obes. 15:e12614. doi: 10.1111/ijpo.12614 Trends Endocrinol. Metab. 21, 159–165. doi: 10.1016/j.tem.2009.10.004 Kopp, C. B. (1982). Antecedents of self-regulation: a developmental perspective. Daniels, S. R. (2006). The consequences of childhood overweight and obesity. Dev. Psychol. 18, 199–214. doi: 10.1037/0012-1649.18.2.199 Future Child. 16, 47–67. doi: 10.1353/foc.2006.0004 Lenhard, W., and Lenhard, A. (2014). Hypothesis Tests for Comparing Deater-Deckard, K. (2014). Family matters: intergenerational and interpersonal Correlations. Bibergau: Psychometrica. Available online at: https://www. processes of executive function and attentive behavior. Curr. Dir. Psychol. Sci, psychometrica.de/correlation.html. 23, 230–236. doi: 10.1177/0963721414531597 Levitan, R. D., Rivera, J., Silveira, P. P., Steiner, M., Gaudreau, H., Hamilton, Devine, C. M., Connors, M., Bisogni, C. A., and Sobal, J. (1998). Life-course J., et al. (2015). Gender differences in the association between stop-signal influences on fruit and vegetable trajectories: qualitative analysis of food reaction times, body mass indices and/or spontaneous food intake in pre-school choices. J. Nutr. Educ. Behav, 30, 361–370. doi: 10.1016/s0022-3182(98) children: an early model of compromised inhibitory control and obesity. Int. J. 70358-9 Obes. 39, 614–619. doi: 10.1038/ijo.2014.207 Diamond, A. (2002). “Normal development of prefrontal cortex from birth Long, J. A. (2019). Interactions: Comprehensive, User-Friendly Toolkit for Probing to young adulthood: Cognitive functions, anatomy, and biochemistry,” in Interactions. R Package Version 1.1.3. Available online at: https://cran.r-project. Principles of Frontal Lobe Function, D. T. Stuss and R. T. Knight (Oxford: org/package=interactions Oxford University Press), 466–503. Lucan, S. C. (2015). Concerning limitations of food-environment research: Disantis, K. I., Hodges, E. A., Johnson, S. L., and Fisher, J. O. (2011). The role of a narrative review and commentary framed around obesity and responsive feeding in overweight during infancy and toddlerhood: a systematic diet-related diseases in youth. J. Acad. Nutr. Diet 115, 205–212. review. Int. J. Obes. 35, 480–492. doi: 10.1038/ijo.2011.3 doi: 10.1016/j.jand.2014.08.019 Eid, M., Gollwitzer, M., and Schmitt, M. (2011). Statistik und Forschungsmethoden Mangiafico, S. (2019). rcompanion: Functions to Support Extension Education. Lehrbuch. Basel: Beltz. Program Evaluation. R Package Version 2.3.7. Available online at: https://cran. Faul, F., Erdfelder, E., Buchner, A., and Lang, A.-G. (2009). Statistical power r-project.org/package=rcompanion analyses using G∗Power 3.1: Tests for correlation and regression analyses. McPhie, S., Skouteris, H., Daniels, L., and Jansen, E. (2014). Maternal correlates of Behav. Res. Methods 41, 1149–1160. maternal child feeding practices: a systematic review. Matern. Child Nutr. 10, Fisher, J. O., and Birch, L. L. (1999). Restricting access to foods and children’s 18–43. doi: 10.1111/j.1740-8709.2012.00452.x eating. Appetite 32, 405–419. doi: 10.1006/appe.1999.0231 Mei, Z., Grummer-Strawn, L. M., Pietrobelli, A., Goulding, A., Goran, M. I., and Fisher, J. O., and Birch, L. L. (2002). Eating in the absence of hunger and Dietz, W. H. (2002). Validity of body mass index compared with other body- overweight in girls from 5 to 7 y of age. Am. J. Clin. Nutr. 76, 226–231. composition screening indexes for the assessment of body fatness in children doi: 10.1093/ajcn/76.1.226 and adolescents. Am. J. Clin. Nutr. 75, 978–985. doi: 10.1093/ajcn/75.6.978 Freedman, D. S., Khan, L. K., Dietz, W. H., Srinivasan, S. R., and Berenson, Metcalfe, J., and Mischel, W. (1999). A hot/cool-system analysis of delay of G. S. (2001). Relationship of childhood obesity to coronary heart disease gratification: dynamics of willpower. Psychol. Rev. 106, 3–19. risk factors in adulthood: the Bogalusa heart study. Pediatrics 108, 712–718. Mirch, M. C., McDuffie, J. R., Yanovski, S. Z., Schollnberger, M., Tanofsky-Kraff, doi: 10.1542/peds.108.3.712 M., Theim, K. R., et al. (2006). Effects of binge eating on satiation, satiety, Gettens, K. M., and Gorin, A. A. (2017). Executive function in weight and energy intake of overweight children. Am. J. Clin. Nutr. 84, 732–738. loss and weight loss maintenance: a conceptual review and novel doi: 10.1097/WAD.0b013e3181aba588.MRI neuropsychological model of weight control. J. Behav. Med. 40, Mistry, P., Stirling, H., Callens, C., Hodson, J., and Batchelor, H. (2018). Evaluation 687–701.doi: 10.1007/s10865-017-9831-5 of patient-reported outcome measurements as a reliable tool to measure Grammer, J. K., Carrasco, M., Gehring, W. J., and Morrison, F. J. (2014). acceptability of the taste of paediatric medicines in an inpatient paediatric Age-related changes in error processing in young children: a school-based population. BMJ Open 8:e021961. doi: 10.1136/bmjopen-2018-021961 investigation. Dev. Cogn. Neurosci. 9, 93–105. doi: 10.1016/j.dcn.2014.02.001 Murray, K. T., and Kochanska, G. (2002). Effortful control: factor structure and Guo, S. S., Wu, W., Chumlea, W. C., and Roche, A. F. (2002). Predicting overweight relation to externalizing and internalizing behaviors. J. Abnorm. Child Psychol. and obesity in adulthood from body mass index values in childhood and 30, 503–514. doi: 10.1023/A:1019821031523 adolescence. Am. J. Clin. Nutr. 76, 653–658. doi: 10.1093/ajcn/76.3.653 Nederkoorn, C., Dassen, F. C. M., Franken, L., Resch, C., and Houben, K. (2015). Hill, C., Llewellyn, C. H., Saxton, J., Webber, L., Semmler, C., Carnell, S., et al. Impulsivity and overeating in children in the absence and presence of hunger. (2008). Adiposity and “eating in the absence of hunger” in children. Int. J. Obes. Appetite 93, 57–61. doi: 10.1016/j.appet.2015.03.032 32, 1499–1505. doi: 10.1038/ijo.2008.113 Nicklaus, S., Boggio, V., Chabanet, C., and Issanchou, S. (2004). A prospective Hofmann, W., Schmeichel, B. J., and Baddeley, A. D. (2012). Executive study of food preferences in childhood. Food Qual. Prefer. 15, 805–818. functions and self-regulation. Trends Cogn. Sci. 16, 174–180. doi: 10.1016/j.foodqual.2004.02.010 doi: 10.1016/j.tics.2012.01.006 Pieper, J. R., and Laugero, K. D. (2013). Preschool children with lower executive Howard, S. J., and Okely, A. D. (2015). Catching fish and avoiding sharks. J. function may be more vulnerable to emotional-based eating in the absence of Psychoeduc. Assess. 33, 585–596. doi: 10.1177/0734282914562933 hunger. Appetite 62, 103–109. doi: 10.1016/j.appet.2012.11.020 Hughes, S. O., Power, T. G., O’Connor, T. M., and Fisher, J. O. (2015). Executive R Core Team (2019). R: A Language and Environment for Statistical Computing. functioning, emotion regulation, eating self-regulation, and weight status R Foundation for Statistical Computing. Available online at: https://www.r- in low-income preschool children: how do they relate? Appetite 89, 1–9. project.org/. doi: 10.1016/j.appet.2015.01.009 Reimann, Z., Miller, J. R., Dahle, K. M., Hooper, A. P., Young, A. M., Goates, Huizinga, M., Dolan, C. V., and van der Molen, M. W. (2006). Age-related change M. C., et al. (2020). Executive functions and health behaviors associated with in executive function: developmental trends and a latent variable analysis. the leading causes of death in the United States: a systematic review. J. Health Neuropsychologia 44, 2017–2036. doi: 10.1016/j.neuropsychologia.2006. Psychol. 25, 86–196. doi: 10.1177/1359105318800829 01.010 Riggs, N. R., Chou, C. P., Spruijt-Metz, D., and Pentz, M. A. (2010a). Executive Institute of Medicine of the National Academies (2005). Dietary Reference Intakes cognitive function as a correlate and predictor of child food intake and physical for Energy, Carbohydrate, Fiber, Fat, Fatty Acids, Cholesterol, Protein, and activity. Child Neuropsychol. 16, 279–292. doi: 10.1080/09297041003601488 Amino Acids. Washington, DC: The National Academies Press. Riggs, N. R., Spruijt-Metz, D., Sakuma, K. L., Chou, C. P., and Pentz, M. A. (2010b). Johnson, S. L., and Birch, L. L. (1994). Parents’ and children’s adiposity and eating Executive cognitive function and food intake in children. J. Nutr. Educ. Behav. style. Pediatrics 94, 653–661. 42, 398–403. doi: 10.1016/j.jneb.2009.11.003 Juonala, M., Magnussen, C. G., Berenson, G. S., Venn, A., Burns, T. L., Sabin, M. Rueda, M. R., Fan, J., McCandliss, B. D., Halparin, J. D., Gruber, D. B., Lercari, A., et al. (2011). Childhood adiposity, adult adiposity, and cardiovascular risk L. P., et al. (2004). Development of attentional networks in childhood. factors. N. Engl. J. Med. 365, 1876–1885. doi: 10.1056/nejmoa1010112 Neuropsychologia 42, 1029–1040. doi: 10.1016/j.neuropsychologia.2003.12.012 Frontiers in Psychology | www.frontiersin.org 10 March 2021 | Volume 12 | Article 650046
Giuliani and Kelly                                                                                                         Delay of Gratification Predicts EAH in Preschoolers

Russell, C. G., and Russell, A. (2020). “Food” and “non-food” self-regulation in              year-olds. J. Exp. Child Psychol. 108, 436–452. doi: 10.1016/j.jecp.2010.
   childhood: a review and reciprocal analysis. Int. J. Behav. Nutr. Phys. Act. 17,           08.008
   33. doi: 10.1186/s12966-020-00928-5                                                     Willoughby, M. T., Kupersmidt, J., Voegler-Lee, M., and Bryant, D. (2011).
Shomaker, L. B., Tanofsky-Kraff, M., Savastano, D. M., Kozlosky, M., Columbo, K.              Contributions of hot and cool self-regulation to preschool disruptive
   M., Wolkoff, L. E., et al. (2010a). Puberty and observed energy intake: boy, can           behavior and academic achievement. Dev. Neuropsychol. 36, 162–180.
   they eat! Am. J. Clin. Nutr. 92, 123–129. doi: 10.3945/ajcn.2010.29383                     doi: 10.1080/87565641.2010.549980
Shomaker, L. B., Tanofsky-Kraff, M., Zocca, J. M., Courville, A. B., Kozlosky, M.,         Zelazo, P. D., Anderson, J. E., Richler, J., Wallner-Allen, K., Beaumont, J. L.,
   Columbo, K. M., et al. (2010b). Eating in the absence of hunger in adolescents:            Conway, K. P., et al. (2014). NIH toolbox cognition battery (CB): validation
   intake after a large-array meal compared with that after a standardized meal.              of executive function measures in adults. J. Int. Neuropsychol. Soc. 20, 620–629.
   Am. J. Clin. Nutr. 92, 697–703. doi: 10.3945/ajcn.2010.29812                               doi: 10.1017/S1355617714000472
Skinner, J. D., Carruth, B. R., Bounds, W., and Ziegler, P. J. (2002). Children’s          Zocca, J. M., Shomaker, L. B., Tanofsky-Kraff, M., Columbo, K. M., Raciti,
   food preferences: a longitudinal analysis. J. Am. Diet. Assoc. 102, 1638–1647.             G. R., Brady, S. M., et al. (2011). Links between mothers’ and children’s
   doi: 10.1016/S0002-8223(02)90349-4                                                         disinhibited eating and children’s adiposity. Appetite 56, 324–331.
Tan, C. C., and Lumeng, J. C. (2018). Associations between cool and hot                       doi: 10.1016/j.appet.2010.12.014
   executive functions and children’s eating behavior. Curr. Nutr. Rep. 7, 21–28.
   doi: 10.1007/s13668-018-0224-3                                                          Conflict of Interest: The authors declare that the research was conducted in the
Tanofsky-Kraff, M., McDuffie, J. R., Yanovski, S. Z., Kozlosky, M., Schvey, N. A.,         absence of any commercial or financial relationships that could be construed as a
   Shomaker, L. B., et al. (2009). Laboratory assessment of the food intake of             potential conflict of interest.
   children and adolescents with loss of control eating. Am. J. Clin. Nutr. 89,
   738–745. doi: 10.3945/ajcn.2008.26886                                                   Copyright © 2021 Giuliani and Kelly. This is an open-access article distributed
van Buuren, S., and Groothuis-Oudshoorn, K. (2011). mice: multivariate                     under the terms of the Creative Commons Attribution License (CC BY). The use,
   imputation by chained equations in R. J. Stat. Softw. 45, 1–67.                         distribution or reproduction in other forums is permitted, provided the original
   doi: 10.18637/jss.v045.i03                                                              author(s) and the copyright owner(s) are credited and that the original publication
Wiebe, S. A., Sheffield, T., Nelson, J. M., Clark, C. A. C., Chevalier,                    in this journal is cited, in accordance with accepted academic practice. No use,
   N., and Espy, K. A. (2011). The structure of executive function in 3-                   distribution or reproduction is permitted which does not comply with these terms.

Frontiers in Psychology | www.frontiersin.org                                         11                                             March 2021 | Volume 12 | Article 650046
You can also read