"Child Health, Plagues, Agricultural Shocks, Differences-in-Differences." Bruno Conte, Lavinia Piemontese and Augustin Tapsoba - 1069 January 2020
←
→
Page content transcription
If your browser does not render page correctly, please read the page content below
1069

                                 January 2020

“Child Health, Plagues, Agricultural Shocks,
       Differences-in-Differences.”

  Bruno Conte, Lavinia Piemontese and
          Augustin Tapsoba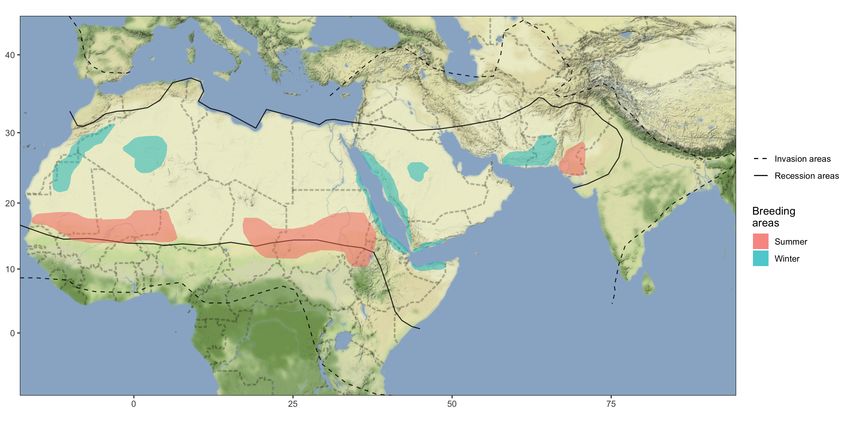
Ancient Plagues in Modern Times:

         The Impact of Desert Locust Invasions on Child Health∗

          Bruno Conte†             Lavinia Piemontese‡                Augustin Tapsoba†§

                                         December 2, 2019

                                               Abstract
        This paper estimates the causal impact on child health of a locust plague that oc-
        curred in Mali during the mid 2000s. Using a Difference-in-Differences strategy, we
        show that children who were exposed in utero to the plague suffer major health set-
        backs. Affected children have, on average, a height-for-age Z-score 0.33 points lower
        than non-exposed children. We argue that, in this type of agricultural economy,
        locust invasions could have an impact on child health mainly through two channels:
        first, a speculative/anticipatory price effect that kicks in during the plague itself, fol-
        lowed by local crop failures effect that would constitute an income shock for affected
        farmers and a local food supply shock for markets. We find that children exposed
        only to the speculative price effect in utero suffer as much as those exposed to the
        actual crop failure effect.

      Keywords: Child Health, Plagues, Agricultural Shocks, Differences-in-Differences.

      JEL Codes: I15, O12, Q12, Q18.

  ∗
     We are very thankful to Joan Llull and Hannes Mueller for their support and invaluable guidance.
We acknowledge the very useful comments from Oriana Bandiera, Andre Groeger, Ada Ferrer-i-Carbonell,
Ana Rute Cardoso and Pau Milán. We also would like to thank the participants of the ENTER exchange
seminar in Mannheim, the Einaudi Foundation in Turin, the Barcelona GSE Jamboree, the UAB Applied
seminars series, and the UPF Political Economy reading group. All errors are ours.
   †
     bruno.conte@barcelonagse.eu Universitat Autònoma de Barcelona and Barcelona GSE
   ‡
     lavinia.piemontese@ens-lyon.fr University of Lyon, ENS Lyon, GATE Lyon/St-Etienne
   §
     augustin.tapsoba@tse-fr.eu Toulouse School of Economics

                                                    1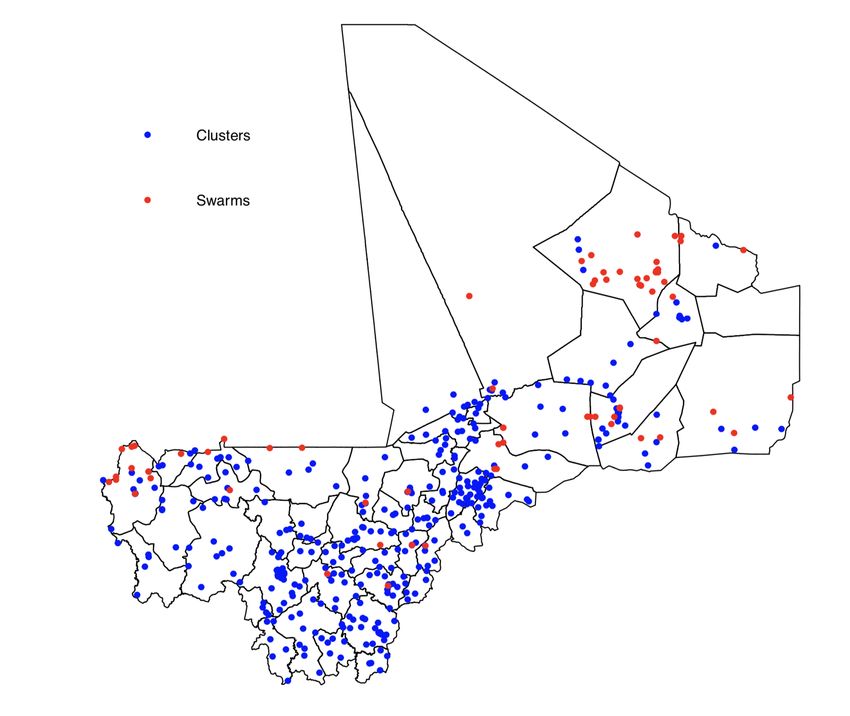
1         Introduction

Climate change is receiving considerable attention both from the media and the academic com-

munity. One of its consequences is an increase in the likelihood and intensity of extreme weather

conditions, which in turn can lead to severe agricultural shocks. These shocks can affect the

households that are relying on local agricultural production, with serious repercussions for young

children. This is due to the fact that conditions experienced early in life have long-lasting effects

on various socioeconomic outcomes. In particular, it is well established that harsh conditions

experienced in utero can have detrimental and persistent effects on individual health throughout

the whole life cycle (Stein et al., 1975). This concept, known as the fetal origins hypothesis,

implies that it is harder to remedy bad fetal health later on in life.1

        In this paper we study the impact, on child health, of exposure to a specific type of agricultural

shock that is indirectly linked to extreme weather conditions and climate change: the damage

caused by desert locust plagues.2 Locust swarm invasions are destructive events that recurrently

put at risk food supply in many developing countries (Brader et al., 2006). They are caused by

a specific species of grasshoppers that usually live, in their solitary phase, around the Sahara

desert. Under favorable breeding conditions (excess rainfall), these grasshoppers go through a

gregarization process with substantial changes in their behavior, morphology and physiology.

They become more voracious and can grow into huge swarms that travel to less arid areas to feed

    1
      On the one hand Almond and Currie (2011) provide an excellent review on the fetal hypothesis
theory and its theoretical relation to later life outcomes. On the other hand, the empirical literature has
successfully documented the impact of adverse in utero conditions on infant mortality (Kudamatsu et
al., 2012; Dagnelie et al., 2018), child health (Akresh et al., 2011, 2012a; Bundervoet et al., 2009), adult
health (Akresh et al., 2012b; Maccini and Yang, 2009), and adult socioeconomic outcomes such as literacy,
educational attainment, income and labour market status among others (Almond et al., 2007; Alderman
et al., 2006; Lavy et al., 2016).
    2
      The direct consequence of extreme weather conditions and climate change on agricultural production
is through crop failure due to droughts or floods.

                                                      2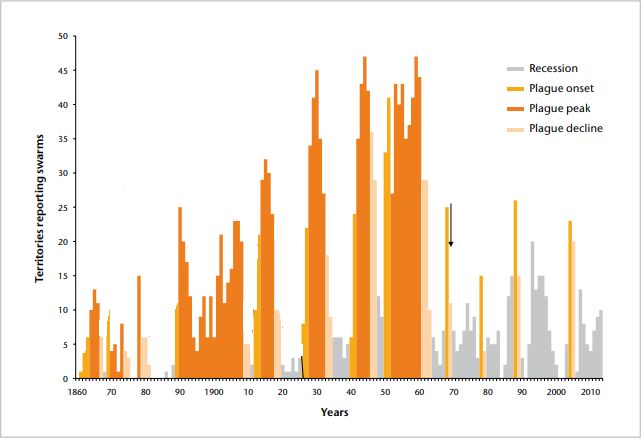
and reproduce causing devastating effects on agricultural production.3

       We study whether early-life exposure to the most recent plague that occurred in Mali, between

July and October 2004, led to detrimental effects on child health. While the impact of food

shortage on child health has been explored extensively in the literature, uncovering the channels

through which agricultural shocks impact health is still a standing question. We make a step in

this direction, arguing that this type of pest invasion can affect households living in areas with

a single harvest per year through two main channels. First, there is a speculative price effect

that could kick in immediately during the growing season in which the plague is occurring in

anticipation of the upcoming harvest failure. At this point, households and markets are still

relying on the harvest from the previous agricultural season. However, crop destruction by the

pest in the ongoing season could lead to an anticipation of a future crop supply shock and drive

up prices in local markets. Second, there is the actual crop failure effect that would constitute

an income shock for farmers and a supply shock for markets after the harvest of affected crops.

This effect should last at least until the following harvest.4

       We are able to explore these mechanisms by making use of a minutely identified agricultural

shock. Specifically, we rely on the exact timing and the precise location of locust swarm events to

identify the temporal and spatial variation in the exposure of different birth cohorts to the 2004

locust plague in Mali. We use geocoded household survey data with detailed information on birth

history and health outcomes of children from the Demographic and Health Surveys (DHS). Data

on the timing and location of locust swarm invasions comes from the locust monitoring system

run by FAO Desert Locust Information Service (DLIS).

   3
     Beyond the direct effect of extreme weather conditions on agricultural production, here we consider
how such unusual whether conditions could affect agricultural production in an entire region. We focus
in particular on the consequences of desert locust plagues that occur as a consequence of such extreme
weather conditions in arid areas around the Sahara desert.
   4
     Locust plagues can also have a persistent effect if, for instance, the failed harvest in a given agricultural
season affects the quality of seeds used for the next one. We found no evidence of such long-term effect.

                                                        3
Using a Difference-in-Differences identification strategy, we show that children exposed in
utero to the adverse effects of the locust plague suffer major health setbacks. Exposed children
have, on average, a height-for-age Z-score 0.33 points lower than non-exposed children. We
find no impact for cohorts of children exposed to the shock after birth. We also study the
timing of the estimated effect and we show that cohorts of children that were subject only to the
speculative price effect in utero suffer as much as those exposed to the actual crop failure effect.
Our results are robust to specifications that include region-specific time trends, household and
mother characteristics, climate shocks, and mother fixed effects. They are also not affected by
issues of endogenous migration.
This paper belongs to two main strands of the economic literature. First, it contributes to
the literature on the importance of early life conditions (Lavy et al., 2016; Maluccio et al., 2009;
Black et al., 2007; Behrman and Rosenzweig, 2004; Stein et al., 1975). A substantial part of it
focused on identifying the effect on child health of exposure to weather shocks (Maccini and Yang,
2009), civil wars (Dagnelie et al., 2018; Valente, 2015) or adverse institutional setup (Kudamatsu,
2012). We complement this literature by investigating the impact of desert locust plagues on child
health. One of the novelties of our analysis relies on the use of a shock characterized by a clear-
cut spatial and temporal variation, i.e. geolocated locust swarm invasions. Moreover, this is the
first paper, to the best of our knowledge, to shed lights on the channels through which such pest
invasion can affect households. In particular, we provide evidence of a clear distinction between
the purely speculative price effect and the actual crop failure effect of the exposure to the swarm
invasions. We also show that this shock has long-lasting health effects on children exposed in
utero, but no effects after birth. Through several alternative specifications of our model, we show
that the adverse effects are present for both male and female children. This contrasts with recent
evidence in the literature on early life development, which generally finds larger adverse effects
on females (Lavy et al., 2016; Akbulut-Yuksel, 2017; Dagnelie et al., 2018).
4Second, this paper clearly adds to the literature that studies the consequences of negative
agricultural shocks caused by pest invasions. Baker et al. (2018) show that the boll weevil’s pest
invasion that affected US cotton production from 1892 to 1922 led to an increase in educational
attainment due to reduced opportunity cost for schooling. Banerjee et al. (2010) show that
phylloxera invasion in 19th century France affected wine production and led to substantial effects
on adult height for people born in affected areas in that period. De Vreyer et al. (2014) used
locust plague invasion in 1987-1989 in Mali to show that it had a long term effect on educational
attainment. Our paper is closer to the latter, since we study the consequences of invasions of the
same pest species but on a different outcome, and, as argued above, we provide the first evidence
on the mechanisms through which pest invasion can affect households.
The remainder of this paper is organized as follows. Section 2 provides some background on
the 2003-05 locust plague in Western Africa and its relation to food shortages and child health in
Mali. Section 3 presents the data used for the empirical analysis. Section 4 discusses the channels
through which locust invasions can affect the well-being of households. Section 5 presents the
empirical strategy used and Section 6 shows the results obtained. Section 7 concludes.
2 Background
In this section we describe the context of our analysis. We first provide a general description
about the desert locusts, their habitat and their relation with climatic conditions that can turn
them into an agricultural plague. We then provide some details of the locust plague that took
place in the Sahel region in the mid 2000s, stressing on its consequences in Mali.
2.1 Desert Locust Plagues
Desert locusts are insects that live in the arid and hyper-arid zones of the Sahel region, northern
Africa, Middle East and southeast Asia, as shown in Figure 1. They pertain to the family of
5grasshoppers and normally inhabit desert zones, called recession areas (bounded by the black
solid line in Figure 1), in a solitary, harmless and integrated way with the local ecology. What
makes them different from traditional grasshoppers is their capacity to mutate physically and
change behavior under certain conditions. In particular, if specific areas called breeding areas
(green and ocher areas in Figure 1) experience periods of excessive rainfall, followed by periods
of relatively mild temperatures, a process of fast reproduction takes place. The high density of
locusts combined with a relative shortage of vegetation induce them to a gregarious stage: the
locusts mutate physically and start behaving as a unique group, known as a swarm.
Upon gregarisation, these groups become more and more voracious and reproduce faster. If
needed, locust swarms will fly away to find a location with vegetation for feeding and appropriate
conditions for reproducing. Within a few weeks after settling in a suitable new location, there can
be a new generation of gregarious locusts. The increase in the size of the swarm can be remarkable:
the incorporation of locusts from the new generation can lead up to a ten-fold increase in the
size of the swarm (FAO, 2004). If breeding conditions are favorable and in absence of human
intervention, the density of a swarm can become extremely high, having over a billion insects.
Desert locusts swarms are very threatening because, while flying in search of new locations for
feeding and reproducing, they end up following winds that move them away from the most desert
areas of the Sahara. Usually, the winds blow them towards the central Sahelian and tropical
areas in the South or the Mediterranean regions in the North. These invasion areas, shown in
Figure 1 by the dashed red line, span over more than 50 countries and have a total surface of
about 29 million square km (Herok et al., 1995). These zones are more densely populated and are
used for agricultural production. Thus, crop yields and/or pasture vegetation can be partially
or totally consumed by the swarms, potentially threatening the food supply of entire regions5 .
5
A locust swarm can cover from one to several hundred square km, and each square km of the swarm
6Moreover, the fact that the swarms can fly for very long distances, over hundreds of kilometers
in a single day, implies that favorable conditions for gregarisation in one place can create severe
repercussions in relatively far away locations.
If climate conditions remain favorable for a long time within large geographic areas, the
swarming, breeding and migration behaviour of locusts can create a regional plague, i.e. when
locust swarms multiply exponentially in size and number and spread over several countries. If
so, food security in multiple countries can be under risk. Moreover, fighting the plague in these
circumstances is extremely difficult and costly. Fortunately, such events are not very recurrent
nowadays – as seen in Figure 2, there has been relatively little plague peaks from 1970 vis-a-
vis the preceding period. This reduction is associated to active human preventive intervention
(Cressman and Stefanski, 2016). The ones that managed to take place since the 1970, however,
happened to be extremely severe. This is the case of the plague occurred between 2003 and 2005,
whose consequence we analyse in this paper.
has at least 40 million locusts. A one square km swarm can consume daily the equivalent food consumption
of 35,000 people (Symmons et al., 2001)
7Figure 1: Affected Areas
Note: Authors’ calculation based on Cressman and Stefanski (2016)
Figure 2: Historical plagues
Source: Cressman and Stefanski (2016)
2.2 The 2003-2005 Desert Locust Plague
The 2003-2005 desert locust plague started from optimal climate conditions occurred in late 2003
and escalated to a massive plague throughout the entire Western Africa in 2004 (Ceccato et al.,
82007), peaking in the third quarter of that year. Importantly, it developed from independent
outbreaks that took place in different locations, taking the international prevention community
by surprise (Cressman and Stefanski, 2016). Figure 3 illustrates the extension of the plague
in terms of number of swarm events and geographical coverage. It affected multiple countries,
mostly in West Africa and North Africa, but also in central and eastern territories.
The 2003-2005 locust plague created a regional food crisis that involved more than eight
million people in the whole Sahel region, implying a huge cost. On top of its direct cost (that
includes the agricultural lands and the crops damaged), of which there is not a precise estimate,
there was a substantial collateral cost of more than 400 million dollars needed to control the
invasion (Brader et al., 2006). This loss does not include the indirect cost that the plague entailed,
such as forgone investment for other national development activities or significant increase of food
prices (Brader et al. (2006) and FAO (2005a)).
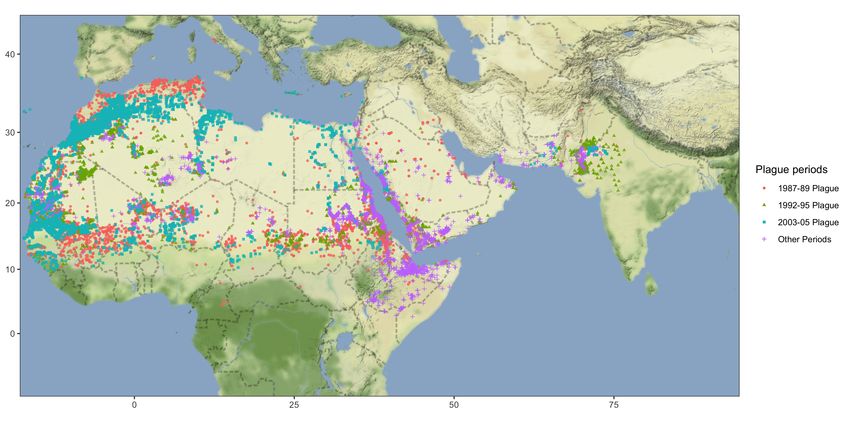
Figure 3: Geographical Distribution of Locust Swarms from 1985 to 2016.
Source: SWARMS data base from FAO Desert Locust Information Service. See Section 3.
92.3 The case of Mali
Mali is a landlocked country in West Africa with a surface of about 1.2 million square km, spread
in latitude across three different climate zones: the desert zone (Saharan), the transition zone
(Sahel) and the tropical zone. As Figure 1 depicts, a substantial part of its territory is a locust
breeding area, which makes it very likely to experience (or be invaded by) locust swarm outbreaks.
This country constitutes a relevant case study for our analysis for several reasons: first, as
mentioned above, Mali is located in a very risky area in terms of likelihood of experiencing locust
plague invasions. Second, the pattern of the 2003-2005 swarm invasions was unevenly spread over
its territory, allowing us to exploit this spatial variation together with variation in the timing of
the plague in our empirical exercise. Third, this country was, by then, a very poor agricultural
economy.
Table 1 provides an overview of the country (we use data published by the World Bank).
Mali is classified as a low-income country, with a GDP per capita ranked 160th , with more than
the 40% of its population below the poverty line. Malian population, of approximately 19 million
individuals, is largely present in rural areas (about 60% and almost 69% in 2004, the most intense
year of the locust plague). Mali is strongly dependent on agriculture, which accounts for about
40% of its GDP (in the 2004 this share was 30%) and is still largely composed by small-scale
subsistence farming. As such, a large share of its population is vulnerable to agricultural hazards
such as droughts and plagues.
10Table 1: Overview of Mali
Most recent value 2004 value
Population (million) 19.08 12.37
Rural population (% of total population) 57.64 68.70
GDP per capita, PPP (constant 2011 USD) 2,056.00 1,710.11
Poverty headcount ratio at national poverty lines (% of population) 41.1 41.7
Life expectancy at birth (years) 67.48 51.22
Agriculture, forestry, and fishing, value added (% of GDP) 38.53 30.02
Data source: The World Bank country data. The most recent value for variables “Population”, “Rural Population”,
“GDP per capita”, “Life expectancy”, “Agriculture, forestry, and fishing, value added” is year 2018. Since there is no
available time series for variable “Poverty headcount ratio at national poverty lines”, its most recent value is year 2009,
while its 2004 value corresponds to year 2006.
Not surprisingly, Mali was among the countries that have been mostly damaged by the locust
plague of 2003-2005. According to Brader et al. (2006), 1 million people were affected by the locust
swarm invasion object of this study. Exact estimates of the agricultural losses are not available,
but the existing evidence suggests that the plague had devastating effects. Brader et al. (2006)
states that in Mali, the losses caused by the 2003-2005 plague have been evaluated at 90% of the
expected cereal production in the zones investigated, moreover one-third of the pastures were lost
in the same areas. By mid-2005, FAO (2005b) reported alarming increases in cereal prices and
a deterioration of conditions for livestock production in both countries. Moreover, the poorest
households suffered the most from this situation as the report states that by the mid 2005, "access
to main food staples [was] increasingly difficult for vulnerable households and pastoralists. Severe
child malnutrition [was] increasing rapidly." (FAO, 2005b).
113 Data and Descriptive Statistics
In order to study how child health was affected by exposure to locust plagues in Mali, we collected
data from three different sources: (i) information on locust swarms are obtained from a rich
database of worldwide locust monitoring, (ii) data on children anthropometrics is gathered from
DHS, a widely used household survey, and (iii) we complement these two data sources with
climate data and other geographical characteristics at the spatial cell level from PRIO-GRID
dataset.
3.1 Locust Swarm Data
We collect geographical and temporal incidence of locust swarms from the SWARMS database
(Cressman, 1997). SWARMS contains historical geocoded information on many “locust param-
eters” including local breeding conditions, the incidence of adult locusts, hopper bands, swarms,
and many others. For this application, we select information exclusively on locust swarms.
Therefore, for each event related to the presence of a locust swarm, we collect the date and the
geographic coordinates in which the event occurred.
The SWARMS system is held and maintained by the FAO Desert Locust Information Service
(DLIS) Unit. This unit is monitoring, preventing and controlling locust incidence in the Sub
Saharan Africa for over 60 years. For this, a national office at each of the countries in the
region conducts field activities. These activities include field incursions into areas prone to locust
incidence and reproduction to search for (and code if found) locust bands and swarms. The
coding is done in-field with a satellite-based technology; the information is automatically sent to
the FAO-DLIS headquarters to be further cleaned if necessary. The data is complemented with
information from local villages which self-report to field officers and/or the national DLIS office.
The resulting data on the incidence of locust swarms spans from 1985 to 2016 and covers
43 countries. Figure 4 shows the distribution of locust swarm incidence over time. It is quite
12consistent with the historical evidence of locust plagues (Figure 2), i.e. there are two main
peaks of events involving swarms in late 1980s and mid 2000s. Analogously, the geographical
distribution of the swarms is also consistent. As seen in Figure 3, most of the events from the
1987-89 and 2003-05 plagues are concentrated in the Western/North-Western Africa, as expected.
The same holds for the events from the 1992-1995 upsurges in the Horn of Africa and South Asia,
and the most recent plagues in the Horn of Africa. As the interest of this study is the plague of
2003-2005, we filter from this dataset only events from these years. In Mali, approximately the
90% the total number of the locust swarms related events took place in 2004, therefore in our
analysis we use events from 2004 only.
Figure 4: Quarterly Sum of Locust Swarms (in logs) for all regions from 1985 to 2016.
Source: SWARMS data base from FAO Desert Locust Information Service. See Section 3.
The consistency of the SWARMS data in the temporal and spatial dimensions does not rule
out the possibility of measurement error. The first challenge concerns the potential issues that
the DLIS National Offices could face to keep field operations consistently and evenly over time
13and across different countries. Secondly, the political instability and/or the incidence of civil
conflicts in many Sub Saharan Africa countries could weaken the operational capacity of field
teams. These sort of complications could lead to miscoding and lack of data in specific areas
and/or time periods. We rule out these possibilities in our study for two main reasons. First of
all, we verified that for our case study during the time period of our analysis (Mali in mid 2000s)
the National Desert Locust Offices have not faced drastic changes and other difficulties that could
affect its field operations.6 Regarding the potential issues linked to political instability, during
the time period of interest, there have not been political crisis and/or civil wars in the region of
study.
3.2 Children Anthropometrics Data
Information on child health in Mali is obtained from the Demographic and Health (DHS) Sur-
veys. DHS surveys are being conducted in many developing countries since late 1990s with a
standardized and nationally representative data collection methodology. The interviews target
female individuals, aged from 15 to 49 years old. For a subsample of respondents’ children aged
up to 5 years old, anthropometrics as height and weight are collected by trained surveyors. Impor-
tantly, children height are provided in Z-scores, i.e. the difference between the child’s height and
the mean height of the same-aged international reference population, adjusted by the standard
deviation of the reference population.
Moreover, DHS surveys provide GPS coordinates of the household location, called cluster.7
These coordinates are released with a random noise for privacy reasons (set to up to 2 km for
clusters located in urban areas, 5 km for those in rural areas, and 10 km for 1% of the latter).
6
This information was provided unofficially by an Information Officer at the DLIS office at FAO, Rome.
7
Empirical work using DHS data also call the clusters as enumeration areas or locations. We use the
terminology of DHS cluster or enumeration area without distinction.
14The locations of the clusters are drawn independently – thus differ – in each DHS wave. In order
to have a geographical unit that is comparable across waves, we also collect the coordinates of
the 0.5o grid cell that each cluster lays over.
In this analysis we use wave V and wave VI of DHS survey, whose interviews took place in
2006 and 2012/13 respectively. Therefore, children who were measured during the interviews
belong to birth cohorts from 2001 to 2013, covering the period of the plague. In particular,
children measured in the first wave are those whose cohort of birth can potentially coincide with
the plague period. Children from the second wave, instead, are too young to have been exposed.
To enrich the set of variables available, the data of each child was linked to its household and
mother’s characteristics.
To have a broad picture of the socioeconomic conditions of our population of interest, Table 2
provides some descriptive statistics of the household and mothers characteristics. We distinguish
between households located in areas exposed to the locust plague and the remaining ones8 . Table
2 suggests that there are not remarkable differences between treated households and the remaining
ones. On average, surveyed households are headed by people in their early 40s and the gender
distribution of head of household is even. More than the 70% of the surveyed households are
located in rural areas. Concerning the distribution of wealth, compared to the control group, the
treatment group has 5% less poor household and 5% more rich household. On average, mothers
are slightly more than 160 cm tall, have a very low education level, i.e. only one year, and have
more than two children aged 5 years or younger.
8
An area is defined as exposed if it is located within 30 km from at least one locust swarm event during
the plague.
15Table 2: Descriptive statistics
Treatment Control Difference Standard Error
Age of head of household (years) 41.66 41.70 -0.04 0.28
Head of household is female (percentage) 49.59 49.21 0.39 1.18
Poor 35.82 41.53 -5.33*** 1.16
Wealth of household (percentege by cathegory) Middle 21.28 20.89 0.39 0.96
Rich 42.90 37.95 4.95*** 1.15
Rural residence (prercentage) 71.98 72.30 -0.32 1.06
Height (in centimeters) 162.70 161.12 1.11*** 0.17
Education (years) 0.95 1.00 -0.05 0.06
Number of children 5 years old and under 2.30 2.29 0.02 0.01
Number of observations 12,118 2,091
Source: DHS data, Mali waves 2006 and 2012. The table reports average values of each variable, computed for the treatment and
the control groups. The former group consists of households located within a 30 kilometers from a locust swarm event. The third
column reports the difference between the averages of treatment and control group for each variable. The fourth column reports
the standard error of the difference. *** pFigure 5: Locust invasion and household clusters in Mali
Source: SWARMS data base from FAO Desert Locust Information Service and DHS data, Mali waves
2006 and 2012.
17Precipitation-Evapotranspiration Index (SPEI), a multiscalar drought index which considers the
joint effects of precipitation, potential evaporation and temperature (Vicente-Serrano et al., 2010).
This allows us to take into account the fact that the impact of rainfall on the growing cycle of a
plant depends on the extent to which water can be retained by the soil.9 This dataset is available
at the 0.5 × 0.5 degrees, and so matched to the household coordinates.
4 Effect of Locust Invasions on Child Health: Three
Potential Channels
In this paper, we are interested in understanding how early life exposure to the 2004 desert locust
plague could have affected child health using data from Mali. The mechanism that links the two
elements is economic – as mentioned above, the plague of interest created a severe food crisis in
Mali. We expect that to translate into a shock to the caloric intake at the household level, which
in turn would hinder the development of young children.
The relation between the timing of the exposure to the plague and food shortage is, however,
not straight forward. The agricultural production has a cyclical nature, following a region specific
seasonal calendar. Crop damages caused by locust swarms in a period of time might not affect
the food supply at that moment if markets are still relying on previous season’s production.
Therefore, to understand how the 2004 plague could have affected households in Mali, we first
need to understand on which harvest households and markets were relying in each period.
Figure 6 shows the seasonal agricultural calendar in Mali (FEWS-NET, 2005). It starts with
soil preparation between March and May followed by planting in May-June. The growing season
9
See Appendix A3 for a description of how we construct index of local weather shocks using SPEI
index.
18Figure 6: Seasonal Calendar
Source: FEWS-NET (2005)
happens between July and September and harvest period is in October/November. Given that
the 2003-2005 plague infested parts of Mali during the third quarter of 2004, the locust swarms
could have affected substantially the planting and the growing season of the 2004 agricultural
season, scheduled to be harvested in October of that year. Food supply on local markets before
October 2004 came from harvest of the previous year and should not have been affected by the
plague. Acknowledging this, we identify three potential channels through which locust invasion
could have affected households: (i) a speculative price effect, (ii) a local crop supply/income
shock effect, and (iii) a potential long term effect on agricultural production.
4.1 Speculative price effect
Between July and October 2004, the peak of the plague, households and markets were still relying
on agricultural production from the previous season, harvested by the end of 2003. Therefore,
there was no threat to food supply in this time window. However, there could have been a
speculative price effect in anticipation of the imminent harvest failure in locust affected areas.
The mere exposure to the plague could have led to severe inflation of local crop prices and
harm households with limited resources, especially because the plague happened during the lean
season.10 There is substantial evidence that suggest that this was actually the case. Several crisis
monitoring reports on the plague document in fact a steep rise of crop prices in locust affected
areas before the harvest of 2004 (FAO (2005a), FAO (2005b). It is therefore possible, for instance,
10
The lean season is a period of seasonal poverty in rural areas between planting and harvest periods
when stocks of food are the lowest, there is no income and families often miss meals.
19that children that were in utero during the third quarter of 2004 were affected by this speculative
price effect even though markets and households were still relying on harvests not affected by the
plague.11
This speculative price effect will be a negative shock for households that are net buyers of
local crops in that period, but a positive income shock for those that are net sellers. Net sellers
during the lean season in Mali are typically a small share of relatively rich households that buy
local crops after each harvest and sell them throughout the year on the markets. In absence
of any information on the economic activity of household members, the effect that we estimate
will be an average effect that might be attenuated by the positive income effect from net sellers
depending on their relative size. This attenuation effect might also occur in the actual crop failure
effect described next.
4.2 Local Crop Supply/Income Shock Effect
The harvest that was directly affected by the locust swarms was gathered between October and
November 2004. Households and local markets had to rely on this potentially bad harvest until
the next one, gathered in October 2005. We can therefore expect that areas affected by locust
invasions have been treated during all this period by the actual local crop supply shock. This
agricultural production shock could have negatively affected all households that are net buyers of
local crops through the increase in market prices. It could have also harmed farming households
that had their fields invaded by the swarms (a direct income shock).12
The absence of data on crop prices at local level prevents us from disentangling the price
effect that comes from crop supply shock from the income shock effect in the period when house-
11
Lack of data availability on local crop prices in this period for Mali prevents us from controlling
explicitly for prices in the analysis that follows.
12
Locust swarms can also affect livestock farmers through a decrease in available pasture.
20holds are relying on locust affected harvest. However, we are still able to test whether there is
any speculative price effect during the few months when the locust invasion is happening and
households are still relying on the previous harvest.
4.3 Potential Long Term Effect on Agricultural Production
The adverse effects of the plague should have disappeared after the harvest of November 2005,
unless the crop failure in 2004 affected the quality of seeds used for the next harvest, or the income
shock led to a depletion of productive assets (livestock, for instance). This would have led to
a persistent effect, in the medium-run, on household food availability. We found no evidence
suggesting that subsequent harvest suffered from locust swarm. First, there is no account of such
effect from reports produced by agencies such as FAO. Moreover, we will show empirically in
next sections that there are no differences in health status between children born in the locust
affected areas and children born in non-affected areas, after the harvest of 2005.13
5 Empirical Strategy
We adopt a Difference-in-Differences approach to estimate the causal impact of locust invasions
on child health. First, we define treatment and control groups at enumeration area level, by
setting as treated, clusters within 30 kilometers of a locust swarm event. Then, we exploit all
the available variation in childhood exposure to treatment across enumeration areas and birth
cohorts.
13
We cannot completely rule out the possibility that the asset depletion channel may have impacted
substantially a certain share of households. However, since we do not find any evidence of a persistant
effect in the data, we conclude that, if anything, the size of this share of household was marginal.
21We estimate the following model:
(1) (2)
yi(h,t,e) = γTi(t,e) + µe + βt + θhh Xh + θ1 Xi(h,t,e) + θ2 Xi(t,e) + i(h,t,e) , (1)
where i denotes a child belonging to cohort t (year-month), born in household h who lives in
enumeration area e.14 The dependent variable yi(h,t,e) measures height-for-age Z-score of child
i. The treatment variable is Ti(t,e) , a dummy that takes a value of one if child i belongs to an
enumeration area in the treatment group and has been exposed in utero to the adverse effects of
the plague, i.e. being born between July 2004 and June 2006 in a locust affected area.
We control for µe and βt that are enumeration area and birth cohort fixed effects respectively.
(1) (2)
Xi(h,t,e) and Xi(t,e) are observable characteristics at individual level (gender, birth order among
siblings, age gap with direct older and younger siblings, etc.) and enumeration area level (Stan-
dardized Precipitation-Evapotranspiration Index (SPEI) drought index), respectively. Finally,
Xh is a vector that includes household level controls, such as gender and age of household head,
wealth index of household, education of the mother. Standard errors are clustered at the 0.5◦
grid cell level (see section 3.2).
In the baseline specification of the model in equation 1, we control only for enumeration area
fixed effects to account for permanent unobserved characteristics of the place of residence and
cohort fixed effects to account for cohort specific shocks, whereas the full version of the model
includes controls for the relevant household and child characteristics.
Our coefficient of interest is γ, which measures the average difference in changes of height-
for-age Z-scores of children born in locust infested areas and children born in non-infested areas,
14
We omit from the notation, for neatness, the grid-cell g where enumeration area e lays over (see
section 3.2). When estimating the model (1) with the two DHS waves, we replace the cluster fixed effects
by grid cell fixed effects in order to compare geographical units consistent across waves. In that case, we
add to (1) a dummy for treatment status at the cluster e level.
22holding constant all the other relevant characteristics. The implicit assumption behind this
identification strategy is that, after controlling for cohort and enumeration area fixed effects,
household characteristics, and other relevant exogenous covariates, changes in height-for-age Z-
scores would be similar across locust infested areas and non-infested areas in absence of the
plague. Given that we control for cohort and enumeration area fixed effects, the coefficient γ
does not represent the national impact of locust plague but the average effect with respect to
local and cohort averages.
6 Empirical Results
6.1 Main Results
Table 3 displays the point estimates of γ in Equation 1. Column (1) shows the estimated co-
efficients of the baseline specification of our model, in which we control only for location fixed
effects and cohort fixed effects. The variable of interest is a dummy equal to one for children born
in locust affected areas between July 2004 (beginning of locust plague) and June 2006, i.e. the
last cohort of children that relied on the 2004-2005 agricultural campaign harvest while in utero.
Estimates are negative and statistically significant. They are robust and remain significant after
progressively adding controls for child characteristics in column (2) and family characteristics in
column (3). Our main specification in column (3) suggests that exposed children have, on aver-
age, a Z-score 0.33 points below the one of non-exposed children. This represents approximately
a 25% decrease in the average Z-score for children in our sample and a 27.5% increase in the
average stunting rate.15
15
Stunting rate is defined as the share of children with height-for-age Z-score smaller than -2 standard
deviations. Average stunting rate in our sample is 33%.
23The estimated impact γ is also robust to the inclusion of region-specific time trends (Column
(4)). Column (5) restricts the estimation sample to children measured only during the 2006 wave,
hence we use older cohorts born before 2004 as non-treated cohorts to build the counterfactual
trends. Column (6) does the opposite by restricting the estimation sample to children born after
2004. In this case, non-treated cohorts are younger cohorts born after June 2006. Results remain
stable in both specifications.
24Table 3: Impact of Locust Plague on Child Health
(1) (2) (3) (4) (5) (6)
Height-age Z-score Height-age Z-score Height-age Z-score Height-age Z-score Height-age Z-score Height-age Z-score
In utero treatment -0.391*** -0.354*** -0.331*** -0.323*** -0.384*** -0.308***
(0.099) (0.100) (0.101) (0.098) (0.114) (0.101)
Observations 14,175 14,175 14,175 14,175 9,571 9,904
Average Height-age Z-score -1.28 -1.28 -1.28 -1.28 -1.36 -1.16
R-squared 0.182 0.203 0.226 0.227 0.254 0.249
Cohort FE YES YES YES YES YES YES
Location FE YES YES YES YES YES YES
Region-specific time trends NO NO NO YES NO NO
Child characteristics NO YES YES YES YES YES
Family characteristics NO NO YES YES YES YES
Full set of controls includes mother’s height, education, gender and age of household head, household wealth index, SPEI index, birth order, time gap be-
25
tween conception and the previous and following pregnancies. Robust standard errors in parentheses are clustered at enumeration area level. *** p6.2 Timing of the Estimated Effect, Channels and Placebo Test
The data we use allows us to test whether the estimated effect comes from the speculative price
effect or the crop failure effect. To do so, we estimate the impact of being born in a locust affected
area for different birth cohorts around the treatment window.
Figure 7 depicts the estimated impact of being born in locust infested areas by quarter of
birth between years 2003 and 2008, together with the 95% confidence bands of each coefficient.16
The dashed line represents the quarter when the locust plague started in Mali. This figure shows
that children born before the plague (third quarter of 2004), i.e. between the first quarter of 2003
and the second quarter of 2004 both included, have height-for-age Z-scores comparable to control
cohorts. This shows that children already born when the plague hit did not suffer any effect
perceptible in their height-for-age Z-scores. It also validates the hypothesis that the estimated
impact that we documented in previous section is not capturing pre-existing trend differences
between treated and non-treated areas.
Moreover, between the second quarter of year 2004 and the first quarter of 2006, there is
a clear drop in our coefficient of interest, which becomes negative and statistically significant
(estimates for quarter four year 2004 and quarter one and two year 2005 are significant at 90%
confidence level). This corroborates our hypothesis that all the cohorts of children that have been
exposed in utero to the plague suffered substantial health setbacks.
The estimated coefficient turns negative and significant for children born in July, August,
or September 2004, i.e. the first three months of the locust invasion in Mali. According to
the seasonal calendar reported in Figure 6, these children, during the onset of the plague, were
still relying on the previous harvest that has not been affected by locust. Thus, this evidence
16
The 2006 DHS survey data was collected between May and December so we restrict the analysis to
children born before April 2006 to prevent survey timing biases from contaminating the estimated effect.
The oldest cohorts with anthropometric measures from 2012-2013 survey were born in 2008.
26validates the hypothesis that negative impact on their health status was driven by speculations on
the current agricultural campaign, which led to a sharp increase in prices of local food products.17
Figure 7 plots negative coefficients also for children born between September 2004 and March
2006. These groups where relying on harvest of the 2004-2005 season, i.e. the harvest that was
directly damaged by the locust swarms. Therefore, on top of the speculative price effect, these
children were also potentially subject to the supply/income shock due to the failed harvest while
in utero. The negative and significant impact found for these cohorts supports this idea.
Finally, Figure 7 also depicts the estimated coefficients on younger cohorts, born after the
plague ended, namely children born between January and December 2008. Those children where
4 to 5 years old at the time of the survey when they were measured so estimated coefficients
are noisier and more volatile from quarter to quarter. There is however no clear trend and the
estimated impact is oscillating around zero.18 Given that the health status of children born in
the locust affected areas (after the plague ended) is comparable to the health status of children
born in non-affected areas, we can infer that the 2003-2005 plague did not have any perceptible
long-lasting effects. The harvest gathered during the 2005-2006 season seems not to have been
impacted by the damages which took place during the previous season.
17
Children born during the third quarter of 2004 are also exposed to the crop failure effect but only
after birth band we found no effect of the plague after birth (see older cohorts of children in Figure 7.
18
We show in Appendix a similar result in a placebo test where we consider older cohorts of children in
the 2012 wave as not affected by the plague and younger cohorts of children as potentially affected by the
plague.
27Figure 7: Estimated Impact of 2004 Locust Invasion in Mali
Source: SWARMS data base from FAO Desert Locust Information Service and DHS data, Mali waves
2006 and 2012. This figure depicts the estimated coefficient of locust invasion on height-for-age Z-scores
for each quarter-year cohort born in locust invaded areas between January 2003 and December 2008. Each
coefficient is plotted together with its 95% confidence bands. The blue colored coefficients are obtained
using height-for-age Z-scores computed during the 2006 DHS survey, while the red ones are obtained using
height-for-age Z-scores computed during the wave held in 2012. The black dashed vertical line shows the
quarter of the onset of the locust plague in Mali.
6.3 Heterogeneous Effects and Robustness Checks
While overall estimates point towards a substantial health setbacks for exposed children, it is not
necessarily the case for all the sub-groups in our sample. Investigating whether the estimated
28impact is driven by specific sub-groups of population can be useful for understanding the channels
through which this effect is operating. Therefore, we run our main specification (the one that
includes child and family characteristics in Column (3) of Table 3) on several sub-samples. Results
are described in Table 4.
First of all, one important aspect around which the effects found could differ is gender.
Usually, the literature on early childhood development finds a large negative bias against girls
(Dagnelie et al., 2018). We find, instead, a negative impact of the plague on children of both
genders. The estimates for these two sub-samples are documented in columns (1) and (2), which
restricts the sample only to male and female children respectively. The negative impact of
locust invasions on child health is stronger and statistically significant for the sub-sample of
males, whereas for the female population it is only marginally significant (the p-value of the
coefficient equals 0.1). We also estimate in Table A1 (appendix) a simple regression to test
whether the magnitude of the impact is statistically different across gender. For that we run
the main specification with an interaction term for the treatment variable and a female dummy
variable including all the children in the sample. The result shows that the magnitude of the
treatment effect is not statistically different across gender groups.
Another dimension across which results could differ is across place of residence: urban or rural.
We explore this aspect in Columns (3) and (4) of Table 4, which displays results obtained from
sub-samples including rural-located and urban-located households respectively. Results suggest
that the negative effect is present in both sub-samples. The estimated coefficient is larger for
children born in rural area but the difference is not statistically significant. This suggest that the
adverse effect of the plague had a strong market effect and did not just affect the farmers living
in rural areas.
It is well established in the literature that households build up risk coping mechanisms to
insure against an agricultural shock such as the damage caused by a locust plague (Townsend et
29al., 1994; Townsend, 1995). One obvious insurance mechanism is having assets, which households
could use to cope with the shock. Exact data on the value of assets held at the household level
is not available from the DHS data. However, DHS surveys classify households, based on their
ownership of selected assets, in wealth quintiles.19 We define households as poor (rich) if they
belong to the two bottom (top) quintiles. Those in the third quintile are classified as middle
income households. The estimation for each of these groups (shown in Columns (5) to (7))
supports the idea that having assets may have helped households cope with the shock induced by
the plague. In particular, the estimated impact on the poorest households is negative and more
precisely estimated compared to richer groups. There is however no difference in the estimated
magnitudes.
The last exercise of robustness concerns issues related to potential migration. One possible
concern is that children in our sample were measured after the plague took place, and some
of them may have migrated to their new place of residence after the plague which makes it
impossible to attribute them to the right treatment group. Moreover, a subgroup of those that
have migrated across treatment areas might have been positively or negatively selected, leading
to potential biases in the estimates. For instance, richer households may move out of the treated
areas after the plague leading to an upward bias in the estimated coefficient. We use information
on number of years of residence in the locations where each household has been surveyed and we
run regressions restricting the sample to those that lived at the same location for at least 2 years
(Column 8) and those that have always lived there (Column 9). Results are robust in both cases
suggesting that our estimates are not affected by potential migration.20
19
The classification is done with a principal component analysis whose inputs are household ownership
of assets such as televisions and bicycles, together with the materials used for housing construction and
the types of water access and sanitation facilities.
20
Further robustness checks that include a mother fixed effect specification, and changes in the size of
the area considered for treatment are also discussed in appendix (Table A1 and Figure A1).
30Table 4: Robustness: Impact of Locust Plague on Child Health
(1) (2) (3) (4) (5) (6) (7) (8) (9)
Gender Location Wealth Index Years of Residence
Male Female Rural Urban Poor Middle Rich 2+ years Always
Height-age Z-score Height-age Z-score Height-age Z-score Height-age Z-score Height-age Z-score Height-age Z-score Height-age Z-score Height-age Z-score Height-age Z-score
In utero treatment -0.410*** -0.244 -0.390*** -0.181 -0.265** -0.260 -0.237 -0.318*** -0.357***
(0.107) (0.149) (0.114) (0.129) (0.113) (0.183) (0.160) (0.111) (0.127)
Observations 7,195 6,980 10,232 3,943 5,734 2,956 5,485 9,670 5,464
R-squared 0.233 0.256 0.241 0.184 0.253 0.296 0.187 0.234 0.247
Cohort FE YES YES YES YES YES YES YES YES YES
Location FE YES YES YES YES YES YES YES YES YES
Child characteristics YES YES YES YES YES YES YES YES YES
Family characteristics YES YES YES YES YES YES YES YES YES
Dependent variable is HAZ. Full set of controls includes mother’s height, education, gender and age of household head, household wealth index, SPEI index, birth order, time gap between conception and the
previous and following pregnancies. Robust standard errors in parentheses are clustered at enumeration area level. *** p7 Concluding remarks
In this paper we show that in utero exposure to desert locust plagues can lead to substantial
health setbacks early in life. We estimate the causal impact of the 2004 plague that occurred
in Mali on health status of children located in the Malian territories invaded by locust swarms.
Our results suggests that there were both a strong speculative price effect of the locust invasion
that kicked in during the plague itself, and a local crop supply shock that lasted at least until
the next harvest. We also show that the locust invasion did not have any effect after birth.
We find that exposed children have, on average, a Z-score 0.39 points than non-exposed
children. The estimated effects are stronger and/or more precisely estimated for children born in
rural areas and, in general, belonging to poorer households. In contrast with the latest findings
in the literature, we find no strong evidence for a gender imbalance of the effects of this shock in
utero.
This study has relevant implications from a policy perspective. In particular, our results
suggest that it is important to address expectations during pest invasions that affect agricultural
production. It is crucial to put efforts in two main directions: (i) prevent price speculations
and inflation; (ii) provide safety nets to the most vulnerable households in order to dampen the
consequences of these shocks on young children.
With the alarming climate change prospects, one can expect more frequent extreme weather
conditions in the breeding areas of desert locust and this could lead potentially to more plagues
in the future. Preparing to limit the consequences of such locust invasions is thus necessary for
policy makers that operate in the invasion areas of desert locust.
32Appendix
A.1 Changing the Treatment Definition
In this Appendix we explore how our main results change, by changing the treatment definition.
Specifically, we run several specification of our baseline model described in Equation 1 (Section
5), where in each iteration we change the definition of treatment group. In particular, in the first
specification an area is defined as locust affected if it is located at most 20 km from at least one
swarm event during the 2004 plague. In the subsequent specifications we add progressively 10
km to the threshold that defines what is a treatment area, up to 120 km.
Figure A1 plots the estimates of γ for each performed specification, together with their 95%
confidence bands. It can be noticed that the adverse effect of locust invasions on child health
is both negative and statistically significant for thresholds up to 40 km. After that, the effects
approaches zero and it looses significance. This is consistent with the idea that locusts invasions
are events that have adverse local effects.
33Figure A1: Local Impact of Locust Plague on Child Health
Source: SWARMS data base from FAO Desert Locust Information Service and DHS data, Mali waves
2006 and 2012.
A.2 Additional Analysis
In this Appendix we perform additional robustness checks. In particular, we perform alternative
specifications of the model described in Equation 1. Column (1) performs a placebo test using
data from the 2012 DHS Wave. Treated children are those born in treated areas after 2011.
We can see that there is no effect on these cohorts. In Column (2) we show that, weighting the
data using DHS Sample Weights, the treatment effect is still negative and statistically significant.
Column (3) uses an alternative definition of locust affected areas. In this case, areas are Malian
Communes, i.e. third level administrative units, where at least one swarm event occurred during
34the 2004 plague. The effects is negative and statistically significant, but lower than the one
obtained in the baseline specification. This result is consistent with the evidence presented
in Appendix A.1, according to which the severity of the effects of locust invasions decreases
progressively if we consider as treated a wider area. In Column (3) we estimate a model to
test whether the magnitude of the impact of locust invasions is statistically different across
gender. To do so, we include an interaction term for the treatment variable and a female dummy
variable including all the children in the sample. The result shows that the magnitude of the
treatment effect is not statistically different across gender groups. In Column (4) we perform the
corresponding exercise to test if the magnitude of the impact of the plague differs significantly
across household location. We include an interaction term between the treatment variable and
a dummy that equals one if the household is located in rural areas. The results show that
the adverse effects of locust invasions are not statistically different between rural and urban
households. The last specification, whose results are reported in Column (5), controls for mother
fixed-effects. The effects remains negative and statistically significant.
A.3 Climate Data
In order to account for potential weather-related omitted variables in our analysis, we collect
data from the Standardized Precipitation-Evapotranspiration Index (SPEI, see Vicente-Serrano
et al., 2010). The SPEI is a multi scalar index that jointly maps rainfall, temperature and
potential evaporation into a standardized index of drought. Importantly, it is measured in units
of standard deviations from the long term average (1901 – 2015 in version 2.5), and has zero
average by construction. It is available in a 0.5 x 0.5 grid, which is matched to the household
coordinates available from the DHS surveys.
We want to control for exposure of individual pregnancies to food supply shocks due to
weather conditions in our empirical specification. To do so we need to determine how weather
35You can also read